
Abstract
Introduction
High-altitude cerebral edema (HACE) is considered to be the end-stage of acute mountain sickness (AMS); however, its pathophysiological mechanism remains unknown. Increasing evidences support that inflammation is an important risk factor for the occurrence of HACE. Including our published papers, previous studies demonstrated that the levels of IL-6, IL-1β, and TNF-α in both serum and hippocampus were increased in the mouse HACE model induced by LPS stimulation combined with hypobaric hypoxia exposure; however, the expression profile of other cytokines and chemokines remains unknown.
Objective
This study was to analyze the expression profile of cytokines and chemokines in the HACE model.
Methods
The mouse HACE model was established by LPS stimulation combined with hypobaric hypoxia exposure (LH). The mice were divided into the normoxic group, LH-6 h group, LH-1 d group, and LH-7 d group. Brain water content (BWC) was determined using the wet/dry weight ratio. The levels of 30 cytokines and chemokines in the serum and hippocampal tissue were detected using LiquiChip. The mRNA expression of cytokines and chemokines in hippocampal tissue were determined by q-PCR.
Results
In the current study, we found that the brain water content was increased after the combinational treatment of LPS and hypobaric hypoxia. The results of LiquiChip showed that, in the serum and hippocampal tissue, most factors in all 30 cytokines and chemokines were dramatically upregulated at 6 h, and then declined at the 1st d and 7th d. Among these factors, G-CSF, M-CSF, MCP-1, KC, MIG, Eotaxin, Rantes, IP10, IL-6, MIP-2, and MIP-1β were all increased in both serum and hippocampal tissue at 6 h. In addition, the results of q-PCR showed the mRNA levels of G-CSF, MCP-1, KC, MIG, Eotaxin, Rantes, IP10, IL-6, MIP-2, and MIP-1β in hippocampal tissue were dramatically upregulated at 6 h.
Conclusion
This study showed that the dynamic expression profile of 30 cytokines and chemokines in a mouse HACE model induced by LPS plus hypobaric hypoxia. The levels of G-CSF, MCP-1, KC, MIG, Eotaxin, Rantes, IP10, IL-6, MIP-2, and MIP-1β in both serum and hippocampus were significantly increased at 6 h, which may be involved in the occurrence and development of HACE.
Introduction
Hypobaric hypoxia, the most critical feature of a high-altitude environment, produces substantial challenges to the physical and mental health of people. Individuals who rapidly ascend to the plateau (above the high altitude 2500 m) and are not adapted to the high-altitude environment are vulnerable to acute altitude sickness (AMS). The symptoms of AMS are dizziness, headache, insomnia, anorexia, nausea, and vomiting. 1 However, if it is not treated in a timely manner, AMS may develop into severe high-altitude cerebral edema (HACE), which is often characterized by ataxia, fatigue, and altered mental status. 2 HACE is considered to be the end-stage of AMS in terms of pathophysiology, 3 however, the mechanisms underlying HACE remain unknown.
Based on studies with human volunteers and animal models, increasing evidence supports that the transcriptional response to hypoxia and inflammation or their crosstalk plays important role in the occurrence of altitude sickness.4,5 Increased inflammation usually occurs when exposed to high altitude. For example, it has been reported that the levels of serum interleukin-6 (IL-6), interleukin-6 receptor, and C-reactive protein were increased when healthy volunteers lived at altitudes above 3400 m for 3 nights. 6 Boos et al. also found that the plasma levels of endothelin-1 (ET-1), IL-6, and interleukin-17a (IL-17a) were significantly increased at high altitudes of 3833 m, 4450 m, and 5129 m compared with volunteers at sea level. 7 A study with human volunteers ascending to high altitude (3860 m, 2 days) also showed that compared with the non-AMS group, the levels of plasma IL-6, interleukin-1 beta (IL-1β), and tumor necrosis factor-alpha (TNF-α) were evidently increased in the AMS group, which positively correlated with AMS. 8 In addition, pre-existing inflammation plus severe short hypoxia elicited cerebral edema in the mouse model. For example, Song et al. found that both infection and hypoxia can produce neuroinflammation, and pre-existing systemic inflammation plus hypoxia exposure elicits HACE. 8 Additionally, our previous study also demonstrated that lipopolysaccharide (LPS)-induced systemic inflammatory responses rapidly aggravated brain edema upon acute hypobaric hypoxia exposure and led to cognitive and motor dysfunction, and at the same time, LPS plus hypobaric hypoxia treatment induces a burst of cytokines in the serum and hippocampus. 9 Therefore, the mouse model treated with LPS combined with hypobaric hypoxia exposure is a reliable, repeatable, and useful model to study the pathophysiological mechanisms of HACE. Although a few cytokines, such as IL-6, IL-1β, and TNF-α, have been reported previously, the expression profile of cytokines and chemokines is still unclear.
Analysis of cytokines and chemokines has become increasingly efficient due to advances in related technologies. LiquiChip was performed in one batch analyzing a group of cytokines, which allowed analysis of many cytokines and chemokines simultaneously using a small volume of serum samples or tissue lysate. In the present study, based on the mouse HACE model, the expression profile of cytokines and chemokines was determined with the LiquiChip technique.
Materials and methods
Animals
Adult (8 weeks) male C57BL/6J mice were purchased from the SiPeiFu Biotechnology Company (Beijing, China). The mice were maintained in the animal facility and were housed under standard laboratory conditions (12/12-h light/dark cycle, 22 ± 2°C, ad libitum access to food and water). All animal protocols were performed in compliance with the NIH Guide for the Care and Use of Laboratory Animals and approved by the Institutional Animal Care and Use Committee of Beijing Institute of Basic Medical Sciences.
Mice HACE model
The mouse HACE model was established as previously described. 9 The mice were intraperitoneally injected with LPS (0.5 mg/kg, Escherichia coli 0111: B4; Sigma-Aldrich, USA) and exposed to hypobaric hypoxia in a chamber (DYC-DWI, Guizhou Fenglei, China) equal to a height of 6000 m (369.4 mmHg, equal to 10.16% O2) for 6 h, 1 day, and 7 days. The normoxic mice were just intraperitoneally injected with an equal volume of saline. The mice were randomly divided into four groups (LH-6 h, LH-1 d, LH-7 days, and normoxic), and 5-7 mice in each group. We defined the mice in the group that was injected with LPS and exposed to hypobaric hypoxia as LH. The sample size/power was according to the calculation reported previously. 10
Sample collection
For blood collection and serum preparation, mice were anesthetized with 1% sodium pentobarbital and euthanized to collect blood by retroorbital bleeding. Blood samples were clotted for 2 h at room temperature and then centrifuged (3500 r/min, 4°C) for 15 min. The serum samples were aliquoted and stored at -80°C.
For hippocampal tissue collection and tissue lysis, mice were anesthetized, and the hippocampus was isolated. The tissue was lysed with ice-cold RIPA lysis buffer (C1053, Applygen, China) supplemented with protease inhibitor cocktail and then ground three times (1 min/wash) with a KZ-II high-throughput mill (Servicebio, China). The homogenate was centrifuged (13,000 r/min, 4°C) for 20 min, and the supernatant was aliquoted and stored at -80°C. Protein concentration was determined by the bicinchoninic acid (BCA) kit (Applygen, China), and each sample was diluted to equal concentration before LiquiChip analysis.
Analysis of LiquiChip
LiquiChip, also known as the flexible multianalytic profiling (xMAP) technique, is a platform developed by Luminex. 11 LiquiChip analysis (MCYTMAG-70K, Merck Inc.) allowed quantification of the cytokine and chemokine concentrations in both serum and hippocampal tissue. In our research, the concentrations of cytokines and chemokines in serum and hippocampal tissue, including G-CSF, Eotaxin (CCL11), GM-CSF, IFN-γ, IL-1α, IL-1β, IL-2, IL-3, IL-4, IL-5, IL-6, IL-7, IL-9, IL-10, IL-12 (p40), IL-12 (p70), IL-13, IL-15, IL-17 (CTLA8), LIX, IP10 (CXCL10), KC (CXCL1), MCP-1 (CCL2), MIP-1α (CCL3), MIP-1β (CCL4), M-CSF, MIP-2 (CXCL2), MIG (CXCL9), Rantes (CCL5), and TNF-α, were determined with the LiquiChip technique following the manufacturer’s instructions. Briefly, serum samples and tissue lysates of the hippocampus were incubated with antibodies conjugated to microspheres for 2 h at room temperature. Then, the samples were incubated with biotinylated antibodies for 1 h, followed by incubation with streptavidin-phycoerythrin fluorescent conjugate (SA-PE) for 30 min. The Luminex 200TM instrument (Luminex Corp.) detected the intensity of the signal for each microsphere added to the protein samples. The concentration of each analyte was calculated against standard curve regression using Luminex xPONENT software. Values below or above the limit of detection were replaced with the respective limit of detection (highest or lowest standard concentration).
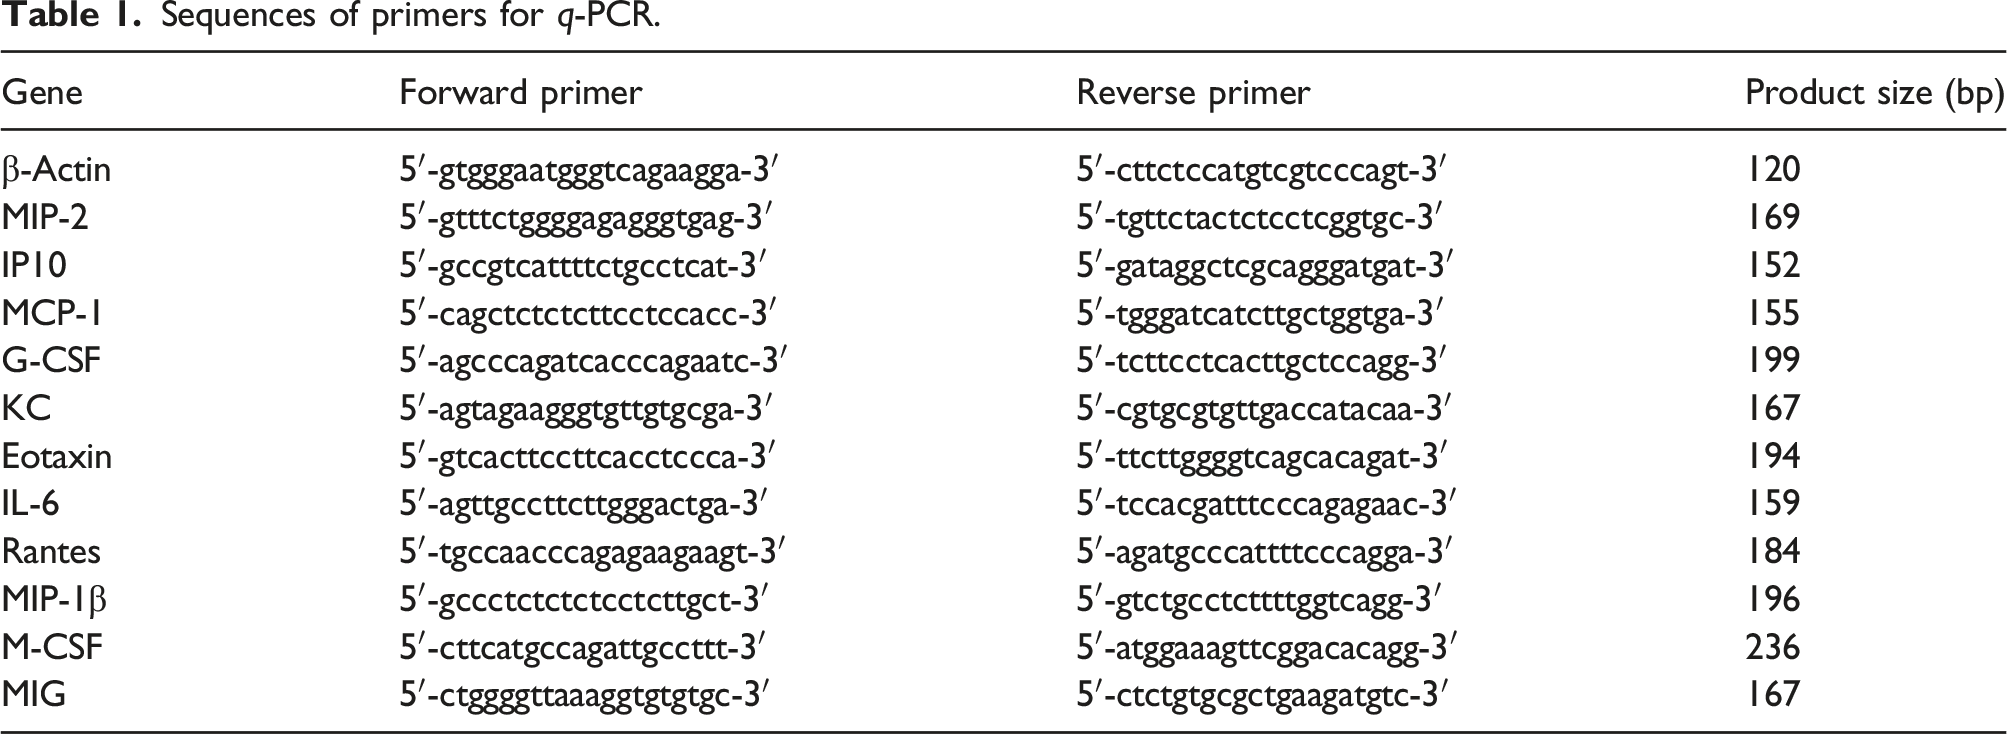
Quantitative real-time PCR (q-PCR)
Sequences of primers for q-PCR.
Determination of brain water content
Mice were anesthetized, and the brain was immediately removed. Wet weight was measured. Then, the brain was placed in a thermostatic and baked at 120°C for 48 h until a constant weight was obtained. The dried brain was re-weighed. The percentage of BWC was calculated as follows: BWC (%) = [(wet weight-dry weight)/wet weight] × 100%.
Statistical analysis
GraphPad 8.0 Prism software was used for data analyses and graph production. The data are shown as the group mean values with standard errors of the means (SEM). Shapiro-Wilk test was used for normal distribution. Student’s t test or Mann-Whitney test was used for two-group comparisons. Groups above two were compared using one-way analysis of variance (ANOVA) or Kruskal-Wallis test followed by Dunn’s test. For all analyses, *p < .05 and **p < .01 were considered statistically significant.
Result
Measurement of brain water content
The mice were treated as shown Figure 1(a). After the treatment, the change of brain water content (BWC) was measured as a sign of cerebral edema. As shown in Figure 1(b), compared with the normoxic group, the percentage of BWC was significantly increased in the combinational treatment of LPS and hypobaric hypoxia group at 6 h and 24 h. Change of brain water content (BWC). (a) C57BL/6J mice were intraperitoneally injected with LPS (0.5 mg/kg) combined with hypobaric hypoxia exposure (LH) for 6 h (hour), 1 d (day). The normoxic (Nor) mice were just intraperitoneally injected with an equal volume of saline. After the treatment, the serum and hippocampus tissue were collected. (b) BWC was determined using the wet/dry weight ratio in mice (n = 7 in each group). The data are presented as the mean ± SEM. **p < .01 compared with the normoxic group.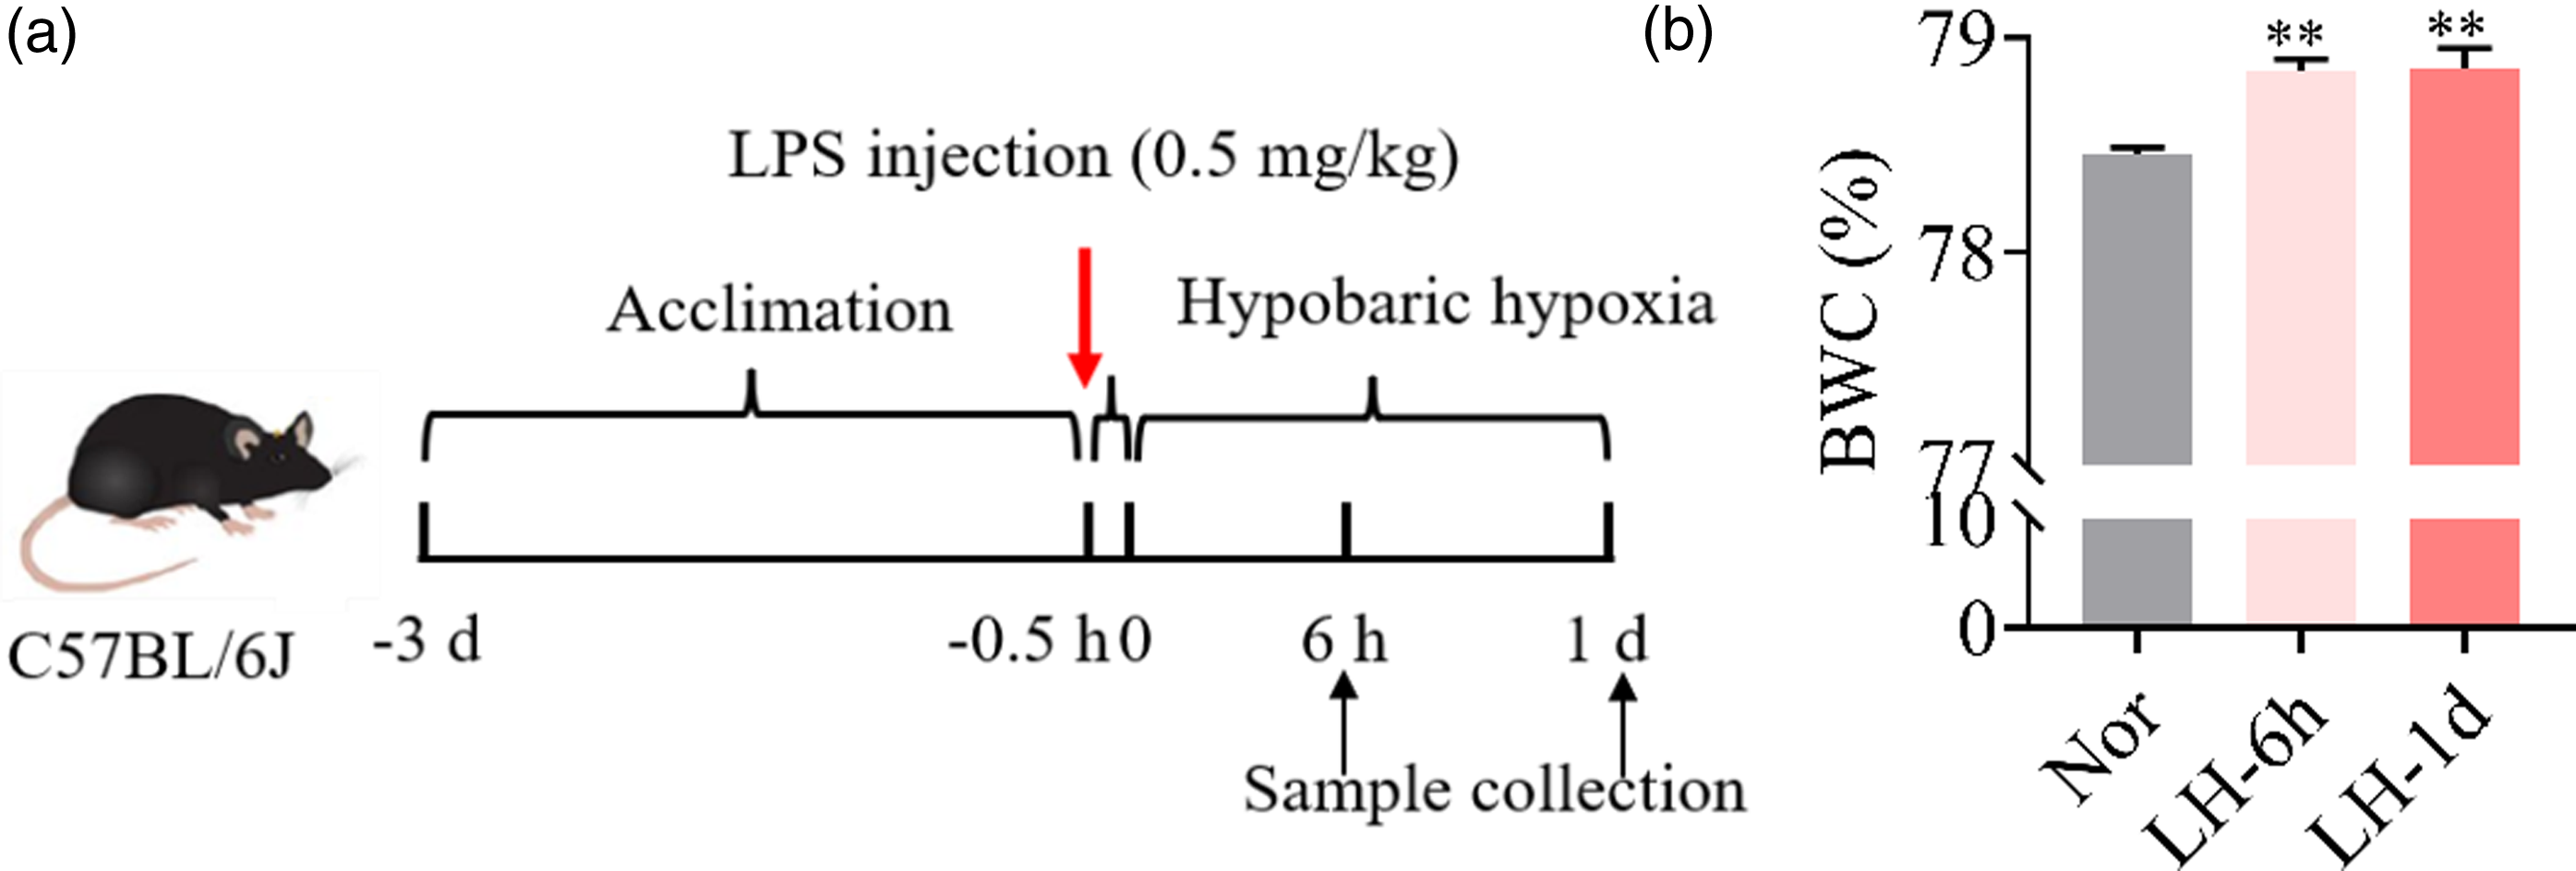
Kinetics of serum cytokines and chemokines in the mouse HACE model
The serum levels of cytokines and chemokines first detected in the mice model treated with LPS injection plus hypobaric hypoxia exposure at 6 h, 1 day, and 7 days (Figure 2). As shown in Figure 2(a), most of the cytokines responded quickly to the combinational treatment of LPS and hypobaric hypoxia, reached a high point at 6 h, and then declined with the treatment. Among these cytokines, G-CSF, IL-6, and IL-10 were notably sensitive to the combinational treatment, and their serum levels were at least 1000 pg/mL. Similarly, most of the chemokines also responded quickly to the combinational treatment, reached a high point at 6 h, and then declined with the combinational treatment (Figure 2(b)). Among these chemokines, MCP-1, KC, MIG, Eotaxin, IP10, and MIP-1β were relatively sensitive to the combinational treatment, and their serum levels were at least 5000 pg/mL. These results indicated that the concentrations of most cytokines and chemokines were obviously increased in a short time and then declined with the prolongation of the combinational treatment in the mouse HACE model. Kinetics of cytokines and chemokines in the serum. The concentrations of 20 cytokines (a) and 10 chemokines (b) in the serum measured by the LiquiChip technique. n = 5 for Nor, LH-6 h and LH-1 d; n = 6 for LH-7 d. The data are presented as the mean ± SEM. *p < .05 **p < .01 compared with the normoxic group.
Kinetics of hippocampal cytokines and chemokines in the mouse HACE model
As shown in Figure 3(a), most of the cytokines responded quickly to the combinational treatment of LPS and hypobaric hypoxia exposure, peaked at 6 h, and then gradually decreased to baseline levels with the combinational treatment. Among these cytokines, G-CSF and IL-6 were obviously sensitive to combinational treatment, and their levels in the hippocampus were at least 200 pg/mL. Likewise, most of the chemokines also responded quickly to the combinational treatment, peaking at 6 h, and subsequently declined with the combinational treatment (Figure 3(b)). Among these chemokines, IP10, KC, MIP-1, and MCP-1 were relatively sensitive to the combinational treatment, and their levels in the hippocampus were at least 500 pg/mL. These results indicated that cytokines and chemokines in the hippocampus were activated in the mouse HACE model. Kinetics of cytokines and chemokines in the hippocampus. The concentrations of 20 cytokines (a) and 10 chemokines (b) in the hippocampus measured by the LiquiChip technique. n = 5 for Nor, LH-6 h and LH-1 d; n = 6 for LH-7 d. The data are presented as the mean ± SEM. **p < .01 compared with the normoxic group.
Pattern of cytokines and chemokines after 6 h of the treatment
As described above, the concentrations of cytokines and chemokines in both serum and hippocampal tissue peaked at 6 h, and we then compared their fold changes in detail at this time point (Figure 4). Interestingly, among all of the cytokines and chemokines, G-CSF, M-CSF, MCP-1, KC, MIG, Eotaxin, Rantes, IP10, IL-6, MIP-2, and MIP-1β were dramatically increased after the treatment, and their fold changes were at least 1.5-fold. This implied that these eleven cytokines and chemokines were sensitive to the treatment of LPS plus hypobaric hypoxia exposure. Fold changes in the indicated cytokines and chemokines in both the serum and hippocampus. Results are presented as the ratio of cytokine and chemokine levels from the LH-6 h group compared with the Nor group in serum (a) and hippocampus (b). The data is presented as the mean ± SEM. *p < .05 **p < .01 compared with the normoxic group (n = 5 per group).
Changes of q-PCR confirmation
As reported previously, neuroinflammation is a contributing factor to the progression of HACE, and the changes in cytokines and chemokines in hippocampal tissue were further tested with q-PCR. As shown in Figure 5, consistently, the mRNA levels of IL-6, MIP-2, IP10, MCP-1, G-CSF, KC, Eotaxin, Rantes, MIP-1β, and MIG were evidently increased after LPS stimulation combined with hypobaric hypoxia exposure for 6 h. These results indicated that treatment with LPS plus hypobaric hypoxia induced the expression of a series of cytokines and chemokines. The mRNA levels of cytokines and chemokines in the hippocampus from HACE mice induced by the combinational treatment of LPS and hypobaric hypoxia exposure for 6 h. The mRNA levels of cytokines and chemokines were determined by q-PCR. The data is presented as the mean ± SEM. *p < .05 **p < .01, compared with the normoxic group (n = 6 per group).
Discussion
To better understand the inflammatory response during HACE, the expression profiles of cytokines and chemokines at different time points were investigated. Here, we found that the majority of the cytokines and chemokines in both serum and hippocampal tissue were significantly increased at 6 h. In particular, the concentrations of G-CSF, MCP-1, KC, MIG, Eotaxin, Rantes, IP10, IL-6, MIP-2, and MIP-1β were significantly increased in both serum and hippocampus. These results indicated that the combination treatment of LPS stimulation and hypobaric hypoxia exposure had a comprehensive effect on the inflammatory response.
Numerous studies have found that the key event of HACE is disruption of the blood-brain barrier (BBB).9,12,13 Inflammation is closely related to the occurrence of cerebral edema because inflammatory factors (ET-1, TNF-α, and IL-1β) increase the permeability of the BBB by acting on angiotropic endothelial cells in brain tissue. 14 For example, inflammation aggravates damage to the blood-brain barrier, oxidative stress, and microvascular failure in stroke. 15 Under hypobaric conditions, hypoxia is known to directly impair BBB integrity and aggravate the inflammatory response. Therefore, when the animal was treated with LPS combined with hypobaric hypoxia exposure, the BBB structure and function probably received a “double hit”, which decreased the oxygen supply and increased the inflammatory response. In support of this proposal, inflammation also increased the occurrence of cerebral edema under stroke and trauma conditions, 16 in which hypoxia was involved. During the investigation of the pathological mechanism of HACE based on populations and animal models, the contribution of common inflammatory factors, such as IL-6, TNF-α, and IL-1β, was the focus. However, the patterns of other cytokines and chemokines are not very known. Therefore, we analyzed the expression profile of cytokines and chemokines in the serum and hippocampal tissue based on the HACE model. We found that among the panel of 30 cytokines and chemokines detected, 22 factors were significantly upregulated in serum, whereas 11 factors were significantly upregulated in hippocampal tissue. These results indicated that the combinational treatment of LPS and hypobaric hypoxia triggered a comprehensive inflammatory response.
Previous studies also found that there was a trend of increasing and decreasing about the cytokines production after LPS stimulation. For example, Liu et al. 17 found that after LPS stimulation, the levels of cytokines and chemokines (such as IL-6, KC, MCP-1, and IP10) in blood and organs from mice were rapidly increased, peaked within 1 h to 6 h, and declined to basal levels within 12 h to 24 h. Semple et al. 18 also found that in closed head injury, MCP-1 increased significantly at 4 h, peaked at 4-12 h, and returned to normal at 24 h. Taken together, the concentration of most cytokines and chemokines were significantly increased at 6 h and decreased within 1-7 days in serum and hippocampal tissue from HACE mice. The mechanisms of cytokines and chemokines on HACE may be attributed by increased circulating cytokines and chemokines, which resulted in the production of pro-inflammatory mediators such as nitric oxide (NO) or prostaglandins. The latter mediators then bind to brain endothelial cells, and increased the permeability of the blood-brain barrier. Therefore, cytokines, chemokines, and the peripheral immune cells could enter the brain, and then activated microglia that can release pro-inflammatory factors to induce neuroinflammation. At the same time, the above change may also result in swelling of astrocytes and cerebral edema.8,19 Moreover, some chemokines, such as MCP-1, can induce migration of leukocytes to areas of brain injury or infection, and exacerbate inflammatory response, 20 which may further exacerbate cerebral edema and lead to cognitive impairment.
In this study, we found that cytokines and cytokines in the hippocampus responded quickly to stimulation and then declined over time. However, the source of these cytokine and chemokines in the brain needs further investigation. Astrocytes and microglia are the main inflammatory cells in the brain. Upon stimulation, these cells release many types of inflammatory cytokines and chemokines and play an important role in neuroinflammation and its related diseases.21–23 Recently, other sources of cytokines or chemokines were reported. For example, Duan et al. found that during acute infection, PDGFRβ mural cells of blood vessels secrete the chemokine CCL2, resulting in neuronal excitability. 24 Additionally, it was also reported that some inflammatory cytokines (such as IL-1β and TNF-α) in the peripheral circulation could cross the blood-brain barrier through active transport and aggravate the inflammatory response in the brain. 25 Circulating cytokines and chemokines also bind to brain endothelial cells to induce the production of proinflammatory cytokines. 26 Therefore, systemic infection could trigger neuroinflammation through various approaches.
Conclusion
The present study shows that the combination treatment of LPS stimulation and hypobaric hypoxia exposure could trigger response of multiple cytokines and chemokines in both the serum and hippocampus response at an early stage. These results imply that additional cytokines and chemokines may be involved in the occurrence and development of HACE.
Limitations
The present study also has several limitations. One is that the source of the cytokines and chemokines in hippocampus. Microglia and astrocytes are immunology cells. Previous study also reported that the neurovascular unit (NVU) is involved in the production of cytokine and then impair neuron function. 24 It is interesting to investigate which of the cell type is responsible of the pro-inflammation factors or cytokines production. Second, it is also interesting to investigate the inflammation response profiles in other species, like commonly used rat model, even in human serum sample if possible, and these results would make our findings more solid and be with more clinic significance.
Footnotes
Acknowledgments
We are grateful to the grants from National Natural Science Foundation of China for Scientific Research.
Author contributions
Zibi Shi: Investigation, sample collection, visualization, formal analysis, and writing - original draft. Xiufang Jiang: Sample collection. Yanan Geng, Xiangpei Yue, Jiayue Gao, and Xiang Cheng: Investigation. Ming Zhao: Visualization, writing - review and editing, and project administration. Lingling Zhu: Project administration, writing - review and editing, and funding acquisition.
Declaration of conflicting interests
The author(s) declared no potential conflicts of interest with respect to the research, authorship, and/or publication of this article.
Funding
The author(s) disclosed receipt of the following financial support for the research, authorship, and/or publication of this article: This work was supported by the grants from National Natural Science Foundation of China [81930054].