
Abstract
Airway epithelium cells are the first line of defense against airborne allergens. When cultured, epithelial cells can be exposed to various allergens, providing an ideal model to investigate allergic disorders. This study sought to characterize the profile of long noncoding (lnc) RNAs, which can regulate gene expression and exert functions in diverse cellular processes, in airway epithelial cells exposed to house dust mite allergens. NCI-H292 cells were exposed to house dust mite extract for 24 h. RNA expression was profiled in exposed and unexposed cells. There were 270 lncRNAs that were differentially expressed (fold change ≥ 2, P < 0.05) in NCI-H292 cells after stimulation with Dermatophagoides farinae (house dust mite) extracts. Furthermore, 119 lncRNAs and 22 messenger RNAs were co-expressed. Gene Ontology analysis showed that these under-regulated and up-regulated lncRNAs were associated with biological process, cellular component, and molecular function. After bioinformatic analysis of significantly regulated signaling pathways, we found these lncRNAs may target 16 gene pathways, including glycolysis, axon guidance, ErbB signaling, and mitogen-activated protein kinases (MAPK) signaling. The identification of differentially regulated lncRNAs in NCI-H292 cells after stimulation with Dermatophagoides farinae extracts, as well as their target gene pathways, can provide insight to the etiology and pathogenesis of allergy.
Introduction
Asthma is a complex lung disorder provoked by environmental stimuli, including allergens. Since airborne allergens disturb the airway epithelium, epithelial abnormalities, such as epithelial damage and basement membrane thickening, are detectable before clinical symptoms of asthma. 1 Cultured airway epithelial cells provide a tractable model to asthma pathology. For example, NCI-H292 cells (squamous cell carcinoma) exposed to the major allergen Phl p 1 purified from an extract of Timothy grass pollen extract (GPE) exhibit different gene expression compared to cells exposed to complete GPE. 2 Similarly, in response to house dust mite allergen—one of the most common causes of allergic asthma—NCI-H292 cells exhibit a greater number of differentially expressed genes than either healthy or allergic epithelium. 3 While some of the expression changes may derive from the instability of a cultured cancer cell line, expression differences were also noted between stimulated and unstimulated cells. 3 Thus, cultured epithelial cells exposed to various allergens remain useful as a model for investigating allergy to better understand the genetic contributions to the disease.
Long noncoding RNAs (lncRNAs) are non-protein-coding RNA transcripts that exert transcriptional and post-transcriptional regulation on messenger RNAs (mRNAs) and microRNAs. 4 Abnormal lncRNA expression can cause cell dysfunction and promote disease progression by dysregulating their targets.5–7 In a study of mRNA and noncoding RNA expression in circulating CD8+ T cells in patients with severe asthma, CD8+ T-cell function appeared to be regulated by changes in the expression of multiple species of lncRNA. 8 However, little is known about the role of lncRNA in asthma. To determine the contribution of lncRNAs to asthma pathology, here NCI-H292 cells were exposed to an extract from house dust mites. House dust mites are a major source of allergic disorders, such as allergic asthma, chronic rhinitis, atopic dermatitis, and atopic eczema. The most important house dust mites are Dermatophagoides pteronyssinus worldwide, D. farinae in drier areas, and Blomia tropicalis in subtropical and tropical regions. 9 D. farinae extracts were used here given their important contribution to allergic asthma.
Materials and methods
Cell culture
NCI-H292 human airway epithelial cells (Cell Bank, Shanghai Institute for Biological Science, Chinese Academy of Science, Shanghai, China) were cultured in Roswell Park Memorial Institute (RPMI) 1640 medium (Invitrogen, Breda, the Netherlands) supplemented with 1.25 mM of L-glutamine, 100 U/mL of penicillin, 100 µg/mL of streptomycin, and 10% (v/v) of fetal bovine serum (HyClone, Logan, UT, USA). Cells were grown in fully humidified air containing 5% CO2 at 37°C and were subcultured weekly, as was done in a previous study. 3
Induction experiment
Induction was performed in accordance with a previous report in which the authors found that a 24-h exposure to D. farinae extract evoked an inflammatory cytokine response. 3 Cells were cultured for 2 weeks, until reaching 80% confluence. Cells were incubated with Hanks’ balanced salt solution (HBSS) for 24 h, then culture medium was removed. D. farinae extract diluted in HBSS (2 µg/mL) or HBSS alone (control condition) was applied to cells for 24 h. Subsequently, cells were harvested by centrifugation and used for RNA extraction. Each treatment was performed in triplicate.
Dermatophagoides farinae extract
Dermatophagoides farinae extract was produced by Greer Laboratories (Lenoir, NC, USA) as a lyophilized powder. It was dissolved in phosphate buffer saline (PBS), and then dialyzed against PBS and diluted to a stock concentration of 8 µg/mL.
RNA extraction and purification
Total RNA was isolated using TRIzol Reagent (Life Technologies, Carlsbad, CA, USA) following the manufacturer’s instructions. Samples were checked for integrity using an Agilent Bioanalyzer 2100 (Agilent, Santa Clara, CA, USA) and an RNA Integrity Number with cut-off > 7.0. Total RNA was further purified by RNeasy micro kit (Qiagen GmbH, Hilden, Germany) and RNase-Free DNase Set (Qiagen GmbH).
RNA amplification and labeling
Total RNA was amplified and labeled by Low Input Quick Amp Labeling Kit, One-color (Agilent), following the manufacturer’s instructions. Labeled complimentary RNA (cRNA) were purified by RNeasy mini kit (Qiagen GmbH).
Array hybridization
lncRNAs were analyzed using Agilent’s human lncRNA 4 × 180 K array (design ID: 045142), which contains 175,906 probes with length of 60 nt each. The probes cover more than 41,053 lncRNAs from NCBI RefSeq (7055), NCBI other (3436), UCSC (2340), ensemble (3675), Homolog (1110), LNCRNA-DB (56), ncRNA-SCAN (1181), Agilent-G3 (13,740), Agilent Other (1828), and other Database (6632), as well as 29,417 mRNAs from SurePrint G3 Human Gene (27,958 mRNA) and other. For the array, each transcript is represented using 1–5 probes.
Each slide was hybridized with 1.65-µg Cy3-labeled cRNA using a Gene Expression Hybridization Kit (Agilent) and a hybridization oven (Agilent) according to the manufacturer’s instructions. After a 17-h hybridization, slides were washed in staining dishes (Thermo Shandon, Waltham, MA, USA) with Gene Expression Wash Buffer Kit (Agilent), following the manufacturer’s instructions.
Data acquisition
Microarrays were scanned using an Agilent Microarray Scanner (Agilent) with default settings of dye channel green, scan resolution = 3 µm, 20 bit. Scanned images were imported as TIFFs into Feature Extraction software 10.7 (Agilent). Raw data were normalized by a quantile normalization and the robust multichip average (RMA) algorithm in the Gene Spring Software 11.0 (Agilent). Probe-level files and mRNA-level files were generated after normalization. Differentially expressed lncRNAs and mRNAs were identified through fold-change filtering. Data have been submitted to the Gene Expression Omnibus (GEO) database.
Gene function analysis
The predicted target genes were input into the Database for Annotation, Visualization and Integrated Discovery (DAVID; http://david.abcc.ncifcrf.gov/) for Gene Ontology (GO) analysis of the molecular functions. Additionally, KEGG (Kyoto Encyclopedia of Genes and Genomes) database (http://www.genome.ad.jp/kegg/) and BioCarta (http://www.biocarta.com) were used to analyze the target genes and their potential functions in predicted pathways. The recommended P value cut-off was 0.05.
Quantitative real-time polymerase chain reaction
Total RNA was extracted using TRIzol Reagent following the manufacturer’s instructions and checked for RNA integrity. Qualified total RNA was further purified by RNeasy micro kit and RNase-Free DNase Set and then reverse-transcribed using iScript cDNA synthesis kit (Bio-Rad, Hercules, CA, USA) in accordance with the manufacturer’s instructions. lncRNA expression in cells was measured by quantitative polymerase chain reaction (qPCR) using ABI Power SYBR Green PCR Master Mix (ABI, Foster City, CA, USA) on a 7900HT Sequence Detection System (ABI).
Eight lncRNAs that were significantly up-regulated according to microarray analysis were evaluated by real-time polymerase chain reaction (RT-PCR). The first strand complementary DNA (cDNA) was synthesized in a total reaction volume of 20 µL, including 0.5 µg total RNA, 4 µL reaction mix (5×), 1 µL iScript Reverse transcriptase, and 14.5 µL H2O. RT reaction was performed for 5 min at 25°C, 30 min at 42°C, 5 min at 30°C, denaturation for 5 min at 85°C, and held at 4°C. Subsequently, the SYBR Green qPCR was performed in a total reaction volume of 10 µL, including 5 ng of the first cDNA strand template, 5-µL 2 × SYBR Green PCR buffer, 0.5 µL forward primer (10 µmol), 0.5 µL reverse primer (10 µmol), and double-distilled water. The reaction was performed as follows: 50°C for 2 min; an initial denaturation step of 95°C for 10 min; 40 cycles of 95°C (15 s) and 60°C (1 min); and a final extension step at 72 ºC for 5 min. All experiments were done in triplicate. Glyceraldehyde 3-phosphate dehydrogenase (GAPDH) was used as an internal control. The primers used in this study are listed in Supplemental Table 1. For quantitative results, the expression of each lncRNA was represented as a fold change using the 2−∆∆Ct method.
Statistical analyses
Cell samples were processed in triplicate, and all data are expressed as mean ± standard deviation. Student’s t-test was used to compare two variables of microarray data. Expression differences were analyzed by fold change, and a difference with P < 0.01 was considered statistically significant. The false discovery rate was also calculated to correct the P value. Furthermore, a differential expression of each lncRNA or mRNA in NCI-H292 cells compared before and after stimulation with D. farinae extracts was analyzed using Student’s t-test with SPSS (Version 17.0 SPSS, Chicago, IL, USA). P < 0.05 was considered significant.
Results
Differentially expressed lncRNAs in NCI-H292 cells after stimulation with Dermatophagoides farinae extracts
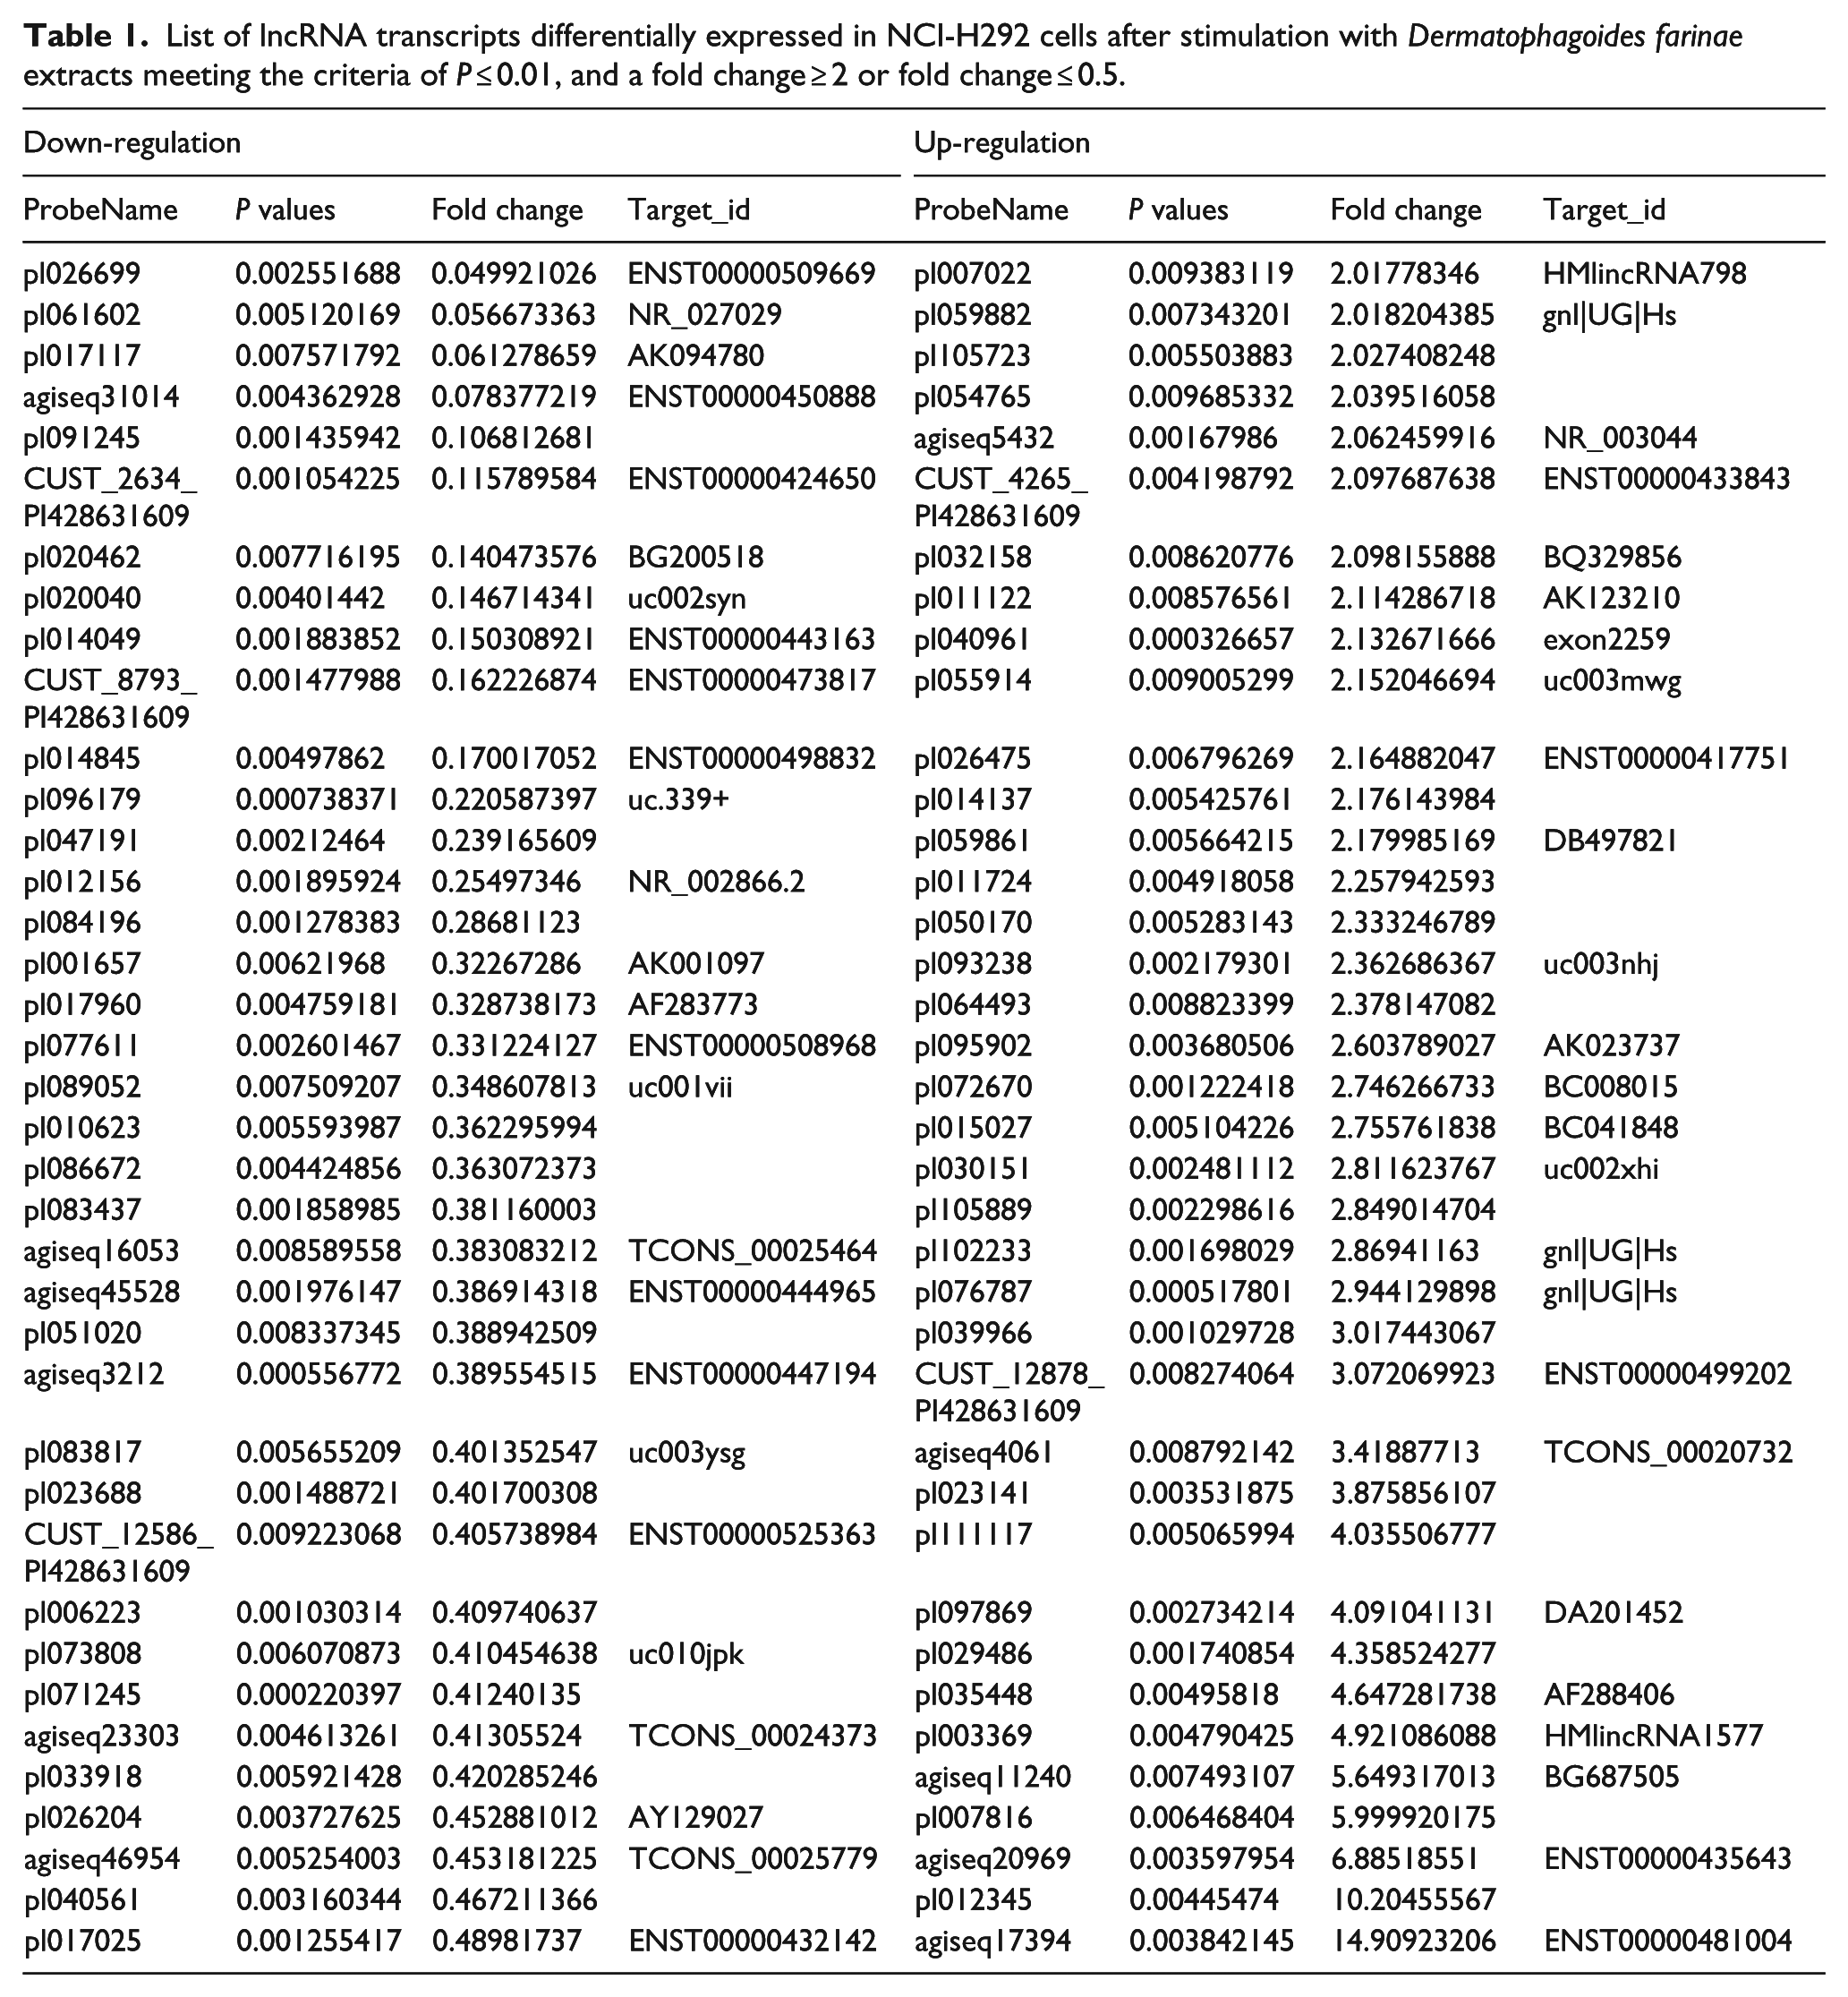
NCI-H292 cells either stimulated with D. farinae extract diluted in HBSS or treated with HBSS alone (unstimulated) were analyzed for RNA expression differences by microarray. We identified 270 lncRNAs significantly differentially expressed (fold change ≥ 2, P < 0.05); specifically, 142 were up-regulated and 128 down-regulated after stimulation with D. farinae extracts (Figure 1). Table 1 shows 38 up-regulated and 38 down-regulated at a higher significance level (P ≤ 0.01, and a fold change ≥ 2 or fold change ≤ 0.5). To verify the results from the microarray experiments, the expression of eight lncRNAs was validated by quantitative real-time polymerase chain reaction (qRT-PCR). The expression levels of these lncRNAs determined by qRT-PCR were consistent with those by microarray (Supplemental Figure 1).
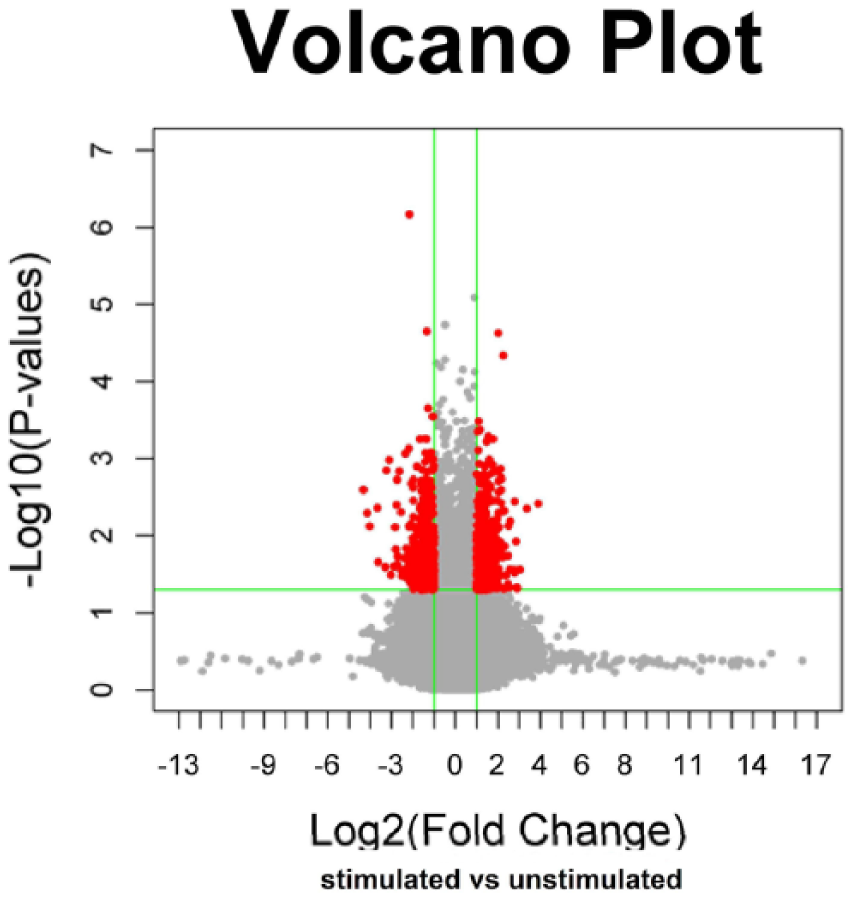
The volcano plot for differential lncRNAs expressed in NCI-H292 cells after stimulation with Dermatophagoides farinae extracts. x-axis, Log2 (fold change); y-axis, −log10 (P value). The line in parallel with x-axis, P value = 0.05; the line in parallel with y-axis, fold change = 2. The area in red was drawn for lncRNAs expressed differentially in NCI-H292 cells after stimulation with Dermatophagoides farinae extracts. Expression was determined as the mean of three replicates.
List of lncRNA transcripts differentially expressed in NCI-H292 cells after stimulation with Dermatophagoides farinae extracts meeting the criteria of P ≤ 0.01, and a fold change ≥ 2 or fold change ≤ 0.5.
Additionally, we identified 1438 mRNAs significantly differentially expressed (fold change ≥ 2, P < 0.05), with 987 up-regulated and 451 down-regulated in D. farinae-stimulated cells versus unstimulated cells (Supplemental Table 2). Our result is similar to a previous report. 3
GO and pathway analyses
GO analysis through several bioinformatics tools, included DAVID and KEGG, was performed to begin dissecting the potential contributions of the lncRNAs differentially expressed following stimulation of NCI-H292 cells with D. farinae allergens. We found that differentially expressed lncRNAs were associated with cellular process (ontology: biological process), cell (oncology: cellular component), and binding (ontology: molecular function) (Figure 2). Pathway analysis determined that these lncRNAs can target 16 gene pathways (Table 2). Based on the differentially expressed lncRNAs and their targeted pathways, we established an interaction network (Supplemental Figure 2). This analysis identified PFKL and GAPDH, components of the glycolysis pathway, which were predicted to be targets of the lncRNAs AK074162 and ENSTD0000499202, respectively. The network for axon guidance includes genes PTK2, KRAS, GNAI2, EFNA2, SEMA3E, and ITGB1. PTK2 appears to be targeted by HMlincRNA565; KRAS by Uc001rgr; GNAI2 by DA201452; EFNA2 by AK024373; SEMA3E by uc001pry, ENST00000417751, BC008015, DB497821, and ENST00000509669; and ITGB1 by AF147315.

Gene Ontology (GO) enrichment analysis of lncRNA targets (P < 0.01): (a) GO analysis of lncRNA-target genes according to biological process, (b) GO analysis of lncRNA-target genes according to cell component, and (c) GO analysis of lncRNA-target genes according to molecular function.
Pathway analysis of the predicted target genes for differentially expressed lncRNAs.

Construction of lncRNA:mRNA association networks
We performed a bioinformatics analysis to predict potential lncRNA targets in the database, using target prediction programs. Subsequently, interactions between the lncRNAs and their targets were drawn by Cytoscape software (v2.8.3); these comprised 506 lncRNAs and 123 mRNAs (Supplemental Table 2). Using the lncRNA:mRNA association networks, we found that 119 lncRNAs and 22 mRNAs were co-expressed (Figure 3).

Co-expression network for lncRNAs and mRNAs according to array data and bioinformatic analysis using DAVID and Cytoscape (v2.8.3): (a) NCI-H292 cells before stimulation with Dermatophagoides farinae extracts and (b) NCI-H292 cells after stimulation with Dermatophagoides farinae extracts. Up-regulation is marked in red, down-regulation is marked in green, and the rings marked in blue represent lncRNA. The solid line represents positive correlations, while the dashed line represents negative correlations.
Discussion
This study reports the first lncRNA profiling in NCI-H292 cells in response to D. farinae extracts. We identified 270 lncRNAs that were either up- or down-regulated by more than twofold. Furthermore, we predicted the potential lncRNA targets to derive an interaction network between lncRNAs and mRNAs. Co-expression was found for 119 lncRNAs and 22 mRNAs. These interactions should be confirmed in patients with asthma or in animal models to better understand their contribution to asthma pathology. The findings should also be validated in other models to rule out the potential contributions of accumulated mutations in a cancer cell line.
Pathway analysis identified 16 gene pathways in which the differentially expressed lncRNAs provide regulation; many of these pathways are related to development of asthma or allergy. For example, the allergen-induced early asthma response in rats is associated with glycolysis, calcium binding, and mitochondrial activity. 10 Similarly, aerobic glycolysis, which promotes T-cell activation, is increased in asthma. 11 House dust mite allergen Der p 1 exposure can activate the p38 MAPK pathway in BEAS-2B cells (bronchial epithelial cells) and eosinophils, 12 and house dust mite allergen Der p 2 induces nuclear factor kappa-light-chain-enhancer of activated B cells (NF-κB) and MAPK-dependent activation of bronchial epithelial cells. 13
The predicted lncRNA interactions with mRNA (Supplemental Figure 2) appear to be involved in the regulation of some of these pathways. For example, the mRNAs related to glycolysis, PFKL, and GAPDH were regulated by the lncRNAs AK074162 and ENSTD0000499202, respectively. Semaphorin3A (Sema3A), an axon guidance molecule in allergy in mice, 14 was regulated by 10 lncRNAs including uc001pry, ENST00000417751, BC008015, DB497821, ENST00000509669, and five unnamed lncRNAs. These theoretical regulations will be validated experimentally.
In sum, we have obtained preliminary data that exposure of bronchial epithelial cells to house dust mite allergen results in expression changes in lncRNAs and mRNAs. The lncRNA–mRNA co-expression network and pathway analysis reveals avenues for further exploration of the contribution of lncRNAs to allergy response. Further characterization of these lncRNA genes and their modes of action will allow their use for improved diagnosis, monitoring of progression, and target therapies.
Footnotes
Declaration of conflicting interests
The author(s) declared no potential conflicts of interest with respect to the research, authorship, and/or publication of this article.
Funding
This work was supported by National Natural Sciences Foundation of China (NSFC31272369, NSFC31572319) and Medical Innovation Team of Jiangsu Province (grant no. CXTDB2017016).
References
Supplementary Material
Please find the following supplemental material available below.
For Open Access articles published under a Creative Commons License, all supplemental material carries the same license as the article it is associated with.
For non-Open Access articles published, all supplemental material carries a non-exclusive license, and permission requests for re-use of supplemental material or any part of supplemental material shall be sent directly to the copyright owner as specified in the copyright notice associated with the article.