
Abstract
Purpose
This study aimed to investigate the role of SH3GL1 in regulating B7-H3 expression and its impact on immune escape in non-small cell lung cancer (NSCLC).
Methods
SH3GL1 and B7-H3 expression levels were analyzed in The Cancer Genome Atlas datasets and NSCLC cell lines using quantitative reverse transcription polymerase chain reaction and Western blot. SH3GL1 overexpression was performed to assess its effect on B7-H3 expression. Co-immunoprecipitation (Co-IP) and immunofluorescence (IF) were used to confirm the interaction and co-localization of SH3GL1 and B7-H3. Flow cytometry and confocal microscopy were employed to study B7-H3 endocytosis and recycling. The functional impact of SH3GL1 on immune escape was evaluated through T cell co-culture assays and in vivo tumor models.
Results
SH3GL1 and B7-H3 were significantly upregulated in NSCLC clinical samples and cell lines. SH3GL1 overexpression increased B7-H3 protein levels and promoted its recycling to the cell surface by redirecting B7-H3 away from lysosomal degradation. Co-IP and IF confirmed the physical interaction and co-localization of SH3GL1 and B7-H3. In vitro, SH3GL1 overexpression suppressed T cell proliferation, cytotoxicity, and activation while increasing immunosuppressive cytokines. In vivo, SH3GL1 overexpression accelerated tumor growth, increased Treg infiltration, and enhanced B7-H3 expression in tumor tissues.
Conclusion
SH3GL1 impacts B7-H3 expression and promotes immune escape in NSCLC by enhancing B7-H3 recycling and suppressing T cell function. These findings highlight SH3GL1 as a potential therapeutic target to overcome immune escape in NSCLC.
Introduction
Non-small cell lung cancer (NSCLC) accounts for approximately 85% of all lung cancer cases and is one of the leading causes of cancer-related deaths worldwide. 1 Its incidence is closely related to smoking, air pollution, occupational exposure (such as asbestos, arsenic), and genetic factors.2,3 Although the global incidence and mortality of NSCLC have declined in recent years, 4 the mortality rate of NSCLC is still on the rise in many regions, especially in developing countries, due to the aging population and the increase in environmental pollution. 5 NSCLC has a variety of treatments, including surgery, radiotherapy, chemotherapy, targeted therapy, and immunotherapy. 6 Among them, the progress of targeted therapy and immunotherapy has significantly improved patient prognosis. 7 Tyrosine kinase inhibitors targeting oncogenic driver mutations have been optimized for multiple generations, which not only improves the efficacy but also gradually reduces the problem of drug resistance.8–10 Although nearly all NSCLC tumors harbor driver mutations, only a small fraction has actionable targets amenable to current therapies. For patients without actionable mutations, immune checkpoint inhibitors have become a key therapeutic strategy, particularly in cases with high programmed death-ligand 1 (PD-L1) expression. 11 However, immune escape mechanisms, such as high expression of PD-L1, immunosuppression of the tumor microenvironment, antigen loss or mutation, and the production of immunosuppressive metabolites, seriously affect the effect of immunotherapy. 12
B7-H3 (also known as CD276) is a member of the B7 family and an important immune checkpoint molecule expressed on the cell surface. 13 It plays a complex and critical role in immune regulation and tumor progression. Studies have shown that B7-H3 has a dual role in the immune system.14–16 First, as a co-stimulatory factor, B7-H3 can activate T-cell-mediated cellular immune responses. 14 Second, B7-H3 also exhibits a co-inhibitory effect, helping tumor cells escape immune surveillance by inhibiting the killing function of natural killer cells and promoting tumor immune escape.17,18 This dual function has attracted much attention to the regulatory mechanism of B7-H3 in the tumor microenvironment. Although no targeted therapy for B7-H3 has been approved for clinical use, related research is progressing rapidly across various solid tumors (triple-negative breast cancer, NSCLC, gliomas, and melanoma, etc.), especially in the fields of antibody drugs, antibody conjugates (ADCs), and CAR-T cell therapy.19–21 These emerging therapies provide new treatment hope for tumor patients with high B7-H3 expression. Crucially, analysis of The Cancer Genome Atlas (TCGA) database showed that B7-H3 was significantly upregulated in lung adenocarcinoma (LUAD) and lung squamous cell carcinoma (LUSC), and was significantly associated with decreased survival in adenocarcinoma patients. 22 In addition, in the study by Yim et al. 23 further confirmed that B7-H3 expression levels were significantly increased in NSCLC patients with poor prognosis (such as those with lymph node metastasis and poor differentiation). This suggests that B7-H3 may serve as a prognostic marker and therapeutic target for NSCLC.
SH3 domain containing GRB2 like 1, endophilin A2 (SH3GL1) is a key molecule involved in cell internalization and membrane dynamic remodeling.24,25 To date, there have been no published studies specifically investigating the role of SH3GL1 in NSCLC. However, recent studies26,27 suggest that SH3GL1 may play an important role in tumor progression and drug resistance in other cancer types. In particular, a previous study 28 reports that SH3GL1 is highly expressed in colorectal cancer tumor specimens and various chemotherapy-resistant cells. Knockdown of SH3GL1 can significantly downregulate the expression of multidrug resistance protein 1/P-glycoprotein and inhibit the activation of epidermal growth factor receptor (EGFR) and ERK1/2 signaling pathways, thereby reversing the multidrug resistance of tumor cells. Our preliminary analysis, through the analysis of the TCGA data and University of Alabama at Birmingham cancer data analysis Portal (UALCAN) database, 29 found that the expression level of SH3GL1 in NSCLC was significantly increased and positively correlated with the expression of the immune checkpoint molecule B7-H3.
Given that SH3GL1 is a membrane trafficking protein involved in endocytosis and recycling, the hypothesis that it may regulate the intracellular trafficking and stability of B7-H3 has been proposed here. Based on this, we further proposed that SH3GL1-mediated modulation of B7-H3 recycling may enhance its immunosuppressive function, thereby contributing to immune evasion in NSCLC. These hypotheses formed the conceptual basis of the present study.
Materials and methods
Bioinformatics analysis
The expression data of B7-H3 (CD276) and SH3GL1 in NSCLC and matched normal tissues are from TCGA, and LUAD and LUSC are analyzed separately. To display the NSCLC culture data, RNA-seq Transcripts Per Million (TPM) values across 143 NSCLC cell lines was obtained from DepMap (Release 24Q4). Results were visualized through bubble plots generated in R (v4.4.2) highlighting expression extremes (top/bottom 10 cell lines) and two experimental models (NCIH520 and HCC827). Correlation analysis was performed using the UALCAN platform with Spearman's method.
Cell culture and transfection
Human bronchial epithelial cells BEAS-2B (#GNHu27, Cellbank, Shanghai, China) were cultured in Bronchial Epithelial Cell Growth Medium (BEGM) BulletKit (CC-3170, Lonza, Basel, Switzerland). Human LUAD cells HCC827 (#SCSP-538, In situ, Cellbank China) and LUSC cells NCIH520 (#HTB-182, In situ, ATCC, Manassas, VA, USA) were cultured in RPMI-1640 medium (Gibco, Waltham, MA, USA) supplemented with 10% fetal bovine serum (FBS) and 1% penicillin-streptomycin. The culture conditions were 37°C and 5% CO₂.
To overexpress SH3GL1 in NCIH520 cells, cells were first seeded in 6-well plates and transfected when the cell density reached 70%–80%. Transfection complexes were prepared using Lipofectamine™ 3000 according to the manufacturer's instructions. The complexes were added dropwise to the medium, gently mixed, and incubated in a 37°C, 5% CO₂ incubator. Forty-eight hours after transfection, cells were collected to evaluate SH3GL1 levels to determine the transfection effect. The cells transfected with the SH3GL1-carrying plasmids were labeled as the SH3GL1 overexpression (oe-SH3GL1) group, while the cells transfected with the empty plasmids were labeled as the negative control (oe-NC).
Quantitative reverse transcription-polymerase chain reaction
Total RNA was extracted from the cultured cells using Trizol reagent (Invitrogen, Waltham, MA, USA) according to the manufacturer's instructions and reversed transcribed into cDNA using the PrimeScript RT reagent Kit (#RR037Q, Takara Co Ltd, Tokyo, Japan). The quantitative reverse transcription-polymerase chain reaction (RT-qPCR) procedure (95°C for 2 min, 40 cycles of 95°C for 15 s and 60°C for 20 s) were performed using the BeyoFast™ SYBR Green qPCR Mix (#D7262, Beyotime, Shanghai, PR China) on a 7900HT (Applied Biosystems, Waltham, MA, USA) according to the manufacturer's protocols.
Western blotting
Cells were washed twice with pre-cooled phosphate buffered saline (PBS), and then RIPA lysis buffer (Beyotime) containing protease inhibitors was added and lysed on ice for 20 min. After lysis, centrifugation was performed and the supernatant was collected as the total protein extract. The protein concentration was determined using Nanodrop One (Thermo Fisher, Waltham, MA, USA), and equal amounts of protein were taken for SDS-PAGE electrophoresis and then transferred to a PVDF membrane. After blocking with 5% skim milk for 1 h, antibody against SH3GL1 (#27014-1-AP, Proteintech), B7-H3 (#A700-025, Bethyl Laboratories, Montgomery. TX, USA), or GAPDH (#10494-1-AP, Proteintech, Manchester, UK) was added and incubated overnight at 4°C. After washing with TBST, HRP-labeled secondary antibody (#SA00001-2, Proteintech) was added and incubated at room temperature for 1 h. Finally, enhanced chemiluminescence reagent was used for development, and the grayscale value of the protein bands was analyzed by Fiji software.
Co-IP
Total protein extract was obtained as described before. Then the supernatant was incubated with 2 µg of SH3GL1 antibody at 4°C overnight to form antigen-antibody complexes. Subsequently, Protein A/G magnetic beads (#B23201, Selleck) were added and incubated at 4°C for 2 h to capture the immune complex. The supernatant was removed by magnetic force and the magnetic beads in 1× SDS sample buffer were boiled for 10 min. The supernatant was collected for SDS-PAGE electrophoresis and the expression of B7-H3 or SH3GL1 in the co-precipitated samples was detected by western blotting.
Immunofluorescence
NCIH520 cells were fixed with 4% paraformaldehyde for 15 min, permeabilized with 0.1% Triton X-100, and blocked with 5% bovine serum albumin (BSA) for 1 h at room temperature. The cells were incubated with the B7-H3 (#A700-025, Bethyl Laboratories) and SH3GL1 (#MA5-38256, Invitrogen) or Rab7 (#sc-376362, Santa Cruz), Rab11 (#67902-1-Ig, Proteintech), LAMP1 (#65051-1-Ig, Proteintech) antibody at room temperature for 2 h. After washing three times with PBS, the antibody conjugated with FITC (#SA00003-2, Proteintech) and Alexa Fluor® 594 (#ab150116, Abcam, Cambridge, UK) was incubated with cells for 1 h at room temperature. The nuclei were counterstained with DAPI for 5 min. Cells were imaged using a fluorescence microscope (Eclipse TE2000-U, Nikon). Alternatively, ProLong Gold antifade mountant (#P10144, Invitrogen) was added and imaged using a confocal laser scanning microscope (TCS SP8, Leica, Wetzlar, Germany).
B7-H3 content on cell surface
The cells were incubated in pre-cooled medium at 4°C for 30 min to inhibit the initiation of the endocytic process. Subsequently, the cells were transferred to a 37°C, 5% CO₂ incubator and collected at 20 and 60 min. At both time points, the cells were quickly placed on ice and washed twice with pre-cooled PBS to terminate the endocytic process. Next, the cells were resuspended in PBS containing 1% BSA, and the B7-H3 primary antibody (#A700-025, Bethyl Laboratories) was added and incubated at 4°C in the dark for 1 h. After washing, the FITC-labeled secondary antibody (#SA00003-2, Proteintech) was added and incubated at 4°C in the dark for 30 min. Cells were suspended in PBS and immediately subjected to flow cytometry (BD FACSAria 3, BD Biosciences, San Jose, CA, USA).
T cell isolation and co-incubation
Blood samples were separated into peripheral blood mononuclear cells using Ficoll density gradient centrifugation. CD8+ T cells were isolated using a CD8+ T cell isolation kit (#abs50130, Absin) according to the instructions. The sorted T cells were resuspended in RPMI-1640 medium containing 10% FBS and 50 U/mL interleukin-2 (IL-2) (#S10970018, Beijing Sihuan) and the cell density was adjusted to 1 × 10⁶ cells/mL. T cells stimulated with ActiveMax® CD3/CD28 beads (#MBS-C001, ACROBiosystems, North America & Europe). The cells were cultured in a 37°C, 5% CO₂ environment for 48 h to activate T cells. NCIH520 cells were inoculated in a Transwell (Corning) and cultured for 24 h. The activated T cells were added at a 10-fold ratio. The co-culture system was placed in a 37°C, 5% CO₂ incubator.
CFSE staining
Before co-culture, activated T cells were stained with 5 µM CFSE (#C1157, Invitrogen) and incubated at 37°C for 10 min. The staining was terminated by adding an equal volume of medium containing 10% FBS, centrifuged at 300 × g for 5 min, and washed twice. After 24 h of co-culture, T cells were collected and washed twice with PBS. The cells were immediately subjected to flow cytometry (BD FACSAria 3) and the T cell proliferation index was analyzed using FlowJo software.
LDH
The co-culture system was placed in a 37°C, 5% CO₂ incubator for 24 h, centrifuged at 300×g for 5 min, and the supernatant was collected. According to the instructions of the LDH detection kit (#C0016, Beyotime), the supernatant was mixed with the reaction buffer in proportion and incubated at room temperature in the dark for 30 min. The absorbance was measured at 490 nm using a microplate reader (BioTek), and the LDH activity was calculated to evaluate the effect of T cells on NCIH520 cells.
T cell activation
T cells were collected after co-culture and washed twice with PBS. PE Anti-CD8 (#344705), FITC Anti-CD25 (#302603) and FITC Anti-CD69 (#310903, BioLegend, San Diego, CA, USA) antibodies were added and incubated at 4°C in the dark for 30 min. After washing, the cells suspended in PBS were immediately subjected to flow cytometry (BD FACSAria 3, BD Biosciences). The expression levels of CD25 and CD69 were analyzed to evaluate the activation status of T cells.
Annexin V/Pi apoptosis analysis
NCIH520 cells were collected after co-culture and washed twice with pre-cooled PBS. The cells were suspended in 1×Binding Buffer and the cell density was adjusted to 1 × 10⁶ cells/mL. 5 µL Annexin V-FITC and 5 µL PI staining solution (Life Technologies, Carlsbad, CA, USA) were added and incubated at room temperature in the dark for 15 min. 400 µL 1×Binding Buffer was added and flow cytometry (BD Biosciences) was performed immediately. The proportion of apoptotic cells was analyzed to evaluate the apoptosis of NCIH520 cells.
Enzyme-linked immunosorbent assay
The secretion levels of interferon (IFN)-γ (#PI511), IL-2 (#PI580), IL-10 (#PI528) and transforming growth factor (TGF)-β (#PT880, Beyotime) in the co-culture system were determined using the corresponding human enzyme-linked immunosorbent assay (ELISA) kits according to the manufacturer's instructions. The supernatant was collected after centrifugation at 300×g for 5 min. For tumor tissues, the supernatant obtained after centrifugation of the lysate was used as the sample, and the detection was performed using the mouse IL-10 (#D721023) and TGF-β (#D751002, Sangon Biotech, Shanghai, China) ELISA kits. A microplate reader (BioTek, Winooski, VT, USA) was used to measure the optical density values in each well at a 450 nm.
Animal modeling
100 µL of Lewis Lung Carcinoma (LLC, #SCSP-5252, Cellbank) cell suspension (containing 1 × 10⁶ cells) was injected subcutaneously into the right back of the C57BL/6 mouse (Charles River; 6–8 weeks) using a sterile syringe. The status of the mice was observed every day after inoculation, and the tumor formation was recorded. Starting from the 3rd day after inoculation, the long diameter (L) and short diameter (W) of the tumor were measured with a vernier caliper every 3–4 days, and the tumor volume was calculated according to the formula: V = (L × W²) /2. The changes in tumor volume were recorded and the growth curve was drawn. At the end of the experiment (28 days after inoculation), the mice were sacrificed through the CO2 method and the tumor tissue was removed. Part of the tumor tissue was fixed with 4% paraformaldehyde for immunohistochemistry (IHC) analysis; the other part of the tissue was separated into single cell suspension for flow cytometry analysis.
Immune cell infiltration
Tumor tissue was minced into 1–2 mm³ pieces, and digested with collagenase IV (#40510ES60, Yeasen, Shanghai, China) and DNase I (#D7073, Beyotime) at 37°C for 30 min. The digested cell suspension was filtered through a 70 µm cell sieve to remove undigested tissue pieces and washed twice with PBS to collect single cell suspension. PE Anti-CD8 (#155007) or APC Anti-CD4 (#100411) and FITC Anti-CD25 (#102005, BioLegend) antibodies were added and incubated at 4°C in the dark for 30 min. Next, cells were fixed with 4% paraformaldehyde, incubated at room temperature in the dark for 20 min, and then treated with 0.1% Triton X-100 for 10 min. The permeabilized cells were washed twice with PBS, suspended in staining buffer, FITC Anti-IFN-γ (#505805) or PE Anti-Foxp3 (#118903, BioLegend) antibodies were added, and incubated at 4°C in the dark for 30 min. Finally, flow cytometry (BD FACSAria 3) and FlowJo was used to analyze CD8 + IFN-γ+ T cells and CD4 + CD25 + Foxp3+ Treg cells.
IHC staining
Paraffin-embedded tissue sections were cut to a thickness of 4 μm, deparaffinized in xylene, and rehydrated in graded alcohols. Antigen retrieval was achieved by microwaving at 100°C with 10 mM citrate buffer. Then, 3% hydrogen peroxide was used to eliminate endogenous peroxidase. Following serum blocking, the sections were subsequently incubated with primary antibodies against B7-H3 (#A700-025, Bethyl Laboratories) at 37°C for 1 h followed by biotinylated secondary antibody (#SAP-9100, Beijing ZSJQ). The sections were incubated with alkaline phosphatase-conjugated streptavidin working solution at 37°C for 10 min. Then freshly prepared NBT development solution was added and incubated at room temperature for 20 min. Slides were counterstained with hematoxylin for 20 s and positive immunostaining was examined with a microscope (Eclipse TE2000-U, Nikon).
Statistics analysis
All experiments were repeated at least three times. Data were represented as mean ± SD. Statistical differences between two groups were performed by two-tailed Student's t test, and comparisons between multiple groups were analyzed with one-way or two-way analysis of variance (ANOVA) followed by Tukey's multiple comparisons test using GraphPad Prism9.
Results
SH3GL1 and B7-H3 levels in NSCLC clinical samples and cells
B7-H3 (CD276) levels were significantly upregulated in LUAD and LUSC clinical samples in TCGA (Figure 1(a)), as was SH3GL1 (Figure 1(b)). The Spearman correlation analysis indicates a statistically significant positive correlation between the two (Figure 1(c)). Normal bronchial epithelial cells (BEAS-2B) as the control group and NSCLC cell lines (HCC827 and NCIH520) as the experimental group were used. RT-qPCR and Western blotting (WB) were used to detect the messenger RNA (mRNA) and protein levels of SH3GL1 and B7-H3 in these cells. Compared with BEAS-2B cells, the mRNA expression levels of SH3GL1 and B7-H3 were significantly increased in HCC827 and NCIH520 cells (Figure 1(d) and (e)). The protein levels of SH3GL1 and B7-H3 were also significantly increased in NSCLC cells compared with BEAS-2B cells (Figure 1(f)). NCIH520 cells were used for subsequent experiments due to higher mRNA and protein level. The bubble plot shows the expression of CD276 and SH3GL1 in multiple NSCLC cell lines. The top/bottom 10 expression cell lines, as well as the two cell lines used in this study (NCI-H520 and HCC-827), are visualized. The expression levels of both experimental cell lines are around the median. This analysis suggests that our experimental model is not an outlier and may support the generality of the regulatory relationship observed between SH3GL1 and B7-H3 (Figure 1(g) and (h)).
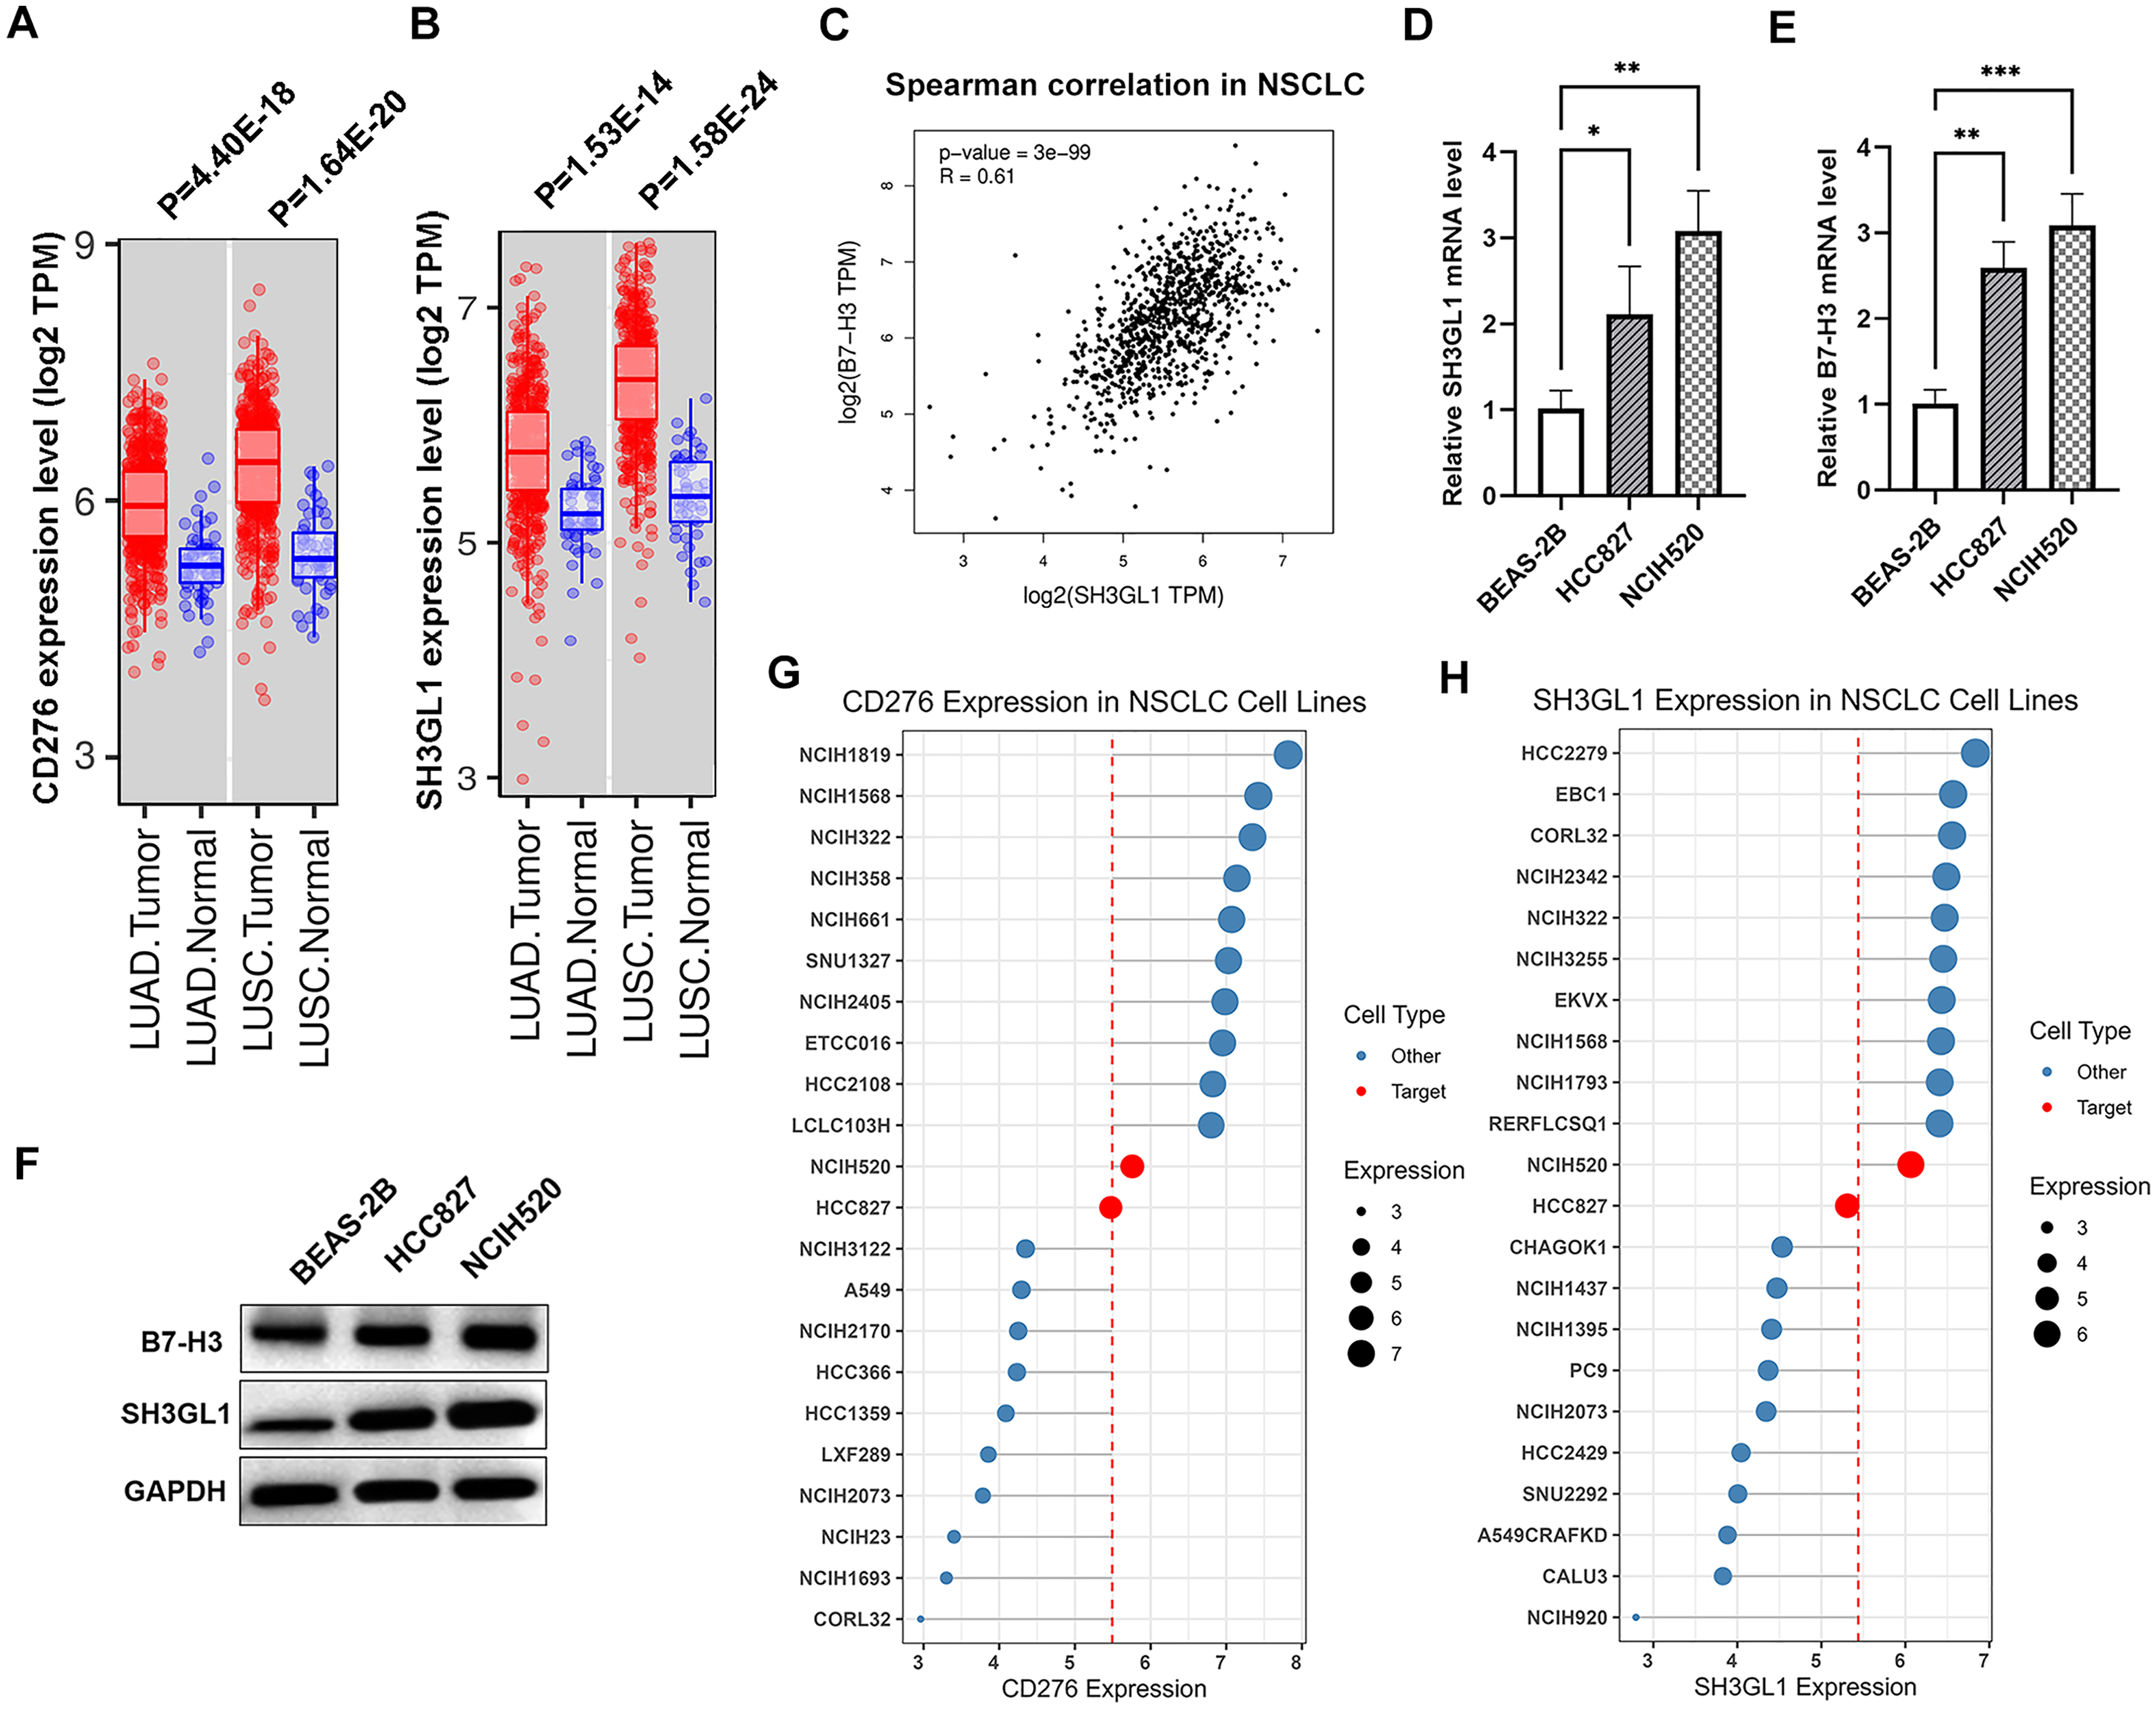
SH3GL1 and B7-H3 levels in NSCLC clinical samples and cells. (a) B7-H3 (CD276) levels in LUAD and LUSC clinical samples and matched normal tissues from the TCGA database. (b) SH3GL1 levels in LUAD and LUSC clinical samples and matched normal tissues from the TCGA database. (c) Spearman correlation between B7-H3 and SH3GL1 in NSCLC. (d) Normal bronchial epithelial cells BEAS-2B as the control group and NSCLC cell lines (HCC827 and NCIH520) as the experimental group were used. RT-qPCR analysis showing the mRNA expression levels of SH3GL1. (e) B7-H3 in these cells. (f) Western blot analysis showing the protein levels of SH3GL1 and B7-H3 in these cells. (g) The bubble plot shows the expression of CD276. (h) SH3GL1 in multiple NSCLC cell lines. The top/bottom 10 expression cell lines and two experimental cell lines are visualized. *P < 0.05, **P < 0.01.
Association between SH3GL1 and B7-H3
To confirm the relationship between SH3GL1 and B7-H3. SH3GL1 was overexpressed by transfection, and RT-qPCR and WB were used to detect the efficacy of SH3GL1 overexpression. The experimental results showed that SH3GL1 was significantly increased in the oe-SH3GL1 group (Figure 2(a) and (b)). Surprisingly, overexpression of SH3GL1 caused an increase in B7-H3 protein (Figure 2(c)). Co-IP experiments showed that B7-H3 was enriched in the complex captured by SH3GL1 antibody (Figure 2(d)). IF was used to observe the co-localization of SH3GL1 and B7-H3 in cells. The oe-SH3GL1 group showed an increase in the levels of SH3GL1 and B7-H3, and the co-localization of the two proteins also increased (Figure 2(e)).
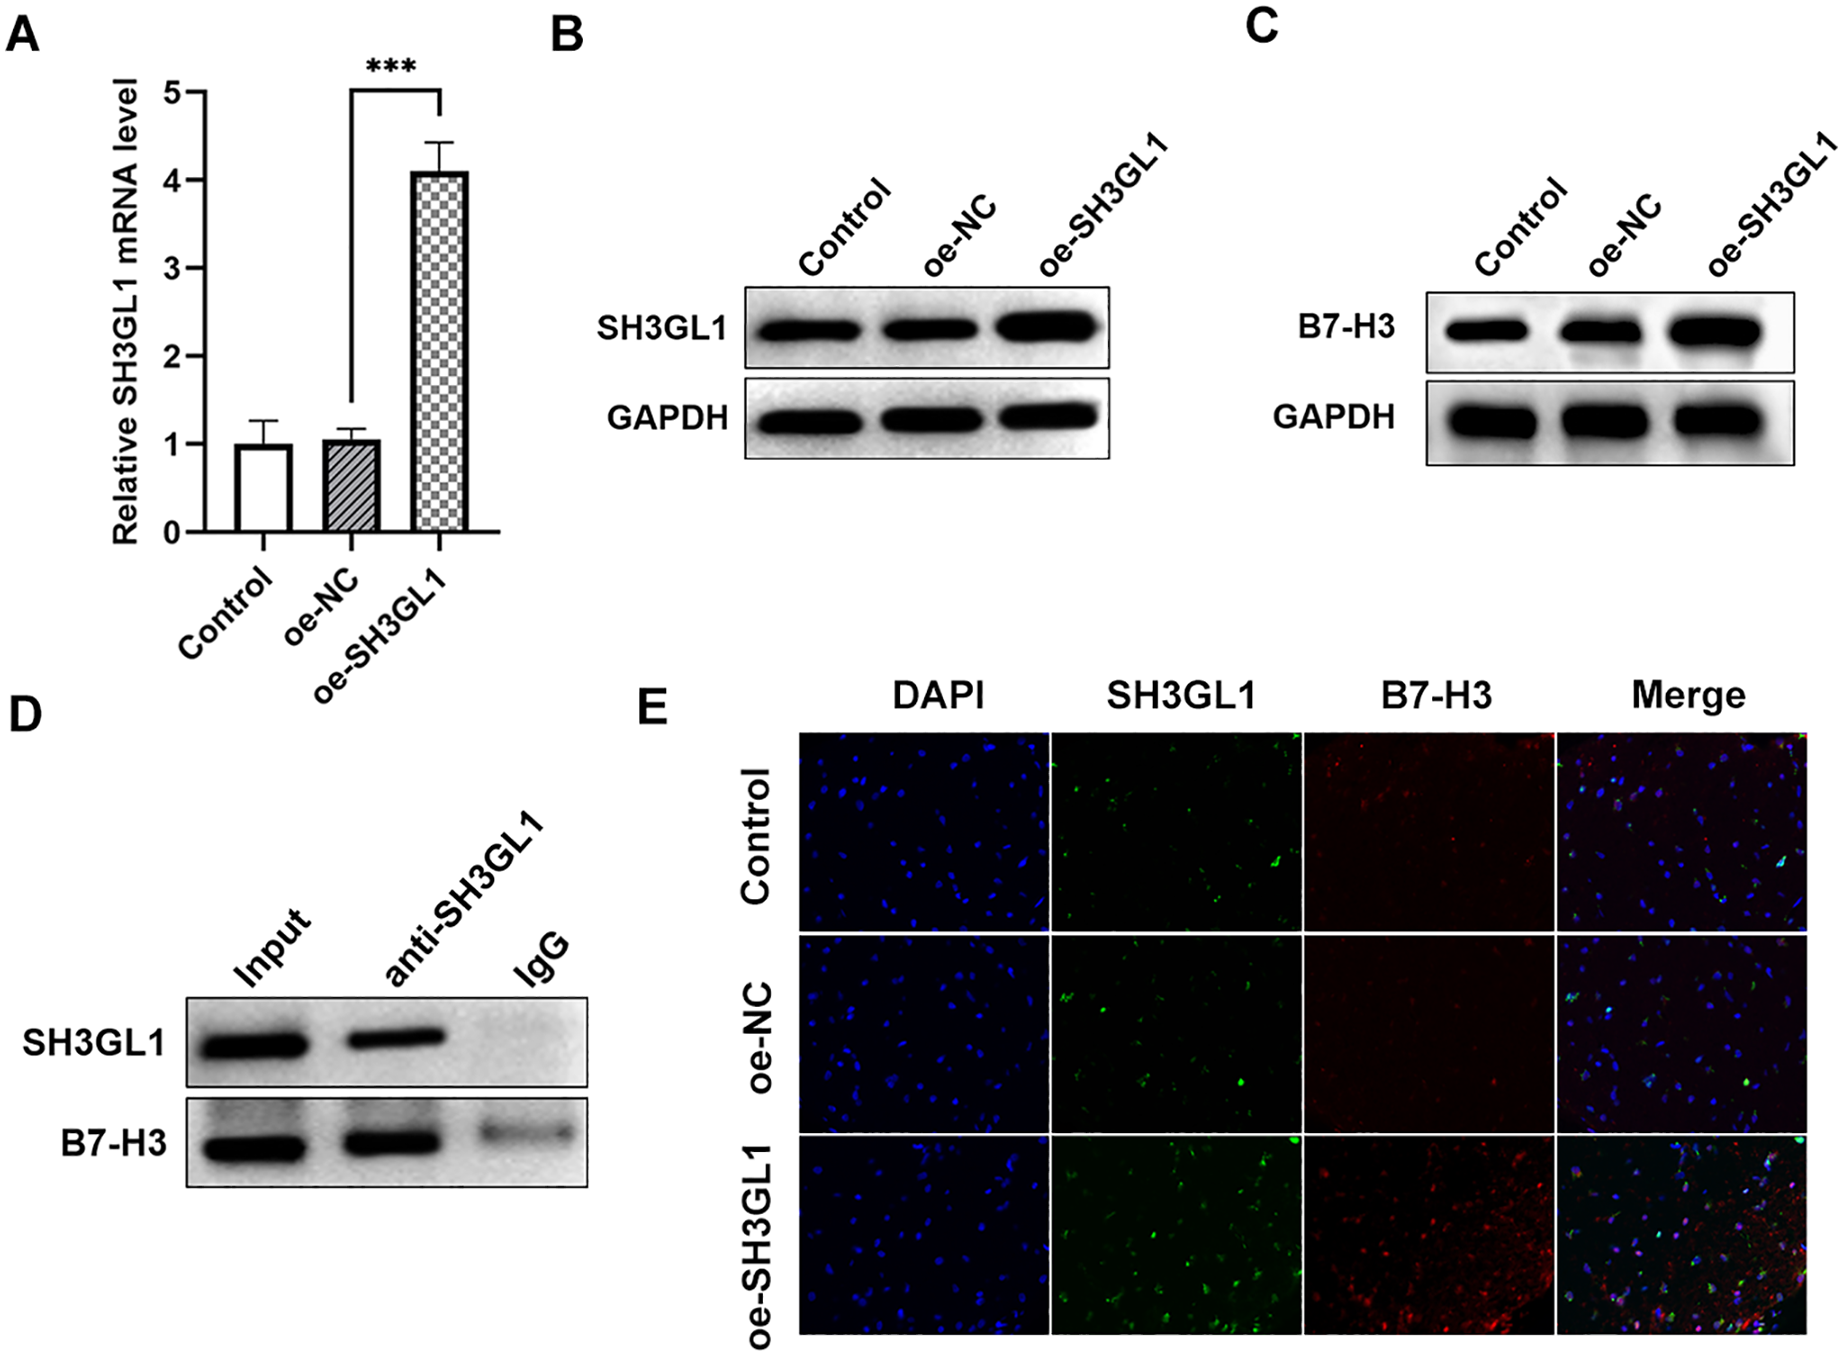
Association between SH3GL1 and B7-H3 NCIH520 cell with SH3GL1 overexpression is labeled as the oe-SH3GL1 group, while the negative control is labeled as the oe-NC. (a) RT-qPCR and (b) Western blot analysis showing the efficacy of SH3GL1 overexpression in NCIH520 cells. (c) Western blot analysis showing B7-H3 protein levels upon SH3GL1 overexpression in NCIH520 cells. (d) Co-IP experiments demonstrating the relationship between B7-H3 and SH3GL1. The complex was captured by anti-SH3GL1 antibody and SH3GL1 and B7-H3 enrichment was detected. (e) Immunofluorescence (IF) analysis showing the co-localization of SH3GL1 and B7-H3 in cells, and DAPI marks the cell nuclei. ***P < 0.001.
Effect of SH3GL1 on B7-H3 endocytosis pathway
To investigate the effect of SH3GL1 on the B7-H3 endocytosis pathway, flow cytometry was used to quantify the B7-H3 content on the cell surface at different time points. Compared with the oe-NC group, the B7-H3 content in the oe-SH3GL1 group decreased at 20 min. However, at 1 h, the B7-H3 content increased (Figure 3(a)). At 1 h, confocal microscopy showed that the co-localization of B7-H3 and the late endosomal marker Rab7 decreased compared with the oe-NC group (Figure 3(b)), while B7-H3 and the recycling endosomal marker Rab11 increased (Figure 3(c)). This suggested that B7-H3 was being recycled back to the cell surface. In addition, SH3GL1 overexpression resulted in a decrease in the co-localization of B7-H3 and the lysosomal marker LAMP1 (Figure 3(d)). These fluorescence results indicated that B7-H3 did not enter the lysosome for degradation after being endocytosed, further proving that it was recycled to the cell surface. Furthermore, the cells were treated with the lysosomal inhibitor chloroquine. According to the WB results, the addition of chloroquine did not significantly change the accumulation of intracellular B7-H3, indicating that B7-H3 was not mainly degraded through lysosomes (Figure 3(e)).
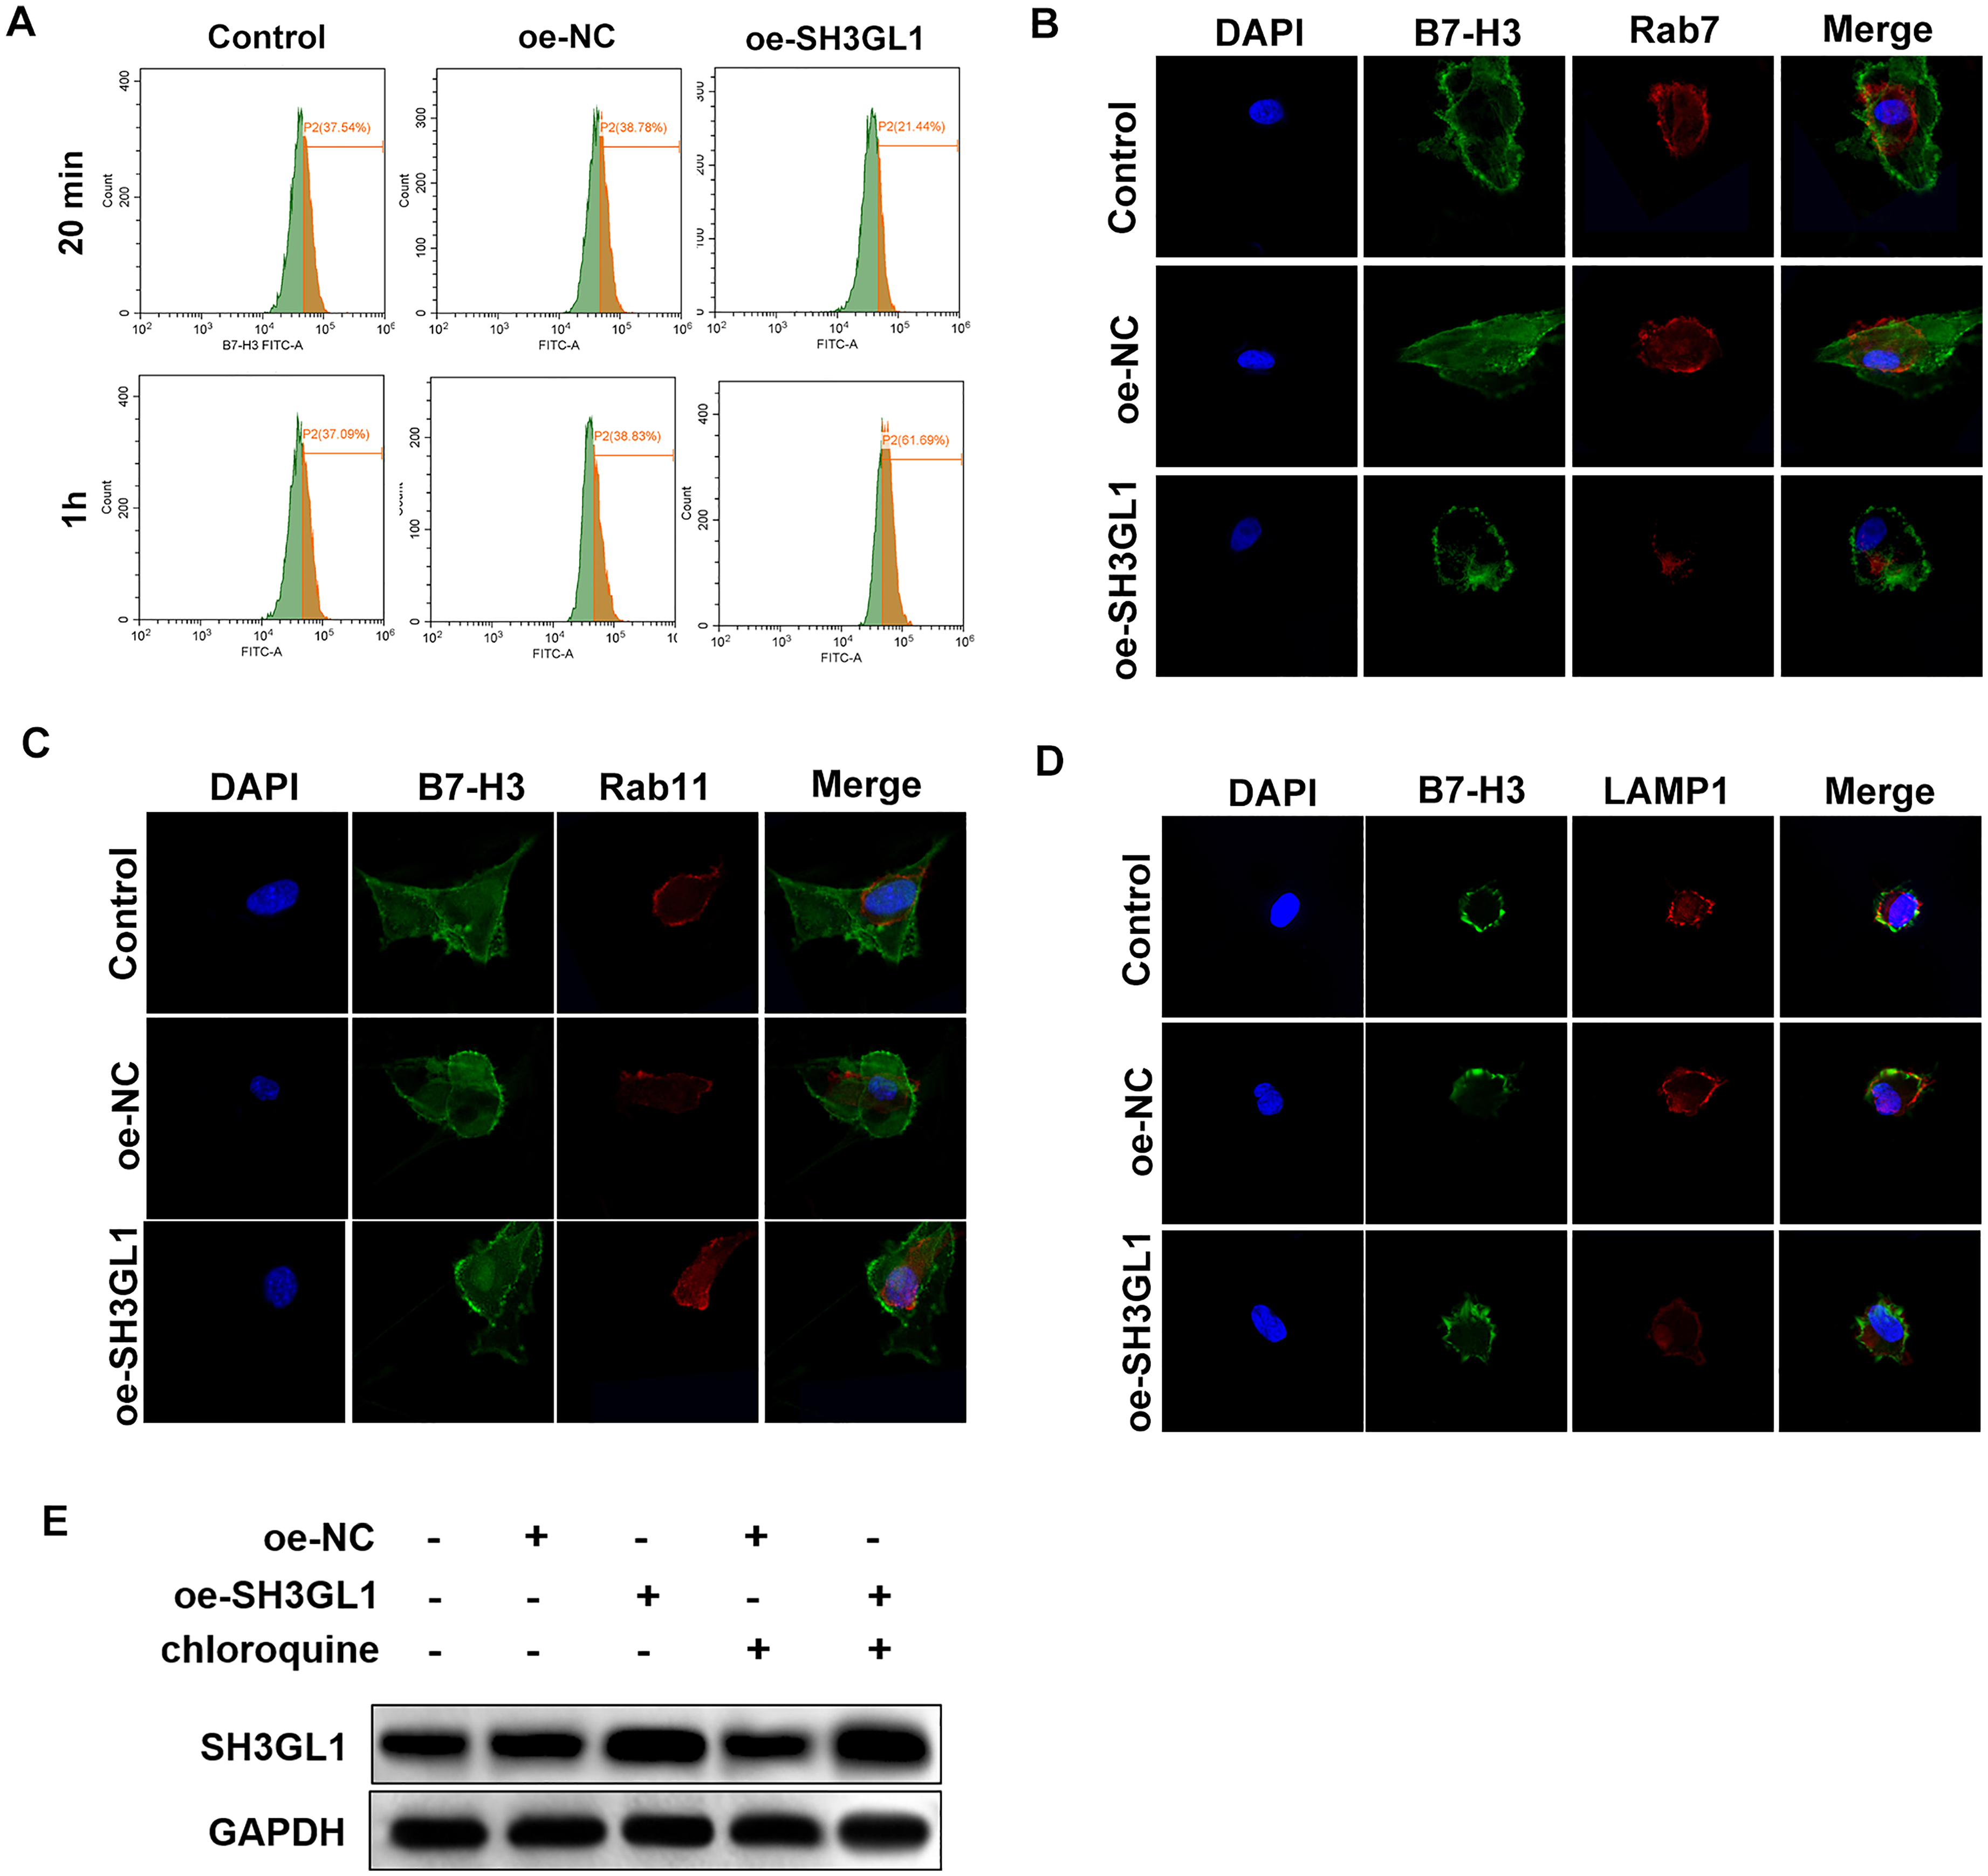
Effect of SH3GL1 on B7-H3 endocytosis pathway NCIH520 cell with SH3GL1 overexpression is labeled as the oe-SH3GL1 group, while the negative control is labeled as the oe-NC. (a) Flow cytometry analysis quantifying the B7-H3 content on the cell surface at 20 min and 1 h time points. (b) Confocal microscopy showing co-localization of B7-H3 and the late endosomal marker Rab7, and DAPI marks the cell nuclei. (c) Confocal microscopy showing co-localization of B7-H3 and the recycling endosomal marker Rab11, and DAPI marks the cell nuclei. (d) Confocal microscopy showing co-localization of B7-H3 and the lysosomal marker LAMP1, and DAPI marks the cell nuclei. (e) Western blot analysis showing the effect of the lysosomal inhibitor chloroquine on B7-H3 content.
Function of SH3GL1 and B7-H3 in immune escape of NSCLC cells
NCIH520 cells were co-cultured with activated T cells, and flow cytometry results showed that the proliferation of T cells co-cultured with NCIH520 cells with SH3GL1 overexpression was reduced (Figure 4(a)). The killing effect of T cells on NCIH520 cells was analyzed based on the LDH activity in the supernatant, and the results showed that the degree of killing of NCIH520 cells was reduced (Figure 4(b)). Annexin V/PI staining showed that the apoptosis rate of NCIH520 cells in the SH3GL1 overexpression group was reduced (Figure 4(c)). The levels of cytokines IFN-γ and IL-2 in the co-culture system were reduced, and the levels of IL-10 and TGF-β were increased (Figure 4(d)). Flow cytometry analysis demonstrated a decreased proportion of CD8+ T cells expressing the activation markers CD69 and CD25 in the SH3GL1 overexpression group (Figure 4(e) and (f)).
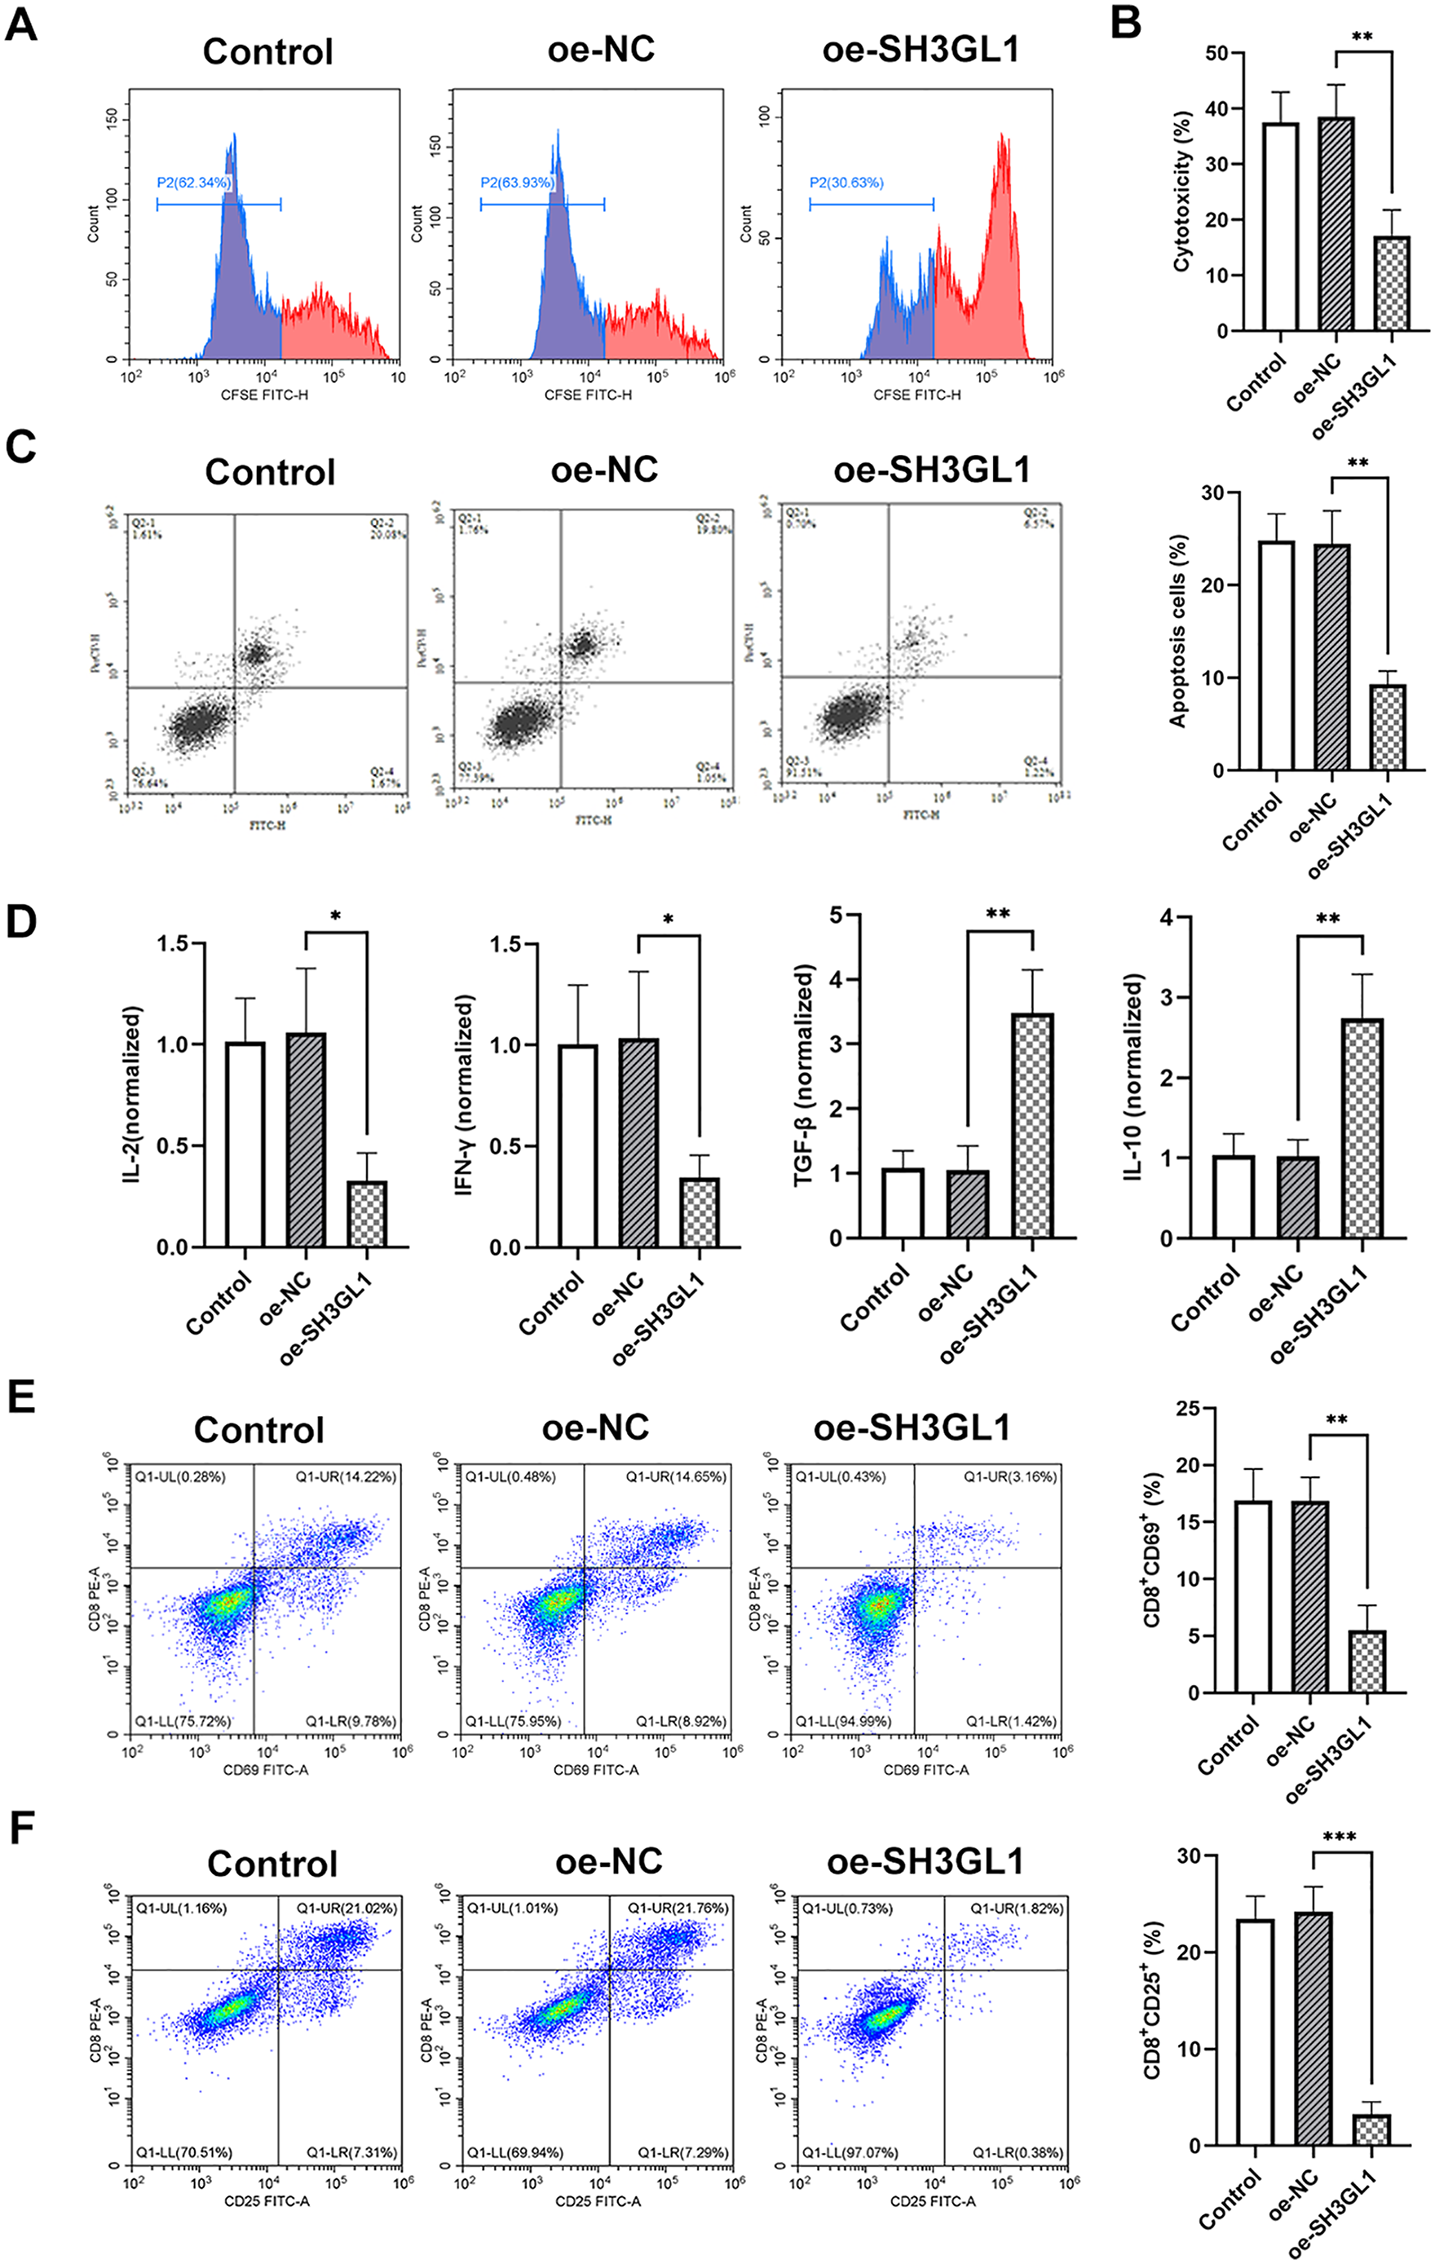
Function of SH3GL1 and B7-H3 in immune escape of NSCLC cells NCIH520 cell with SH3GL1 overexpression is labeled as the oe-SH3GL1 group, while the negative control is labeled as the oe-NC. Different groups of NCIH520 cells were co-cultured with activated T cells using Transwell. (a) CFSE staining and flow cytometry analysis showing the proliferation of T cells after co-culture. (b) LDH activity assay showing the cytotoxicity of NCIH520 cells by T cells. (c) Annexin V/PI staining showing the apoptosis of NCIH520 cells after co-culture, and the proportion of apoptotic cells was quantified. (d) ELISA results showing cytokine levels in the co-culture system. (e) Flow cytometry analysis showing the proportion of CD8+ T cells expressing the activation markers CD69 and (f) CD25. *P < 0.05, **P < 0.01, ***P < 0.001.
In vivo verification of the effect of SH3GL1 and B7-H3 on immune escape
Tumor-bearing mice were used to verify the regulation of SH3GL1 on immune escape in tumors. The volume of transplanted tumors was recorded, and the growth trends of the control and oe-NC groups were similar. The tumors in the SH3GL1 overexpression group grew faster (Figure 5(a)). The levels of immunosuppressive cytokines TGF-β and IL-10 in the tumor lysate increased compared with the oe-NC group (Figure 5(b)). In addition, the infiltration of T cells and Tregs in the tumors was analyzed by flow cytometry. CD8+IFN-γ+ T cells in the tumors of the SH3GL1 overexpression group were decreased (Figure 5(c)), while CD25+Foxp3+ Tregs infiltration was increased (Figure 5(d)). This indicates that SH3GL1 overexpression is associated with reduced effector T cell activity and increased Treg infiltration in the tumor microenvironment. Lastly, IHC results showed that the B7-H3 positivity rate increased in the SH3GL1 overexpression group (Figure 5(e)).
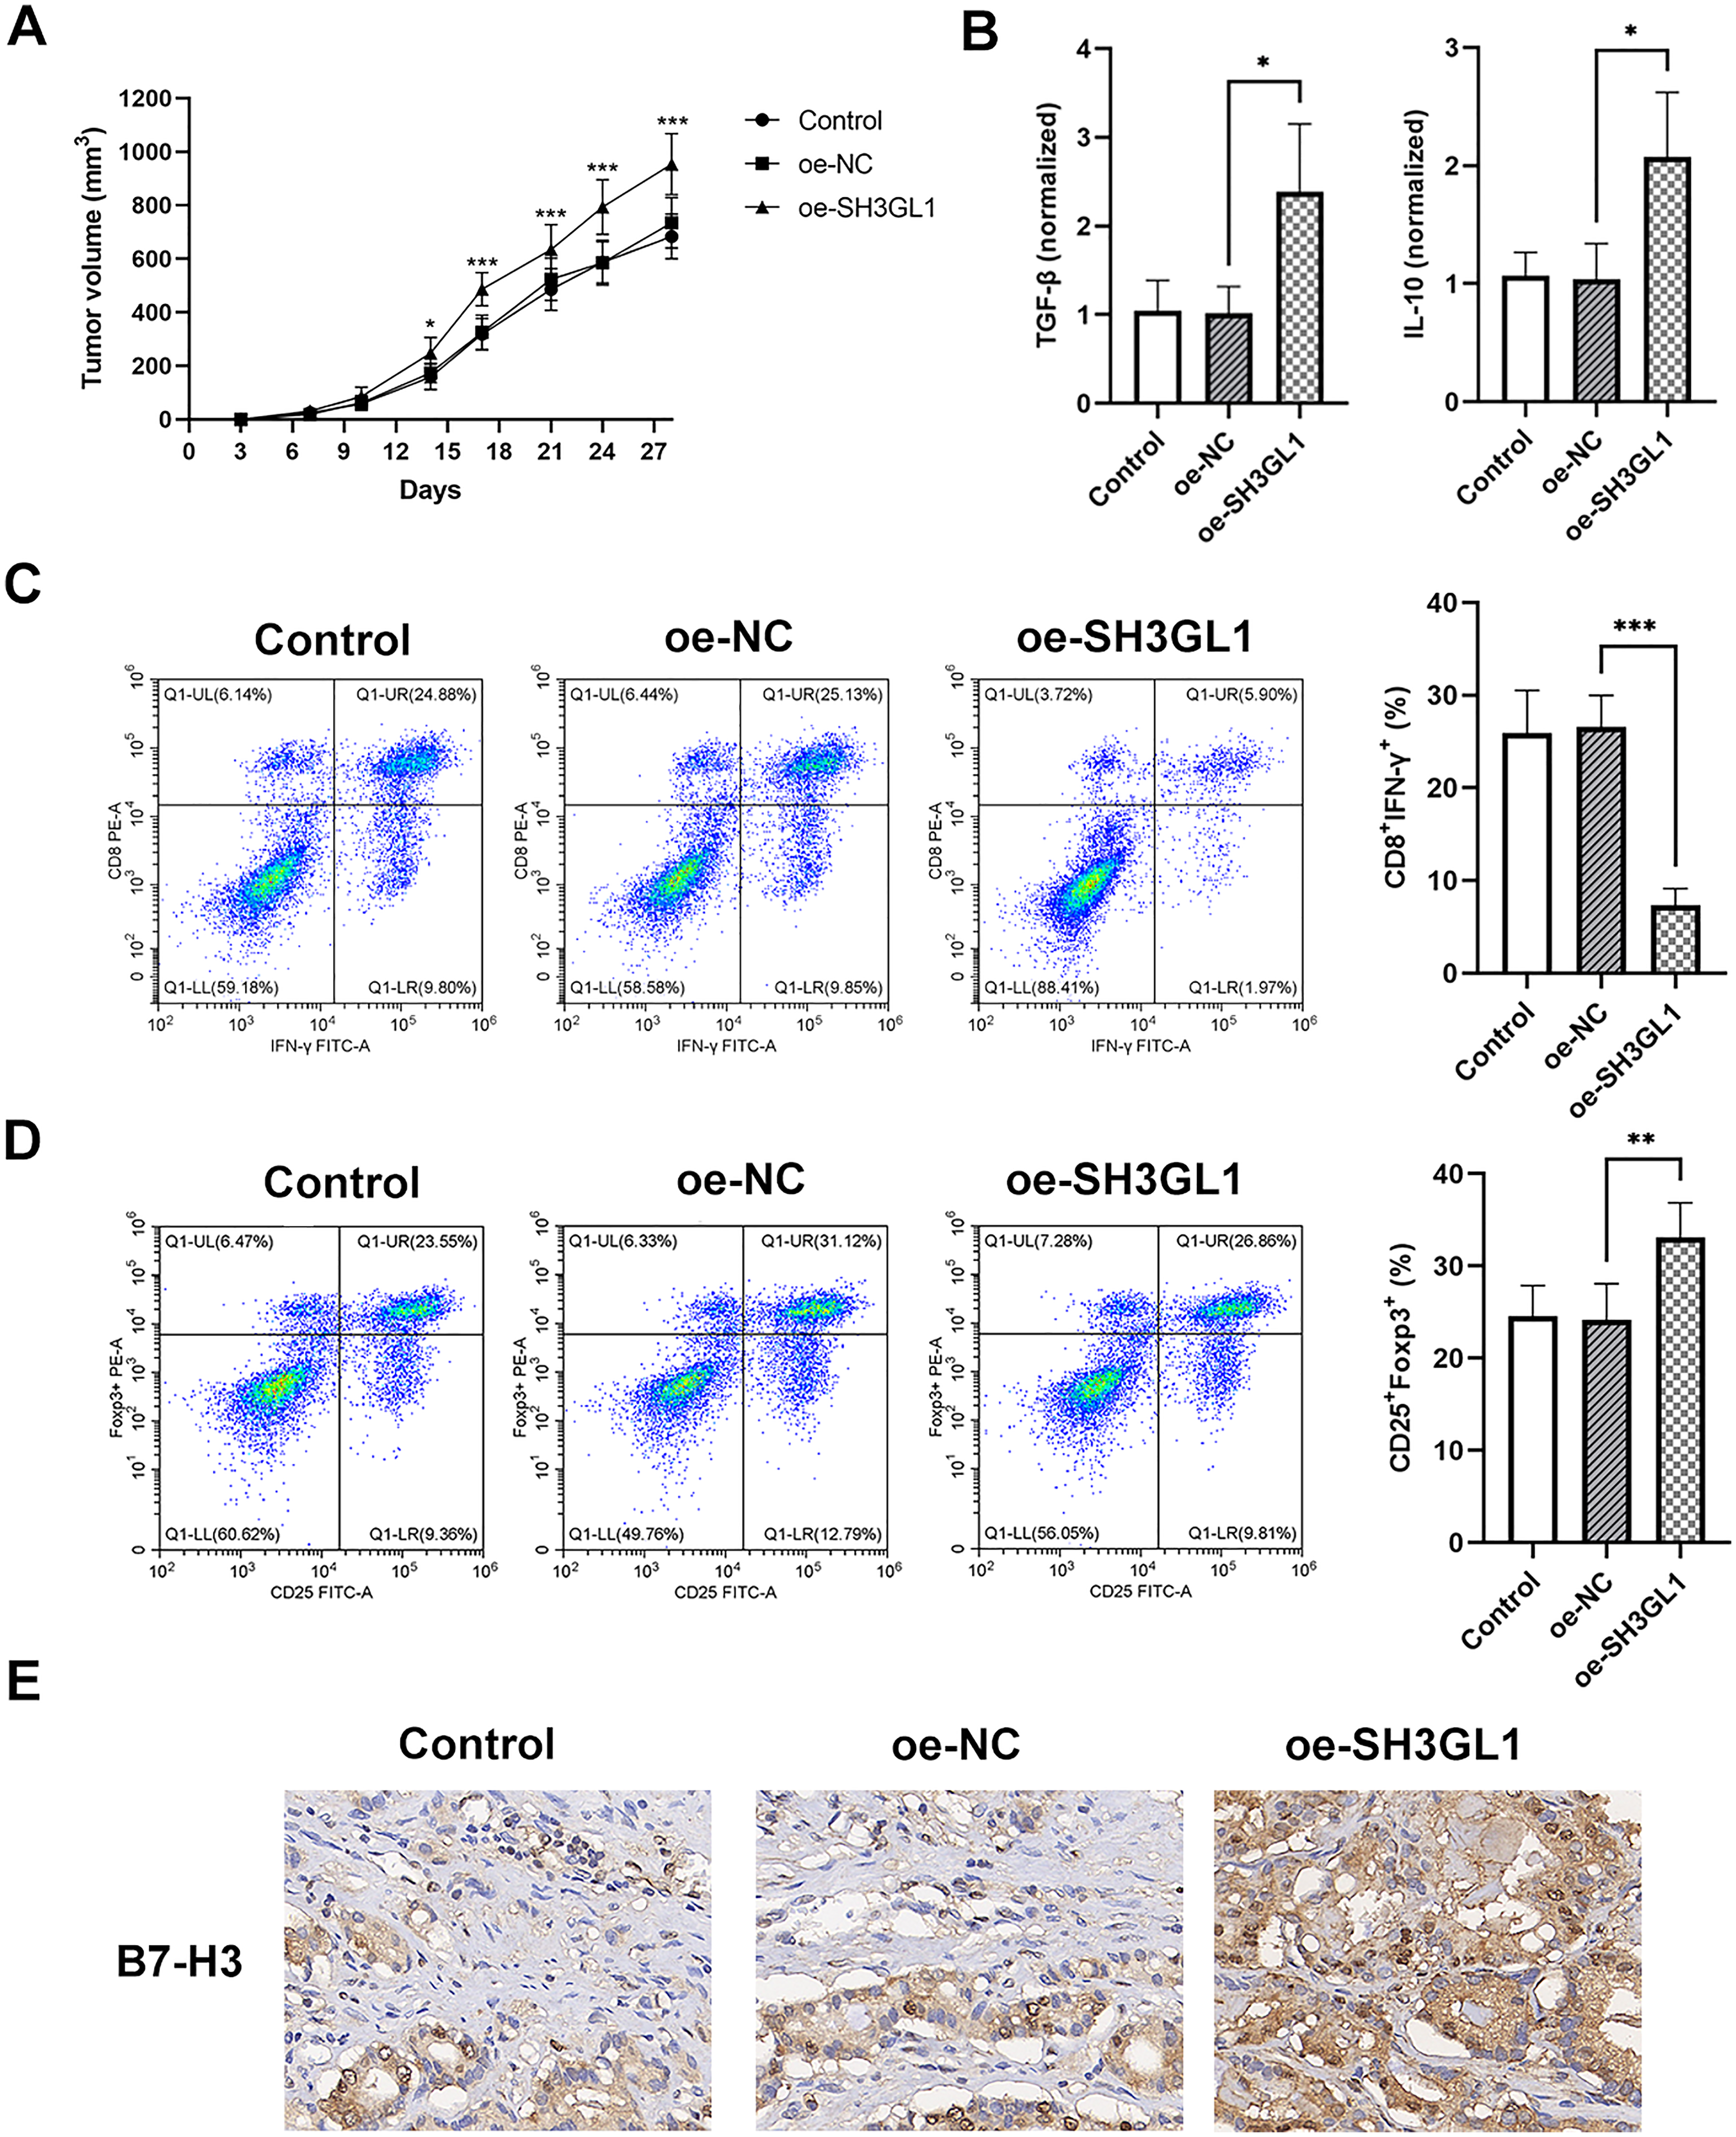
In vivo verification of the effect of SH3GL1 and B7-H3 on immune escape. (a) LLC cells were subjected to transfection and different groups of LLC cells were injected subcutaneously into the C57BL/6 mouse. Tumor growth curves during 28 days after inoculation. (b) Levels of TGF-β and IL-10 in tumor lysates. (c) Flow cytometry analysis showing T cell and (d) Treg infiltration in tumors, and CD8 + IFN-γ+ T cells and CD25 + Foxp3+ Treg cells were quantified. (e) IHC results showing B7-H3 positivity in the tumor. *P < 0.05, **P < 0.01, ***P < 0.001.
Discussion
NSCLC is a highly heterogeneous disease, and its treatment strategies have gradually shifted from traditional therapies to precision medicine and immunotherapy. Although targeted therapy and immunotherapy have significantly improved patient prognosis, drug resistance and immune escape remain the main challenges currently faced.30,31 This study provides new insights into how SH3GL1 may modulate the tumor immune microenvironment in NSCLC, potentially contributing to immune regulation. In this study, the expression of the immune checkpoint molecule B7-H3 was found to be significantly upregulated in LUAD and LUSC clinical samples and NSCLC cell lines, and was positively correlated with the expression of SH3GL1. According to previous studies, B7-H3 is expressed at a low level in normal tissues, but is abnormally highly expressed in most malignant tumors (such as prostate cancer, ovarian cancer, colorectal cancer, etc.), and its high expression is significantly associated with poor prognosis of patients.32–34 As a molecule with dual immune-regulatory functions, B7-H3 promotes pancreatic cancer and glioblastoma tumor immune escape and progression,35,36 making it a hot target for tumor diagnosis and treatment research. 19 Although research on B7-H3 in NSCLC is still in its infancy, recent in vitro models and phase I/II clinical evidence highlight its potential as a therapeutic target, and strategies such as CAR-T cells and antibody therapy have shown anti-tumor activity and immunomodulatory effects in NSCLC.37–39
Although the exact function and receptor of B7-H3 have not been fully elucidated, immune-related therapies developed based on it have shown great potential for clinical application. 13 This study found that SH3GL1 further enhances the immunosuppressive function of B7-H3 by forming a complex with B7-H3 and promoting its recycling to the cell surface rather than entering the lysosomal degradation pathway. This discovery provides a new perspective on the regulatory mechanism of B7-H3 and suggests a potential involvement of SH3GL1 in modulating tumor immune responses.
Herein, SH3GL1 overexpression led to increased expression of B7-H3 on the cell surface, which was associated with decreased T cell proliferation and cytotoxic activity, while promoting the secretion of immunosuppressive cytokines (such as IL-10 and TGF-β). These results are consistent with previous studies on B7-H3 inhibiting immune responses in the tumor microenvironment, but this study revealed for the first time the mechanism by which SH3GL1 enhances its immunosuppressive function by regulating the recycling of B7-H3. In addition, SH3GL1 overexpression also suppressed the effector function of tumor-infiltrating CD8+ T cells and increased Treg cell infiltration in tumor-bearing mouse models, further confirming its important role in tumor immune escape. In breast cancer studies, SH3GL1 expression is higher in triple-negative breast cancer cells and drives tumor growth and metastasis by promoting EGFR internalization and signal transduction. 40 However, in HER2-positive breast cancer, SH3GL1 enhances the sensitivity of trastuzumab treatment by promoting HER2 internalization. 41 These studies have shown that the function of SH3GL1 is significantly context-dependent. This study found that in NSCLC, SH3GL1 promotes immune escape by regulating the recycling of B7-H3, which is different from its mechanism of action in breast cancer. This functional diversity suggests that SH3GL1 may play a role in different tumor types through different molecular mechanisms, which provides a theoretical basis for the development of precision treatment strategies for specific tumor types.
While our study provides important correlative evidence linking SH3GL1 and B7-H3 to immune suppression in NSCLC, certain limitations should be acknowledged. Although several functional assays were performed to evaluate CD8+ T cell activity, direct measurements of exhaustion markers such as programmed cell death protein-1 (PD-1), or T cell immunoglobulin and mucin domain-containing protein 3 (TIM-3) were not included. Future studies incorporating these markers will be essential to fully define the exhaustion status of tumor-infiltrating T cells. Additionally, NCI-H520, a LUSC cell line, was selected due to its high basal expression of SH3GL1 and B7-H3. While this allowed us to explore their mechanistic interplay in immune evasion, LUSC generally shows lower immunotherapy responsiveness and fewer actionable mutations than LUAD. Therefore, further studies in LUAD-derived models and patient-derived tumor tissues will be necessary to validate the generalizability of our findings across NSCLC subtypes.
In summary, the high expression of SH3GL1 in NSCLC and its positive correlation with B7-H3 suggest that it may enhance the immune escape ability of tumors by regulating the endocytosis and stability of B7-H3. In the future, in-depth research on the molecular mechanism between SH3GL1 and B7-H3 and its role in the tumor microenvironment will not only help to reveal the immune escape mechanism of NSCLC, but also provide a theoretical basis for the development of combined treatment strategies based on SH3GL1 and B7-H3. For example, inhibitors targeting SH3GL1 or combined immune checkpoint inhibitors may provide new treatment directions for overcoming the bottleneck of NSCLC treatment.
Footnotes
Ethics approval
All animal experiments were approved by the Affiliated Tumor Hospital of Xinjiang Medical University (XCULAE-20240415014) and conducted in accordance with the National Institutes of Health Guide for the Care and Use of Laboratory Animals.
Authors’ contributions
S.N. and C.L. contributed to the concept, design, investigation, and writing. Both authors approve the final version of manuscript.
Funding
The authors received no financial support for the research, authorship, and/or publication of this article.
Declaration of conflicting interests
The authors declared no potential conflicts of interest with respect to the research, authorship, and/or publication of this article.
Data availability
The datasets used and/or analyzed during the current study are available from the corresponding author on reasonable request.