
Abstract
Introduction
In ovarian cancer, expression of metabolism-related markers has been investigated in several studies focusing on individual markers; however, a parallel quantitative evaluation of markers mapping to distinct metabolic processes and their prognostic value in large patient cohorts is still lacking.
Methods
Here, by using immunohistochemistry followed by digital pathology, we investigated the expression of several markers related to glycolysis including monocarboxylate transporter 1 and 4 (MCT1, MCT4), glutamine metabolism (glutaminase, GLS) and hypoxia/acidosis (carbonic anhydrase 9, CA IX) in tissue microarrays of > 300 patients recruited in the MITO16A clinical trial, which involved treatment of ovarian cancer patients with carboplatin/taxol plus bevacizumab.
Results
Regarding the prognostic impact of these markers, results indicate that GLS expression correlated with progression-free survival, but this effect disappeared when data were corrected for multiple testing. All other markers showed no correlation with clinical outcome.
Conclusion
These results indicate marked heterogeneity of expression of metabolism-associated markers in ovarian cancer; however, there was a lack of association with clinical benefit after chemotherapy/anti-vascular endothelial growth factor treatment. Notwithstanding the lack of prognostic value, knowledge of the pattern of expression of these biomarkers in tumors can be useful for patient stratification purposes when new drugs targeting these metabolic pathways will be tested.
Introduction
Metabolic disregulations have been largely uncovered and collectively represent a hallmark of cancer. However, metabolic classification of tumors is not yet a routine test in clinical practice for individual patients. One reason behind this is the lack of clear association of metabolism-associated biomarkers with response to treatment, at variance, for instance, with some well-established actionable genetic markers of tumors. An additional issue in this field is the lack of technology that could easily be used to interrogate the metabolic set-up of tumors by using routine archival tumor samples. Advanced technologies, including metabolomics and metabolic flux analysis, are key to decoding the heterogeneous metabolic preferences and dependencies of tumors in vivo. However, their wide application is limited due to high costs, specialized personnel requirements, and lack of information regarding intra-tumor spatial metabolic heterogeneity. 1 Recently, some pre-clinical studies have demonstrated that classification of ovarian cancer (OC) and lung cancer tumor xenografts can be achieved by using by using immunohistochemistry (IHC) and digital pathology offering a more accessible alternative.2,3 These studies propose metabolic classification of tumors by using—as proxy—selected protein markers including transporters of certain metabolites or key enzymes of specific biochemical pathways. Glycolysis is the best-known biochemical pathway disregulated in tumors; alterations of glycolysis in OC have been previously reported, 4 although their prognostic value is controversial.5–7 Disregulated glycolysis in the context of solid tumors can depend on several factors, one of them being represented by hypoxia, which leads to upregulated glycolysis mainly due to the stabilization of the HIF-1a transcription factor. On its own, increased glycolysis can account for acidosis in the tumor microenvironment, mainly due to the accumulation of lactate, the final product of glycolysis. Notably, solid tumors disclose marked metabolic heterogeneity, and some tumors could have activation of metabolic pathways other than glycolysis, as shown by studies reporting transcriptome-based metabolic classifications of cancer.8–10 In particular, glutamine metabolism is often upregulated in OC. 11 This metabolic pathway seems to correlate with certain biological features of tumor cells as well as with chemotherapy response.12,13 Because of the importance of glutamine metabolism in OC, new drugs targeting glutaminase and other key enzymes in this biochemical pathway have been developed and are currently being tested. 14
Here, we selected some markers including monocarboxylase transporters 1 and 4 (MCT1, MCT4), glutaminase (GLS) and carbonic anhydrase IX (CA IX), which, based on literature data,15–18 we consider reliable proxies of glycolysis, glutamine metabolism, and hypoxia/acidosis, respectively. Although we acknowledge that a narrow selection of metabolic markers could cover only part of the well-known metabolic heterogeneity of cancer, we assessed their expression at the protein level by using IHC and quantification by digital pathology. These markers were used to interrogate metabolic features of a large cohort of OC samples obtained from patients participating in the multicenter MITO16A phase IV, single-arm, clinical trial. 19
Material and Methods
Description of the study
The MITO16A/MaNGO-OV2 (www.clinicaltrials.gov number: NCT01706120 or EudraCT number: 2012-003043-29, hereafter indicated as MITO16A) is a single-arm, multicenter, open-label, non-comparative, phase IV trial of first-line chemotherapy (carboplatin plus paclitaxel) and bevacizumab, followed by bevacizumab as single agent until progression or up to 22 total cycles. 19 Overall, 398 patients were prospectively enrolled from 47 participant centers. Twelve research groups designed the trial as an exploratory study and no “a priori” hypothesis was defined to calculate the sample size of the trial. The primary aim of the MITO16A was to study clinical and biological factors for their value as prognostic factors for progression-free survival (PFS) or overall survival (OS) among patients receiving chemotherapy and bevacizumab as a first-line treatment. Data were collected through https://usc-intnapoli.net website. All participants signed an informed consent for both the clinical and translational part before entering the study.
Due to space limits, details about sample collection and review, preparation of tissue microarray (TMA), histology and immunohistochemistry, image acquisition and analysis are reported under Supplementary Information.
Statistical analysis
Continuous variables were described with median values and interquartile range (IQR), qualitative variables were expressed in terms of absolute numbers and relative frequency. For all biomarkers analyzed, a histogram was used to describe the distribution and to check the presence of high frequencies of zero values. The correlation between biomarkers was assessed using Spearman's correlation coefficient, which accommodates non-linear relationships, and a 95% confidence interval (CI) was calculated. Additionally, pairwise scatter plots were created to visualize the associations between biomarkers. If they are found to be associated, a joint analysis will be conducted; otherwise, each biomarker will be analyzed independently. The associations between each biomarker and the clinical prognostic factors were investigated using the Wilcoxon rank sum test for dichotomous variables and the Kruskal–Wallis test for categorical variables. When the percentage of zero values exceeded approximately 30%, we performed a Wilcoxon rank test (ZIW) or the Kruskal–Wallis zero inflated (ZIKW) modified for zero-inflated data. 20
The prognostic effect of each biomarker was assessed through PFS and OS as endpoints. PFS was defined as the time between the study enrollment and the first instance of death from any cause or disease progression. OS was defined as the time between the study enrollment and death from any cause. Kaplan–Meier curves were plotted for PFS and OS and compared using a two-sided log-rank test. Univariable and multivariable Cox proportional hazard models were employed to test the prognostic effect of each biomarker on both PFS and OS. In univariable analysis, biomarkers were initially tested as continuous variables after confirming linearity assumptions, utilizing fractional polynomial analysis, and as categorical variables after determining the optimal cut-off value minimizing the hazard ratio (HR) P-value. This search for the best cut-off value was conducted on PFS and then applied to OS. Multivariable analysis for each biomarker (both continuous and categorical effects) was performed, adjusting for covariates such as age (<65 vs. ≥ 65), Eastern Cooperative Oncology Group (ECOG) performance status (0 vs. 1–2), residual disease (none; < 1 cm; > 1 cm; not operated), FIGO stage (III vs. IV), and tumor histology (high-grade serous vs. other), as defined in the manuscript reporting the clinical trial results. To account for and adjust estimates for overfitting, a shrinkage procedure with a 95% CI calculated using the bootstrap method was employed. A data analysis was conducted using R software version 4.2.1 (2022, The R Foundation for Statistical Computing).
Results
In total, 398 patients were enrolled in the study and agreed to donate their samples for translational studies. Of these, 385 patient samples were sent to peripheral research centers for translational biomarker analyses (Supplementary Figure S1). Seventy-four patients were excluded at this stage for technical reasons (Supplementary Figure S1). Some samples were excluded because data were not available due to technical problems. Data for all four biomarkers (MCT1, MCT4, GLS, CA IX) were complete for 291 patients. No differences in clinical and pathological variables were observed between patients included in biomarker analyses (n = 291) and the whole MITO16A trial population (n = 398) (Supplementary Table S1).
Patient characteristics for the 291 patients with available biomarker expressions are reported in Supplementary Table S1. Clinical features including age, ECOG performance status, residual disease, FIGO stage and tumor histology were similar between the biomarker study population and the MITO16A population. Among the studied cohort, the median age was 58.9 years (IQR 49.8–66.3), with 85 patients (29.2%) ≥ 65 years old. At diagnosis, most patients showed a good performance status PS ECOG 0 (80.1%) and FIGO stage IIIC (71.5%). According to the central histological revision, high-grade serous carcinoma (HGSC) was the most common histological type (86.6%) (Supplementary Table S1).
The correlation plot presented in Figure 1 shows the correlation among the markers MCT1, MCT4, GLS, and CA IX. MCT4 and CA IX are well known transcriptional targets of HIF-1α, which is often stabilized in tumors due to hypoxia or underlying genetic alterations in tumor cells.21,22 Therefore, we tested the possible correlation between MCT4 and CA IX expression. However, results did not disclose any correlation between the expression of MCT4 and CA IX in these samples (Figure 1(a)).
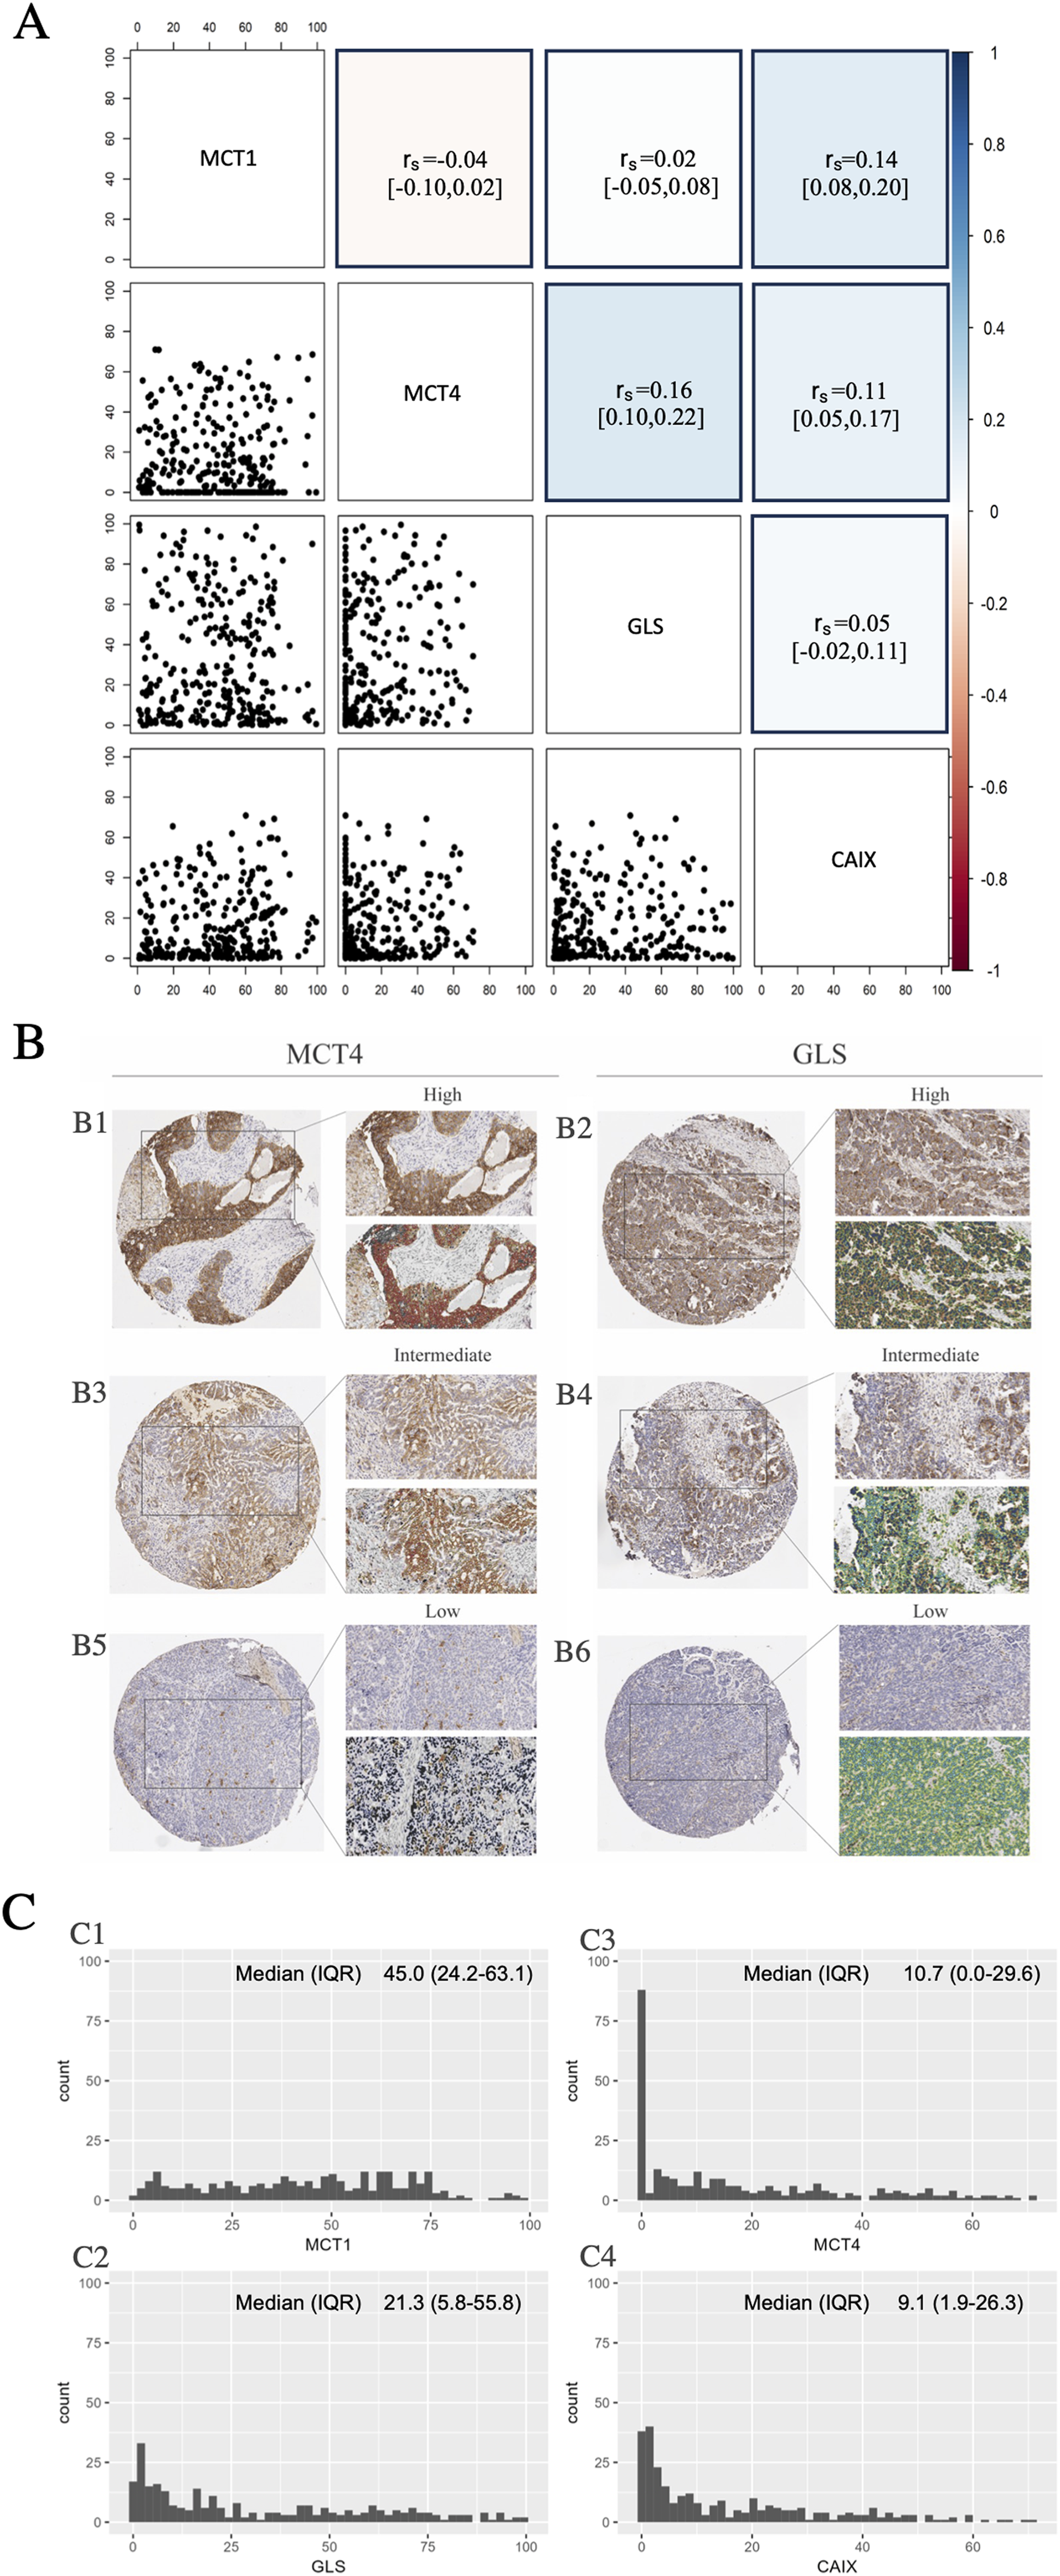
Metabolic biomarkers evaluation. (a) Pairwise distribution of biomarkers. The correlogram plot reports the Spearman correlation with 95% confidence interval. On the right is shown the color scale used. (b) Immunohistochemical staining of MCT4 and GLS with membrane and cytoplasmic positivity respectively on the tissue microarray (TMA) core (original magnification 2×) and the detail of an enlarged field (original magnification 20×). The same samples show the mark-up of the analyzed tissue quantified with the Aperio membrane algorithm (MCT4) and Aperio cytoplasmic algorithm (GLS). The three panels show different levels of positivity: (b1) and (b2) are highly positive, (b3) and (b4) intermediate, and (b5) and (b6) negative positivity. (c) Shows the distribution of (c1) MCT1 espression, (c2) MCT4 espression, (c3) GLS espression, and (c4) CA IX espression. The Y-axes show the percentage of individuals with a given interval of MCT1-MCT4-GLS-CA IX expression. The median with IQR was also reported, as a measure of central tendency for a skewed dataset.
The most correlated biomarkers are GLS and MCT4, although this correlation should be considered negligible. Finally, since cell proliferation is a main driver of metabolic alterations in tumors, 23 we investigated the possible correlation between expression of these markers and Ki67. Results disclosed that the biomarkers analyzed were not associated with cell proliferation. Since no significant association was found among these biomarkers, subsequent analyses were carried out independently for each biomarker, treating them as distinct entities in the prognostic evaluations.
Expression of MCT1, MCT4, GLS, and CA IX in TMA samples from the MITO16A clinical trial
Expression of the various biomarkers was investigated in TMA cores by IHC followed by digital pathology, as described in the Materials and Methods section. Figure 1(b) illustrates the analysis of MCT4 and GLS, which are representatives of membrane and cytoplasmic positivity, respectively. Tumor samples were categorized into high/intermediate/low expression levels based on their respective biomarker expression levels. The staining patterns of MCT1 and CA IX were superimposable to those of MCT4 (membrane staining) and are therefore not shown in the figure.
Expression of these biomarkers was evaluated in tumor samples from 311 patients. However, some samples (range 4–19) were excluded due to technical problems. Therefore, the number of patients analyzed for each individual biomarker is as follows: 298 for MCT1, 308 for MCT4, 292 for GLS, and 307 for CA IX.
As expected, MCT1 was specifically expressed at the cell membrane of tumor cells. The median expression of MCT1 is 45% (IQR 24.2%–63.1%). The distribution of MCT1 expression is reported in Figure 1(c).
MCT4 was expressed at the cell membrane, mainly in tumor cells (Figure 1(b1), (b3), (b5)). The distribution of MCT4 expression was reported in Figure 1(c3). As shown in the figure, there are 30% zero values; therefore, the analyses considered the inflation of zeros. GLS was expressed in the cytoplasm, mainly in tumor cells (Figure 1(b2), (b4), (b6)). The distribution of GLS expression is shown in Figure 1(c1). Finally, CA IX was expressed at the cell membrane, mainly in tumor cells. The distribution of CA IX expression is shown in Figure 1(c4).
In conclusion, these results indicate that there is broad expression of the four biomarkers in OC samples, with highest median values for MCT1, followed by GLS, MCT4, and CA IX. The expression pattern of each of the biomarkers followed predictions, with predominant membrane expression of MCT1, MCT4, and CA IX and predominant cytoplasmic expression in the case of GLS. Finally, very low levels of correlation among the biomarkers were shown.
Evaluation of MCT1, MCT4, GLS, and CA IX as prognostic biomarkers
We subsequently investigated the possible association of these biomarkers with clinical factors. We first verified the association with known clinical prognostic factors, such as age, tumor histology, FIGO stage, ECOG performance status (PS), and residual disease.
MCT1 expression was significantly associated only with tumor histology showing high values of MCT1 in high-grade serous histology (P = 0.038, Figure 2(a)). Notably, MCT4 expression was significantly correlated only with ECOG PS, with MCT4 expression higher in patients with PS 1–2 compared with patients with PS 0 (Figure 2(b)). No other association was found.
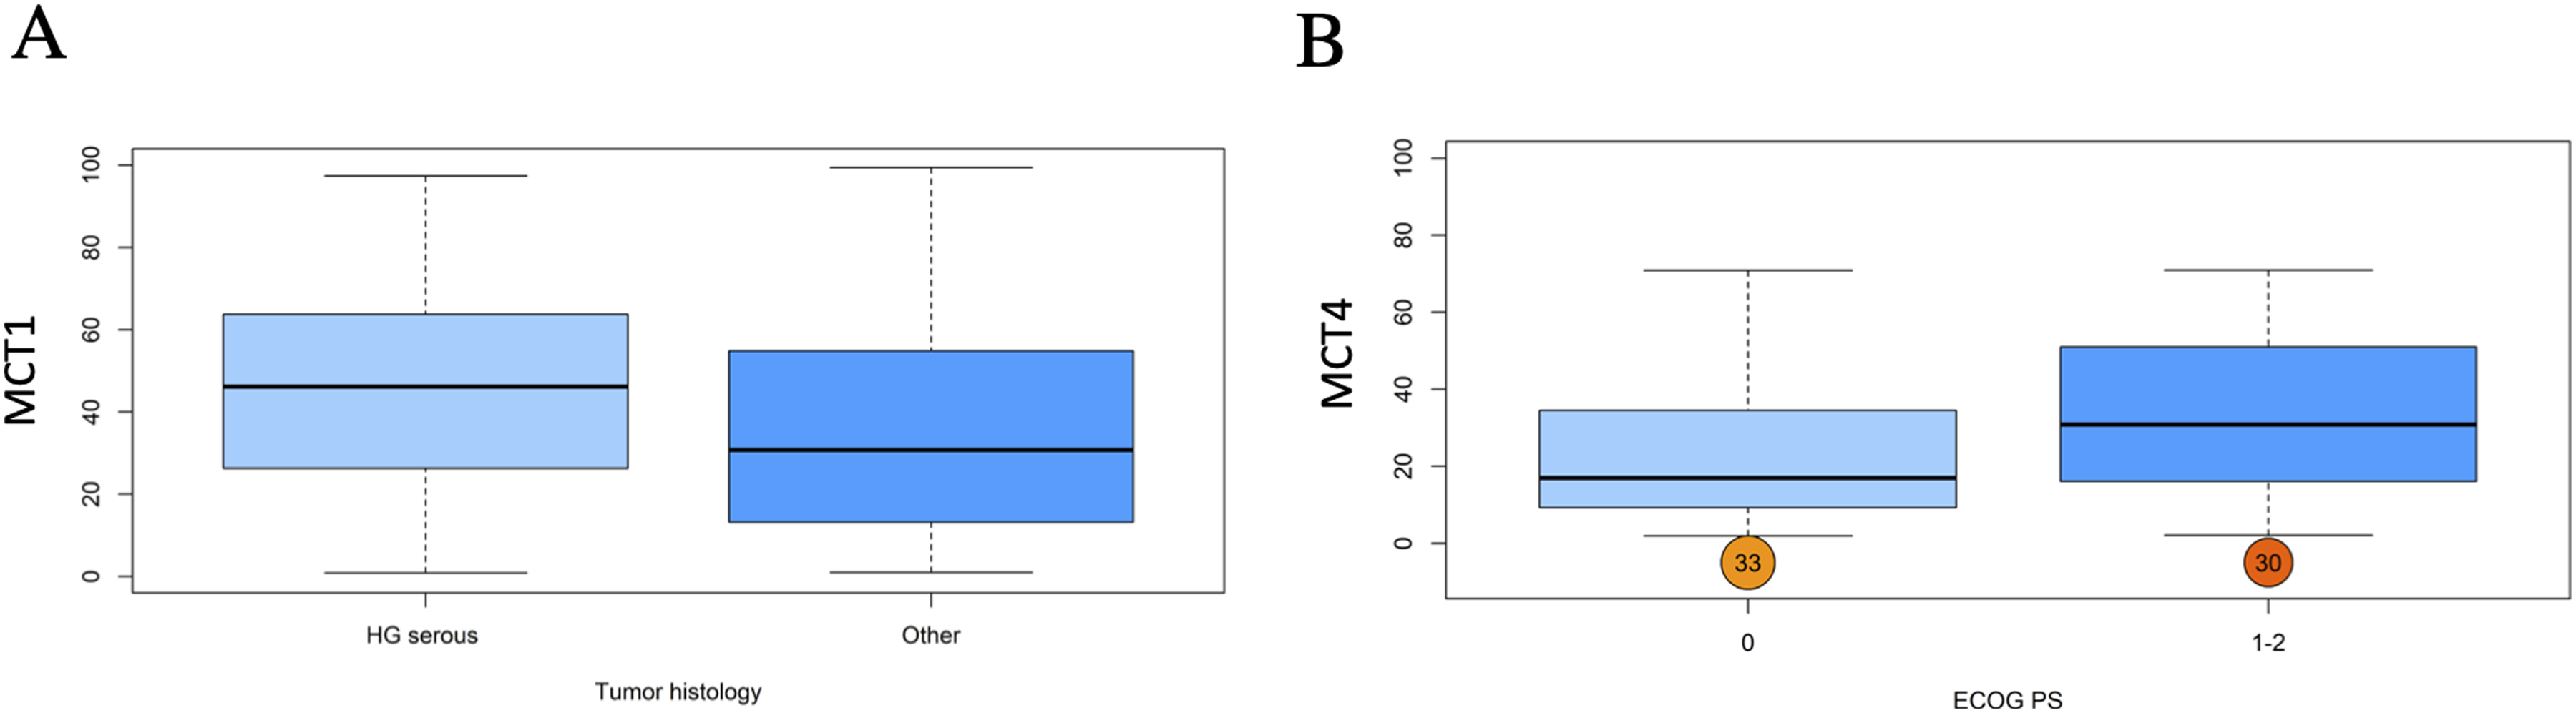
Box whisker plots showed the association between tumor histology (high grade serous vs. other) and (a) MCT1 expression and the association between ECOG performance status (0 vs. 1–2) and (b) MCT4 expression.
Expression of all biomarkers was not significantly associated with PFS and OS when biomarker expression was analyzed as a continuous variable in univariate and multivariate Cox models (HR and 95% CI are reported in Table 1). In both cases (PFS and OS) using fractional polynomial, the final model for the biomarker was found to have only linear effects.
Univariate and multivariate analysis for MCT1, MCT4, GLS, CA IX as a continuous variable for PFS and OS.
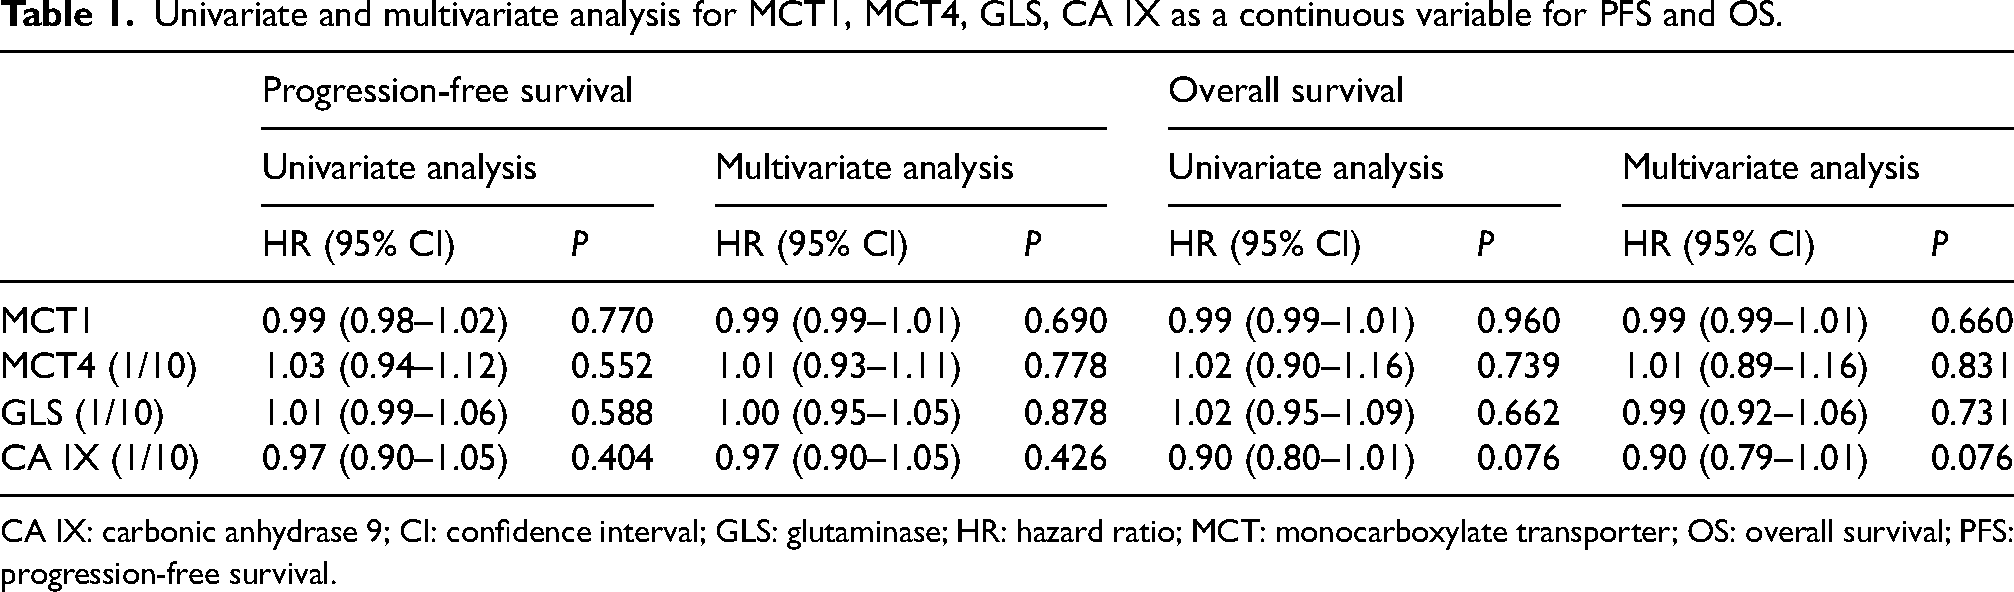
CA IX: carbonic anhydrase 9; CI: confidence interval; GLS: glutaminase; HR: hazard ratio; MCT: monocarboxylate transporter; OS: overall survival; PFS: progression-free survival.
The best cut-off analysis indicated a value of 62.73% for MCT1, with n = 76 tumor samples (25.5%) disclosing an MCT1 expression value that exceeded such a cut-off value. A value of 51.90% for MCT4, with n = 27 tumor samples (9.2%) disclosing an MCT4 expression value that exceeded such a cut-off value. A value of 2.34% for GLS, with n = 252 tumor samples (86.3%) disclosing a GLS expression value that exceeded such a cut-off value, and a value of 1.83% for CA IX, with n = 234 tumor samples (76.2%) disclosing a CA IX expression value that exceeded such a cut-off value. The Kaplan–Meier curves for PFS and OS, categorized by groups defined by cut-off values (low: biomarker ≤ cut-off value; high: biomarker > cut-off value), are shown in Figure 3.
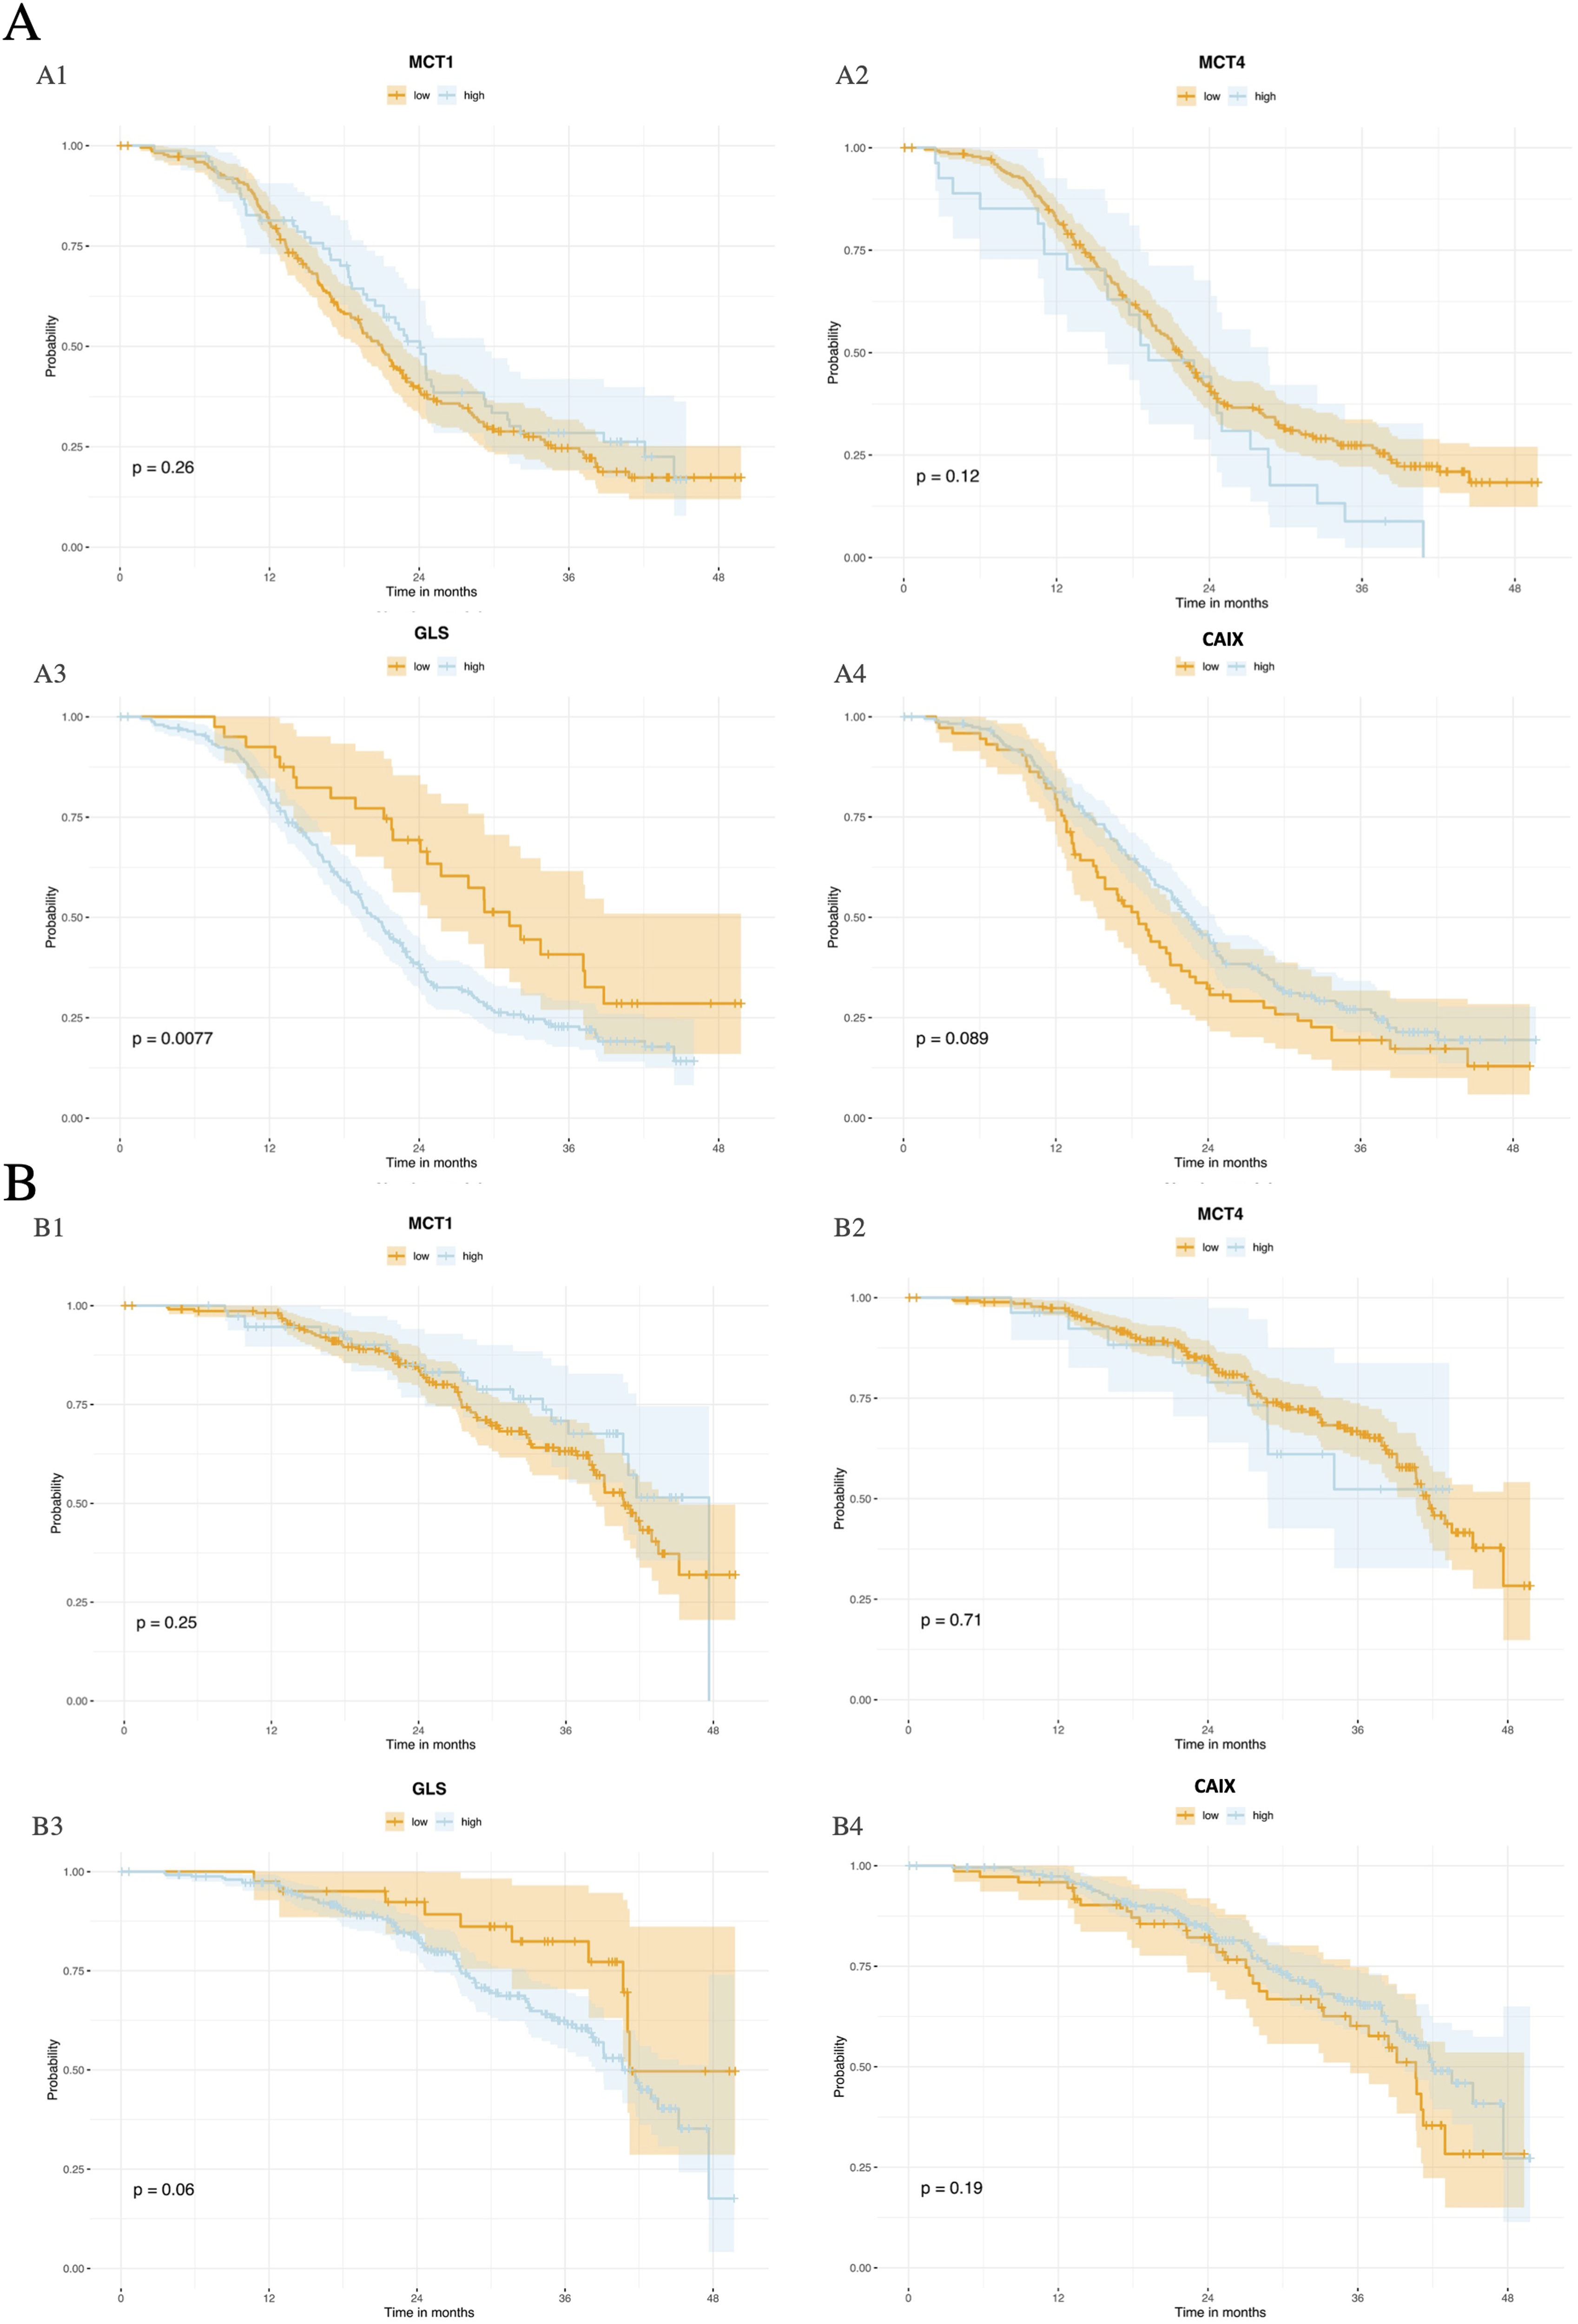
Kaplan–Meier curves evaluating the PFS of patients according to (a1) MCT1, (a2) MCT4, (a3) GLS and (a4) CA IX, as dichotomized around the cut-off value of each expression and Kaplan–Meier curves evaluating the OS of patients according to (b1) MCT1, (b2) MCT4, (b3) GLS, and (b4) CA IX, as dichotomized around the cut-off value of each expression.
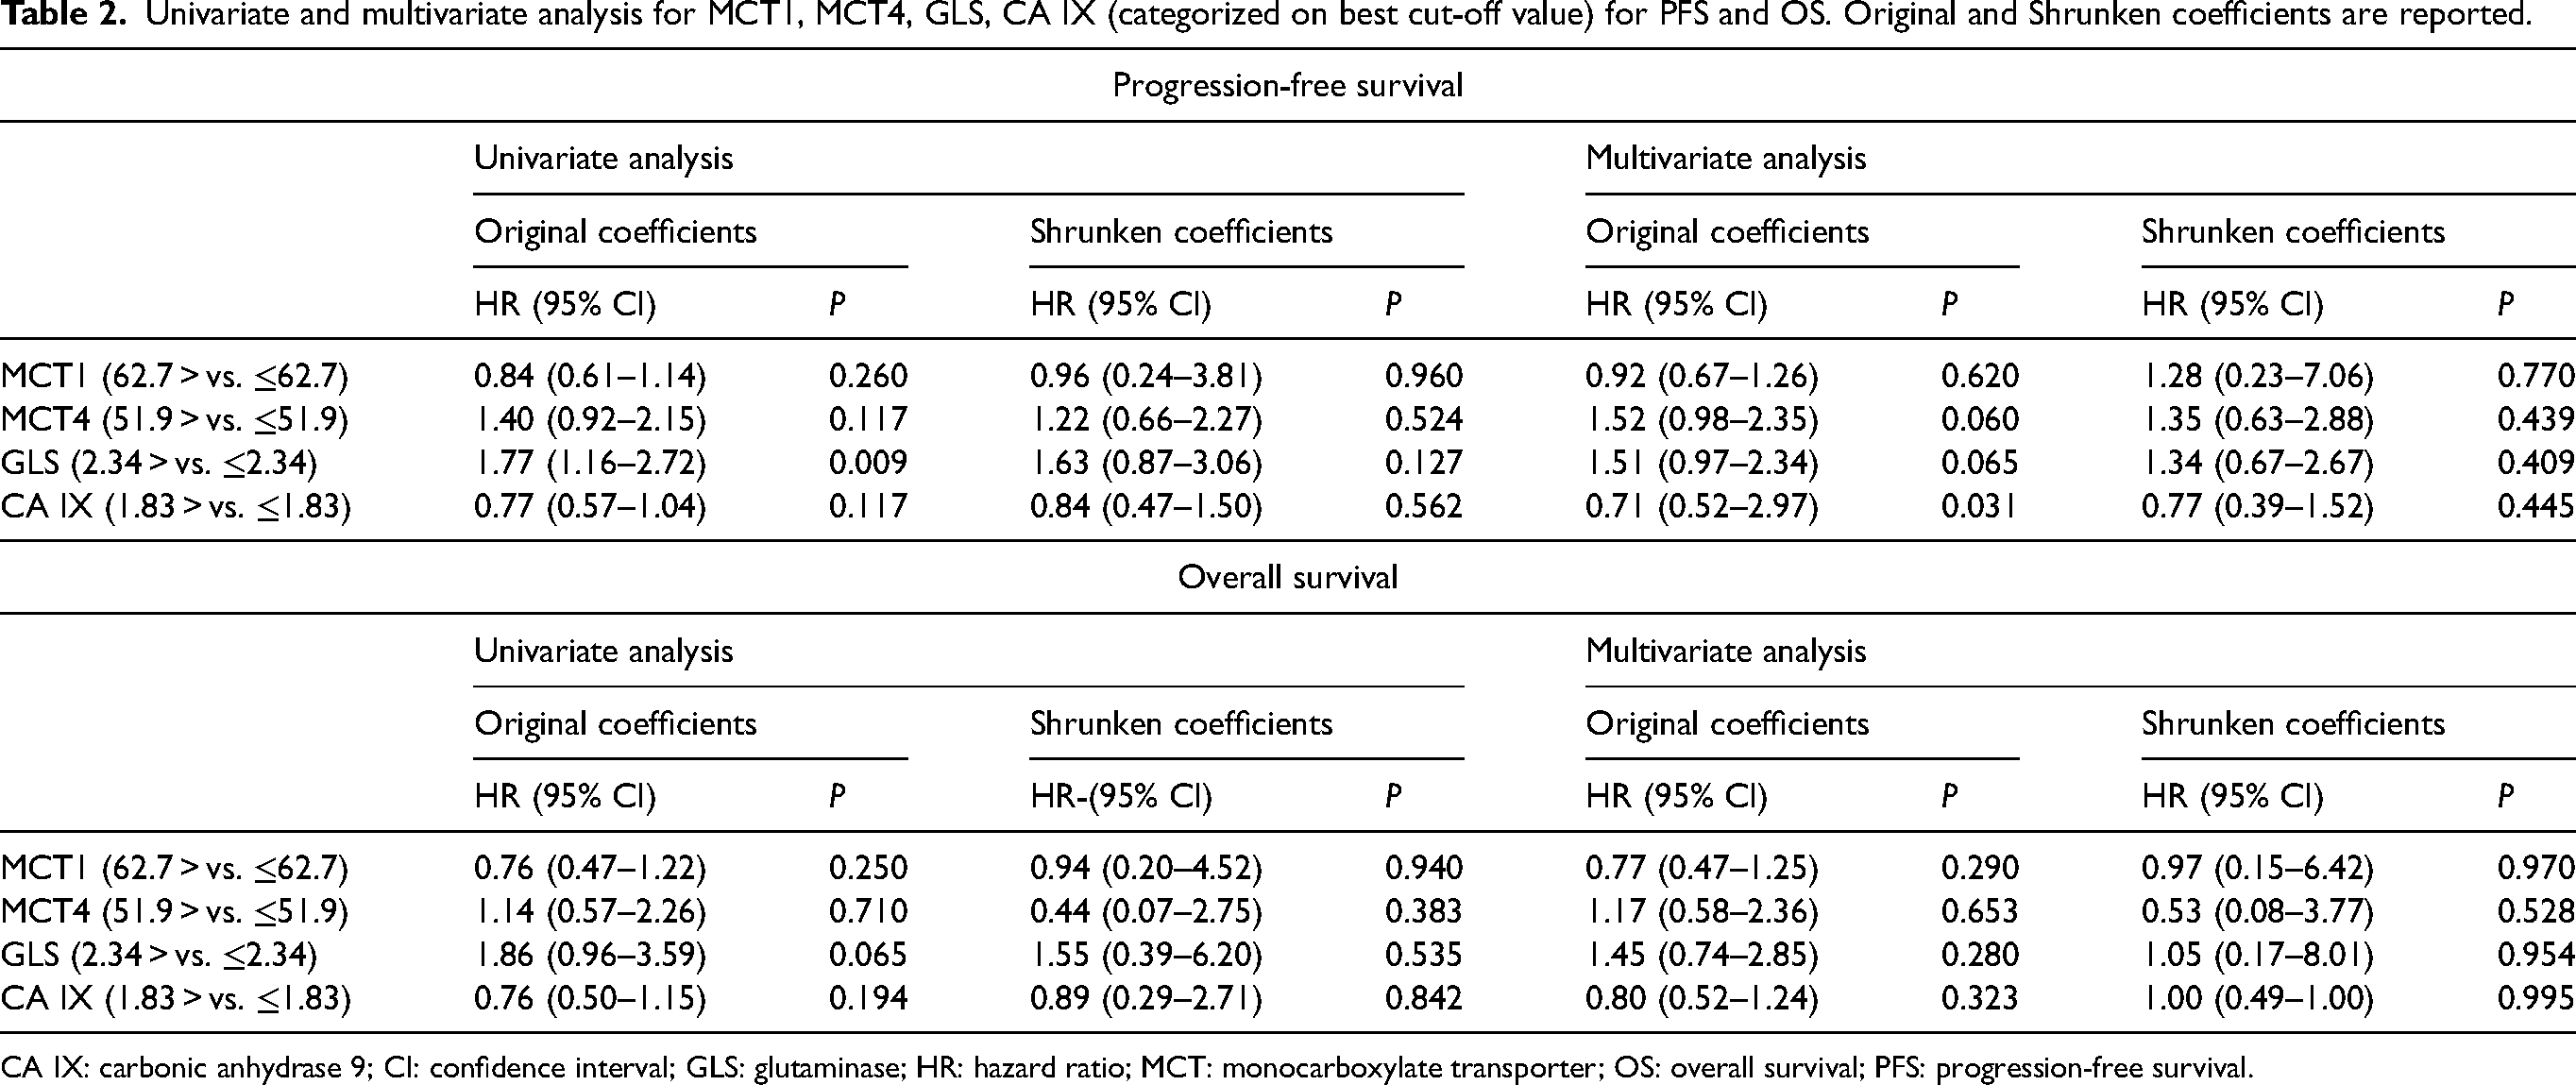
In a univariate analysis considering biomarker cut-off values, GLS appeared associated with PFS (HR 1.77, 95% CI (1.16–2.72), P = 0.009) but not with OS. In a multivariate analysis using best cut-off values, CA IX was associated with OS (HR 0.71, 95% CI (0.52–2.97), P = 0.031).
However, using the shrinkage procedure with bootstrap CIs to adjust for overfitting due to best cut-off multiplicity testing, no biomarker was significantly associated with either PFS or OS (Table 2).
Univariate and multivariate analysis for MCT1, MCT4, GLS, CA IX (categorized on best cut-off value) for PFS and OS. Original and Shrunken coefficients are reported.
CA IX: carbonic anhydrase 9; CI: confidence interval; GLS: glutaminase; HR: hazard ratio; MCT: monocarboxylate transporter; OS: overall survival; PFS: progression-free survival.
Discussion
Upregulated glycolysis under aerobic conditions and upregulated glutamine metabolism are two metabolic alterations reported in tumors essential to sustain macromolecule synthesis and cell proliferation. 24 IHC represents one possibility to interrogate tumor metabolic features in solid tumors, which is particularly valuable to analyze large cohorts of samples; this can be done by investigating the expression of certain protein markers associated with fundamental metabolic pathways. Quantitative analysis of metabolism-associated markers by digital pathology represents a further key step to improve the quality of data and enable statistical analysis based on input of data as continuous values.
Inspired by this rationale, we investigated the expression of MCT1, MCT4, GLS, and CA IX in a large cohort of OC patients treated with chemotherapy plus bevacizumab in the context of the MITO16A clinical trial. 25 Although this single-arm trial was not designed to enable investigation of predictive biomarkers associated with response, we considered it particularly interesting. The reason is because anti-VEGF therapy, which was part of the drug combination received by all patients, has been associated, both in pre-clinical models26,27 and in some clinical trials, 27 with metabolic alterations in tumors, and it has been speculated that certain metabolic traits of tumors might correlate with the response to anti-angiogenic drugs. 28
Results confirmed the substantial metabolic heterogeneity of OC, in agreement with observations in previous studies which analyzed the expression of individual markers in OC samples.12,29–33 However, we did not find a clear prognostic role of any of these markers in the MITO16A patients analyzed. Among the four markers analyzed, GLS expression was associated with worse PFS in the univariate model, which was in line with previous observations, 11 and CA IX expression was associated with worse OS in the multivariate model. However, these results were not confirmed following the shrinkage procedure with bootstrap CIs. This result is in line with conclusions of a previous study, 34 which described CA IX as an independent negative prognostic marker only in endometrioid OC and not in the more common high-grade serous histotype. Finally, despite the well-known connections between metabolic alterations and cell proliferation, 35 we did not find any significant association between proliferation (Ki67) and GLS or other markers analyzed. Regarding GLS, it should be mentioned that several studies investigated its expression in OC as well as the effects of its perturbation on the response to chemotherapy. GLS over-expression has been associated with platinum resistance, 12 and in vitro modulation of its levels by siRNA or GLS inhibitors has been found to promote sensitivity of OC cells to cytotoxic drugs such as platinum and paclitaxel12–14 or PARP inhibitors. 20 Altogether, these studies underscore the central role of GLS in OC metabolism and its growing appreciation as a potential therapeutic target. In this respect, our results provide protein expression data of GLS on a very large cohort of samples that could be useful for patient stratification purposes based on target expression in future translational studies.
The strengths of our study are represented by the large number of samples analyzed, the large dataset of clinical information available, the exploitation of a quantitative method of assessment of metabolism-associated biomarkers plus a robust statistical analysis, including correction for multiple testing, and the analysis in the same study of multiple markers belonging to different metabolic pathways. These features clearly distinguish this work from previous studies in the same field.11,29,30,33,34
On the other hand, we acknowledge several limitations in our study. One technical limitation lies in the assessment of biomarker expression using selected tumor cores, which poses challenges for biomarkers with heterogeneous expression, such as MCT4 and CA IX, which are typically found in hypoxic areas of the tumor. 36 Moreover, additional features of the tumor microenvironment, such as cancer-associated fibroblasts and immune cells, could influence the expression of metabolic markers. 4 Ideally, expression data would be collected from the entire tumor section, but the limited availability of tissue sections makes this difficult for large sample cohorts. A second limitation concerns the IHC process. Although performed using an automated stainer, there was some technical variability in the IHC procedure that was not precisely quantified for these four biomarkers. The third limitation is the narrow scope of metabolism-related biomarkers analyzed. While additional markers could provide a more comprehensive analysis of complex pathways like glucose or glutamine metabolism—potentially including other transporters or key enzymes—this was not feasible due to the limited availability of tissue sections. As a result, the study may have been constrained by the exclusion of potentially relevant biomarkers and pathways. Specifically, focusing on a limited set of metabolic markers may have restricted our ability to detect significant prognostic indicators. A broader, more integrative approach, incorporating other relevant pathways, could potentially yield more insightful results. Previous studies have investigated these metabolic pathways at the transcriptional level in tumors,5,7 but this omics approach also has limitations, such as the inability to identify the specific cells expressing the markers. Additionally, it remains unclear whether the expression patterns of metabolic pathway genes accurately reflect metabolic activities in patients. 35 To date, no metabolic signature based on omics approaches has demonstrated clear clinical value.
In conclusion, our study confirms high metabolic heterogeneity of OC in line with observations in other tumor types. Although none of the markers investigated seems to be robustly associated with prognosis in our study, our findings should be taken into consideration for patient stratification purposes in the design of future therapeutic strategies intercepting dysregulated metabolic pathways in tumors.
Supplemental Material
sj-docx-1-jbm-10.1177_03936155241296164 - Supplemental material for Impact of metabolism-related markers on outcomes in ovarian cancer patients: Findings of the MITO16A/MaNGO-OV2 trial
Supplemental material, sj-docx-1-jbm-10.1177_03936155241296164 for Impact of metabolism-related markers on outcomes in ovarian cancer patients: Findings of the MITO16A/MaNGO-OV2 trial by Stefano Indraccolo, Simona Signoriello, Ilaria Piga, Giovanni Esposito, Federica Ferrarini, Andrea Boscolo Bragadin, Vanda Salutari, Carmela Pisano, Daniela Califano, Eliana Bignotti, Germana Tognon, Vittorio Simeon, Grazia Artioli, Annamaria Ferrero, Saverio Cinieri, Alessandra Bologna, Paolo Chiodini, Giosuè Scognamiglio, Carolina Bottoni, Anna Spina, Daniela Russo, Laura Arenare, Francesco Perrone and Sandro Pignata in The International Journal of Biological Markers
Supplemental Material
sj-docx-2-jbm-10.1177_03936155241296164 - Supplemental material for Impact of metabolism-related markers on outcomes in ovarian cancer patients: Findings of the MITO16A/MaNGO-OV2 trial
Supplemental material, sj-docx-2-jbm-10.1177_03936155241296164 for Impact of metabolism-related markers on outcomes in ovarian cancer patients: Findings of the MITO16A/MaNGO-OV2 trial by Stefano Indraccolo, Simona Signoriello, Ilaria Piga, Giovanni Esposito, Federica Ferrarini, Andrea Boscolo Bragadin, Vanda Salutari, Carmela Pisano, Daniela Califano, Eliana Bignotti, Germana Tognon, Vittorio Simeon, Grazia Artioli, Annamaria Ferrero, Saverio Cinieri, Alessandra Bologna, Paolo Chiodini, Giosuè Scognamiglio, Carolina Bottoni, Anna Spina, Daniela Russo, Laura Arenare, Francesco Perrone and Sandro Pignata in The International Journal of Biological Markers
Supplemental Material
sj-docx-3-jbm-10.1177_03936155241296164 - Supplemental material for Impact of metabolism-related markers on outcomes in ovarian cancer patients: Findings of the MITO16A/MaNGO-OV2 trial
Supplemental material, sj-docx-3-jbm-10.1177_03936155241296164 for Impact of metabolism-related markers on outcomes in ovarian cancer patients: Findings of the MITO16A/MaNGO-OV2 trial by Stefano Indraccolo, Simona Signoriello, Ilaria Piga, Giovanni Esposito, Federica Ferrarini, Andrea Boscolo Bragadin, Vanda Salutari, Carmela Pisano, Daniela Califano, Eliana Bignotti, Germana Tognon, Vittorio Simeon, Grazia Artioli, Annamaria Ferrero, Saverio Cinieri, Alessandra Bologna, Paolo Chiodini, Giosuè Scognamiglio, Carolina Bottoni, Anna Spina, Daniela Russo, Laura Arenare, Francesco Perrone and Sandro Pignata in The International Journal of Biological Markers
Supplemental Material
sj-docx-4-jbm-10.1177_03936155241296164 - Supplemental material for Impact of metabolism-related markers on outcomes in ovarian cancer patients: Findings of the MITO16A/MaNGO-OV2 trial
Supplemental material, sj-docx-4-jbm-10.1177_03936155241296164 for Impact of metabolism-related markers on outcomes in ovarian cancer patients: Findings of the MITO16A/MaNGO-OV2 trial by Stefano Indraccolo, Simona Signoriello, Ilaria Piga, Giovanni Esposito, Federica Ferrarini, Andrea Boscolo Bragadin, Vanda Salutari, Carmela Pisano, Daniela Califano, Eliana Bignotti, Germana Tognon, Vittorio Simeon, Grazia Artioli, Annamaria Ferrero, Saverio Cinieri, Alessandra Bologna, Paolo Chiodini, Giosuè Scognamiglio, Carolina Bottoni, Anna Spina, Daniela Russo, Laura Arenare, Francesco Perrone and Sandro Pignata in The International Journal of Biological Markers
Footnotes
Acknowledgments
We are grateful to the patients who consented to donating their tumor samples.
Author contributions
Conceptualization, DC and SP; methodology, IP, GE; software, IP and SS; formal analysis, IP and SS; resources, SI, VS, CP, DC, EB, GT, VS, GA, AF, SC, AB, PC, GS, CB, AS, DR, LA, FP, SP; investigation, IP and ABB; data curation, SS; writing—original draft preparation, SI; writing—review and editing, SI, FF; visualization, SS, IP, GE; supervision, SI; project administration, SI; funding acquisition, SP and SI. SI and SS contributed eually to this work. All authors have read and agreed to the published version of the manuscript.
Declaration of conflicting interests
The authors declared no potential conflicts of interest with respect to the research, authorship, and/or publication of this article.
Funding
The author(s) disclosed receipt of the following financial support for the research, authorship, and/or publication of this article: This research was funded by: AIRC grant IG-2020 – ID 25179, AIRC grant IG 2016 –ID. 18921, AIRC grant IG 2021 – ID. 25932, CO-2018-12367051 (Ministero della Salute), Ricerca Corrente grant L3/13 from Ministero della Salute, PNRR-MAD-2022-12375663.
Informed consent statement
Informed consent was obtained from all subjects involved in the study.
Institutional review board statement
The study was conducted in accordance with the Declaration of Helsinki, and approved by the Ethics Committee of INT Pascale Napoli (protocol code #383/12 of 19 July 2012).
Supplemental material
Supplemental material for this article is available online.
References
Supplementary Material
Please find the following supplemental material available below.
For Open Access articles published under a Creative Commons License, all supplemental material carries the same license as the article it is associated with.
For non-Open Access articles published, all supplemental material carries a non-exclusive license, and permission requests for re-use of supplemental material or any part of supplemental material shall be sent directly to the copyright owner as specified in the copyright notice associated with the article.