
Abstract
Introduction
There is a need for a rapid, accurate, less-invasive approach to distinguishing malignant from benign pleural effusions. We investigated the diagnostic value of five pleural tumor markers in exudative pleural effusions.
Methods
By immunochemiluminescence assay, we measured pleural concentrations of tumor markers. We used the receiver operating characteristic curve analysis to assess their diagnostic values.
Results
A total of 281 patients were enrolled. All tumor markers were significantly higher in malignant pleural effusions than benign ones. The area under the curve of carcinoembryonic antigen (CEA), carbohydrate antigen (CA) 15-3, cytokeratin fragment 19 (CYFRA) 21-1, CA-19-9, and CA-125 were 0.81, 0.78, 0.75, 0.65, and 0.65, respectively. Combined markers of CEA + CA-15-3 and CEA + CA-15-3 + CYFRA 21-1 had a sensitivity of 87% and 94%, and specificity of 75% and 58%, respectively. We designed a diagnostic algorithm by combining pleural cytology with pleural tumor marker assay. CEA + CYFRA 21-1 + CA-19-9 + CA-15-3 was the best tumor markers panel detecting 96% of cytologically negative malignant pleural effusions, with a negative predictive value of 98%.
Conclusions
Although cytology is specific enough, it has less sensitivity in identifying malignant pleural fluids. As a result, the main gap is detecting malignant pleural effusions with negative cytology. CEA was the best single marker, followed by CA-15-3 and CYFRA 21-1. Through both cytology and suggested panels of tumor markers, malignant and benign pleural effusions could be truly diagnosed with an accuracy of about 98% without the need for more invasive procedures, except for the cohort with negative cytology and a positive tumor markers panel, which require more investigations.
Keywords
Introduction
Any situation interfering with the secretion or drainage of pleural fluid leads to the accumulation of fluid in the pleural cavity.1,2 After the diagnosis of pleural effusion (PE), the first step would be thoracentesis.1,3 Light's criteria 4 are used to differentiate transudate and exudate effusions with a diagnostic accuracy of 93%–96%. 3
Malignancy is among the most common and important causes of exudative PE.3,5 Cytologic examination, bronchoscopy, and biopsy are used for the definite determination of causes of exudative PEs.3,6
Despite high specificity, cytology assessment has insufficient sensitivity.7–12 High cost, invasiveness, need for expert people, and unavailability in some regions are the main disadvantages of thoracoscopy. 11 Either cytology or pleural biopsy is operator-dependent and the results may vary remarkably. 13
Considering all the mentioned issues together, a rapid, highly accurate, and less-invasive approach would be helpful in patients with a high clinical suspicion of malignancy.11,14,15 Current studies have focused on the pleural concentration of TMs.9,16,17
The Cancer Institute and Pulmonary Medicine Department of Imam Khomeini Hospital Complex are large, active, and referral centers. We decided to investigate the pleural level of tumor markers (TM) in patients with exudative PE to assess their diagnostic values in identifying malignant PEs.
Material land methods
Participants
Exudative PEs are routinely sent for cytologic evaluation to our lab. In this prospective research, we enrolled all patients with exudative PE sent for cytologic assessment from the Pulmonary Medicine Department, from 2016 to 2019, initially. The final diagnosis of effusions was made based on the cytology assessment along with the clinical suspicion of the pulmonologist, and the repeated thoracentesis, immunohistochemistry (IHC), 6-month follow-up, and pleural biopsy if required. Most of the pleural biopsies in our study were taken via thoracoscopy.
Those with unequivocal malignant cells in cytology smears, detection of malignant cells by IHC on relevant cell blocks, and the presence of malignant cells in biopsy were categorized as malignant. The cytologically negative TM-positive cohort underwent thoracoscopic pleural biopsy for ultimate diagnosis.
Negative cytologic samples without clinical suspicion of malignancy or with excluded malignancy after complete clinical and radiological/instrumental (chest x-ray, computed tomography scan, magnetic resonance imaging, positron emission tomography) assessment in the Pulmonary Medicine Department were regarded as negative PEs.
Samples
In the Pathology Department, exudative PEs were centrifuged for 15 min at 1200 rpm to remove the existing cells, and supernatants were collected and stored in −196°C of liquid nitrogen for upcoming TM measurement. Then, two Papanicolaou-stained smears and one hematoxylin and eosin-stained cell block from precipitates of each fluid were prepared for cytologic evaluation.
Tumor marker assay
Frozen samples were thawed and then centrifuged to remove possible existing cells. Afterward, levels of carcinoembryonic antigen (CEA), carbohydrate antigen (CA)-15-3, CA-19-9, CA-125, and cytokeratin fragment (CYFRA) 21-1 TMs in the pleural fluid were measured by immunochemiluminescence assay (Elecsys® 2010 device, Roche Diagnostics, Mannheim, Germany). Selection of TMs was based on the literature review (Supplementary Table S1) and pleural effusion likely due to the related malignancies.
Statistical analysis
The 24th version of SPSS software was used for statistical analysis. The distribution of quantitative variables was investigated through the Kolmogorov–Smirnov test. Since all TM levels had non-normal distribution, non-parametric tests were utilized. Concentration differences between the benign and malignant groups and types of cancer were evaluated for statistical significance using the Independent-Samples Mann–Whitney U-Test and the Kruskal–Wallis Test, respectively. A P-value of <0.05 was considered significant. The sensitivity and specificity were selected as the critical value using the area under the receiver operating characteristic (ROC) curve. Then, the other indexes were calculated accordingly.
Results
General clinical data
A total of 281 patients were enrolled. The mean age was 58 ± 15.825 years (range: 17–92); age was the only quantitative variable with normal distribution; there were 143 men and 138 women; and 62.6% of patients had a past medical history of malignant tumors (Table 1).
Characteristics of patients with exudative pleural effusion.
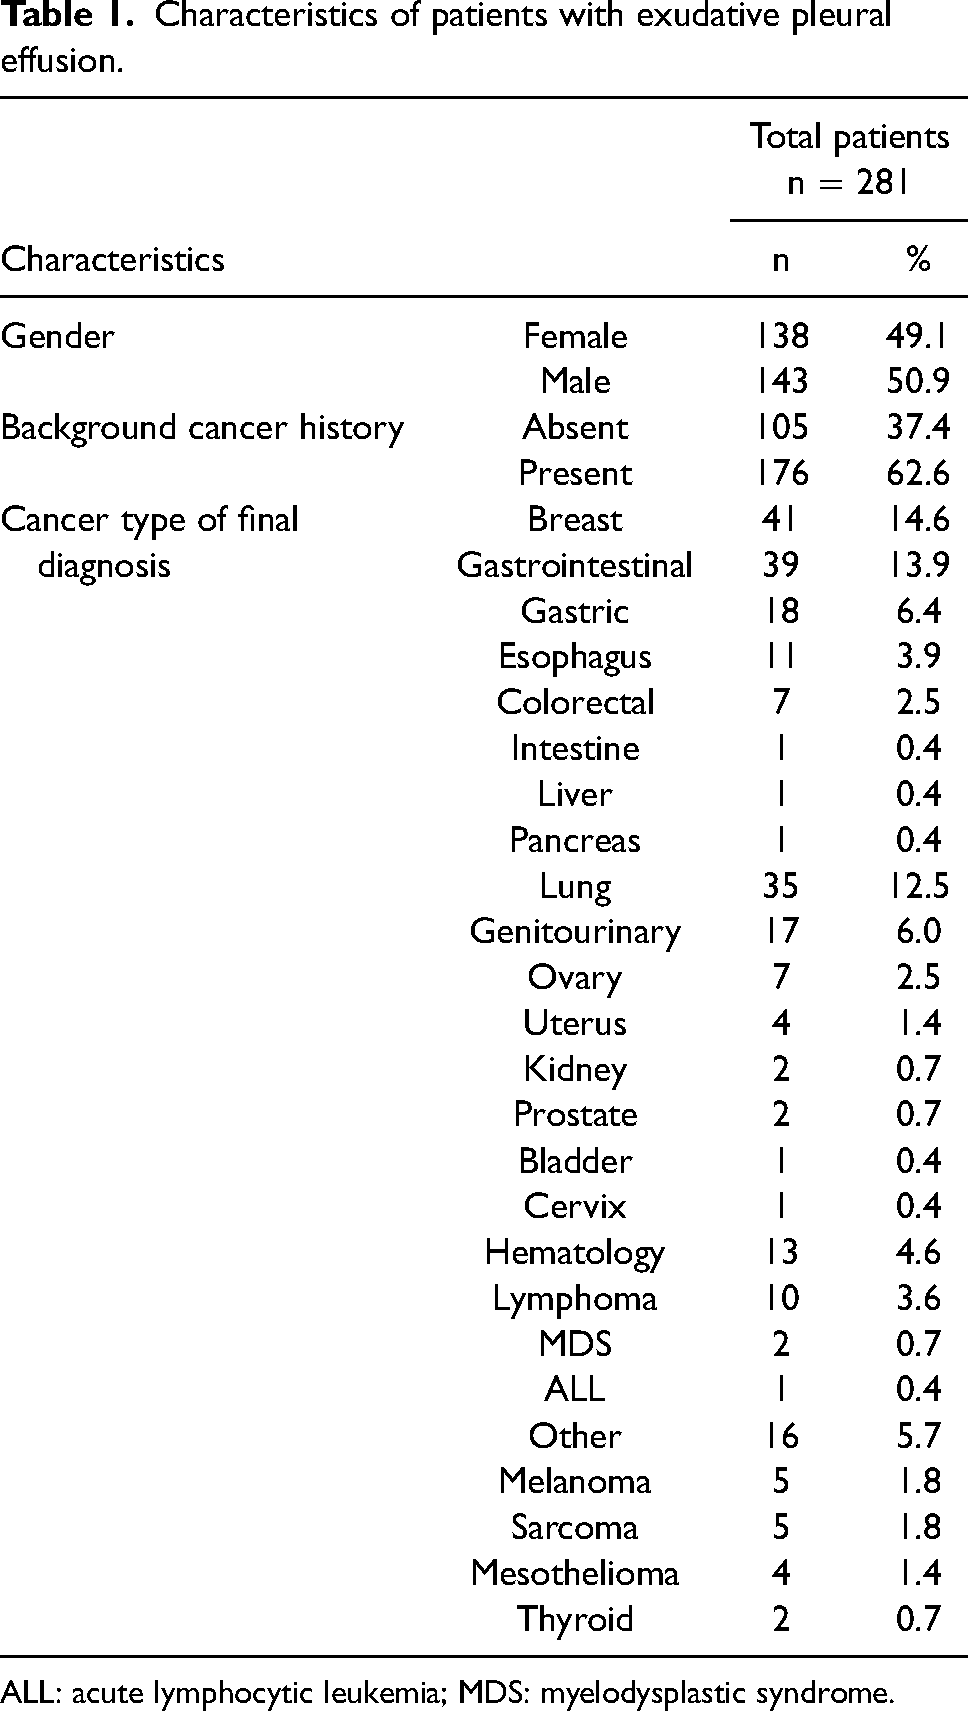
ALL: acute lymphocytic leukemia; MDS: myelodysplastic syndrome.
Detection of tumor markers
Considering the cytology assessment, PEs were categorized into benign, suspicious, and malignant groups. Then, with IHC implementation, suspicious cases were recognized as malignant. Those with negative cytology and IHC but high clinical suspicion of malignancy underwent thoracoscopic-assisted pleural biopsy for final diagnosis. In the total population, 57% of PEs were cytologically negative and 43% were positive. A total of 105 patients were located in the benign group and 161 patients in the malignant group; 15 patients were lost to follow-up. Cirrhosis, renal disease, heart failure, tuberculosis, and pneumonia were detected as etiologies of the benign group.
All TMs were significantly higher in malignant PEs than benign ones (Table 2, Figure 1).
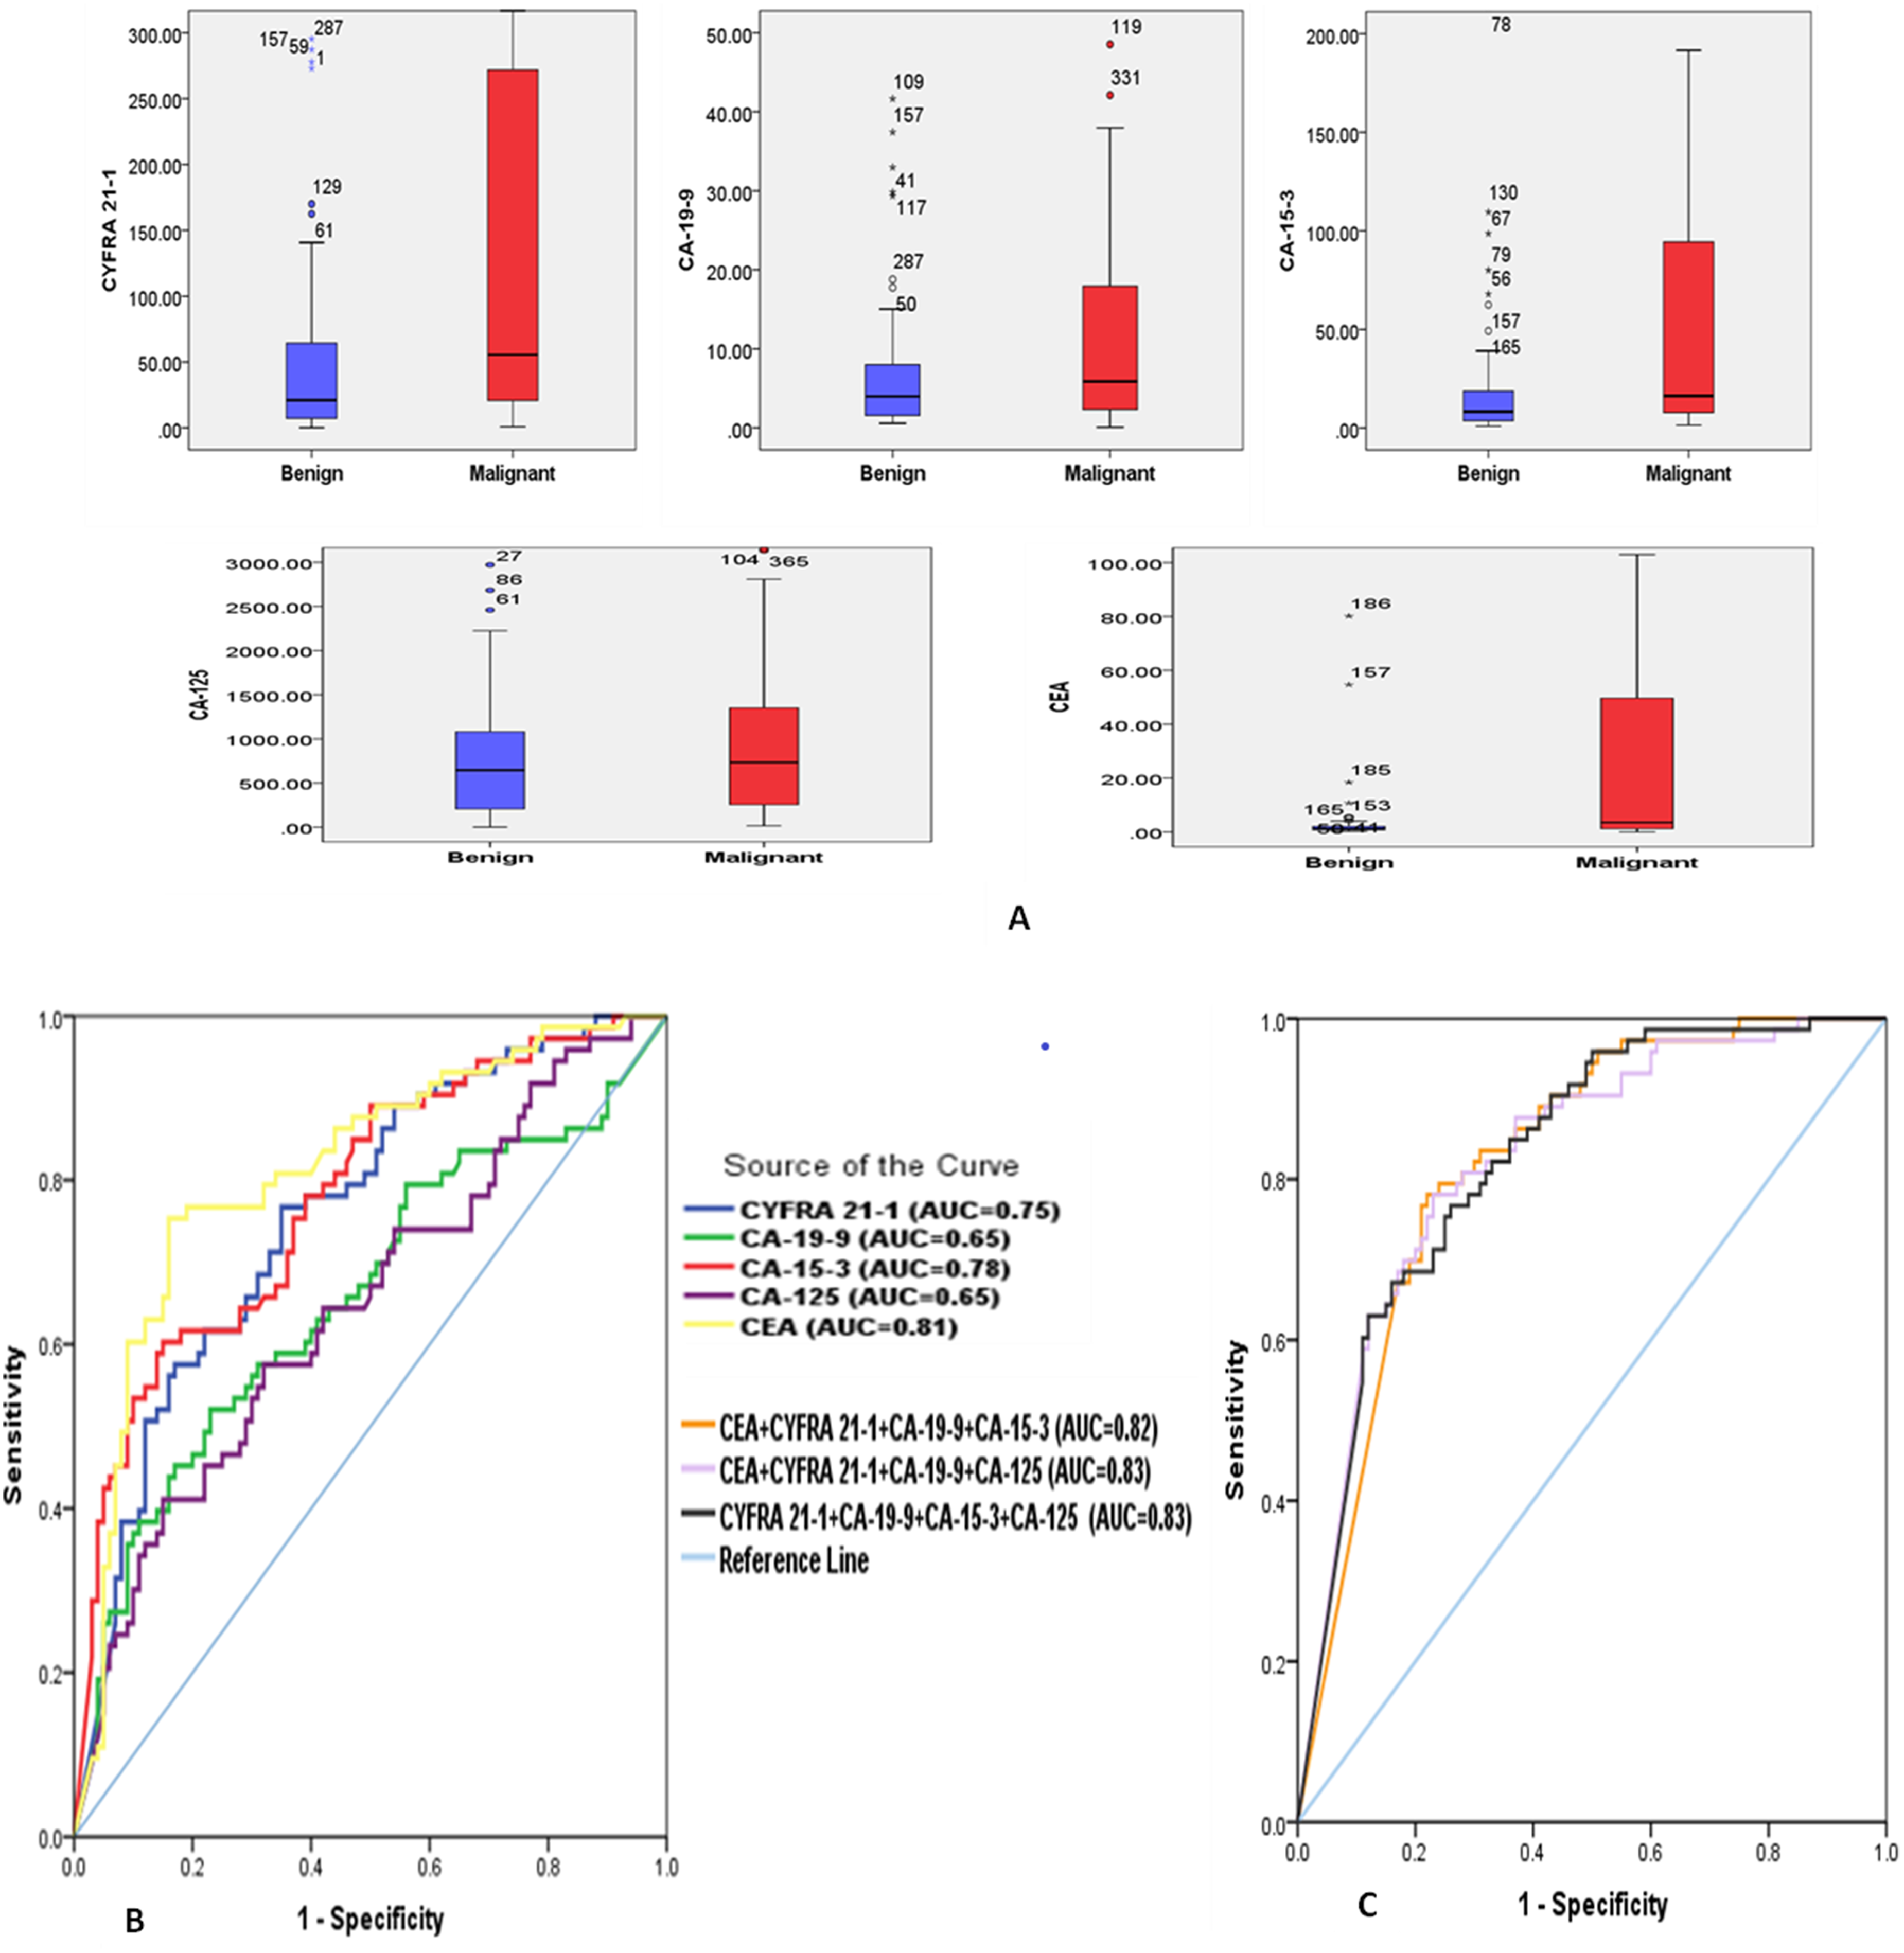
Pleural levels of tumor markers. (a) Pleural concentrations of TMs among malignant and benign groups. Data are presented as median and 25th–75th percentile. Diagnostic performance of individual TMs (b) and suggested combination panels of TMs (c) in ROC curves differentiating malignant from benign PEs.
Pleural levels of tumor markers among patients with exudative pleural effusion.
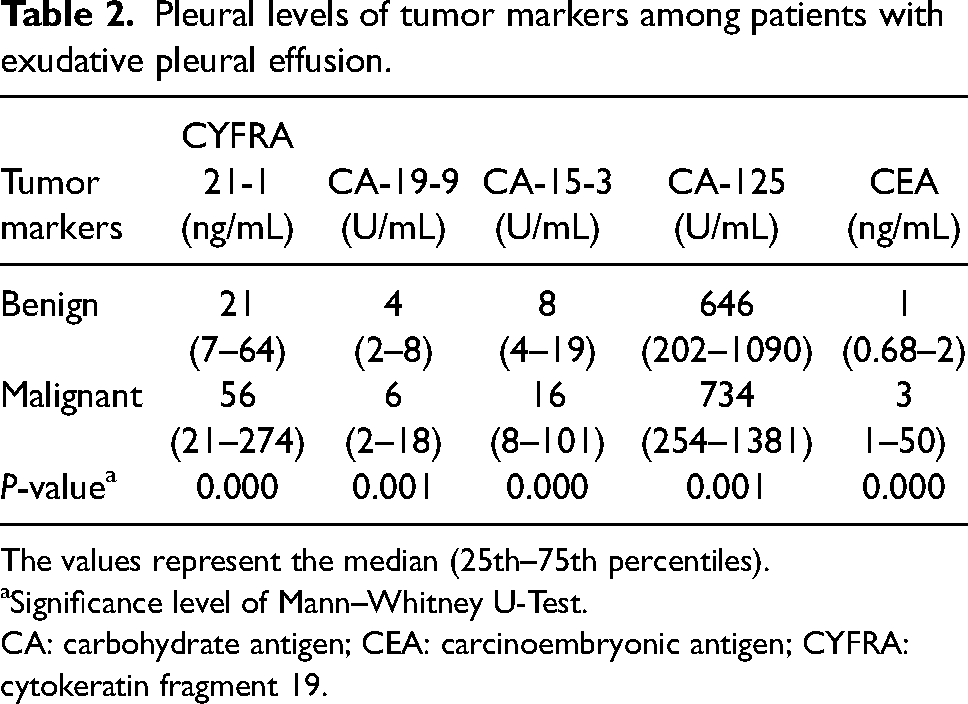
The values represent the median (25th–75th percentiles).
Significance level of Mann–Whitney U-Test.
CA: carbohydrate antigen; CEA: carcinoembryonic antigen; CYFRA: cytokeratin fragment 19.
Then, we assessed whether any of these five TMs were related to the primary tumor site. It was demonstrated that CYFRA 21-1, CEA, and CA-15-3 were distributed significantly different among various types of cancer. The median pleural levels of these TMs are displayed in Table 2. CYFRA 21-1 was higher in breast and lung cancers than other malignancies. Breast, lung, and genitourinary cancers had the highest CA-15-3 levels. Finally, CEA was higher in breast and lung carcinomas than in other types of cancer.
We investigated the diagnostic values of pleural TMs in distinguishing malignant from benign PEs. According to ROC curve analysis, CEA was the best single marker with an area under the curve (AUC) of 0.81, followed by CA-15-3 (AUC: 0.78), CYFRA 21-1 (AUC: 0.75), CA-19-9 (AUC: 0.65), and CA-125 (AUC: 0.65) (Figure 1, Table 3). The cut-off values were determined as a diagnostic marker, regarding the point with high specificity and acceptable sensitivity. Sensitivity, specificity, positive and negative predictive values (PPV and NPV), positive and negative likelihood ratios, and diagnostic accuracy were calculated (Table 3). Cut-offs and the above indexes were also calculated based on the predefined specificity (90%) (Supplementary Table S2). CEA had the best sensitivity (77%) with a specificity of 81%.
Diagnostic performance of pleural tumor markers levels in differentiating malignant from benign exudative pleural effusion.
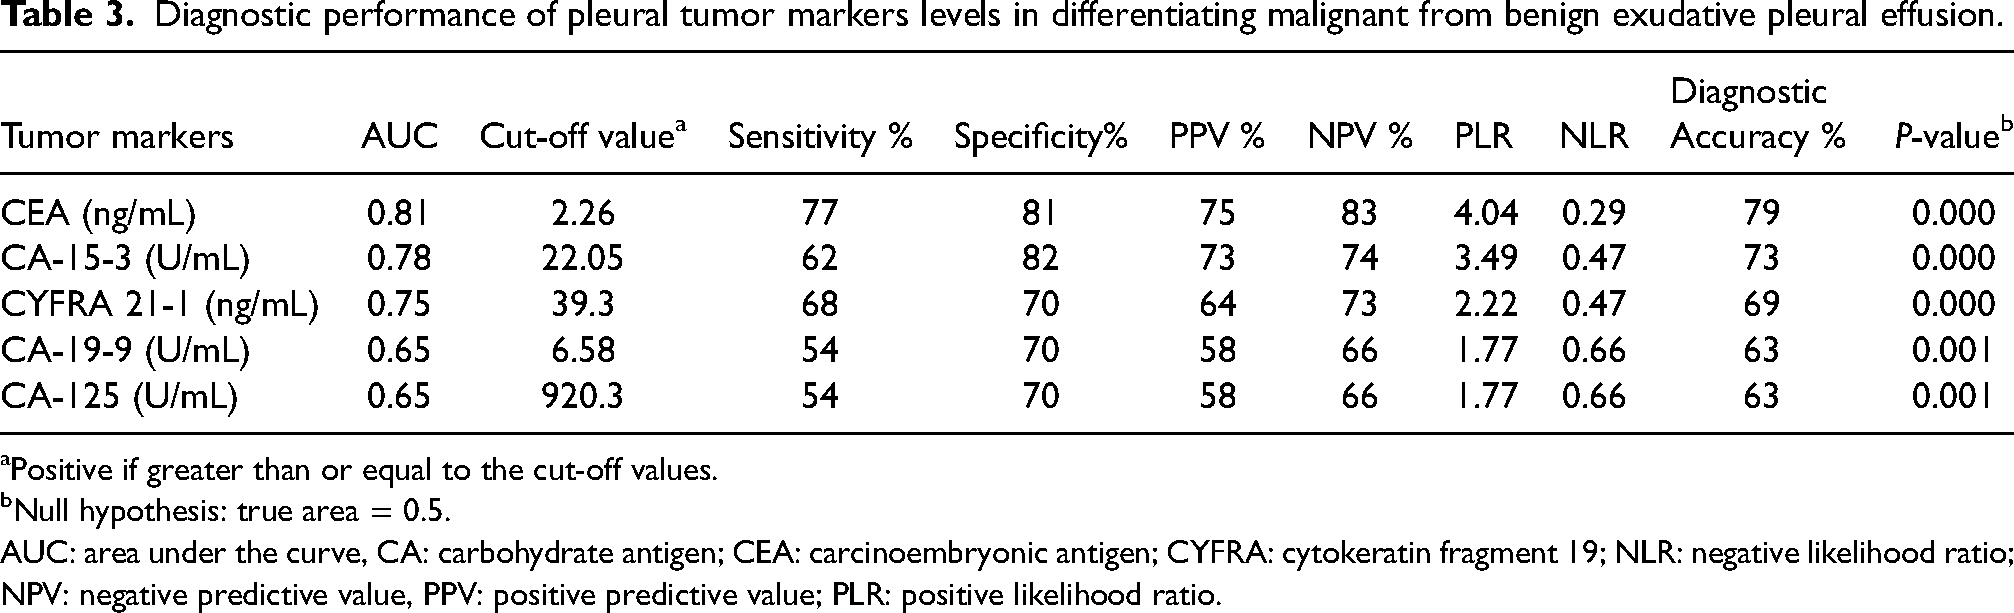
Positive if greater than or equal to the cut-off values.
Null hypothesis: true area = 0.5.
AUC: area under the curve, CA: carbohydrate antigen; CEA: carcinoembryonic antigen; CYFRA: cytokeratin fragment 19; NLR: negative likelihood ratio; NPV: negative predictive value, PPV: positive predictive value; PLR: positive likelihood ratio.
We also calculated the sensitivity and specificity of combined multiple markers. CEA + CA-15-3 and CEA + CA-15-3 + CYFRA 21-1 had the best diagnostic values with a sensitivity of 87% and 94%, and a specificity of 75% and 58%, respectively.
In our study, cytology had a specificity of 99% with a sensitivity of 70%. Considering that 30% of malignant PEs were not detected by cytology, we assessed how powerful the TMs were in identifying these cases. The results showed that among single markers, CEA was the best one, detecting 60% of cytologically negative malignant PEs, followed by CA-19-9 with a sensitivity of 54% in this population. By the combination of TMs, the detection ability increased to the highest rate of 96% sensitivity with any of the following panels: CEA + CYFRA 21-1 + CA-19-9 + CA-15-3, CEA + CYFRA 21-1 + CA-19-9 + CA-125, CYFRA 21-1 + CA-19-9 + CA-15-3 + CA-125, and the panel of all five markers. The NPV and PPV of all four mentioned panels were 97% and 26%, respectively, except for the CEA + CYFRA 21-1 + CA-19-9 + CA-15-3 panel with an NPV of 98% and a PPV of 29%.
Discussion
Most of the malignant PEs are due to metastases to the pleura. Lung and breast cancers are the leading causes of malignant PEs accounting for 50%–65% of cases. 1 In our study, breast, gastrointestinal, and lung cancers were the top three causes constituting 72% of malignant PEs.
The diagnostic accuracy of cytology in malignant PE is 59%–86%.7,8 Although being approximately 100% specific, 9 the overall sensitivity of cytology in different studies has been reported as 40%–90%,7,10 with the most agreement on approximately 60% or less.8,11,12 Although the gold standard for establishing malignant PE diagnosis is pleural biopsy and cytology, 13 studies have brought up the pleural levels of TMs as an objective and less-invasive diagnostic tool in suspicious cases.9,16,17 TMs that are typically measured in the pleural fluid include CEA, CA 15-3, CA-125, CA-19-9, CYFRA 21-1,15,18–20 and neuron-specific enolase (NSE).13,18,21 Thus, the markers measured in our study were chosen as the most proposed TMs related to various types of cancers.13,22
Our results showed that all TMs were significantly higher in the malignant group than the benign group (P- < 0.001), similar to the literature.9,12,15–17,19,23–28
CEA has been investigated widely and is one of the most recommended TMs.29,30 In our study, CEA was the best marker with the highest AUC and diagnostic accuracy, followed by CA-15-3 and CYFRA 21-1. Shitrit et al. 19 analyzed 116 cases and reviewed the literature of nine studies. They reported that among 11 different TMs, CEA, CA-15-3, and CYFRA 21-1 had the best diagnostic performances—an observation that matches ours. CEA,16,19,22 CYFRA 21-1,19,22 and CA-15-316,19 have been more reliable to diagnose malignant PEs than other markers such as CA-12516,19,22 and CA-19-9.16,19 The meta-analysis by Liang et al. 31 demonstrated that considering the weighted regression summary ROC curves, pleural CA-125 and CA-19-9 had poorer performance compared to CYFRA 21-1 and CA-15-3. Accordingly, CEA has been shown to be the best single marker in many studies among different markers including CA-15-3, CA-19-9, CA-125, CYFRA 21-1, soluble B7-H4, NSE, squamous cell carcinoma (SCC) associated antigen, and HER2/neu.9,15,16,19,24,26 Elia et al., 32 utilizing a machine learning-based approach, showed pleural CEA and CYFRA 21-1 as the best diagnostic performance in cytologically negative malignant PEs related to lung cancer. The study by Feng et al. 28 was original research as well as a meta-analysis—the results of which introduced CEA as the best marker in the diagnosis of lung adenocarcinoma-associated malignant PEs.
Although CEA seems to be the best single marker, its diagnostic ability is moderate. Many studies have demonstrated good specificity. Nevertheless, the sensitivity has been shown to be poor.22,28,33 One solution for these limitations is the use of the multi-marker strategy to enhance diagnostic performance,28,34 as was shown in our study. Thus, we combined multiple TMs in the “OR” manner to increase the sensitivity. In our study, CEA + CA-15-3 and CEA + CA-15-3 + CYFRA 21-1 had the best diagnostic values. Among CEA, CYFRA 21-1, and HER2/neu, Hsieh et al. 12 recommended the combination of CEA with CYFRA 21-1 as the best diagnostic tool. Gaspar et al. 15 proposed the combined measurement of CEA, CA-15-3, and tumor-associated glycoprotein 72 as a useful complementary test. Many other combinations of TMs have been suggested.9,28,31
The combined use of markers is more complex and requires the establishment of concise algorithms and artificial intelligence. 35 Apart from multi-marker assessments, the integration of TMs with other strategies, such as cell block, has increased diagnostic accuracy. 25 Considering the high specificity of cytology and high sensitivity of the combined panel of TMs, we designed an algorithm for the diagnosis of malignant PEs regarding the predictive values of each suggested test at each step (Figure 2). We measured the diagnostic values for all the different combinations of TMs. Then, those with better results were selected as the suggested panels. CEA + CYFRA 21-1 + CA-19-9 + CA-15-3 was the best panel of TMs with the ability to detect 96% of malignant PEs that had negative cytology, with an NPV of 98%. According to our findings, measuring all five TMs is not suggested since, despite more cost, it does not add any significant value compared to the mentioned panels of four markers. A review in 2019, summarized the characteristics of various diagnostic tools in an algorithm proposed for the diagnosis of malignant PEs. 36 Additionally, in 2017, Trapé et al. 37 compared two strategies of high cut-off TMs with fluid to serum ratio and low cut-off TMs in identifying malignant PEs. They proposed an algorithm for the interpretation of TMs in PE regarding the predictive values of diagnostic tests consisting of four TMs along with adenosine deaminase and C-reactive protein.
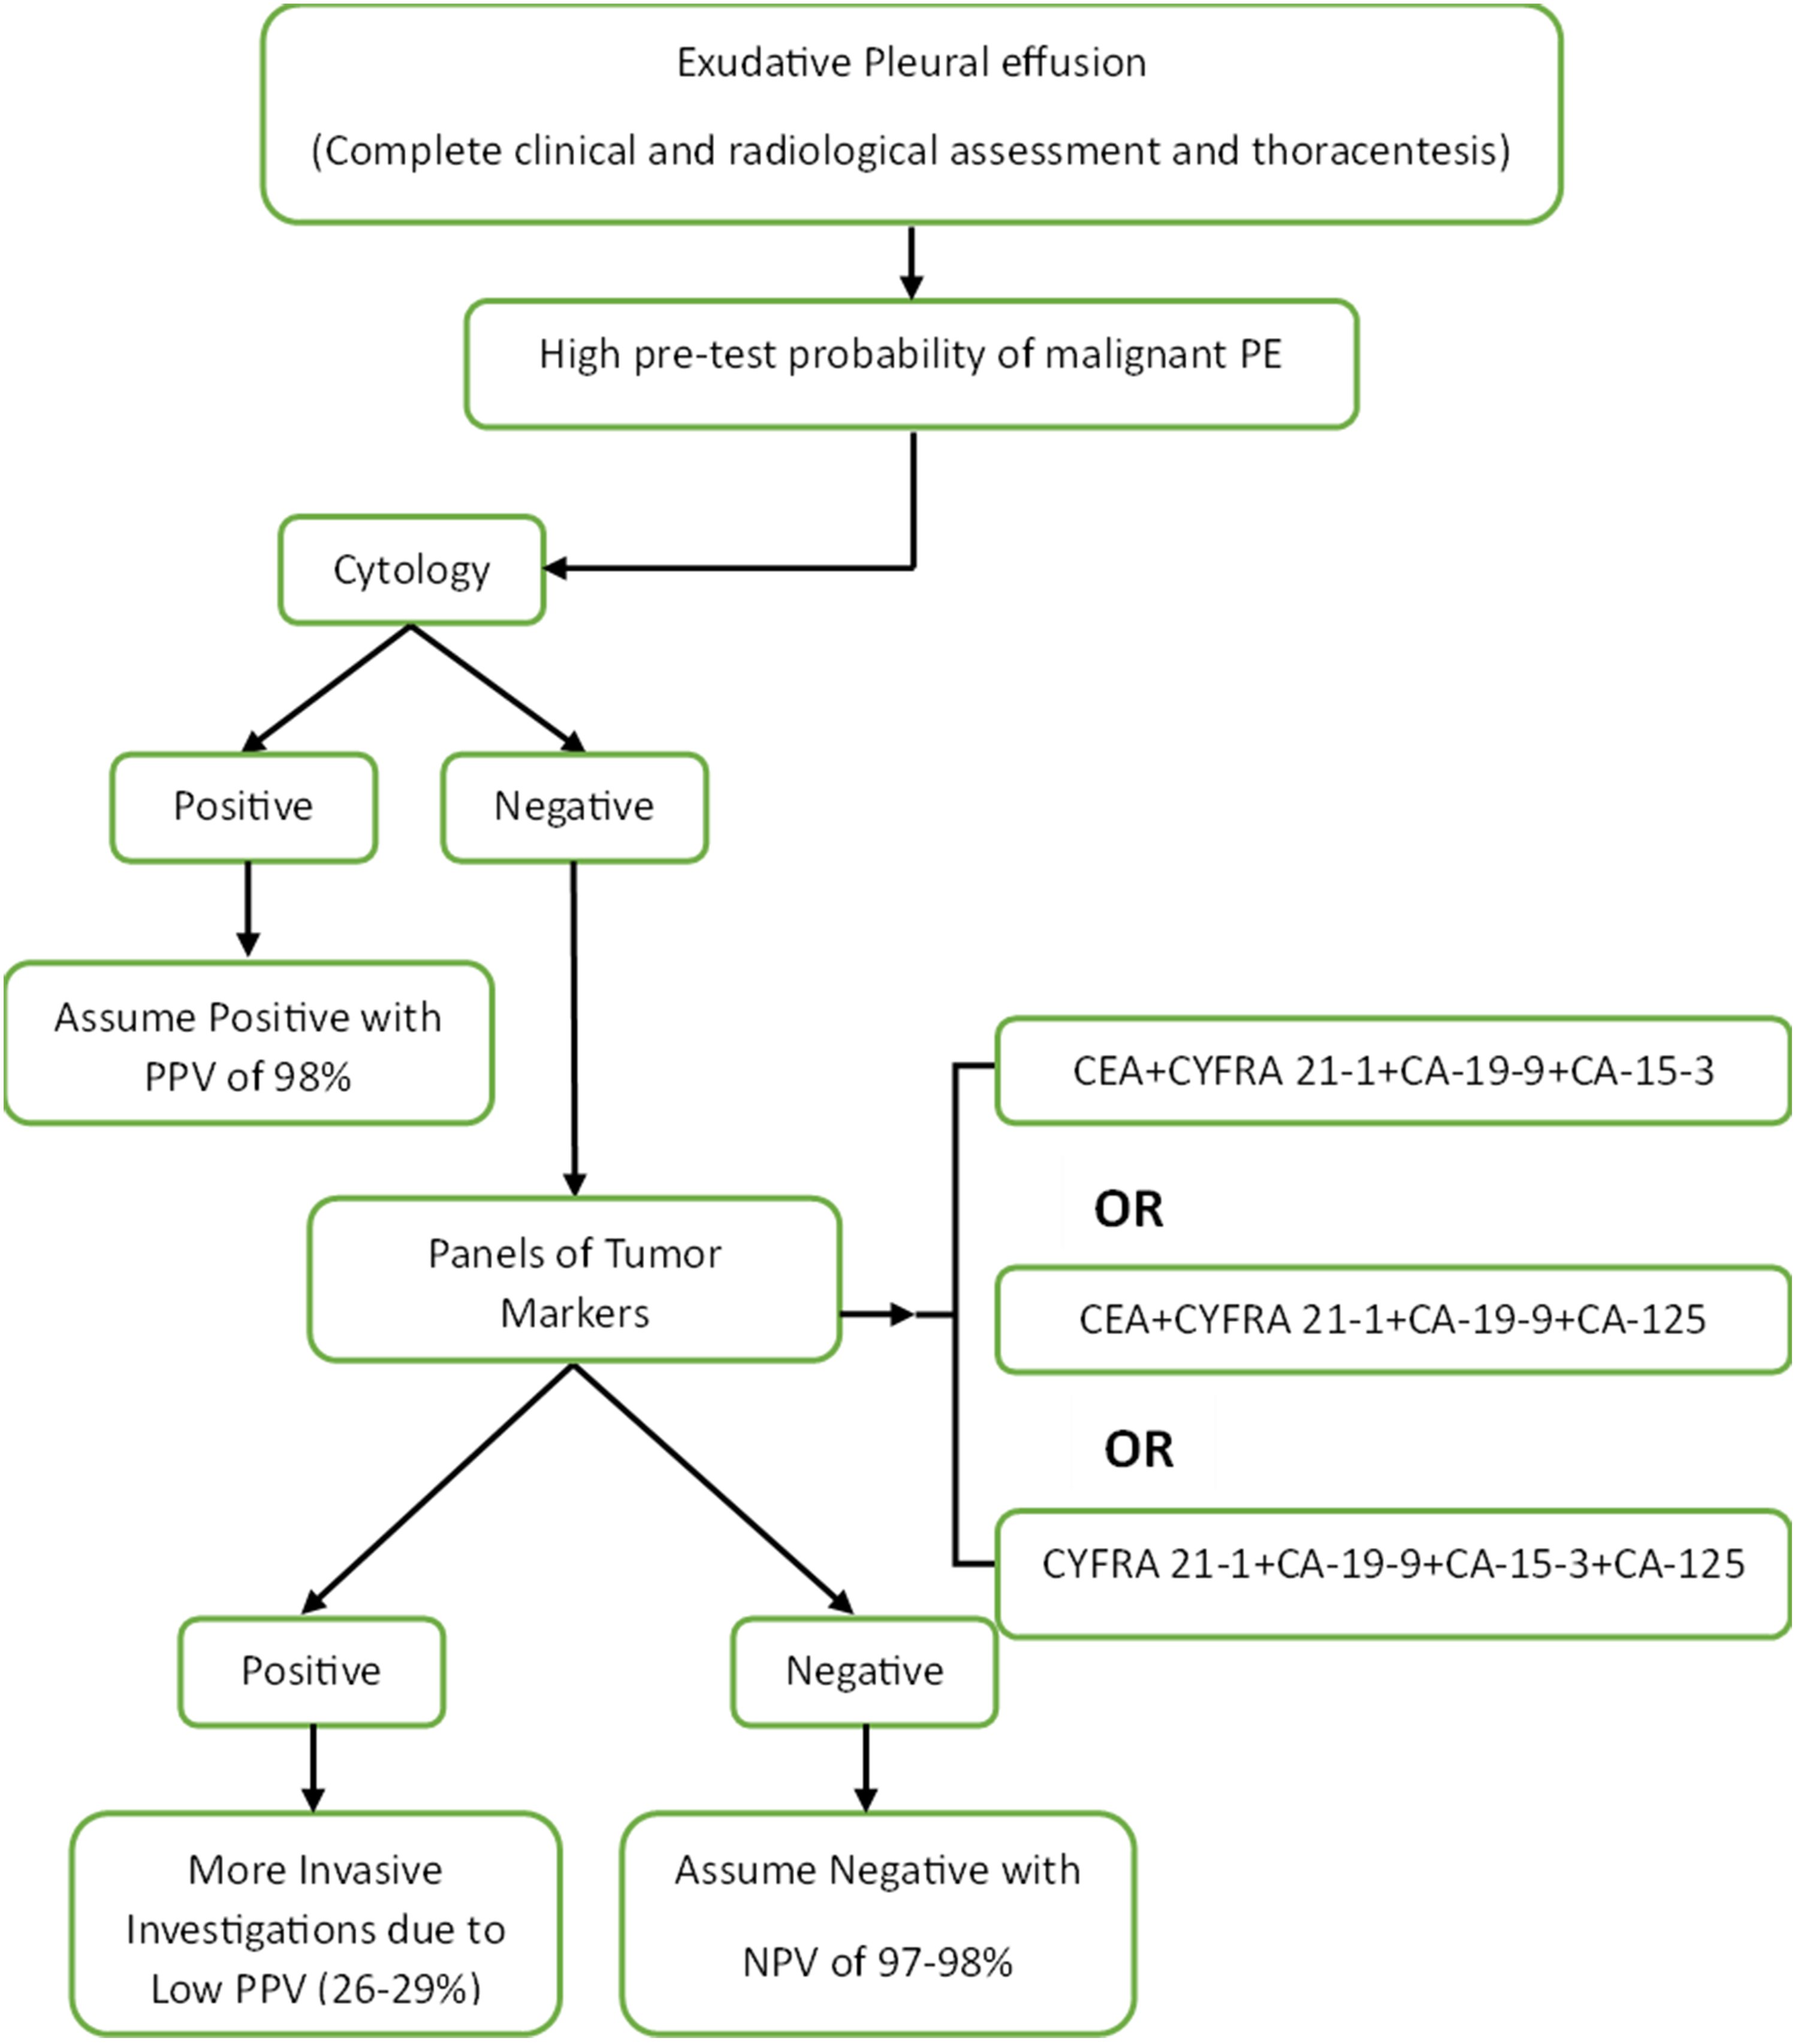
Suggested algorithm for identifying malignant PEs.
Some other studies have reported results in contrast to many others. For example, in the study by Antonangelo et al., 17 the highest AUC was reported for CA-125, or in a meta-analysis in 2015, CA-19-9 demonstrated the highest AUC. 22 Numerous reasons may be responsible for these contradictory findings including different methods for assessment of TMs concentration such as electrochemiluminescent immunoassay, enzyme-linked immunosorbent assay, and radioimmunoassay, 29 the variety of primary tumor sites, 17 sample size, study design, patient selection, 29 and determining various cut-off values.
Supplementary Table S1 summarizes the literature review on some original studies investigating the diagnostic values of pleural TMs that were assessed in this study.
To our knowledge, only a few studies have investigated the association between any pleural TM and type of cancer.38,39 In our study, three out of five TMs (i.e., CEA, CYFRA 21-1, and CA-15-3) were significantly distributed differently among carcinomas with various origins and all of them had the highest amounts in breast and lung cancers (Table 2). All types of lung carcinoma especially SCC express CYFRA 21-1. 29 Its elevation has also been reported in the blood of patients with breast cancer with good diagnostic performance compared to CEA and CA-15-3 through ROC curve analysis. 40 In the study by Terracciano et al., 39 lung cancer had the highest CEA. We demonstrated the highest level of CA-15-3 in breast cancer in accordance with the findings of the study by Terracciano et al. 39
Regarding the limitations, strengths, and future direction, the following points should be carefully considered. Since TMs show a clear profile for some tumor types (Supplementary Table S3), some of them may be of limited value even in combinations and their differential diagnostic performance should be considered based on tumor subtypes.
Patients were included in our study regardless of the type of cancer. This made our study representative enough of the prevalent malignancies resulting in PE in clinical practice. However, the variety of primary tumor sites could also limit the study due to high heterogeneity. Another strength of this study is its high sample size and measurement of five TMs. We did not measure the simultaneous levels of TMs in serum due to the cost-effectiveness rationale; however, it might be considered a limitation. Thus, another way to improve the diagnostic performance of pleural TMs is the concurrent measurement of serum concentrations and calculating the pleural to serum ratio. 35 Additionally, apart from traditional TMs, the investigation of novel markers might be of great value.13,41,42 Because current pleural markers lack the capability of predicting genetic alterations of malignant tumors, it is also suggested that further studies focus on developing novel soluble pleural markers with this ability to guide the therapies. 13 It is also recommended that the suggested algorithm be validated in further cohort studies.
Conclusions
This study showed that malignant PEs had higher levels of TMs than the benign group. CEA was the best single marker, followed by CA-15-3 and CYFRA 21-1. The combination of CEA with CA-15-3 and CYFRA 21-1 increased the sensitivity, whereas the specificity decreased. This trade-off between sensitivity and specificity should be carefully considered. The algorithm proposed to identify malignant PEs demonstrated that by means of both cytology and the suggested combination panels of TMs, malignant and benign cases could be truly diagnosed with an accuracy of about 98% without the need for more invasive procedures, except for the group of patients with negative cytology and a positive TM panel, which requires more investigation. The measurement of pleural TMs might be a rapid, less-invasive, and inexpensive replacement for current more aggressive investigations particularly in cytologically negative patients with a clinical suspicion of malignancy. Nevertheless, there is a need for large-scale, multi-center, validation research in the future to further confirm the findings of this study.
Supplemental Material
sj-docx-1-jbm-10.1177_03936155231158661 - Supplemental material for Pleural CEA, CA-15-3, CYFRA 21-1, CA-19-9, CA-125 discriminating malignant from benign pleural effusions: Diagnostic cancer biomarkers
Supplemental material, sj-docx-1-jbm-10.1177_03936155231158661 for Pleural CEA, CA-15-3, CYFRA 21-1, CA-19-9, CA-125 discriminating malignant from benign pleural effusions: Diagnostic cancer biomarkers by Farzaneh Fazli Khalaf, Mehrnaz Asadi Gharabaghi, Maryam Balibegloo, Hamidreza Davari, Samaneh Afshar and Behnaz Jahanbin in The International Journal of Biological Markers
Footnotes
Abbreviations
Acknowledgments
The authors would like to acknowledge the help rendered by Dr. Seyed Aria Nejadghaderi for his help with the analysis of the ROC curve of the combined TMs panels.
Declaration of conflicting interests
The author(s) declared no potential conflicts of interest with respect to the research, authorship, and/or publication of this article.
Funding
The author(s) disclosed receipt of the following financial support for the research, authorship, and/or publication of this article: This work was supported by the Tehran University of Medical Sciences and Health Services.
Ethical approval
This study complies with the Declaration of Helsinki and has been approved by the ethics committee of Imam Khomeini Hospital Complex, Tehran University of Medical Sciences (IR.TUMS.IKHC.REC.1396.4226). Informed consent was obtained from participants.
Supplemental material
Supplemental material for this article is available online.
References
Supplementary Material
Please find the following supplemental material available below.
For Open Access articles published under a Creative Commons License, all supplemental material carries the same license as the article it is associated with.
For non-Open Access articles published, all supplemental material carries a non-exclusive license, and permission requests for re-use of supplemental material or any part of supplemental material shall be sent directly to the copyright owner as specified in the copyright notice associated with the article.