
Abstract
Medical advancements, particularly in ventricular assist devices (VADs), have notably advanced heart failure (HF) treatment, improving patient outcomes. However, challenges such as adverse events (strokes, bleeding and thrombosis) persist. Computational fluid dynamics (CFD) simulations are instrumental in understanding VAD flow dynamics and the associated flow-induced adverse events resulting from non-physiological flow conditions in the VAD.
This study aims to validate critical CFD simulation parameters for accurate VAD simulations interacting with the cardiovascular system, building upon the groundwork laid by Hahne et al. A bidirectional coupling technique was used to model dynamic (pulsatile) flow conditions of the VAD CFD interacting with the cardiovascular system. Mesh size, time steps and simulation method (URANS, LES) were systematically varied to evaluate their impact on the dynamic pump performance (dynamic
In particular, mesh and time step sizes were found to have the greatest influence on the calculated pump performance. Therefore, small time steps and large mesh sizes are recommended to obtain accurate dynamic
Keywords
Introduction
Advancements in medical technology have revolutionized the treatment of heart failure, prominently featuring ventricular assist devices (VADs) as life-saving interventions. These rotary blood pumps play a pivotal role in supporting heart function for patients with severe heart failure (HF), significantly enhancing quality of life and survival rates. 1 Nevertheless, despite therapeutic advances, patients continue to experience significant adverse events, including strokes, gastrointestinal bleeding and device thrombosis, associated with the use of VADs.2,3
The aim of research in the field of VADs is to improve the therapy and to minimise the adverse events associated with VADs. Computational fluid dynamics (CFD) simulations have become invaluable tools for investigating the non-physiological flow dynamic within VADs, which leads to these adverse events. Factors such as high shear stress and exposure times of unfavourable flow conditions on the blood components are key contributors.4–6 CFD simulations are therefore an essential part of the development of VADs.
CFD simulations are often the only way to gain a deeper insight into the flow of the VAD and to evaluate relevant factors to minimise adverse events.
In order to achieve the optimal VAD design and operational conditions for the sufficient HF patient support, it is essential that the CFD simulations accurately reflect the real-world conditions. Therefore, CFD simulation of the VAD should be performed in interaction with the cardiovascular system to account for the dynamic (pulsatile) operation environment of the VAD in the human body. 7 Since the VAD operates together with the still beating heart, dynamic boundary conditions at the inlet and outlet of the CFD domain of the VAD simulation are desirable, as they consider the physiological behaviour.
CFD simulations under dynamic inflow conditions8–14 are particularly challenging, as they differ significantly from static boundary conditions. The dynamic (pulsatile) flow conditions within a ventricular assist device (VAD) are significantly influenced by both the patient’s remaining heart function and the adjusted pump speed.
7
Consequently, the flow rate and pressure head dynamically changes (in time) throughout the cardiac cycle, resulting in dynamic progression of the pump performance, indicating a hysteresis for the dynamic
In previous studies from the literature, dynamic boundary conditions were already utilized to simulate VAD flow interacting with the cardiovascular system.8–14 These dynamic boundary conditions were often defined through experiments, employing in vitro or in vivo measurements. In contrast, in a novel approach of us, introduced by Hahne et al., 10 the 3D-VAD simulation was bidirectionally coupled with a lumped parameter model, representing the dynamic blood flow in the cardiovascular system. This integration allows for the automatic generation of dynamic boundary conditions without experiments beforehand.
As with all CFD studies, it is also essential to verify and validate the accuracy of VAD simulations, as changes to the simulation setup in CFD can have a significant impact on the simulation outcome. When examining literature studies that perform VAD CFD simulations under pulsatile boundary conditions, it is evident that a proper validation of the simulation is often lacking.11–13 Typically, validation is approached in one of three ways: (a) Validation at static operation points using ‘static CFD simulations’14–16; (b) no validation of the dynamic behaviour (dynamic
The authors believe that further research is necessary in the field of validating flow simulations in VADs, particularly regarding the impact of simulation parameters on dynamic
The aim of this study is to investigate the impact of simulation parameters on the simulated pump performance in a VAD simulation with dynamic boundary conditions. This research builds upon the work of Hahne et al.
10
In contrast to their general analysis of dynamic VAD flow interacting with the cardiovascular system, our study focusses on refining simulation methodology to accurately reproduce pump performance. Therefore, we systematically investigate the effects of varying simulation parameters – mesh size, time step and simulation method – to determine the optimal configuration for our bidirectionally coupled, dynamic VAD simulations for an accurate replication of the dynamic
Methods
Cardiovascular system model
To achieve patient-specific, dynamic (pulsatile) boundary conditions for the VAD CFD, we developed a bidirectional coupling between a lumped parameter model (LPM) simulating the cardiovascular system and the time-resolved 3D-CFD of the HeartMate 3. This coupling strategy accounts for the time-dependent interaction of the cardiovascular system with the VAD and is extensively detailed in a previous study. 10 A brief overview: Over several heartbeats, the LPM and the VAD CFD exchange after every time step crucial flow variables such as pressure and flow rate in a bidirectional and time-dependent manner. As both the LPM and the CFD respond to changes in these variables (e.g. the pressure-volume loop of the heart changes under VAD support), this interaction can generate pulsatile, dynamic boundary conditions for the VAD CFD.
The HF patient was represented in this study by adjusting the pressure-volume loop (p–V loop) of the left ventricle to the measured data as presented in Warriner et al. 19 Specifically, we utilized the mean p–V loop derived from 129 HF patients diagnosed with advanced heart failure according to ACC/AHA Stage D. This results in a modelled, damaged left ventricle with an end-diastolic left heart volume of 273 ml and an ejection fraction of 25%. It can therefore be reasonably asserted that the boundary conditions accurately reflect the characteristics of a ‘generic’, advanced heart failure patient.
Simulation method and turbulence modelling
Large-Eddy simulations (LES) and unsteady Reynolds-averaged Navier-Stokes (URANS) computations were employed to analyse the flow field in the HeartMate 3. LES offers a significant advantage by providing a detailed understanding of the flow field, including turbulence and turbulent stresses, as it directly resolves a portion of the turbulent flow. However, this advantage comes at the cost of longer computation times and more extensive flow verification compared to URANS. Both simulation methods utilized the commercial solver ANSYS Fluent 2023R2. Advection and diffusion fluxes were discretized using the Bounded Central Difference Scheme for LES and a Second Order Upwind Scheme for URANS.
For URANS turbulence modelling, the
For both methods, an implicit, second order differencing scheme was used for the discretization of the transient term. In addition, a double precision solver was used. The numerical model of the VAD contains both rotary and stationary domains. Both parts are connected by transient sliding interfaces.
Computational setup
Geometry and computational domain
The investigated VAD is the HeartMate 3 from Abbott Laboratories. We received the geometry digitally, which has been utilized in previous research studies. 14 Inflow and outflow cannulas were included in the computational domain.
Meshing
Block-structured grids with hexahedral-elements were manually created using ICEM CFD 2022R1. All hydraulic parts of the pump were considered. Two different meshes were created for URANS to examine the influence of the mesh on the dynamic
The mesh with 1 million nodes (Figure 1(a)), and the mesh, with 11 million nodes (Figure 1(b)), both exhibit the similar block structure. In the 1 million-node mesh, grid angles are maintained above 33°, and aspect ratios are below 600. In the 11 million-node mesh, grid angles exceed 36°, and aspect ratios are less than 100.
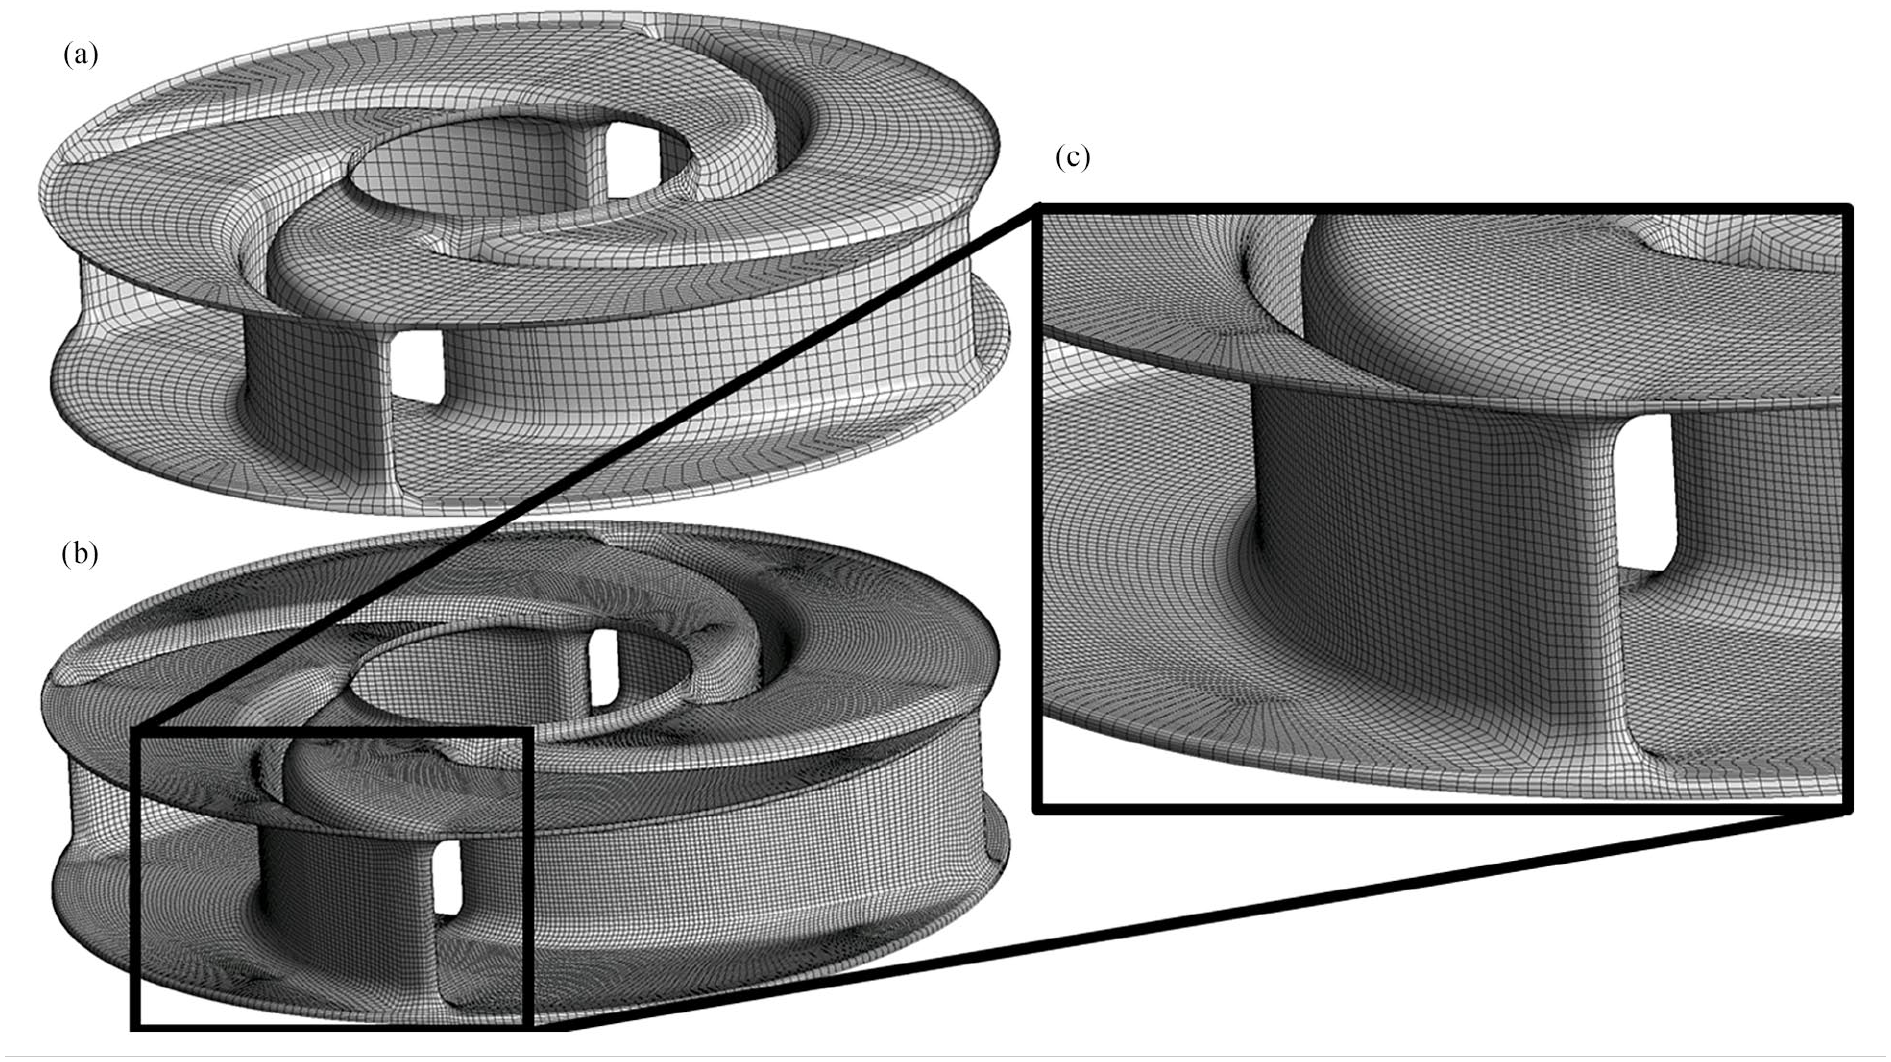
Overview of the mesh around the impeller: (a) 1 million mesh, (b) the same domain with 11 million mesh and (c) A zoomed view in the 11 million impeller mesh.
For studies utilizing the LES method, the 11 million-node mesh was also employed. The suitability of this mesh for LES was determined based on criteria beyond angles and aspect ratio considerations. Specifically, unless this mesh was not explicitly constructed for wall-resolving LES, 23 we will demonstrate in the results that the LES computation can be attributed as ‘LES-worthy’ in most parts of the domain. A larger, explicitly constructed LES mesh was not a viable option due to computational constraints in the current, bidirectional coupling strategy.
Boundary conditions and time steps
Blood was modelled as a Newtonian fluid, a valid assumption supported by our previous study demonstrating that blood’s non-Newtonian properties in low shear rate regions of the VADs have a negligible effect on the pump characteristics.
24
The fluid viscosity was
Pulsating, dynamic pressure boundary conditions for the VAD CFD were automatically provided by the LPM of the cardiovascular system as described in Hahne et al.
10
The CFD returns the instantaneous VAD flow rate to the LPM to account for the dynamic response in the cardiovascular system under VAD support. This exchange of boundary conditions occurs at every computed time step in the LPM and CFD. The rotational speed of the impeller was set to
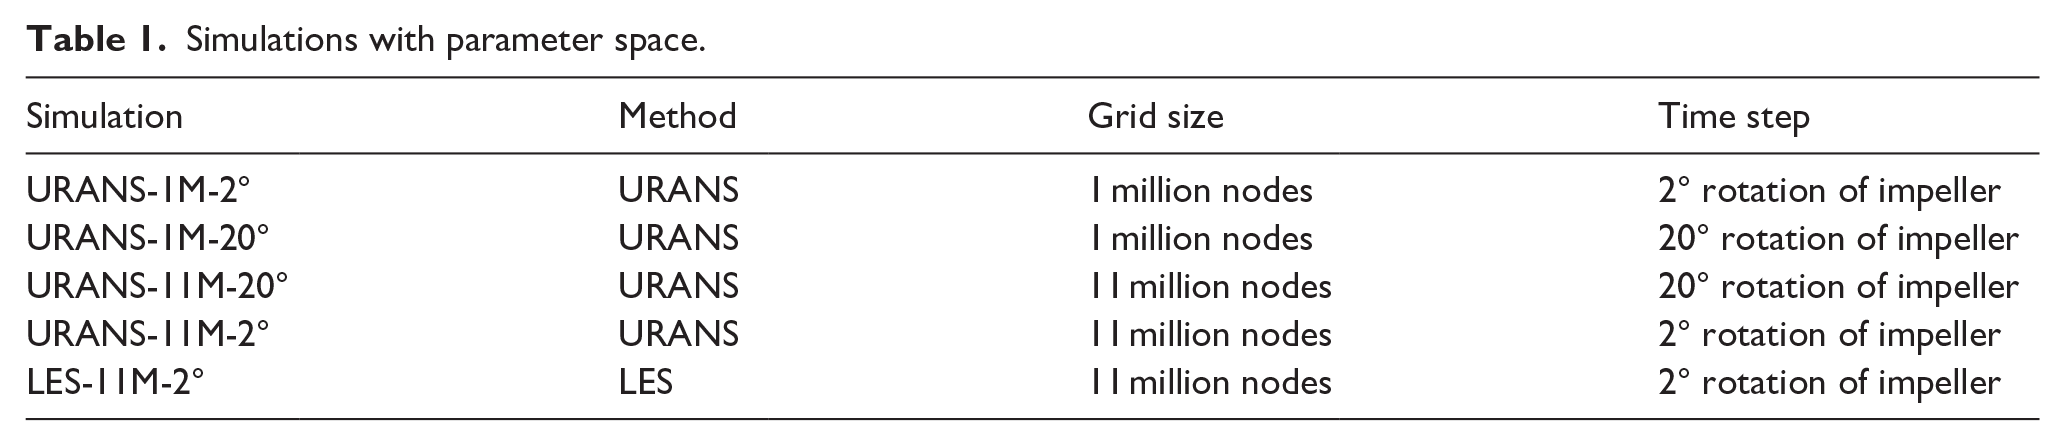
Simulations with parameter space.
Each simulation computed data from two heartbeats, with the dynamic
Analysis of parameter space for result evaluation
The aim of this study is to assess how various simulation parameters impact the dynamic
All URANS computations were performed with different grid sizes and time steps. Additionally, a LES simulation was conducted using the finest grid size (11M grid nodes) and the smallest time step (equivalent to 2° impeller rotation). At this specific time step, with a root-mean-square Courant number of 1.4, the LES simulations align with the recommended Courant numbers for LES (
Metric of quantification of the H–Q curves
In order to quantify and evaluate the dynamic
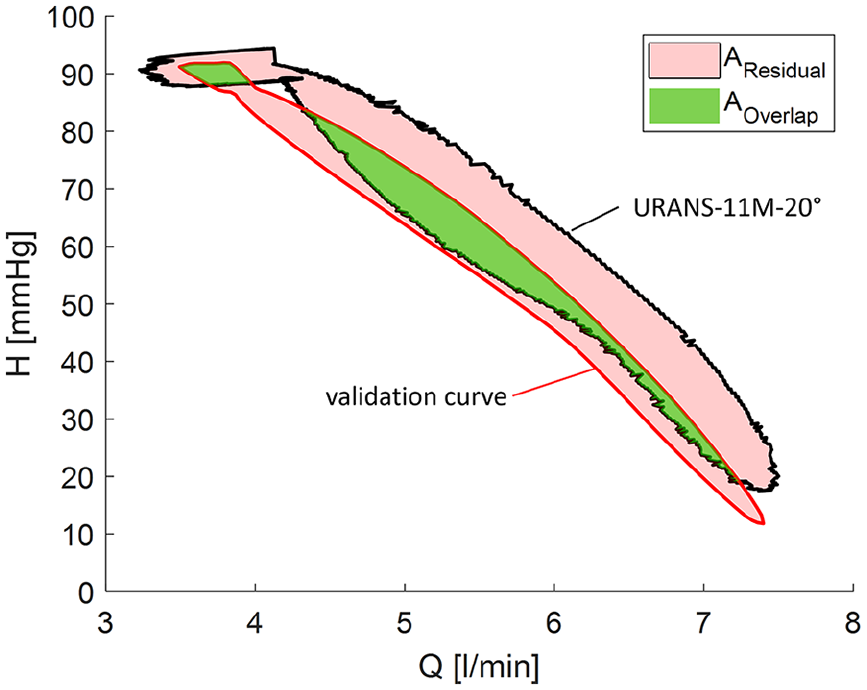
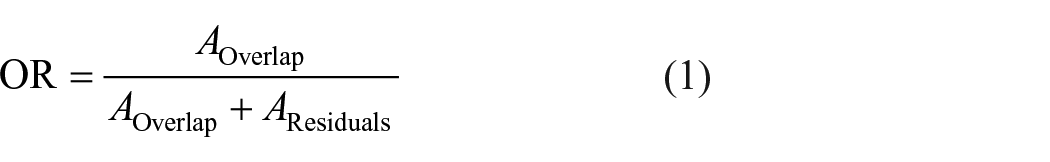
An Example for the Overlapping Ratio (OR): The ratio between the overlapping area (in green) (
The OR is the ratio between the overlapping area
Results and discussion
Quality assessment of LES
Every CFD study needs to be verified and validated to account for the quality of the simulation. The verification deals with estimating numerical errors, for example, due to the computational grid or time step. Contrarily, the validation examines if the simulation results reflect realistic results, which is realized by comparing the simulation results with experimental data. The URANS and LES methods are verified by investigating the convergence of time steps and mesh sizes. In a broader sense, the comparison of different dynamic
To validate the LES, we aim to delve deeper into the quality of our LES computation. Given that LES resolves a portion of the turbulent flow field directly, as discussed by Torner et al.,23,27 we seek to analyse the extent to which our LES simulation achieves this level of flow resolution and if the LES can be considered as ‘LES-worthy’. Therefore, a LES quality assessment study was conducted at a static operating point, which is in the ‘middle’ of the analysed, dynamic
For LES quality assessment, three verification criteria were applied, which are also explained in previous publications from our group.27–30 First, the degree of turbulent flow resolution was estimated in the core flow region. One way to assess this is to estimate the Kolmogorov length
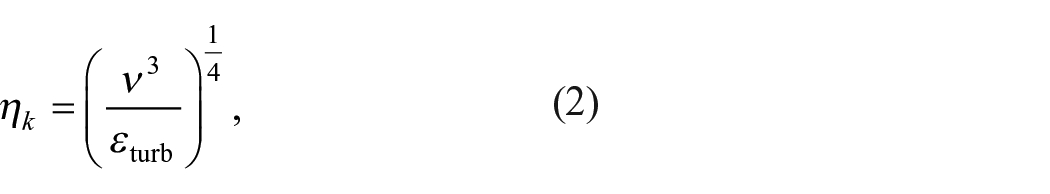
which follows from the theory of isotropic turbulence.
31
The local ratio
Secondly, a turbulence kinetic energy (TKE) frequency analysis as second criteria was performed in one spatial point of the impeller to assess the physical resolution of turbulence.
26
The resulting spectrum is shown in Figure 3. Aim of LES is to resolve the TKE spectrum up to the inertial subrange.
26
In this range, small turbulence scales are increasingly isotropic, making LES sub-grid scale modelling reasonable. According to Kolmogorov’s theory, this portion of the spectrum is characterized by a slope of
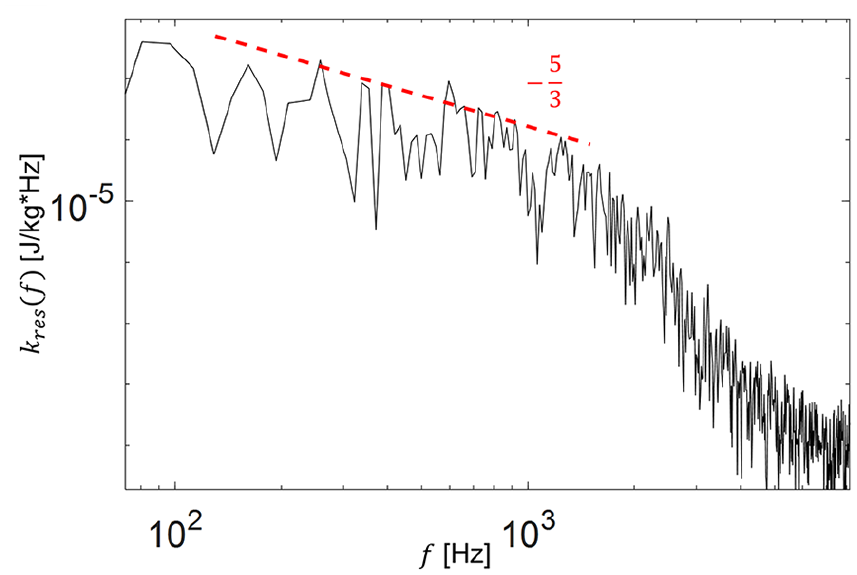
Turbulent kinetic energy (TKE) spectrum of the 11M mesh. The initial subrange converges towards
As a final and third verification step, we applied the Power Loss Analysis (PLA) outlined by Torner et al.27,33 to assess if flow losses are accurately resolved. The total power loss
Since these flow losses relate to the pump characteristics (
The results depicted in Figure 4 illustrate the outcomes of the Power Loss Analysis (PLA). The calculated power loss
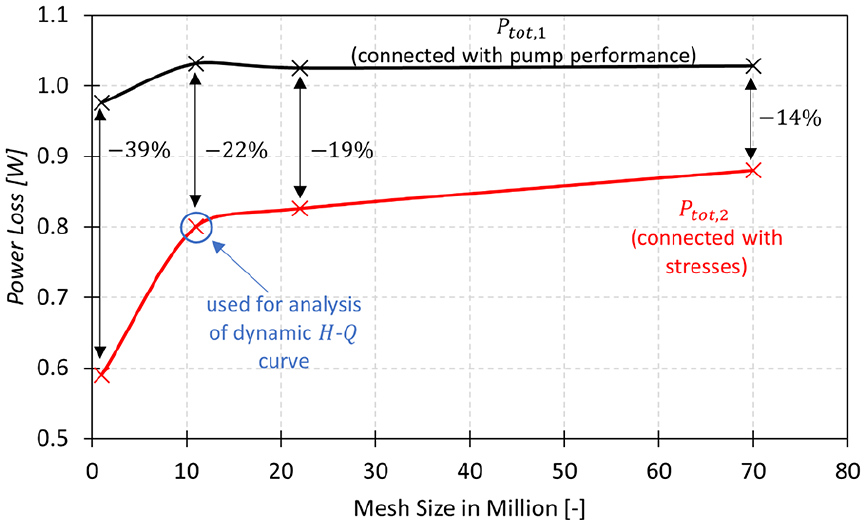
LES results of the Power Loss Analysis at different grid sizes.
At the 70M mesh, constructed according to wall-resolving LES guidelines, the relative deviation is approximately one third compared to the result of the 1M mesh (
Therefore, our quality assessment of the LES indicates a satisfactory outcome from the first two verification methods, leading us to conclude that our LES simulation with the 11M mesh meets the criteria for being deemed ‘LES-worthy’. The PLA has revealed that the pump performance (
One might wonder why the finer LES meshes (e.g. 70M) were not used for the analysis of the dynamic
Dynamic
curves
The dynamic
Dynamic
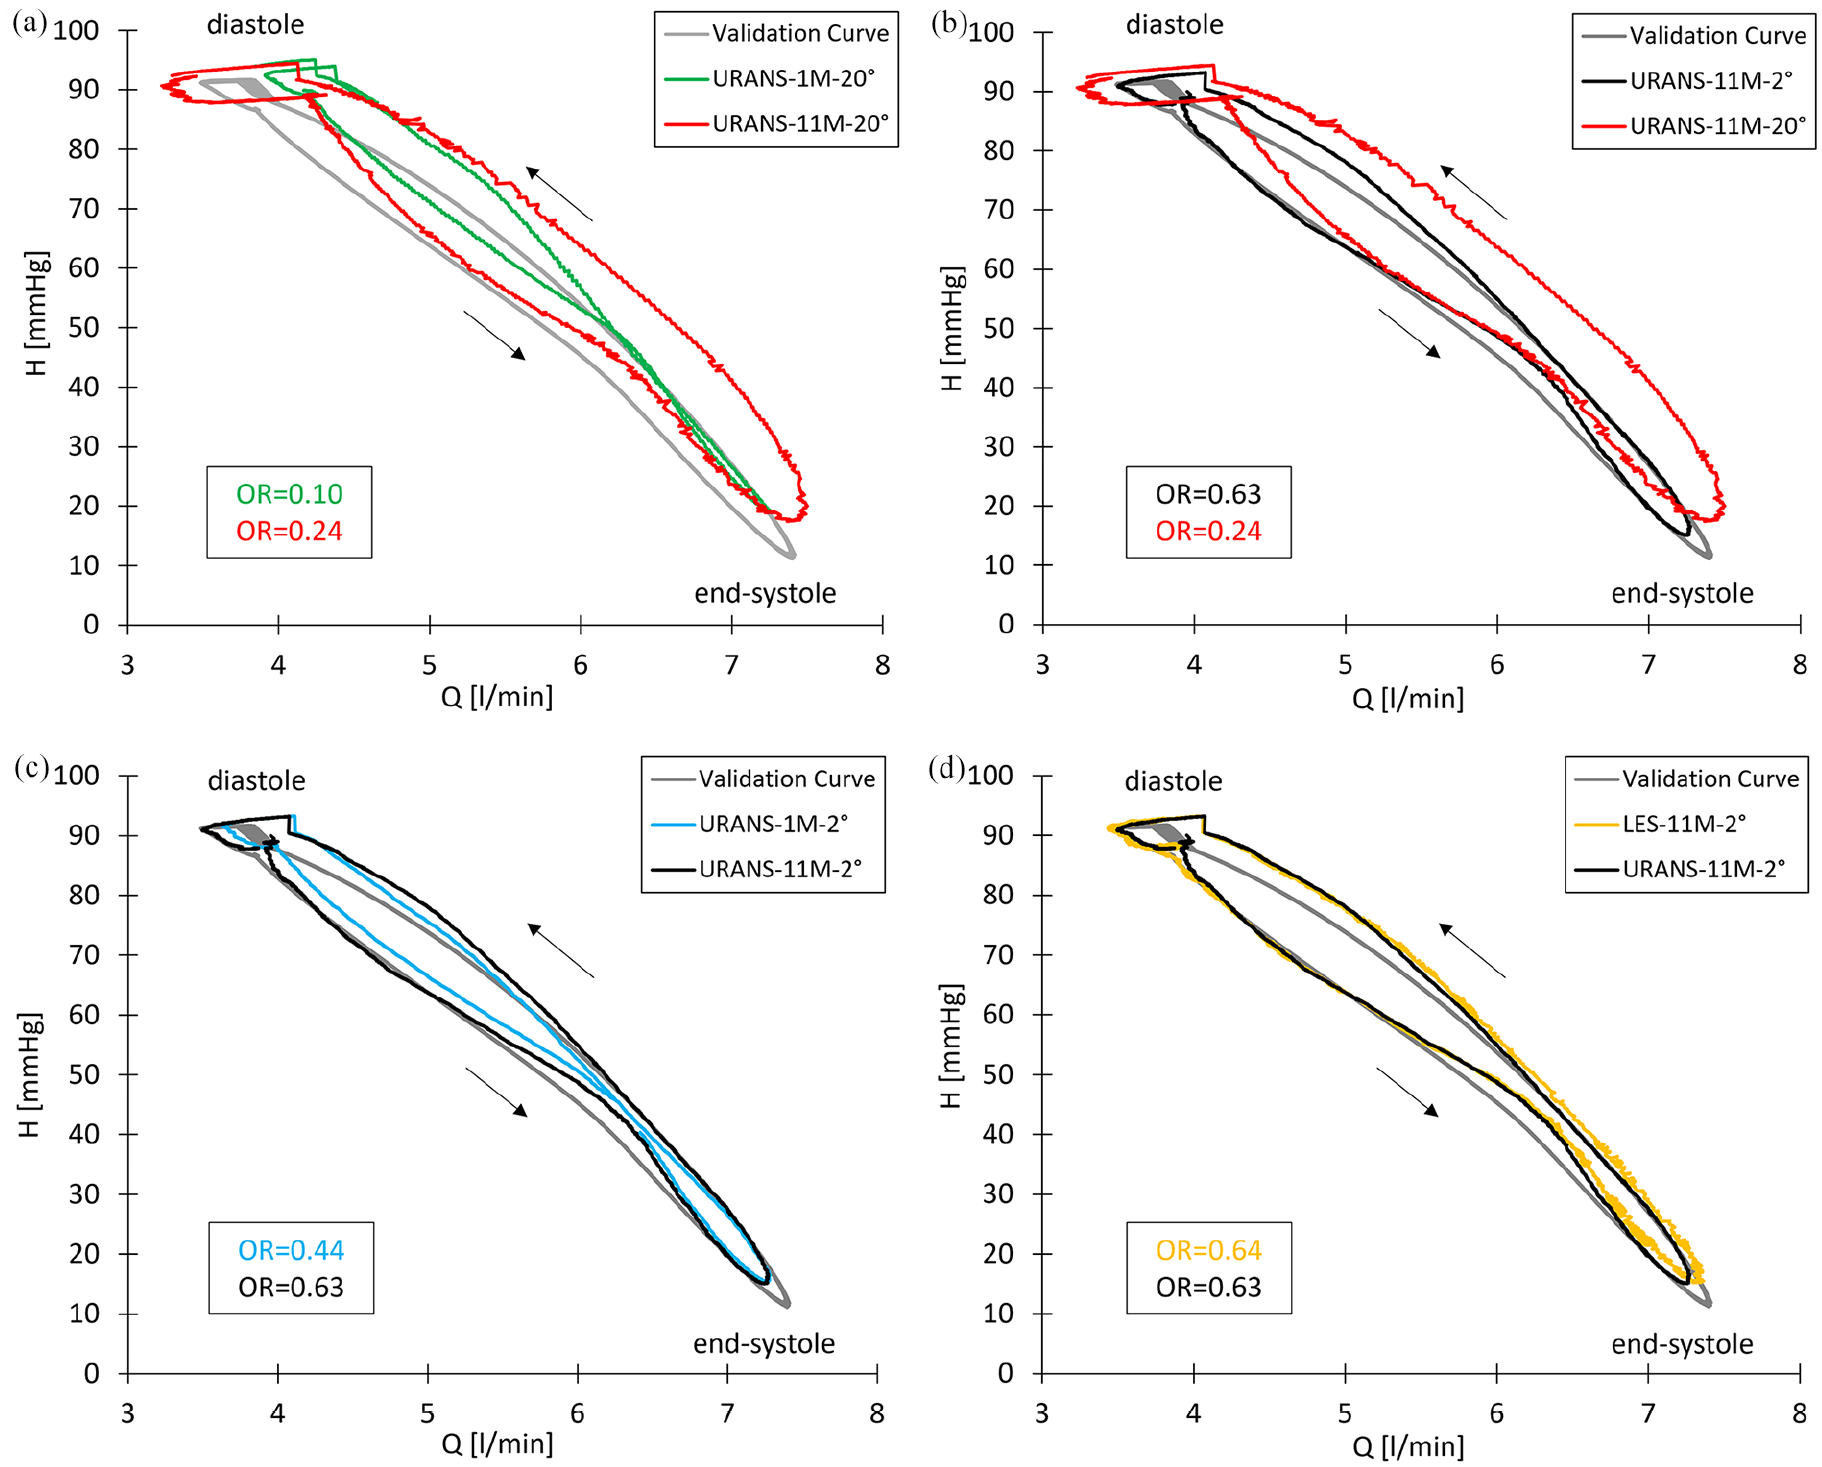
In Figure 5(a), we illustrate the influence of a large time step (20°) on URANS computations with two different mesh sizes. Particularly during the dynamic transition from low to highest flow rates (diastole to end-systole) and vice versa (end-systole to diastole), both simulations exhibit significant deviations from the validation curve (grey line). The OR value increases of only 0.10 to 0.24 with the larger mesh size, which can be considered as still relatively low. This improper alignment is attributed to the large time step, which prevents the simulation from accurately capturing the dynamic changes in pump performance. Importantly, even with a finer mesh size, the computation of pump performance would not be improved in this case.
As shown in Figure 5(b), the chosen time step has again a significant effect on the result, increasing the OR value significantly from 0.24 to 0.63 by reducing the time step from 20° to 2° for the 11M mesh. The simulation with the smaller time step is more accurate in capturing the dynamic changes of the pump than the simulation with the larger one.
When comparing different meshes computed at the same, smaller time step (Figure 5(c)), an increase in grid size leads just to a slightly improved
Lastly, the results between the URANS and LES methods for the finest mesh (11M) and smallest time step (2°) are compared in Figure 5(d). Both simulation methods produced comparable results for the pump performance, resembling the validation curve with just small deviations (OR values: 0.64 vs 0.63). However, the curve generated with URANS exhibited a smoother progression compared to the LES curve. In LES, some temporal fluctuation of the pressure head at a certain
It can be concluded that the selected time step has the most significant impact on the result, increasing the OR value from 0.24 to 0.63 by reducing the time step from 20° to 2°. An examination of the H–Q curves with the highest OR (as illustrated in Figure 5(d)) reveals a notable correlation with the validation curve. Consequently, we consider an OR value exceeding 0.60 as a first guess of a desirable target to quantify a properly computed dynamic
Summary and conclusion
In this study, we investigated several simulation parameters for their influence on computing the simulated, dynamic
This study offers a structured overview of the influence of simulation parameters on the dynamic pump performance of a VAD and implements a new intuitive method to quantify the accurate reproduction of the dynamic
Footnotes
Acknowledgements
The authors gratefully thank Dr. Bente Thamsen for providing the digital geometry of the HeartMate 3.
Declaration of conflicting interests
The author(s) declared no potential conflicts of interest with respect to the research, authorship, and/or publication of this article.
Funding
The author(s) received no financial support for the research, authorship, and/or publication of this article.