
Abstract
Rationale:
Current estimation of body fluid volumes in hemodialysis patients using bioimpedance analysis assumes constant specific electrical characteristics of biological tissues despite a large variation in plasma Na+ concentrations [Na+], ranging from 130 to 150 mmol/L. Here, we examined the potential effect of variable [Na+] on bioimpedance-derived volume overload.
Method:
Volumes were calculated from published whole-body extra- and intracellular resistance data and relationships using either “standard” or “revised” specific electrical characteristics modeled as functions of [Na+].
Result:
With “standard” assumptions, volumes increased with increasing [Na+]. The increase in volume overload was about 0.5 dm3 and 3% of extracellular volume per 10 mmol/dm3 of [Na+] in a 75 kg patient. This increase was abolished when the same bioimpedance data were analyzed under “revised” conditions.
Discussion:
The overestimation in extracellular volume overload in the range of 0.5 dm3 per 10 mmol/dm3 [Na+] perfectly matches the positive relationship determined in a large cohort of hemodialysis patients. The bias may be considered moderate when interpreting data of individual patients, but may become important when comparing data of larger patient groups. The bias disappears when analysis of bioimpedance data accounts for differences in tissue electrical properties, using individual [Na+].
Keywords
Introduction
In clinical practice body composition and fluid volumes can be assessed by bioimpedance spectroscopy, capturing the resistance of biological tissue to small alternating electrical currents with frequencies ranging from 5 kHz to 1 MHz. 1 Bioimpedance spectroscopy-derived estimates of fluid volume are of particular value in individuals with chronic kidney disease (CKD) on dialysis, to quantify fluid volume overload and adjust the prescription of ultrafiltration, otherwise derived from gain of interdialytic body mass alone.2,3
Estimating fluid volumes using bioimpedance is based on the assumption that the specific electrical characteristics of biological tissue are known, and above all are constant. 4 Moreover, all variation in bioimpedance is assumed to be caused by the sole variation in fluid volume. The assumption that a particular tissue volume has constant specific electrical characteristics, however, must be questioned.
The determination of fluid volumes analyzing the electrical characteristics of tissue is better understood resorting to resistance, and even better, to conductance, the inverse of resistance. Conductance shows a direct linear relationship with fluid volume and/or electrolyte concentration, while the relationship between resistance (the inverse of conductance) and fluid volume is non-linear. (Note: The specific conductance of dialyzate which is closely related to extracellular fluid in its electrolyte composition is routinely and continuously measured in all dialysis machines. The specific conductance of plasma which represents a sample of extracellular fluid has also been available with certain dialysis machines without additional blood sampling for almost 30 years. 5 )
Specific conductance (i.e. conductance across a unit surface per unit volume given in S/m, which is also termed conductivity and which must not be confused with overall conductance) increases with concentration, dissociation, and mobility of electrolytes. The latter is related to solute diffusivity and solution viscosity. Electrolyte conductivity therefore increases with sample temperature. In the concentration range of interest, that is, 120–160 mmol/dm3, conductivity of pure aqueous NaCl solution increases in an almost perfect linear relationship with sodium concentration. 6 Therefore, a given relative increase in sodium concentration causes a close to identical relative increase in conductivity. Of note and practical interest, the same is true for dialyzate where sodium and chloride ions are the main conducting components. 7 The conductivity of dialyzate can therefore be used to monitor and control the proper dialyzate sodium concentration for hemodialysis. Plasma contains many other electrolytes compared to dialyzate, but its conductivity still shows a very strong linear dependence on sodium concentration which remains the main component of extracellular conductivity. 8
Individual plasma sodium concentration is tightly controlled by physiologic osmoregulation, but the precise set-point corresponding to a given sodium concentration varies among individuals.9,10 A wide spectrum of sodium concentrations ranging from 130 to 150 mmol/dm3 was also found in 14,942 measurements obtained from 3632 dialysis patients in 60 dialysis centers from four countries (NephroCare/Europe) in whom bioimpedance-based volume estimates were also available, and in whom a positive association between plasma sodium concentration and volume overload was found. 11 Because of the linear relationship between sodium concentration and plasma conductivity 8 the variation in plasma sodium concentration can be assumed to translate into a comparable variation in extracellular fluid conductivity.
In the present study, we therefore asked to which degree such a variation may affect the calculation of fluid spaces in hemodialysis patients using current bioimpedance analysis, and how this effect can be accounted for to improve the estimation of fluid volumes.
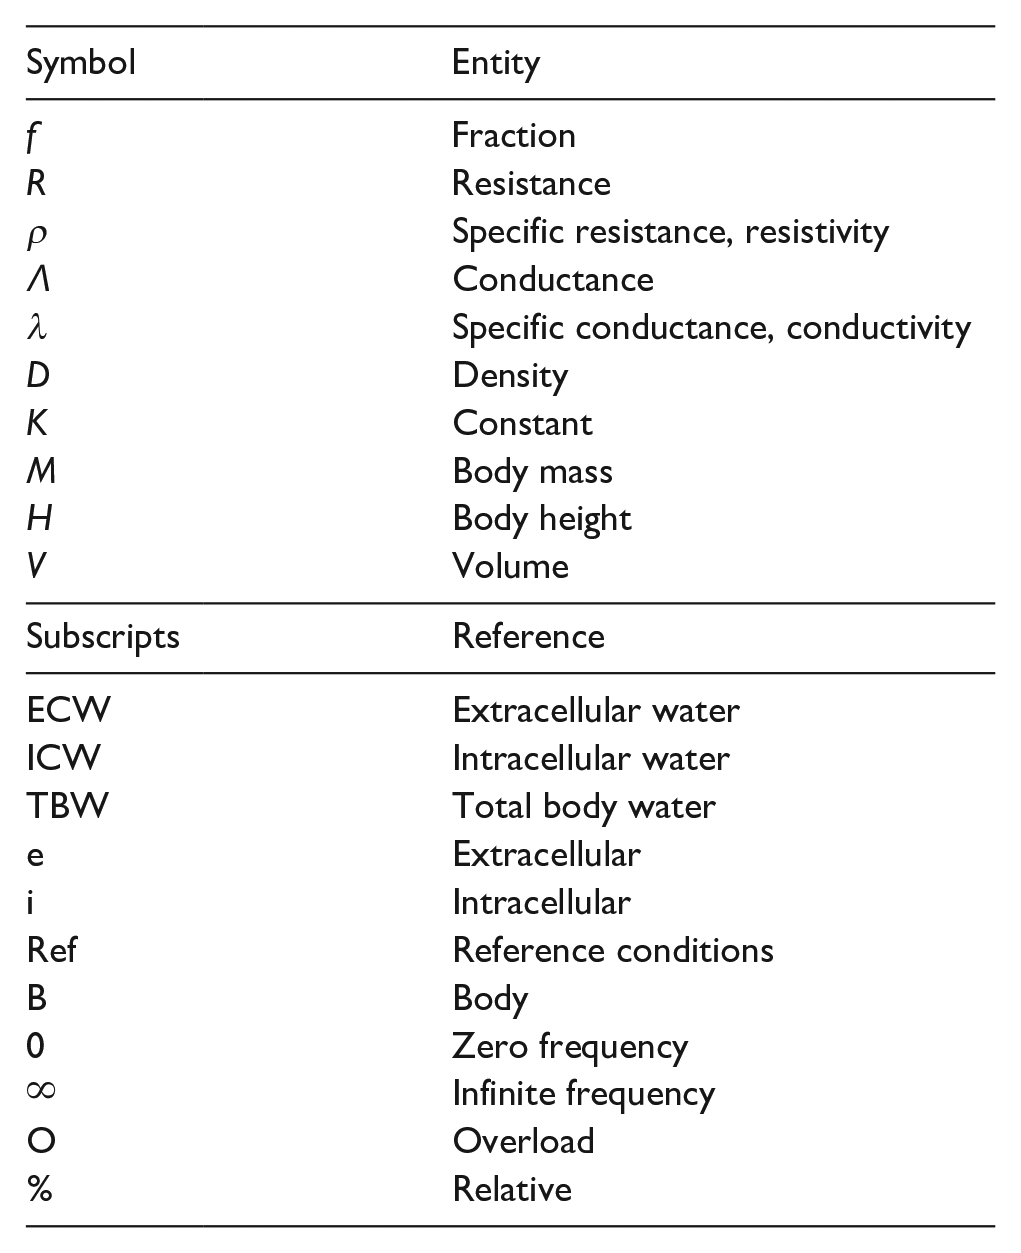
Symbols and abbreviations
Material and methods
The effect of a variable sodium concentration [Na+]’ relative to a reference plasma sodium concentration [Na+]ref at 140 mmol/dm3 was examined for whole-body bioimpedance spectroscopy providing resistances at zero and infinite frequency (R0, R∞).
The analysis was based on resistance rather than conductance as equations for volume estimation are usually expressed in terms of resistance (see the Appendix).
Baseline resistances R0 and R∞ were first modeled for a subject at [Na+]ref to obtain plausible extracellular, intracellular, and total body water volumes under reference sodium concentrations using equations published elsewhere and summarized in the Appendix. 12 Fluid overload was calculated as described by Chamney et al. 13 A moderate pre-dialysis volume overload of about 1.5 L corresponding to 9% of extracellular volume and a steady state sodium concentration were assumed when bioimpedance measurements are taken before dialysis and ultrafiltration.
Then, a deviation of sodium concentration from reference conditions was assumed and quantified by the factor fref = [Na+]’/[Na+]ref. Based on the linear dependence of conductivity on electrolyte concentration, this factor was also used to account for bioelectrical properties deviating from reference conditions. The actual extracellular resistance at zero frequency indicated by the prime was determined as R0’ = R0/fref. The same factor fref was used for resistance at infinite frequency R∞’ = R∞/fref when osmotic and conductive effects were assumed to have equilibrated throughout whole body water at the end of the inter-dialytic period and where the osmotic set-point is presumably attained.
Compartment volumes were then computed from R0’ and R∞’ using either standard or revised model assumptions. In the first setting assuming standard assumptions (“standard”) volumes and volume overload were determined using published conductivities (λ) in both extra- and intracellular water, as it is done with current bioimpedance analysis. Calculations were performed, assuming equilibration of osmotic and conductive effects in extracellular water only (“ECW,” where fref was only applied to R0) or throughout total body water (“TBW,” where fref was applied both to R0 and R∞).
In the second setting using revised assumptions (“revised”), the calculation of volumes accounted for actual conductivities (λ’), where λ’ = λfref.
Results
Calculations were performed for an average subject with 75 kg body mass and 175 cm body height. As intra- and extracellular conductivities used in published equations are sex specific, and aiming to focus on effects of constant or variable conductivities, calculations referred to male sex only. Reference conditions were characterized by a plasma sodium concentration of 140 mmol/dm3. The effect of variable sodium concentration was examined for plasma sodium concentrations of 130 and 150 mmol/dm3.
The calculations are summarized in Table 1. Modeled resistances R0, Ri, and R∞ at baseline (fref = 1) were 575.0, 1115.0, and 379.4 Ω, respectively. These resistances provided extracellular, intracellular, and total body water volumes of 18.32, 24.95, and 43.27 dm3. The extracellular volume overload before dialysis was 1.53 dm3 or 9.11% (Table 1, first numeric column).
Water volumes and extracellular sodium concentrations.
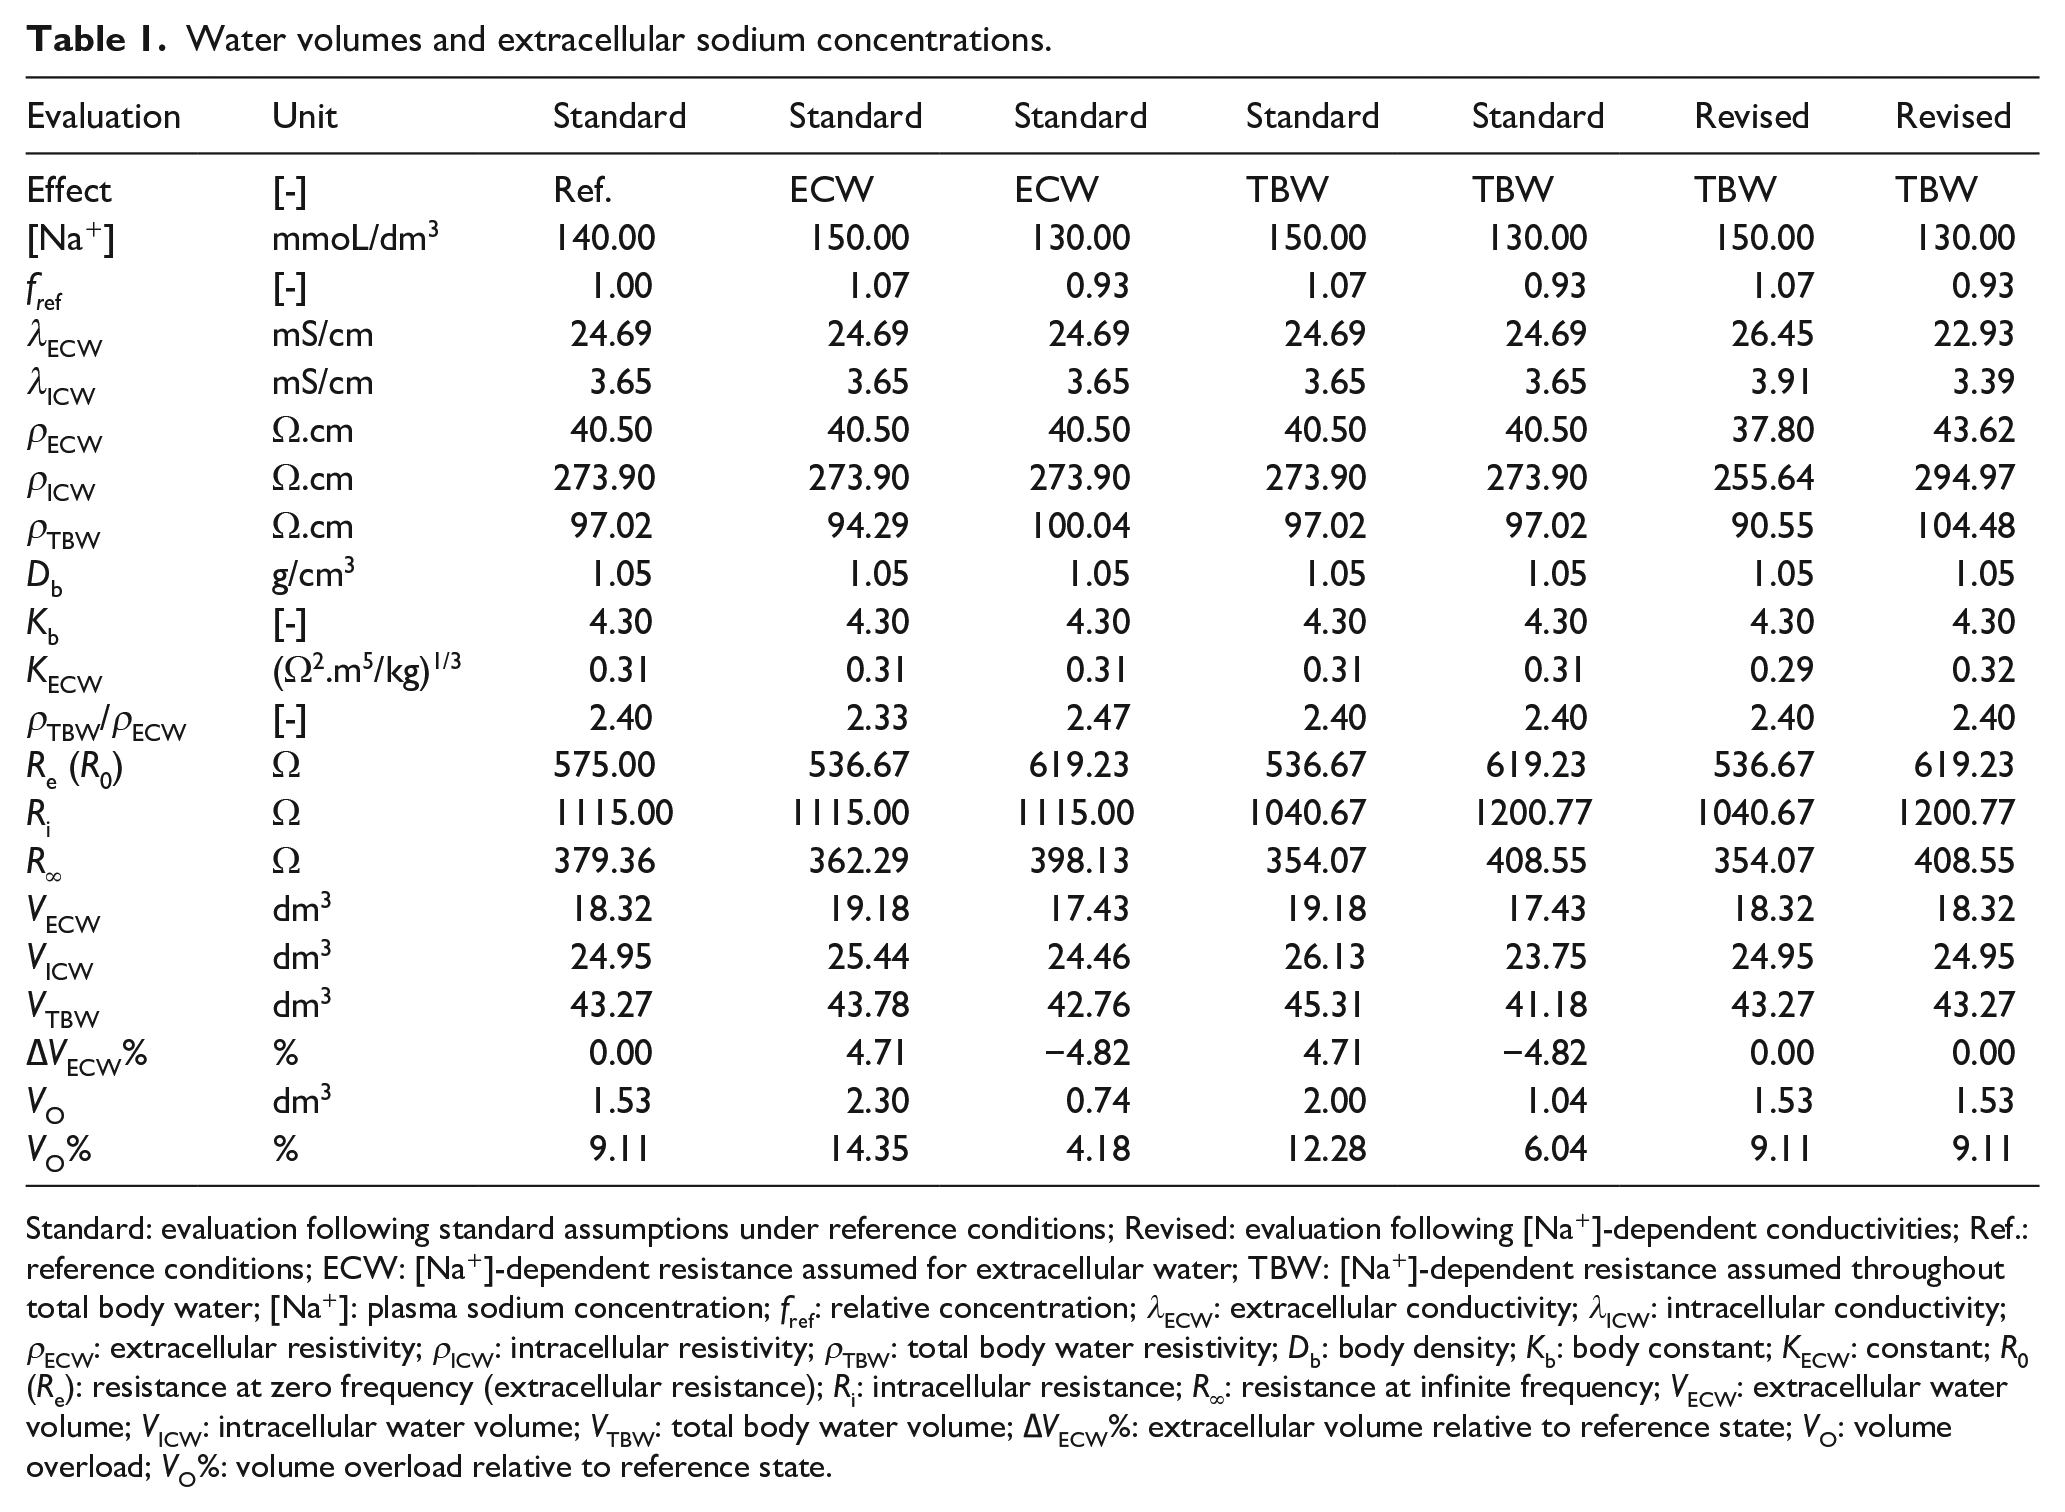
Standard: evaluation following standard assumptions under reference conditions; Revised: evaluation following [Na+]-dependent conductivities; Ref.: reference conditions; ECW: [Na+]-dependent resistance assumed for extracellular water; TBW: [Na+]-dependent resistance assumed throughout total body water; [Na+]: plasma sodium concentration; fref: relative concentration; λECW: extracellular conductivity; λICW: intracellular conductivity; ρECW: extracellular resistivity; ρICW: intracellular resistivity; ρTBW: total body water resistivity; Db: body density; Kb: body constant; KECW: constant; R0 (Re): resistance at zero frequency (extracellular resistance); Ri: intracellular resistance; R∞: resistance at infinite frequency; VECW: extracellular water volume; VICW: intracellular water volume; VTBW: total body water volume; ∆VECW%: extracellular volume relative to reference state; VO: volume overload; VO%: volume overload relative to reference state.
Data are also tabulated for assumed plasma sodium concentrations of 130 and 150 mmol/dm3 and different modeling assumptions. Calculations were done under the assumption that the resistance effect of reduced plasma sodium concentration was equilibrated throughout the extracellular compartment (Table 1, columns indicated “ECW”) or throughout total body water (Table 1, columns indicated “TBW”). This led to proportional changes in resistances R0’, Ri’, and R∞’. These new resistance values were then used to calculate body fluid volumes and fluid volume overload using either standard (Table 1, indicated “Standard”) or revised (Table 1, indicated “Revised”) modeling assumptions for intra- and extracellular conductivities (and resistivities).
The calculations revealed a positive relationship between estimated fluid volumes and sodium concentration. The sensitivities of the change in various volume estimates per unit plasma sodium concentration for different modeling assumptions are summarized in Table 2. The modeled increase in volume overload was about 0.78 dm3 and 5% of extracellular volume per 10 mmol/dm3 of sodium concentration assuming a steady state throughout the extracellular volume only (Table 2, first numeric column). The overestimation was smaller at 0.48 dm3 and about 3% of extracellular volume per 10 mmol/dm3 sodium concentration assuming equilibration of conductive effects throughout extra- and intracellular volumes (Table 2, second numeric column). A comparison of modeled volumes with experimental data is shown in Figure 1.
Sodium sensitivity of volume estimations.
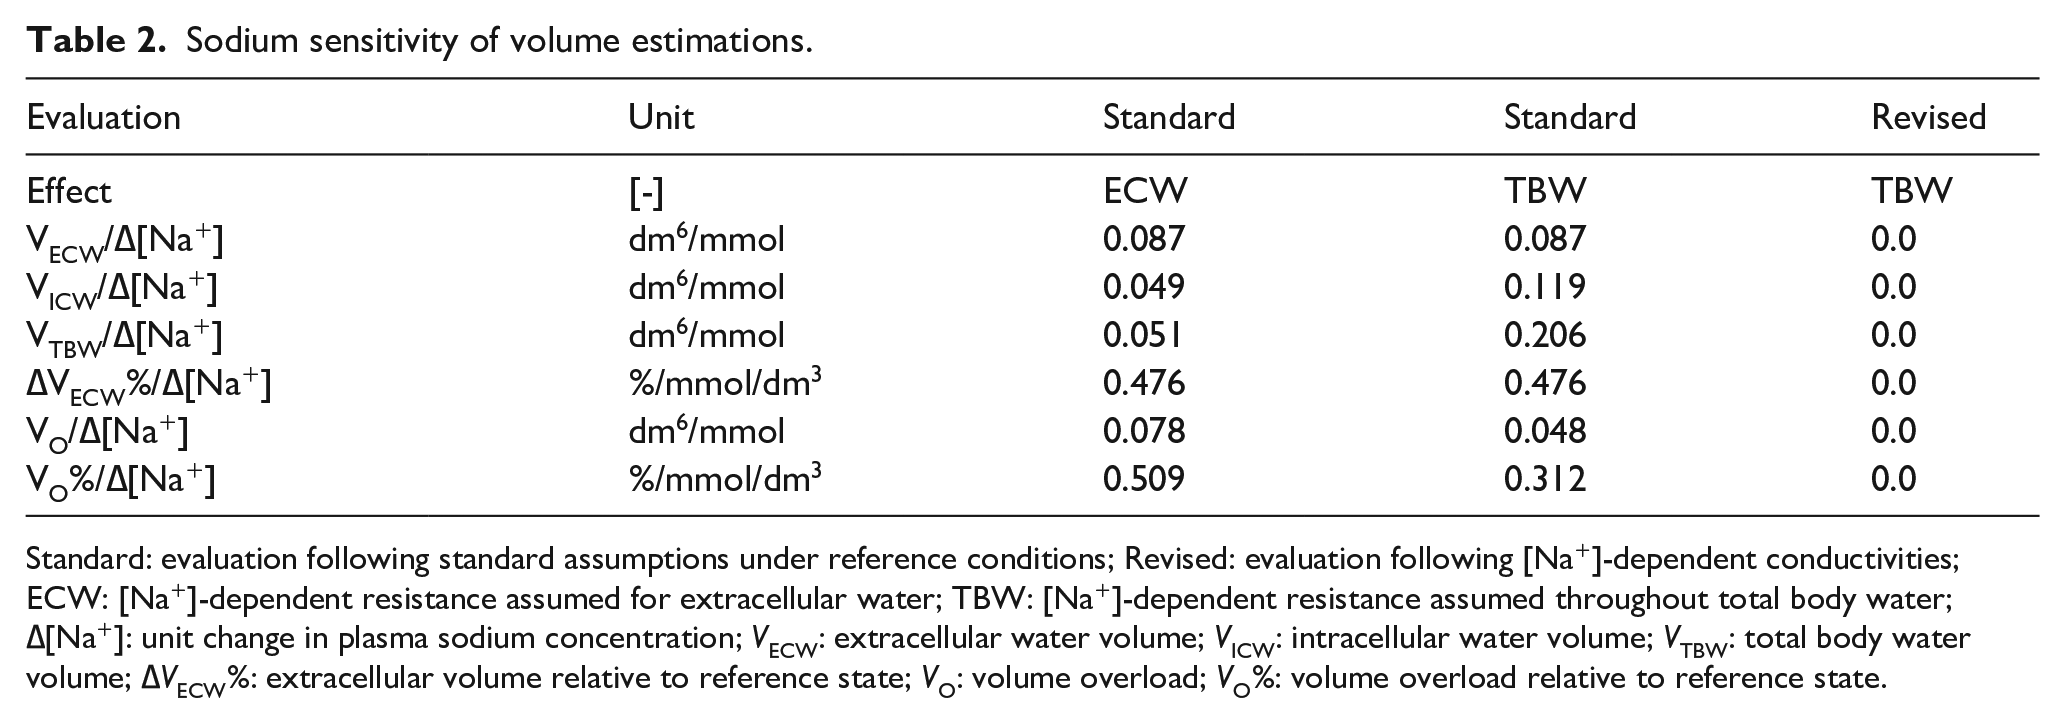
Standard: evaluation following standard assumptions under reference conditions; Revised: evaluation following [Na+]-dependent conductivities; ECW: [Na+]-dependent resistance assumed for extracellular water; TBW: [Na+]-dependent resistance assumed throughout total body water; ∆[Na+]: unit change in plasma sodium concentration; VECW: extracellular water volume; VICW: intracellular water volume; VTBW: total body water volume; ∆VECW%: extracellular volume relative to reference state; VO: volume overload; VO%: volume overload relative to reference state.
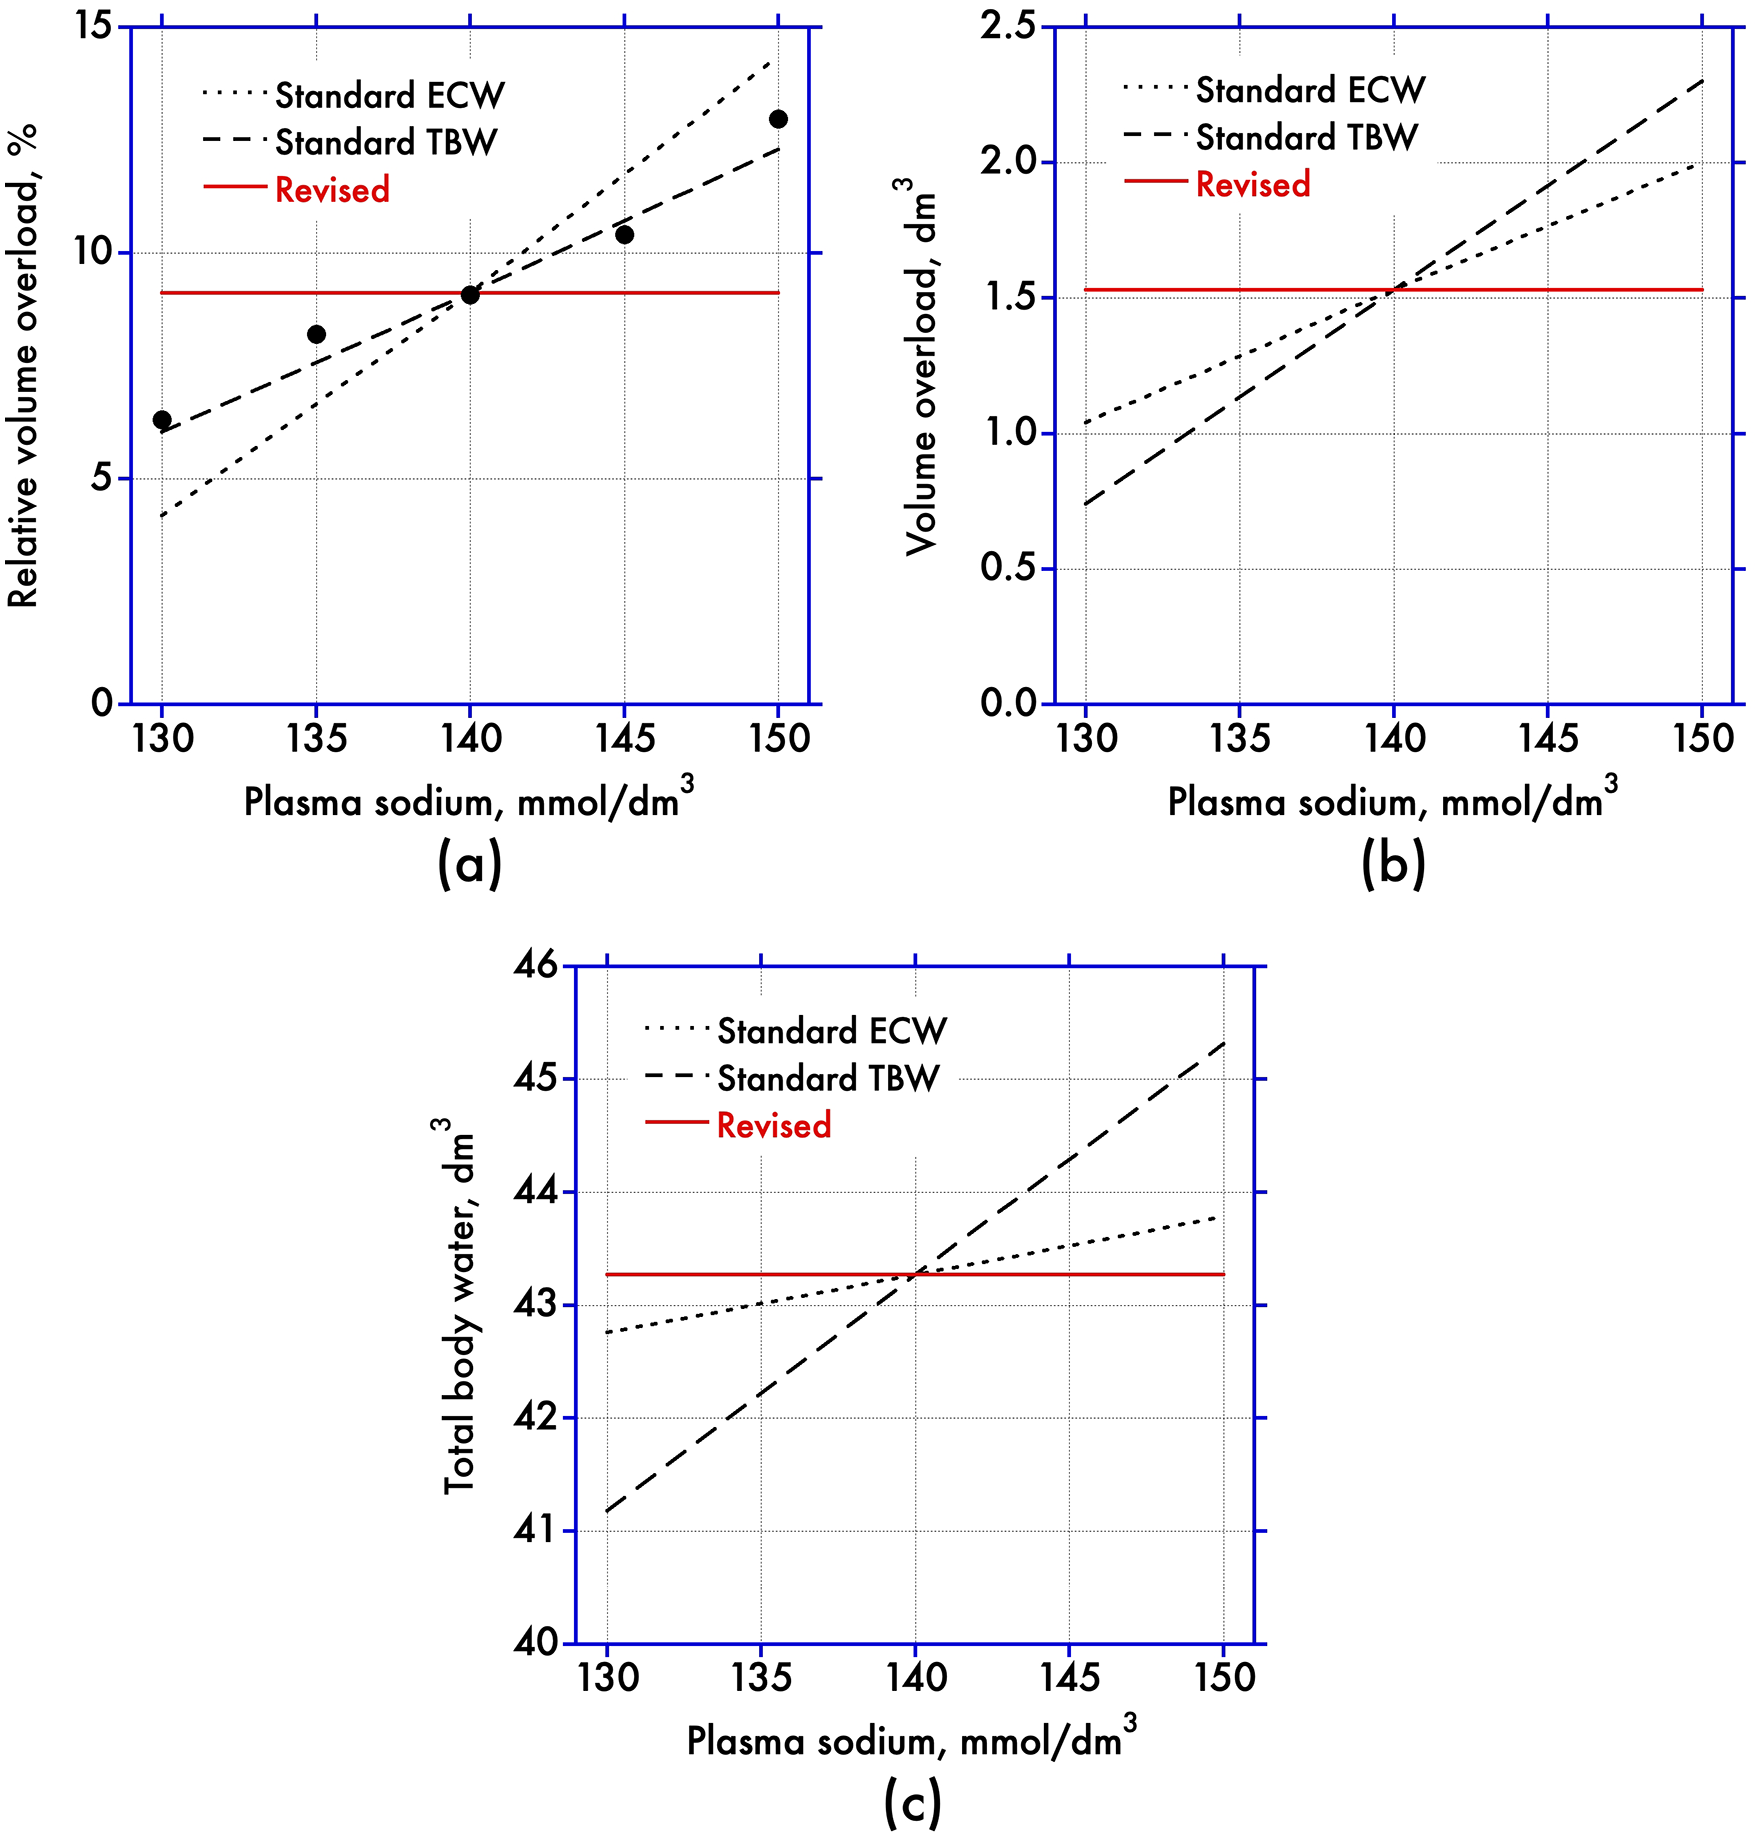
[Na+] and volume overload. Volumes and volume overload computed for modeled bioimpedance data as function of plasma sodium concentration based on standard (“Standard”) and revised (“Revised”) modeling assumptions. Dotted (“ECW”) and broken (“TBW”) lines predict effects for osmotic and conductive equilibration in extracellular and total body water based on standard (Standard) analysis. Full lines predict effects for osmotic and conductive equilibration in both intra- and extracellular compartments for revised (Revised) analysis. (a) Relative volume overload; full circles denote data from literature obtained with standard analysis, 11 (b) Absolute volume overload, and (c) Total body water.
The calculations using variable intra- and extracellular conductivities, however, provided constant fluid volumes (Table 2, second numeric column) independent of variable plasma sodium concentration.
Discussion
Here we show that the estimation of body fluid volumes and fluid volume overload derived from bioimpedance depend on plasma sodium concentrations when data are analyzed assuming constant extra- and intracellular conductivities under reference conditions. The error for total body water is in the range of 2.1–0.5 dm3 and that of volume overload is in the range of 0.5–0.8 dm3 per 10 mmol/dm3 of variation in plasma sodium concentration, respectively. The exact magnitude depends whether osmotic and conductive effects of sodium concentration are equilibrated throughout whole body water or extracellular volume alone. The overestimation is eliminated when correcting extra- and intracellular conductivities with a factor for actual relative plasma sodium concentrations.
The overestimation in the range of 3% of extracellular volume per 10 mmol/dm3 sodium concentration based on conductive and osmotic effects having equilibrated throughout total body water perfectly matches the association determined in a large cohort of dialysis patients described previously 11 :
“(Figure 3(a)), Association between predialysis volume status and the predialysis SNa concentration. Significant, positive, unadjusted association between VOpre and predialysis SNa (R = 0.12, p < 0.0001), indicating that HD patients who are volume overloaded have higher predialysis SNa concentrations. Results were consistent when every patient was only included once (R = 0.12, p < 0.0001). Continuously expressed, VOpre was higher, by 2.9% ECV, for every 10 mEq/L higher the predialysis SNa concentration.”
In this previous analysis the weak but positive association between volume overload and pre-dialysis sodium concentration (R = 0.12, p < 0.0001) was speculated to relate to increased sodium intake even though the relationship between dietary sodium intake and plasma sodium concentration was considered implausible based on the study of Mc Causland et al. 14 The analysis provided in this manuscript resolves the uncertainty as the positive association between volume overload and pre-dialysis plasma sodium concentration can be explained by spurious volume calculations when bioimpedance data are not corrected for effects of conductivity caused by the variation in plasma sodium concentration. The positive association disappears when the analysis of bioimpedance data accounts for changes in tissue conductivities.
The resulting independence of volume overload regarding pre-dialysis plasma sodium concentration is also in line with the notion that plasma sodium concentration is determined by the set-point of the central osmostat and independent of (extracellular) volume regulation.
The almost perfect coincidence of theoretical predictions with experimental data is in support of assuming osmotic and conductive equilibration of variable sodium concentrations throughout total body water (Figure 1, panel a). The assumption of equilibration only in the extracellular compartment predicts even larger deviations. A variation in equilibrated pre-dialysis plasma sodium concentration by 10 mmol/dm3 between two 75 kg subjects causes an error of 0.5 dm3 in estimated fluid volume overload. This bias is moderate when interpreting data of individual patients, but it is important when comparing data of larger patient groups.
Concerns of assuming constant compartment conductivities are not new, especially in applications with dialysis where a change in the ionic composition of extra- and intracellular compartments is expected. Olthof et al. 15 measured a significant pre- to post-dialysis drop in extracellular conductivity. de Vries et al. 16 also measured a smaller drop in intracellular conductivity. Sinning et al. 17 concluded that “resistance is affected more by changes in blood composition than by fluid volumes during the course of dialysis”. Scharfetter et al. 18 modeled the exchange of Na+, K+, Cl−, HCO3−, and H+ between extra- and intracellular compartments during hemodialysis and quantified that errors in the estimation of extra- and intracellular volumes by bioimpedance were about 2% for an average increase in sodium concentration by 5 mmol/dm3. This finding compares well to the 3% error per 10 mmol/dm3 sodium concentration obtained in this study.
As the concentration of major extracellular electrolytes is easily accessible in hemodialysis, corrections to account for their intra-dialytic change have been suggested before. 19 Such correction, however, remains unsatisfactory because the perturbation caused by ultrafiltration and solute removal is not equilibrated throughout the whole body at the end of dialysis. Therefore, rather than waiting for full post-dialysis equilibration of fluids and electrolytes which takes at least half an hour, bioimpedance is practically assessed before dialysis even if this state is volume expanded. Pre-dialysis conditions are also more physiologic with regard to osmoregulation, as the CKD patient tends to adjust the uptake of free water to achieve the set-point of the individual osmostat. 9 This state, however, reveals that individual and equilibrated plasma sodium concentration is more variable than previously anticipated.
Volume estimation by bioimpedance analysis is based on constant extra- and intracellular fluid conductivities (λ ECW = 24.69 mS/cm, λ ICW = 3.65 mS/cm, Table 1). 12 Plasma and dialyzate conductivities reported for a standard temperature of 25°C are about 10 mS/cm smaller and in the range of 14–15 mS/cm only, despite almost identical ionic composition to extracellular fluid. With a positive temperature coefficient of about 2% per °C, 20 about half of the overall discrepancy in conductivities can be explained by a 12°C higher body temperature in bioimpedance applications. The remaining discrepancy in the magnitude of 5 mS/cm remains unexplained. As a conductivity of 1 mS/cm corresponds to about 10 mmol/dm3 of sodium concentration, 8 this remaining discrepancy corresponds to a sodium concentration of about 50 mmol/dm3.
It is now well accepted that not all extracellular sodium is osmotically active. 21 A considerable amount of extracellular sodium is sequestered with anionic proteoglycan moieties in connective tissue. This sodium can be visualized by 23 Na+ magnetic resonance imaging techniques. 22 Part of it can be mobilized during hemodialysis. 23 While osmotically inactive at the systemic level, this sodium contributes to extracellular conductivity and affects volume estimations using bioimpedance analysis. 24 The concentration of this tissue sodium is in the range of 25–30 mmol/dm3, 23 equivalent to a conductivity of 2.5–3 mS/cm which further narrows the gap between extracellular conductivity used in bioimpedance analysis and plasma conductivity.
Tissue sodium content is elevated in CKD patients and has been estimated to cause a systematic overestimation in extracellular volume by about 1 dm3 in this group of patients. 24 Such overestimation also explains part of the higher bioimpedance volumes found in type-2 diabetes mellitus patients presenting with increased tissue sodium levels. 25
Because of the relationship between extracellular conductivity and tissue sodium one can speculate whether the measurement of extracellular conductivity at euvolemia, for example, in the limb19,26 could serve as a measure for tissue sodium content.
In conclusion, as plasma sodium concentration is more variable in the equilibrated steady state than previously anticipated, the effect of variation in pre-dialysis sodium concentration on estimation of volume overload is in the range of ±0.5 dm3. However, this effect is easily accounted for by adjusting extra- and intracellular conductivities used in bioimpedance analysis by a proportionate amount relative to a baseline conductivity under reference conditions. The adjustment is simple, especially with new dialysis machines providing an on-line plasma conductivity without additional blood sampling. Such an approach has the potential to increase the accuracy of bioimpedance based volume estimations.
Footnotes
Appendix
The formulas to determine body compartment volumes from whole-body wrist-to-ankle bioimpedance measurements have been presented previously. 12 Extracellular water volume VECW (in dm3) is calculated as
where H refers to body height (in cm), M is body mass (in kg), and R0 is resistance at zero frequency. The factor KECW accounts for body shape (Kb), body density (D), and extracellular resistivity (ρECW) and is given as
Body density (D = 0.00105 kg/cm3), body shape (Kb = 4.30), and extracellular resistivity (ρ = 40.5 Ω/cm for men and 30 Ω/cm for women) are assumed as constant in current bioimpedance analysis.
Intracellular water volume VICW (in dm3) is calculated as
where the resistivity of total body water (ρTBW) is given as
and where intracellular resistivity (ρICW = 273.9 Ω/cm for men and 264.9 Ω/cm for women) is assumed as constant in current bioimpedance analysis. Intracellular resistance (Ri) is given as
and where R∞ is resistance at infinite frequency.
Volume overload (VO) is obtained from VECW, VICW and body mass M as described elsewhere 13 :
Declaration of conflicting interests
DS is co-inventor of patents in the field of blood volume and bioimpedance applications in hemodialysis and member of the American Renal Associates research board. MH served as a speaker and/or consultant for Astellas Pharma, AstraZeneca, Eli Lilly, Fresenius Medical Care, Janssen-Cilag, Siemens Healthcare and Vifor and has previously received academic study support from Astellas Pharma,Boehringer Ingelheim, Eli Lilly, Nikkiso and Siemens Healthcare (not related to the present work). SM and SK declare no conflict of interest.
Funding
This work was supported by the Vienna Science and Technology (WWTF) Grant LS20-079 Precision Medicine.