
Abstract
Background:
A pneumatic paediatric ventricular assist device developed at the Foundation of Cardiac Surgery Development, Zabrze, equipped with valves based on J. Moll’s design, with later modifications introduced at the Institute of Turbomachinery, Lodz University of Technology, was tested numerically and experimentally. The main aim of those investigations was to detect stagnation zones within the ventricular assist device and indicate advantages and limitations of both approaches.
Methods:
In the numerical transient test, a motion of the diaphragm and discs was simulated. Two different methods were used to illustrate stagnation zones in the ventricular assist device. The flow pattern inside the chamber was represented by velocity contours and vectors to validate the results using images obtained in the laser particle image velocimetry experiment.
Results:
The experimental light-based method implied problems with proper illumination of regions in the wall vicinity. High-resolution flow data and other important parameters as stagnation regions or flow patterns in regions not accessible for light in the particle image velocimetry method are derived in the numerical solution. However, computations of a single case are much more time-consuming if compared to a single experiment conducted on a well-calibrated stand.
Conclusion:
The resulting main vortexes in the central part of the pump chamber and the velocity magnitudes are correlated in both methods, which are complementary and when used together offer better insight into the flow structure inside the ventricular assist device and enable a deeper analysis of the results.
Keywords
Introduction
Cardiovascular diseases are one of the leading reasons of death in the world.1–3 In Poland, mortality is still higher than in other EU countries and reaches from 363 to 443 in 100,000 males. A ventricular assist device (VAD) is often the only solution for patients with a heart failure to support the cardiac function, as the number of donors is always insufficient in comparison to that of potential recipients. 4 Although significant improvement in the design and durability of VADs was achieved, 5 they are still subjected to continuous modifications. VADs used in clinics can be divided into two main groups: continuous and pulsatile flow pumps. In continuous flow pumps (axial or centrifugal), the blood flow is forced by a rotating impeller, whereas in pulsatile pumps, the flow is forced by displacement of the diaphragm and its direction is controlled by a set of valves. Continuous flow recipients have higher survival and lower complication rates in comparison to pulsatile flow devices in adults. 5 However, due to the fact that they are designed and optimized for high flow rates, in the case of small children (weight ⩽ 20 kg), pulsatile devices are still used predominantly.5–7 Engineers apply state-of-the-art methods to make the flow in the pulsatile VAD more efficient.8–13 As far as the device operation is concerned, the phenomena of coagulation, activation of platelets, haemolysis and cavitation, which may occur in the device, are the most important.14–18 Due to a very complex flow structure in VADs, engineering skills and intuition are not sufficient to design a VAD reducing risk of thrombosis and haemolysis caused by the device itself. Therefore, numerical flow simulations, supported by experimental verification, are of great importance in the prediction of the flow structure.
A paediatric VAD with stroke volume of 45 mL used in this study, referred to as Religa Heart PED 45, 19 was designed at the Foundation of Cardiac Surgery Development (FRK), Zabrze. The device consists of two main chambers: pneumatic and blood, separated by a diaphragm. Changes in the air pressure result in motion of the diaphragm. Suction of air causes elevation of the diaphragm and drives blood to fill the blood chamber. This stage is called pump diastole. Systole of the VAD is caused by charging the pneumatic chamber with air from a driving unit, which in turn results in motion of the diaphragm and ejection of blood. The direction of the blood flow is controlled by two single disc mechanical valves, developed at the Institute of Turbomachinery, Lodz University of Technology, on the basis of Jacek Moll’s concept.20,21
In the present analysis, the dynamics of air flow in the pneumatic chamber was not taken into account. Both experimental and numerical investigations were focused on an analysis of the blood flow. Movement of the diaphragm during the experiments was driven and controlled by means of a POLPDU 402 unit developed and delivered by the Foundation of Cardiac Surgery Development. 22 In the numerical simulations, changes in the VAD volume were taken into account by the mesh deformation induced by a diaphragm motion modelled on the basis of systole and diastole duration measurements. The walls of the pneumatic chamber were transparent; thus, it was possible to observe changes in the diaphragm position and record them with a high-speed camera. In the numerical simulations, changes in the VAD blood volume and the corresponding mesh deformation were induced by the diaphragm motion defined on the basis of those measurements. The Immersed Body method was used to simulate the motion of inlet and outlet valve discs. This method had been used before in the analysis of heart valves23–25 in two dimensions and three dimensions, but not in the VAD.
The objective of the presented research was to develop and validate a numerical method to design pneumatic VADs robustly and efficiently. With this methodology, it is possible to test numerous geometrical variants prior to animal and clinical tests, thus saving time and money. However, the procedure used here is significantly less demanding in computational time than a typical fluid–structure interaction (FSI) numerical simulation of the same problem.
The novelty of the presented study lies in a combination of the Mesh Deformation and Immersed Body methods applied to the pulsatile VAD analysis. The Mesh Deformation method was used to mimic changes in the blood chamber volume which force the flow, whereas the Immersed Body approach allows for modelling of the valves which control the flow direction. In this article, two different numerical simulation approaches to stagnation determination are also compared.
Materials and methods
Particle image velocimetry test
The experimental setup scheme is illustrated in Figure 1. The Religa Heart PED 45 VAD designed and supplied by the FRK was investigated. Its operation was controlled with a POLPDU 402 controller from the FRK, used in clinical practice and dedicated to pneumatic VADs. The VAD operated at the heart rate equal to 60 beats/min, at the stroke volume set to nearly 45 cm3 (mL), yielding the cardiac output of 2.5 dm3/min (L/min). The flow in the system was in a closed loop. Two connected tanks were used to set physiological impedance and compliance of the system. They were connected to the VAD by means of cannulas with attached pressure transducers. Windkessel compliance reservoirs were used in the experimental setup to control compliance of the system. Levels of the liquid in the reservoirs were kept constant during the experiment. Once the average physiological levels of the gauge pressure close to 1 kPa (7.5 mmHg) and 8 kPa (60 mmHg) at the inlet and the outlet from the chamber, respectively, were reached, the VAD was lunched, and after stabilization of its operation, measurements were started. A 40% aqueous glycerin solution of the density 1045 kg/m3 and viscosity 0.0035 Pa s was used as the flow medium to simulate blood parameters.19,26,27 The temperature during the tests was 22°C and was constant to maintain the density and viscosity of the solution. The measurements of the velocity fields inside the VAD were made with particle image velocimetry (PIV) conducted with a LaVision FlowMaster system. 28 The laser light wave length was 532 nm, the camera frequency was set to 800 Hz, and the time between the laser pulse A and B was defined as 400 µs. Hollow glass spheres with a diameter between 3 and 10 µm and a density between 1050 and 1150 kg/m3 were used as seeding particles. The PIV measurements are based on particle tracking in the flow filed, thus the images in the interrogation region were compared in sequence. With the frequency of the system reaching 800 Hz, a single exposition time of 0.00125 s was achieved. In order to catch as many particles as possible, a sequence of 40 consecutive images was used to determine the velocity pattern inside each interrogation region. The readings from each region were summarized to determine the flow pattern in the entire measurement plane for the specific phase of the heart cycle. Some of the particles move not only in the plane of the laser beam but can have a significant transverse component, which influences the measurements. Thus, some images can present false recognition of the particle motion. To avoid that situation, the motion of particles was statistically processed to filter out false velocity vectors. The LaVision software – DaVis 8.2 28 was used in the measurements and data analysis. The raw measurement data were processed with a standard PIV data processing procedure. An initial interrogation region size was 32 × 32 pixels, with the final size of 12 × 12 pixels and a 50% overlap region. The average particle displacement within an interrogation window is determined by a cross-correlation followed by the localization of the correlation peak. A subtract sliding filter with the scale length of 3 pixels was applied in the image pre-processing. Finally, a single smoothing procedure with the region set to 3 × 3 pixels was applied. This procedure averages around each pixel by convolving the image with this 3 × 3 filter to reduce the noise. A single flow pattern plot was based on 40 consecutive images, each lasting 0.05 s.
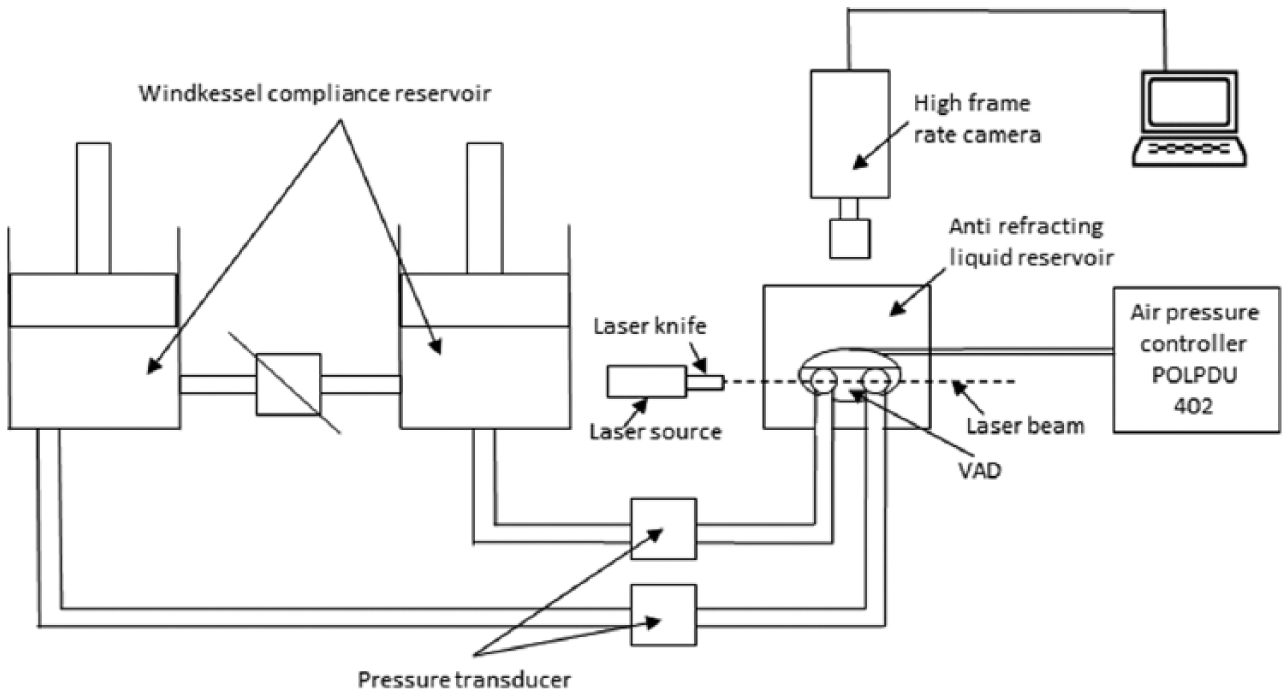
Experimental setup scheme.
Numerical simulation settings
Numerical simulations were conducted to mimic operation of the VAD. The flow in a real device is driven by changes in the blood chamber volume which result from the diaphragm movement forced by pressure changes in the pneumatic chamber. In the simulations, the pneumatic chamber was not considered. Changes in the blood chamber volume were defined by a prescribed motion of the diaphragm. The flow direction of blood inside the blood chamber of the VAD was controlled with valves in the inlet and outlet connectors. Opening and closure of the valves was forced by the fluid motion. Transient simulations were conducted for four full cycles of the VAD operation to eliminate an influence of initial conditions settings onto the simulation results.
Geometrical model
The geometrical model presented in Figure 2 reproduced the VAD used on the experimental setup. The dark blue colour corresponds to the diaphragm, beige to the blood chamber, connectors are grey and the valve discs are red for the inlet and blue for the outlet, respectively. The green arrows indicate the main direction of the blood flow. The motion of the diaphragm entailed changes in the VAD volume. Single-disc artificial heart valves, developed at the Institute of Turbomachinery, Lodz University of Technology, were applied to control the flow direction. The optimal angular positions of the valves were defined in the study by Obidowski and colleagues.21,29,30 Simplified models of the heart valves were used to reduce the simulation time. Small elements which support the valve discs (marked with red circles in the front view of the open inlet valve in Figure 2) were neglected as they exert negligible impact on the flow structure. Inlet and outlet connectors used on the test stand were considered in the simulations.
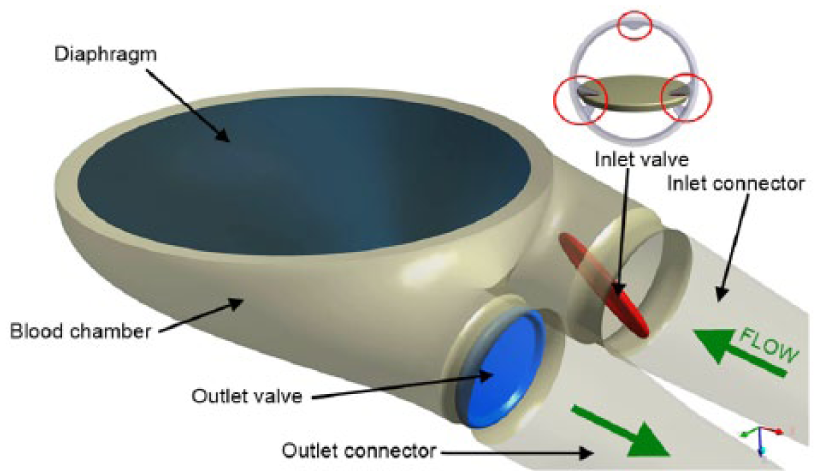
VAD model used in the numerical simulations.
Diaphragm motion modelling
The blood flow is forced by alternations in the blood chamber volume, which follow from a controlled displacement of the diaphragm. In the VAD, a change in the diaphragm position is driven by pressurized air pumped in and out from the VAD pneumatic chamber. In the real device, the diaphragm motion is stochastic and varies from cycle to cycle. In the numerical simulations, the diaphragm motion was simplified. Displacements of mesh nodes on the diaphragm surface were governed by equation (1) derived on the basis of the experimental data analysis performed at the FRK
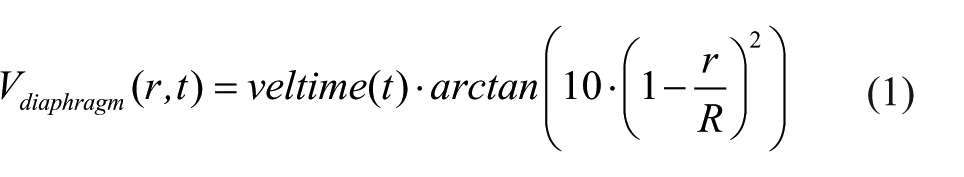
where r is the distance from the node to the diaphragm axis, R is the radius of the diaphragm and veltime(t) is the tabular function defining the motion of the central point of the diaphragm. 29
A displacement of each node depends on the distance from the diaphragm axis. Figure 3 illustrates a cross-section in the centre of the blood chamber with the diaphragm shape and mesh deformation in different stages of the VAD operation. Values of time are presented for the second cycle (here steps for pump rate equal to 100 strokes/minute are illustrated), but the same positions of the diaphragm were repeated for all cycles and pump rates.
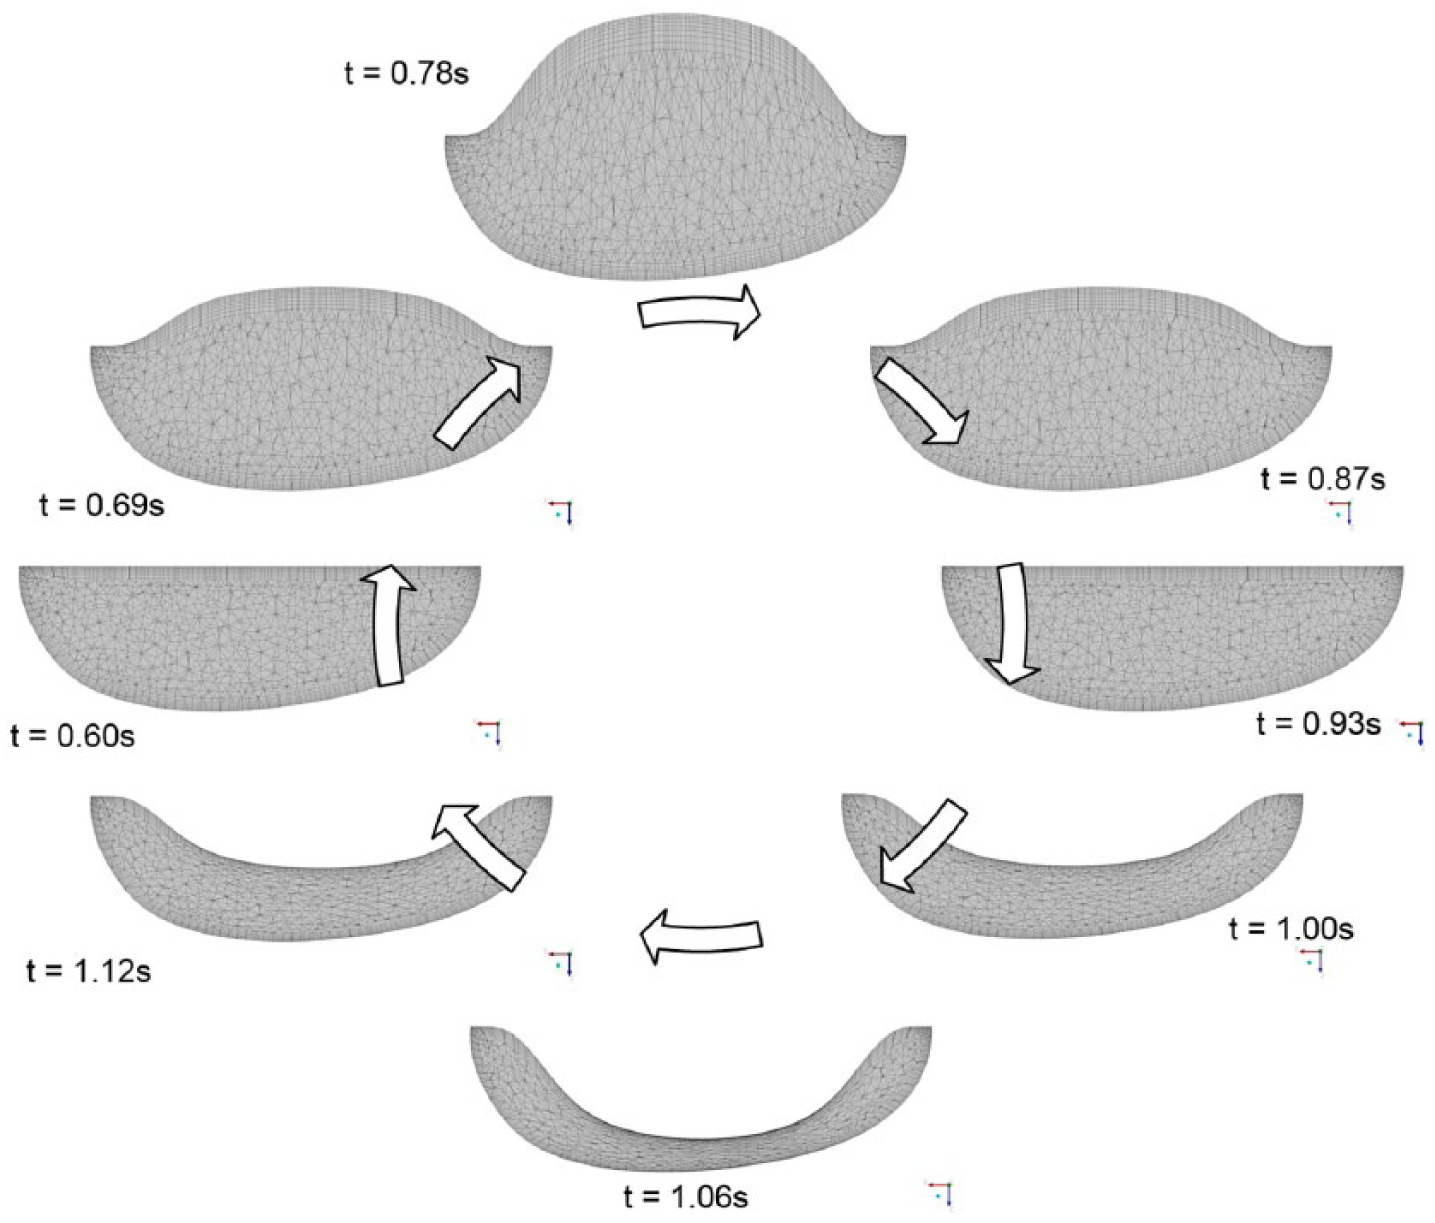
Mesh deformation during the heart cycle.
The geometrical model was discretized with the ANSYS Mesher. Tetrahedral meshes with prismatic elements in the wall vicinity were created for the fluid and two disc domains. The total number of mesh elements reached 3.9 million. As a result of the diaphragm motion, mesh elements were deformed. Prismatic elements near walls were just compressed without a negative influence on their quality and in the case of tetrahedral mesh elements, their quality remained acceptable for the solver despite significant deformation. The mesh independence tests were performed for steady-state conditions. The first of them was conducted with the boundary conditions for the highest flow rates observed in the transient mode, whereas the second one for the lowest velocities when both the valves were still opened. Flows under those two conditions were significantly different. The most refined mesh tested consisted of twice as many elements as the mesh we used in the study. The global parameters of the flow, for example, the maximal velocity, did not differ more than 3% in the cases under comparison. The contour maps of the velocity distribution at the control plane did not reveal visible differences in the flow pattern. Thus, it was assumed that the mesh generated would be independent for transient simulations as well.
Valve disc motion modelling
The problem of an unsteady simulation of the flow through a heart valve is very complex due to changes in valve disc positions. Complex phenomena of the boundary layer development and its separation both at the discs and external walls of the chamber are present. Therefore, a precise flow solution is a very challenging task and requires a high-quality mesh.
Advanced computational fluid dynamics (CFD) codes provide options for transient FSI simulations, where two solvers – the first one for equations governing the flow and the second one for displacement of the structure – are used. A flow simulation provides stresses exerted by the flow on the channel walls, which are used in the structure simulation to determine their deformation. A channel deformation changes in turn the flow pattern, therefore, both solvers need to be coupled in order to exchange data properly and efficiently. All these operations are time consuming and can reveal problems in obtaining a computationally stable solution. In addition, a motion of the valve disc changes drastically the geometry of the flow channel. Thus, the mesh deformation and also remeshing are necessary, but their application to the problem under study can be very expensive indeed if no compromises as regards the solution quality are to be reached.
Taking all these problems into account, the Immersed Body method available in ANSYS CFX 31 is an interesting alternative to the FSI approach. It is based on the overlapping mesh technique, where independent meshes are generated for the background flow field and for the interior of a moving element. The flow is solved on the fluid (background) grid and the presence of a disc (immersed solid) in the flow field is modelled with a body force in the fluid momentum equations. The solver automatically updates the position of the immersed solid at the beginning of each time step. The solver applies the immersed solid sources to the momentum equations in the fluid nodes which lie inside the immersed solid in order to drive the fluid velocity towards the immersed solid velocity. Thus, this approach requires neither remeshing nor grid deformation procedures and is very time efficient. Therefore, it was used in this study to emulate an influence of discs on the flow in the chamber. The idea of the immersed boundary technique is widely adopted in the artificial valve flow analysis. The authors25,32 claim its robustness; however, they point out the problems with a poor prediction of wall shear stress. Moreover, the pressure field representation cannot be precisely determined. On the other hand, the technique offers a very good velocity pattern agreement with the experiments.23,33 In this study, we focused on the velocity determination, thus the method could be applied.
In this technique, the influence of solid surfaces of the immersed body on the fluid flow is not explicitly resolved. Therefore, the viscous force contribution is typically underestimated. 31 To minimize that drawback, the fluid mesh was refined around discs in their extreme positions (fully open and closed) as presented in Figure 4(a). Despite a simplified treatment of the boundary layer, the flow structure around and downstream of the disc was adequately resolved, which is illustrated in Figure 4(b) and (c), where boundary separations around the disc and gap leakage are presented.
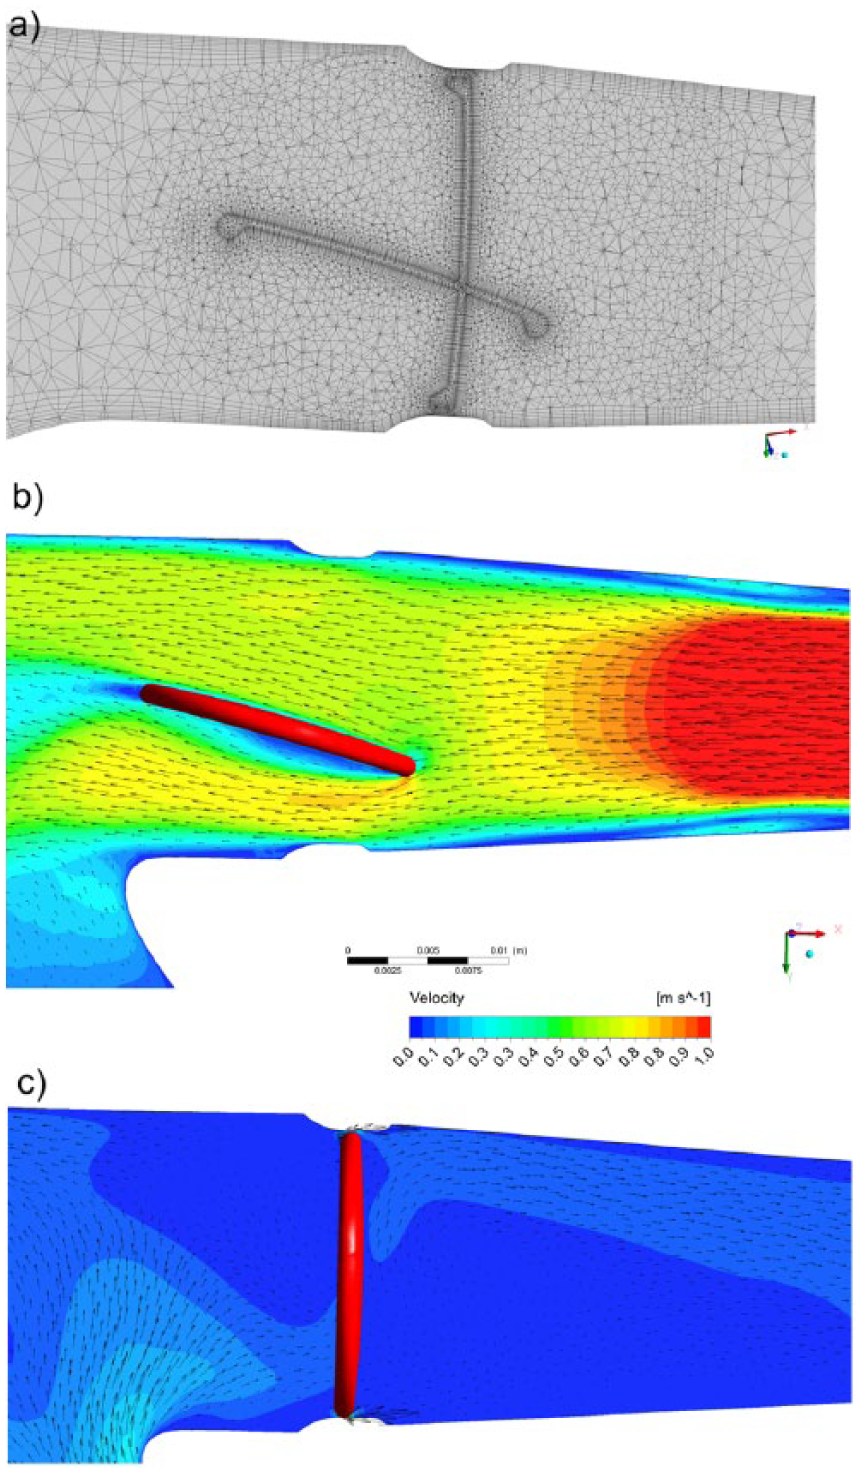
(a) Mesh distribution in extreme positions of discs. (b, c) Flow pattern obtained near the disc valves computed with the Immersed Body technique.
In the presented model, valves open and close automatically under an influence of the forces exerted by the blood flow driven by the diaphragm movement. The motion of the valve discs is activated by the flow along a specific direction. Disc rotation is defined with the experimentally determined angular velocity. The disc can rotate by 75 degrees. It is known from the experiments that the disc needs 0.050 s to open and close.
Model of blood
Human blood is a very complex fluid, however, for the flow problem under study, only its density and viscosity are taken into account. Changes in the blood density depend on the age, sex, diet, and so on of the person, and their values fall within the range of 1030–1070 kg/m3. For the needs of these simulations, the constant density of blood equal to 1045 kg/m3 was assumed.
Blood is a non-Newtonian fluid with a state memory. The dynamic viscosity coefficient depends on flow parameters and their changes (flow structure). In the literature, numerous models describing a relation between the blood viscosity coefficient and blood flow parameters can be found. To describe the flow in the vicinity of the aortic ostium, the Newtonian fluid model is appropriate. On the other hand, the blood flow in small vessels needs a more complex blood model.34–37 For the needs of this study, a modified power law model is employed. This model is expressed by system of equations (2)
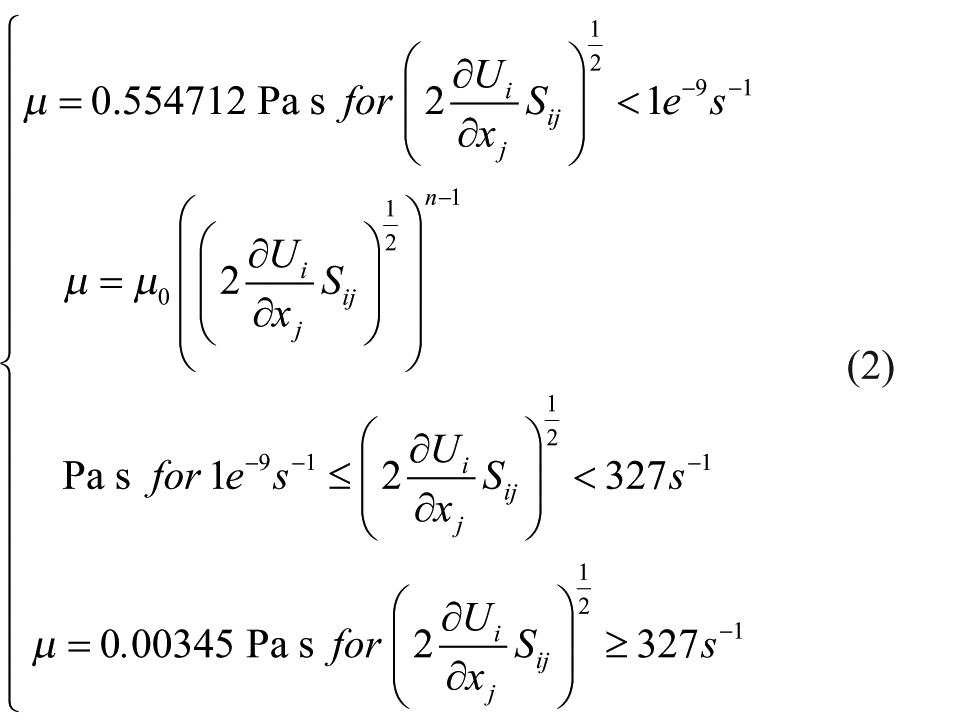
where µ0 is 0.0035 Pa s, n = 0.6 and
Solution strategy and its monitoring
The transient numerical simulation was performed with the ANSYS CFX v.17.1 code. The unsteady Reynolds-averaged Navier–Stokes (URANS) set of equations with an additional source term of the Immersed Body in the momentum equation was solved. The shear stress transport (SST) turbulence model, which is widely used and proved its quality in many different applications, especially for low Reynolds number flows as in this case, was applied.17,38–40 Due to very limited temperature changes, the flow was considered to be isothermal.
As far as the boundary conditions are concerned, the openings were imposed with the value of gauge pressure set to 1 kPa (7.5 mmHg) at the inlet and 8 kPa (60 mmHg) at the outlet of the computational domain. The opening is a combined boundary condition which allows the flow to enter or leave the domain depending on the values of boundary condition parameters and the flow structure. In the case under analysis, the flow was driven by the motion of the diaphragm. A non-slip condition was applied for all smooth walls.
The transient solution was initiated when the diaphragm was located in its middle position between diastole and systole and it was planar. The upward motion of the diaphragm at the first stage of the heart cycle causes an increase in the blood volume in the chamber. At this stage, the inlet valve is fully open, whereas the outlet valve is closed. This situation continues up to the moment when the diaphragm reaches its maximal upper position, which occurs for the maximal filling of the VAD with blood. Next, the diaphragm starts to move downwards and pushes the blood out of the chamber. At this stage, the valve in the outlet connector opens and the inlet valve closes. The inlet valve remains closed, whereas the outlet valve is open until the diaphragm reaches its lowest position, which occurs for the minimal blood volume within the VAD. When the VAD starts filling, the outlet valve closes and the inlet valve opens.
The simulation was conducted for four cycles corresponding to the pump rate of 60 strokes/min, each lasting 1 s, with a time step t = 0.001 s. Internal convergence loops (from 1 to 5) were solved to reach the predefined level of convergence (RMS residuals equal to 1e–4). The residuals did not exceed the assigned convergence criteria level, except for the first cycle, in which an influence of initial conditions played a significant role.
Numerical model validation
The numerical simulation method was validated against the velocity flow field measurements obtained with the PIV technique which is a widely used method.12,41 The flow patterns were compared in a single plane distanced 17 mm from the reference plane as shown in Figure 5. The velocity magnitude was scaled in the same range for both methods. Two different operating conditions, namely for the pump rate of 60 and 80 strokes/min, at different stages of operation, were compared to validate the numerical method. The time interval of 0.1 s between mid and late systole presented in Figure 5 was defined. Since the diaphragm prevents the laser light to illuminate a part of the particles, the stages when the diaphragm is mostly within the pneumatic chamber of the VAD were selected for comparison. The mid diastole stage in Figure 5 corresponds to the moment when the diaphragm is moving towards the pneumatic chamber and passes its middle position. The late diastole stage corresponds to the peak diaphragm position. In the early systole, the diaphragm starts to push out the blood from the blood chamber, thus the disc valve positions are opposite to the diastole. For each stage, the flow inside the chamber forms a large vortex structure with the core positioned near the middle of the chamber, which is well visible during the simulations and the experiment. A good agreement was achieved when the velocity magnitude for each stage was taken into account. One can observe very similar jets passing through the chamber from the inlet towards the outlet connector. Significant differences between data are observed in the region of valve rings and in the top part of the chamber. These differences can be explained by drawbacks of the PIV measurement technique. Despite mirroring of the laser beam, there is no possibility to illuminate and observe the whole VAD. In addition, a light reflection from the curvilinear wall of the chamber could not be eliminated. Therefore, for the region marked in black and white in the PIV results, the data are not available. Some discrepancies are also observed in the location of the vortex centre which can be influenced by problems with the PIV measurement in the proximity of the diaphragm centre for the mid diastole and the early systole stages. Except for the mentioned regions, a good agreement between the experiment and the numerical simulation was reached and demonstrated. PIV measurements were also carried out in two other planes at the location of 15 and 19 mm, similarly defined as plane 17 illustrated in Figure 5. These data are not presented here due to the fact that similar flow patterns were revealed and the same agreement with simulations was reached.
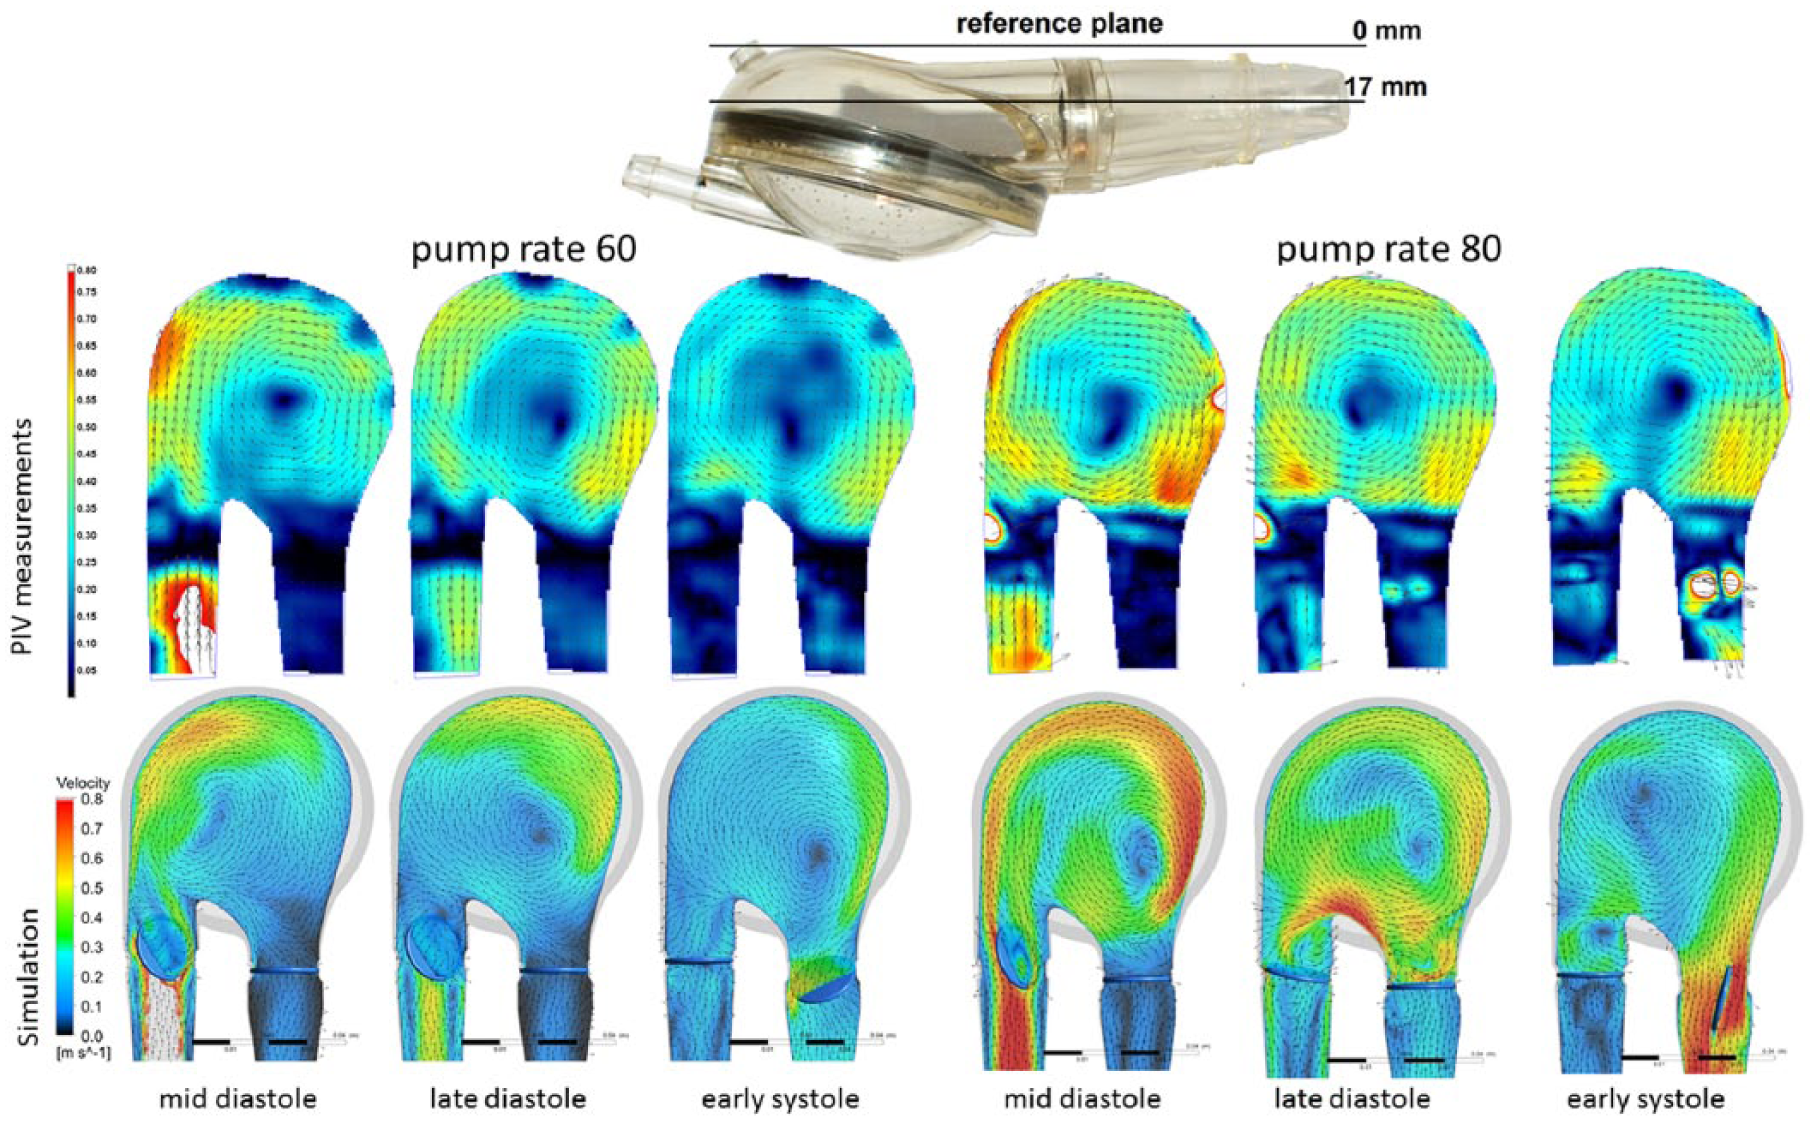
Velocity contour plots and vectors measured with the PIV and obtained from the simulations for different pump rates.
Stagnation determination methods
Stagnation regions can promote the deposition of damaged blood elements, leading to thrombus formation on the prosthesis. 33 Two different methods to determine stagnation were used and compared. The Volume of Stagnation Zone (VSZ) is a new concept based on the assumption that the blood activated by contact with an artificial material may coagulate once exposed to long interaction with the wall. This occurs in low velocity regions. Pivkin et al. 42 simulated thrombus formation with respect to the flow velocity in the range of 100 up to 800 µm/s in the cylindrical channel. Under these conditions, the thrombi were captured; however, it was noticed that the activation delay time caused the activated platelets to escape capture into the thrombus at higher flow rates. In our method, the regions of velocity lower than 0.01 m/s, excluding those in the inner region of the boundary layer, are considered as prone to generate blood clots. The value was selected to cover the velocity range by an order of magnitude higher than those tested by Pivkin et al. 42 not to miss any regions of possible clot formation. This method can be used to detect stagnation in the PIV experiment and in the numerical simulation.
The second method mentioned, referred to as washout, is also based on the assumption that coagulation can appear in the regions where blood residues for the longest time. The blood exchange in the chamber during the VAD operation is observed. This method, referred to as the Washout method, was presented by Sonntag et al. 17 and used in the numerical investigations of a pulsatile artificial heart. The simulations are based on observation of two phases of blood, called old blood and fresh blood, both having the same rheological properties. At the beginning of an analysis, the old blood fills the whole chamber. Once the analysis starts, the fresh blood starts to flow into the chamber and the old blood is ejected. A part of the old blood volume is not evacuated in a single heart cycle. As two phases are used in the simulation, one can observe a change in the old to fresh blood ratio versus time and can illustrate the desired phase. In the Washout method, the old blood that remains in the chamber after a specific number of cycles of its operation can be observed.
Apart from the stagnation detection based on low velocity methods, there are models which enable prediction of the thrombus formation, developed by Medvitz et al.41,43 and the thrombus susceptibility potential based on wall shear rates over the entire cardiac cycle, described by Tooper et al. 44
Results and discussion
A velocity pattern inside the blood chamber is determined with PIV measurements. Once the obtained data are filtered out to a specific range of low velocity, information on stagnation prone regions can be obtained. Figure 6 shows a full range of velocity measurements at the top and filtered out low velocity regions in the bottom for the same cases. The measurements are planar. The laser plane marked as 17 mm in Figure 5, during diastole, was used to illustrate the flow and the determination of stagnation in the chamber. If an analysis of the full three-dimensional velocity field is to be conducted, the measurements have to be repeated with a desired distance in parallel planes. In the case of the chamber model used in this study, it is not possible to attain a complete flow field in the whole domain due to the optical technique limitations mentioned earlier. The stagnation area with respect to the total measurement plane (red contour line) was 1.13% during diastole and 0.46% during systole. 19
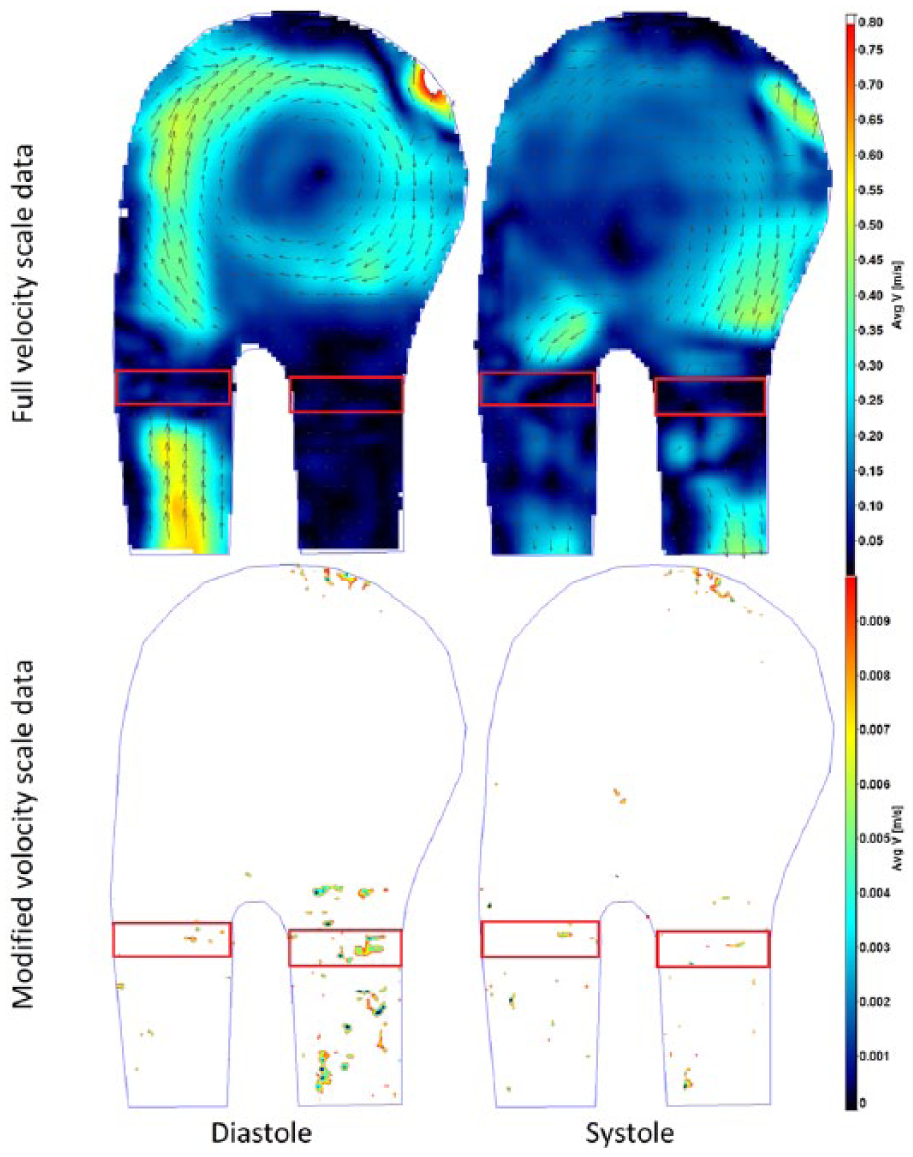
Velocity magnitude contour plots in the full scale measured and the data limited to stagnation regions.
In Figure 7, the results obtained with the stagnation method are compared to the Washout study for the same VAD chamber operating under the same conditions during the third and fourth cycle. The stagnation-prone regions are marked with dark red. In the case of the VSZ method, the same pattern of the stagnation field is repeated for each cycle, beginning with the third one. After the third cycle, the influence of initial simulation conditions is negligible. In the Washout method, it is necessary to realize that the old blood is washed from the VAD, thus, once the simulations are repeated through more than 6 heart cycles, the residual old blood will be totally washed out. Knowing the differences in stagnation determination in both numerical methods, a direct comparison of the results is difficult if not impossible, thus, a qualitative determination of similarities and differences between the two methods was only conducted. A very similar distribution of stagnation in the distal ring of the diaphragm and near the valve rings can be seen in the flow patterns in Figure 7. In all the cases shown, the stagnation forms a thin hook in the connection of the diaphragm and the chamber. This is caused by a limited flow velocity in the corner formed due to technological restrictions of the VAD structure. The stagnation observed in the valve regions is due to separations of the flow generated by valve rings and strongly depends on the flow direction. Significant regions of low velocity in the connectors detected with the VSZ method result from a limited flow when valves are closed. These regions are well washed during the inflow or outflow of blood to and from the chamber and thus shall not be taken into account as stagnation-risk regions. This can be filtered out once the VSZ is integrated in the whole domain for a single heart cycle. The final stagnation is quantified by the time-averaged VSZ, whose distribution is presented in Figure 8. In the case under study, the stagnation occupied 0.098% of the computational domain volume with the diaphragm placed in its neutral position. The results show the flow induced regions of the VAD prone to stagnations and clot generation. The highest risk zones in the case of the tested blood chamber were detected in similar regions, as illustrated in Figures 6 and 7. Most of the zones were revealed in the region of valves and in the diaphragm attachment to the blood chamber, with all the experimental and numerical methods.
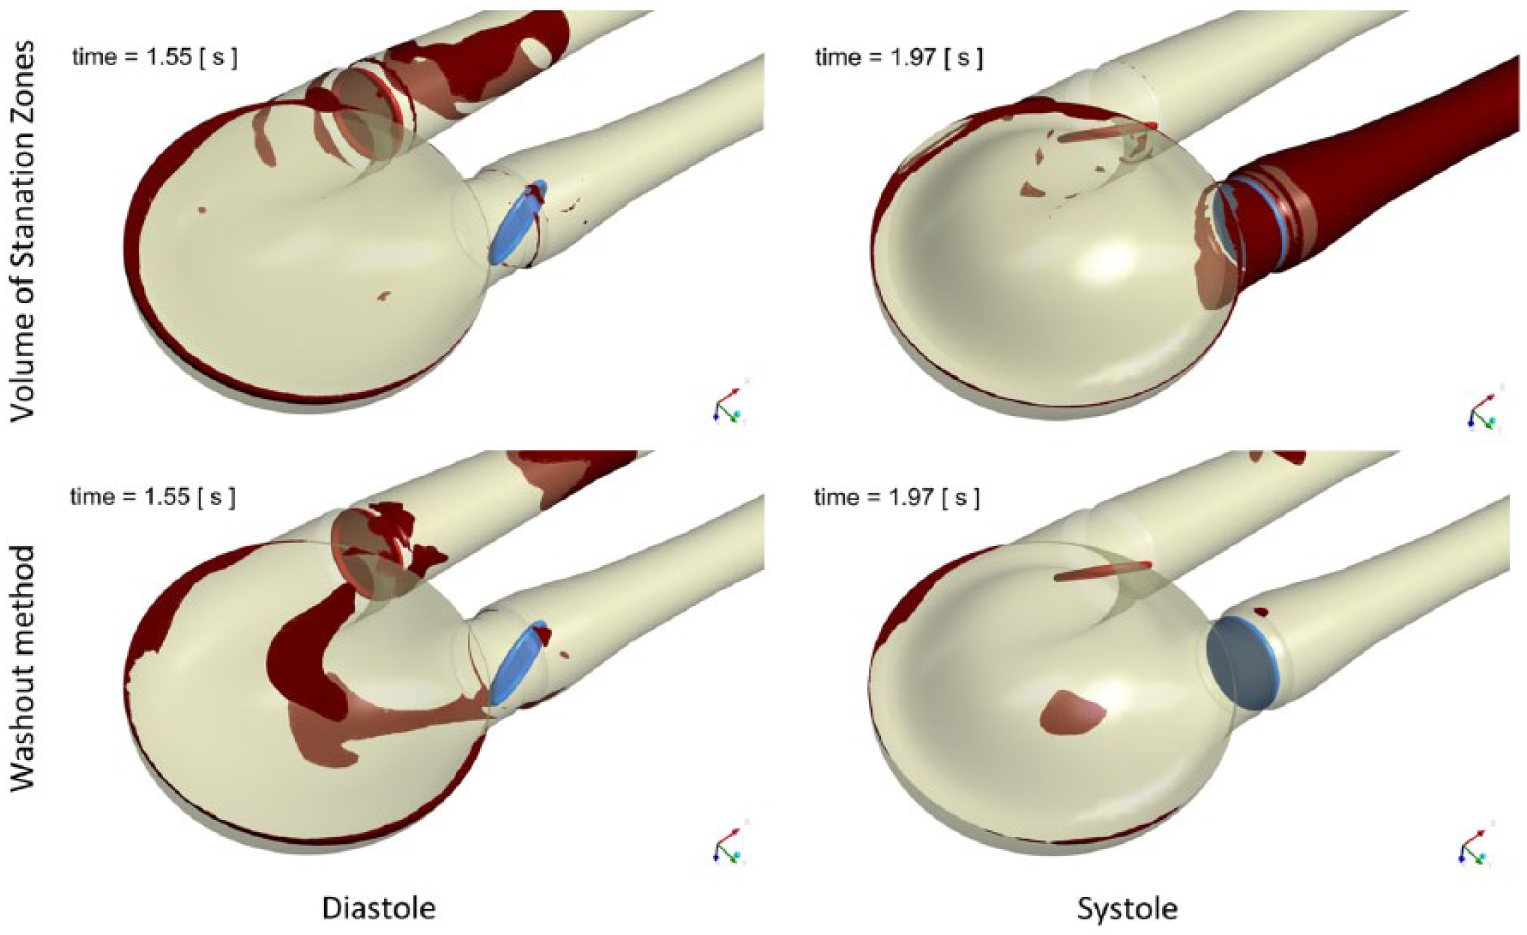
Results of stagnation determination with the Volume of Stagnation Zones method compared to the Washout method.
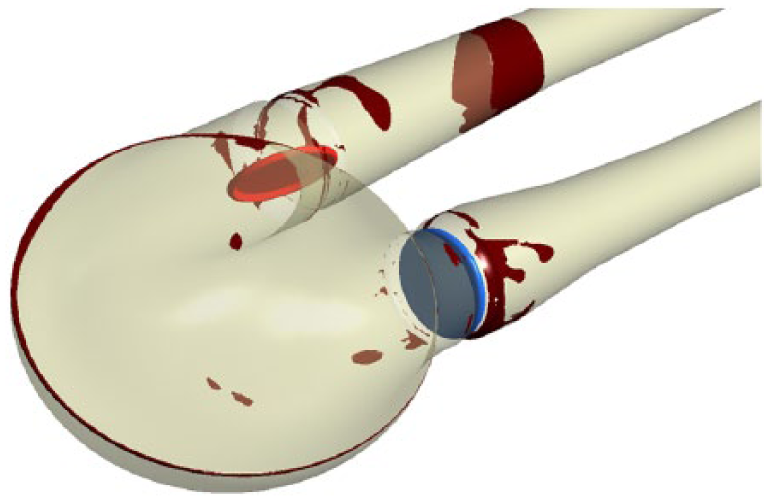
Time-averaged VSZ.
Conclusion
The presented numerical model takes advantage of the Mesh Deformation and Immersed Body methods to simulate efficiently flow conditions in the pulsatile VAD. Changes in the blood chamber volume, which force the flow and motion of the disc in the valves to control the flow direction, can be reproduced. Model validation against the PIV measurement results proved the adequate representation of the main flow features. A summary of the comparison of the PIV method and the numerical simulations in the VAD analysis is presented in Table 1.
Comparison of the experimental and numerical methods in the VAD analysis.
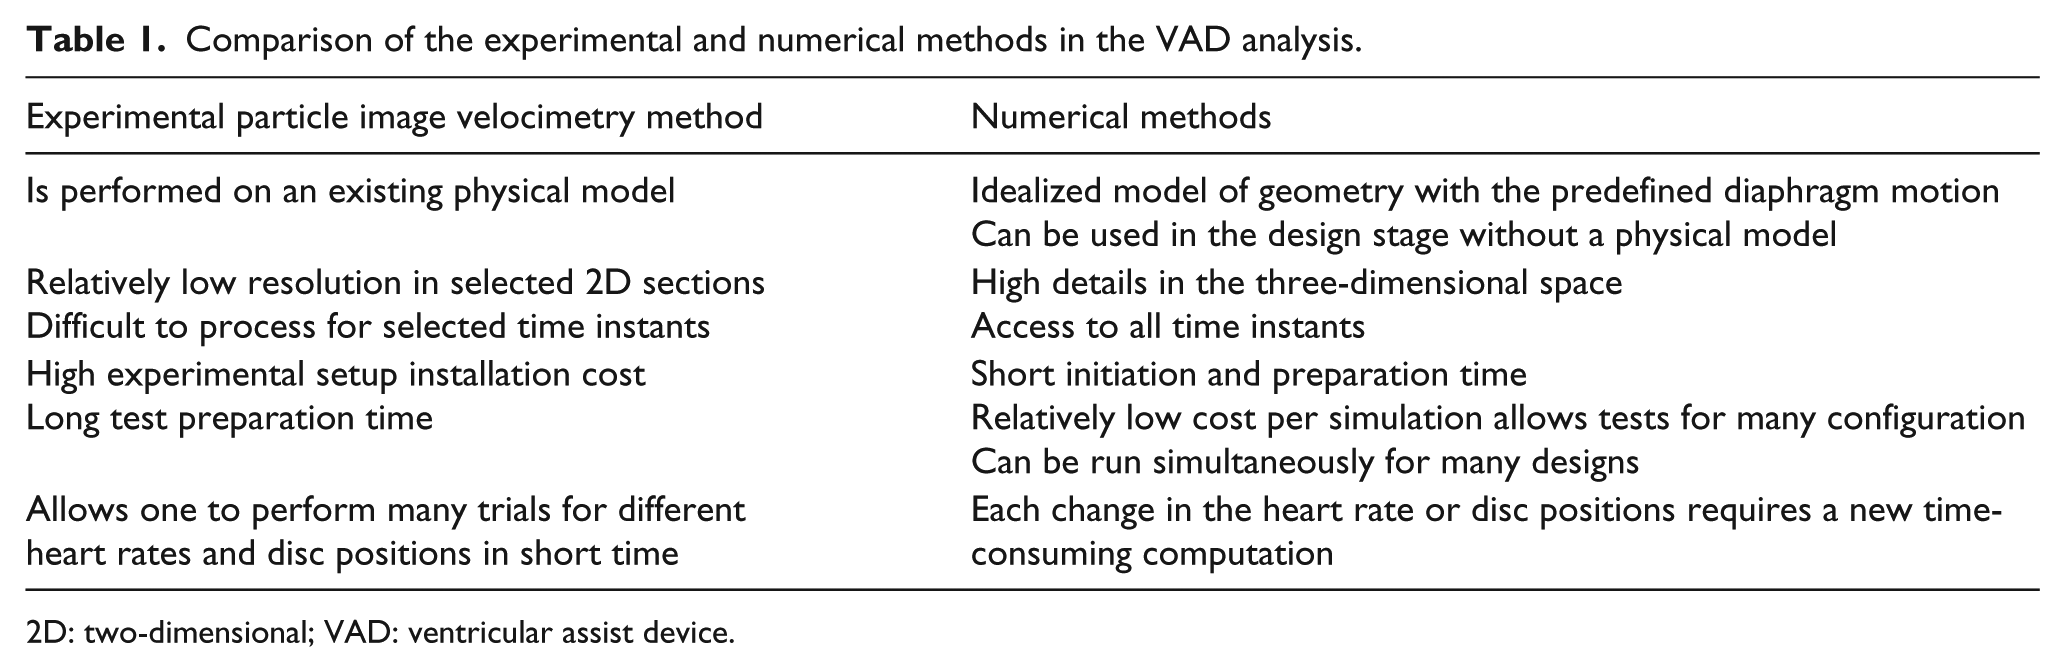
2D: two-dimensional; VAD: ventricular assist device.
As far as the problem of the risk of blood stagnation and clot generation in VADs is concerned, the numerical methods give a possibility to analyse stagnation in the whole volume of the blood chamber. Because of its numerous limitations, PIV provides data for specific measurement regions only. The time and spatial resolution of the numerical methods is much higher than in the PIV experiment. However, it has to be borne in mind that simulations of such complex flows should be validated, especially when advanced modelling techniques such as a moving diaphragm and an immersed solid disc are used. In the presented case, a qualitative agreement between the experimental and numerical flow patterns and the regions of stagnation was reached. Two numerical approaches presented in the article (i.e. Volume of Stagnation Zones and Washout) indicated similar regions of stagnation risk. The main identified advantages and drawbacks of all the methods used to determine stagnation regions in VADs are listed in Table 2.
Summary of the methods used to determine stagnation regions in VADs.
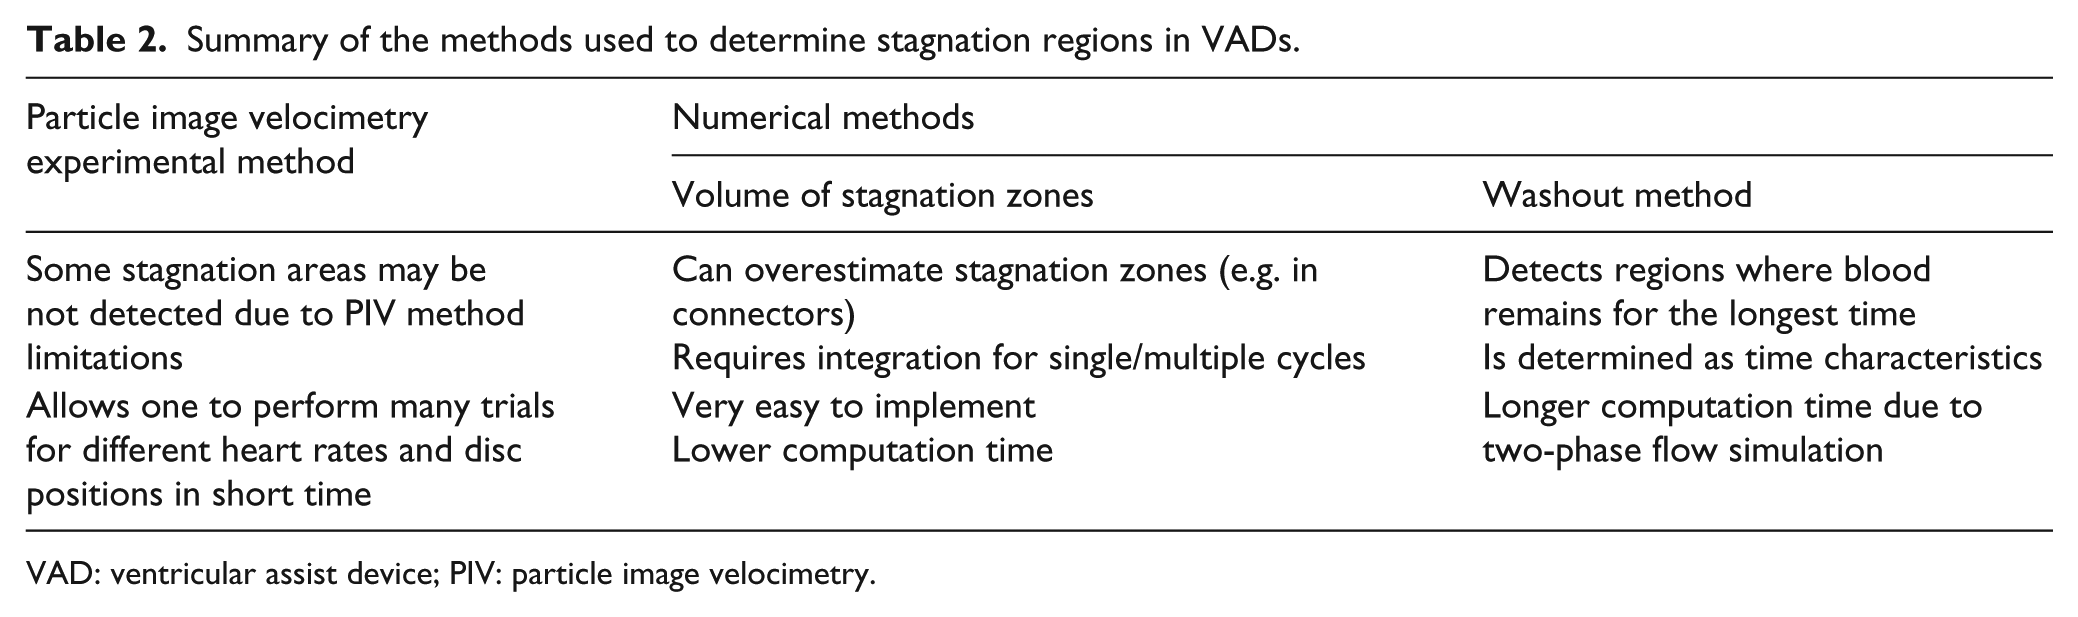
VAD: ventricular assist device; PIV: particle image velocimetry.
Footnotes
Declaration of conflicting interests
The author(s) declared no potential conflicts of interest with respect to the research, authorship and/or publication of this article.
Funding
The author(s) disclosed receipt of the following financial support for the research, authorship and/or publication of this article: This work has been supported by the National Centre for Research and Development in collaboration with the Foundation of Cardiac Surgery Development, Zabrze, Poland (Project No. PBS1/A7/1/2012).