
Abstract
Fluctuations in economic policy often create ripple effects that can significantly impact commodity prices, including those of essential food items, with potential consequences for food security. The 5 emerging nations outlined as BRICS (Brazil, Russia, India, China, and South Africa) have most recently extended by including 4 new members (Egypt, Ethiopia, Iran, and the UAE) on January 1, 2024. Additionally, Argentina and Saudi Arabia are anticipated to join the group soon. This enlargement will alter the geopolitical scenario, potentially fostering fresh collaboration and competition dynamics. This expansion will reshape the geopolitical landscape, possibly leading to new cooperation and competition dynamics. The core objective of the present work is to measure how economic policy uncertainty asymmetrically influences food prices in the expanded BRICS countries. Previous investigations have primarily relied on panel data methods, often overlooking heterogeneities in the policy uncertainty-food prices nexus across different countries. Conversely, this research applies the Quantile-on-Quantile method, which permits a more exact examination, providing a thorough worldwide overview and specific insights tailored to each country. The results indicate a significant increase in food prices due to economic policy uncertainty throughout different quantile ranges in the chosen economies. These outcomes accentuate the essentiality for policymakers to execute all-inclusive appraisals and effectively manage approaches connected to economic policy uncertainty and food inflation.
Plain language title
Exploring the Impact of Economic Policy Uncertainty on Food Prices in Expanded BRICS Countries.
Plain language summary
This research delves into how government economic policy changes can increase everyday goods’ prices, especially essential foods. The 5 emerging nations termed BRICS (Brazil, Russia, India, China, and South Africa) have just extended by including 4 new members (Egypt, Ethiopia, Iran, and the UAE) on January 1, 2024. Additionally, Argentina and Saudi Arabia are anticipated to join the group soon. This enlargement will alter the geopolitical scenario, potentially fostering fresh collaboration and competition dynamics. This potential expansion could reshape how these nations work together and compete. The researchers are interested in figuring out how uncertainties in economic policies affect food prices in this expanded BRICS group. Unlike previous studies that looked at general trends, this investigation uses a specific method called “Quantile-on-Quantile” for a more precise understanding. This method allows for a closer look at how different countries are affected, providing a global overview and specific insights for each nation. The findings show that when economic policies become uncertain, it tends to lead to a notable increase in food prices across various situations in these countries. It suggests that policymakers must carefully evaluate and manage strategies related to economic policy uncertainty and its influence on food costs. Essentially, the research emphasizes the importance of policymakers being aware of how their decisions can affect the prices of essential goods, like the food we find on our grocery store shelves.
Introduction
Economic policy uncertainty (EPU) arises from government policy changes, affecting economic decisions by creating an unpredictable environment. 1 EPU impacts food prices (FP) by discouraging agricultural investment, disrupting supply chains, and reducing production. Changes in trade policies and currency volatility further inflate FP by increasing trade costs and import prices.2,3 These factors illustrate how EPU influences FP through investment, trade disruptions, and market stability. High EPU levels discourage foreign investment and disrupt domestic production, affecting international trade. 1 Uncertainty in tariffs and trade agreements disrupts supply chains, limiting access to certain food products and impacting FP stability.4,5
EPU significantly impacts exchange rates and FP in BRICS + 6 countries. Currency fluctuations due to policy decisions or external factors can increase the costs of imported food items, raising living expenses.6,7 EPU affects FP by influencing consumer confidence and agricultural investment, potentially reducing food supply and increasing prices. 8 It also disrupts international trade, causing supply chain disruptions and higher prices for certain food products. Governments may stabilize prices by supporting domestic production and enhancing trade agreements to ensure food security.9,10
Analyzing the EPU-FP relationship is complex due to diverse patterns across countries. This study focuses on the asymmetric correlation within expanded BRICS countries. Previous research using panel data techniques has shown limited applicability across diverse economies.8,1,6,7,4 This investigation employs the Quantile-on-Quantile (QQ) technique for a nuanced assessment crafted to address these challenges based on every nation's unique characteristics. This methodology enhances our understanding of the EPU-FP nexus and time-series relationships within each nation, 11 overcoming limitations of traditional econometric approaches like ordinary least squares and quantile regression (QR). 12
This study uses the QQ approach to explore effects across various quantiles, considering both positive and inverse directions. The relationship between EPU and FP may yield diverse outcomes depending on economic conditions. Higher EPU levels are expected to influence FP differently than lower levels, resulting in significant variations. We anticipate asymmetries between EPU and FP distributions, consistent with our hypothesis. 13 By studying diverse economies and changes in variable relationships, our methodology offers valuable insights for policymakers.
The proposal to expand BRICS to include new members is a significant development in global economic dynamics, potentially impacting food security. These economies play a crucial role in global commodity markets, especially essential food items, justifying their inclusion in the study. Their diverse economic structures, policy frameworks, and exposure to EPU make them ideal for investigating how EPU influences FP. 14 Recent statistics highlight the growing impact of EPU on global FP. The World Bank reported a 30% surge in FP last year, driven by policy disruptions.15,16,17 The Food and Agriculture Organization noted that the Food Price Index (FPI) reached its highest level in a decade, reflecting increased volatility. 18 In expanded BRICS countries, these fluctuations are significant due to diverse economic structures and policies. For instance, Brazil and South Africa saw sharp FP spikes after policy changes, emphasizing the need to understand and manage the EPU-FP nexus. 19 Economic resilience depends on stable trade networks, vulnerable to disruptions from internal and external factors, 20 highlighting the complex interconnectivity of economic systems. Using the QQ approach allows for a detailed examination of each economy's patterns and relationships, paving the way for future research on EPU-FP dynamics. 21
Literature Review
International grain prices are highly volatile and influenced by various macroeconomic factors. Changes in demand and supply due to regional production levels significantly impact global grain prices. 22 Energy prices, including shifts in energy commodity prices, also affect agricultural commodity prices.23,24 Manufacturing costs related to oil prices and biofuel expansion further influence grain prices.25,26 Financial factors such as dollar depreciation and financial speculation impact agricultural grain prices, and a weaker dollar often lead to higher prices.27,28 Additionally, strong co-movements in commodity prices across markets create price linkages, such as wheat and rice in the grain market and corn and soybeans in the feed market.29,30
This study integrates the Efficient Market Hypothesis (EMH) and Behavioral Economics to analyze EPU's impact on grain prices. The EMH suggests that prices imitate all available information, 31 while Behavioral Economics emphasizes psychological factors in market dynamics. 32 This framework investigates whether EPU prompts rational price adjustments, as per the EMH, or market anomalies like overreactions driven by investor psychology, as per Behavioral Economics. 33 Our model combines rational responses to EPU with behavioral biases, offering a comprehensive perspective on its effects on grain prices. This approach enriches existing literature by providing a balanced view of how EPU interacts with FP, distinguishing our model from those focusing solely on rational or behavioral explanations.
EPU may introduce fluctuations in global grain prices, potentially reducing rewards between grain consumers and producers. Initially, EPU influences several contestants’ decision-making processes and behaviors in the global grain marketplace by shaping individual behavioral traits and selections. 13 By increasing the uncertainty surrounding entire grain demand and supply, EPU influences the conduct of both grain consumers and producers, consequently elevating the instability of international grain prices. 3 Furthermore, EPU is expected to influence the future expectations of market speculators, thereby affecting international grain demand and speculation. 34 When currency values become unpredictable, commodities like grain are considered secure tangible assets. 35 Investing in commodities not only serves as a hedge against inflation but can also enhance the returns of financial derivatives portfolios and investors’ assets, reducing overall portfolio risk. 36
However, some investigations have empirically explored the influence of uncertainties (i.e., EPU) on FP. For example, Sun et al 37 analyzed the influence of global EPU on food security and ocean transportation. It employed vector autoregression and wavelet frameworks, and the results uncovered dynamic links among FP, global EPU, and maritime transport, with ocean freight rates’ volatility surpassing that of FP. Sekhar and Thapa 38 examined FP dynamics during COVID-19. The results revealed varied impacts on prices across commodities and regions, including ongoing local shortages. Moreover, the findings revealed a significant increase in pulses and oils/fats due to supply disruptions.
Elbushra 39 discussed Saudi Arabia's food security challenges, emphasizing its dependence on imports due to local production limitations and analyzing them via CPI and food commodity price changes. The results revealed a continuous increase in households’ access to nutritious food. Ekeocha et al. 40 studied the bond of EPU with African economic activities from 2010 to 2019. The results found significant effects from global and specific country EPUs but minimal impacts from domestic EPUs and certain country EPUs, with governance institutions playing a minor role. Ogbuabor et al. 41 analyzed the bond of EPU with crude oil price fluctuations on market reactions. It used NARDL models from November 2004 to June 2020. The results showed rising uncertainty linked to higher retail energy prices, notably in the UK, Japan, and Europe.
Wen et al. 13 delved into the effect of EPU on FP in China between 1998M1 and 2020M5, employing the ARDL framework. The research uncovered that heightened EPU increased FP, spanning short and long-run periods. Additionally, it was observed that adverse EPU shocks positively and significantly affected FP, while positive shocks had a negative but inconsequential effect. Yang et al. 42 used a dynamic model (TVP-VAR-SV) to analyze how geopolitical risks (GPR) and TPU influenced commodity TPU shocks positively affected GPR, particularly before 2017, while GPR shocks caused short-term inverse effects on TPU but had median- to long-run positive impacts, excepting throughout 2002 and 2006. Geopolitical acts and threats had alternating short-run positive and inverse impacts on the commodity market, with varying durations of influence. Cao et al. 43 investigated how policy uncertainties influenced spillovers between soybeans/corn and crude oil across various volatility scenarios. It was found that these spillovers were asymmetrical, varying with time, and sensitive to crises, especially during major global events. However, over the long run, fiscal policy uncertainty and EPU had positive impacts, but monetary policy uncertainty had an inverse influence. Sodji 44 investigated the nonlinear influence of pandemic uncertainty and TPU on FP in Togo utilizing the NARDL tool along with causality tests from January 2000 to May 2021. The findings revealed that various forms of uncertainty had asymmetrically influenced FP stability in the long and short run.
Research on EPU and FP has mainly examined their general impact. However, further investigation into specific quantiles of both variables is needed to understand potential nonlinear effects. While some studies report a symmetric relationship between EPU and FP, ignoring these nonlinear effects may lead to misunderstandings. Panel data analysis to explore how EPU affects FP across countries could complicate clarity. Therefore, using the QQ approach allows for a tailored examination per country, enhancing understanding of EPU-FP dynamics.
Data
The study's primary goal is to explore how EPU affects FP in expanded BRICS nations (Brazil, Russia, India, China, South Africa, Egypt, Ethiopia, Iran, Argentina, Saudi Arabia, and the UAE). We use EPU as our independent variable, defined by Baker et al., 45 to understand how fluctuations in economic policies and regulations affect FP. This comprehensive approach allows us to evaluate the connection between economic policy changes and FP across diverse economies.46,14 The FPI is selected as a proxy for FP, the dependent variable. The FPI is widely recognized by global institutions like the World Bank and the United Nations for tracking global FP trends across various food categories. 38 Its ability to capture domestic and international FP variations reflects the complexities of the global food market. Regular updates and the capability to capture short- and long-term price fluctuations make the FPI a reliable tool for assessing the relationship between EPU and FP in expanded BRICS economies. 13
The EPU data is sourced from the EPU index, endorsed by Baker et al. 45 and can be accessed at https://www.policyuncertainty.com/. Data of FPI is acquired from the Food and Agricultural Organization (FAO) database, available at https://www.fao.org/faostat/en/. The annual data for both EPU and FP spans 2001 to 2022. To improve clarity and aid in this analysis, the Appendix Table gives a detailed list of abbreviations and acronyms utilized during the ongoing investigation.
Econometric Method
The central goal of the ongoing part is to appraise the tools adopted to calculate the affiliation between EPU and FP. To reach the objective, a quantile-based cointegration test is applied to explore the long run relationship between variables. As a critical constituent of this econometric assessment, the QQ instrument is integrated to broadly realize the EPU-FP association.
Quantile Cointegration Test
In this article, quantile cointegration (QC) test by Xiao
47
is applied to outdo the limitations of conventional cointegration tests. Unlike traditional methods, QC considers varying degrees of cointegration through several quantiles of the data distribution. This technique allows us to understand long-run relationships among variables while reducing estimation biases associated with conditional data distribution.
QQ Technique
Because of the nonlinear feature of the dataset, we adopt the QQ technique as a replacement for typical QR estimates. The QQ method, introduced by Sim and Zhou,
48
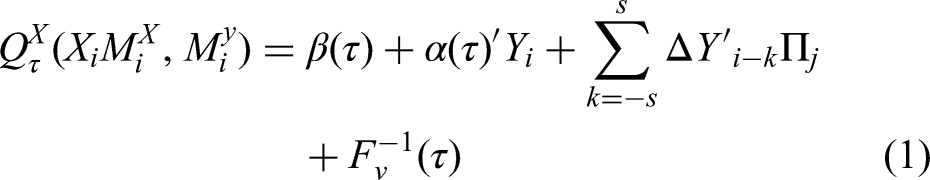
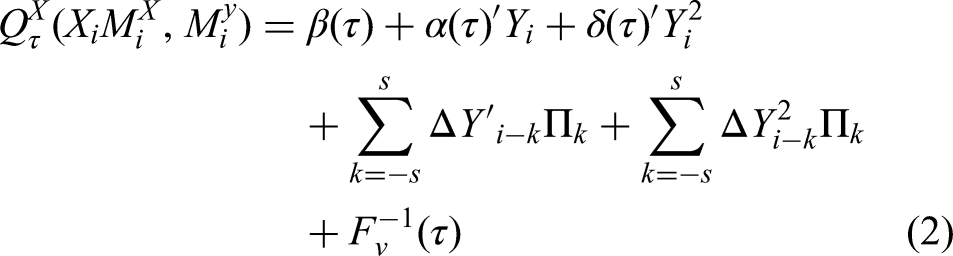
displays an ample progressive option, surpassing the shortcomings of QR that initially focus on average effects. QQ enables the exploration of bonds between quantiles of independent and dependent variables, offering insights into the nuances of the EPU-FP relationship. The fundamental structure of our study's non-parametric QQ model, pursued by Bakas & Triantafyllou
3
and Cao et al.,
43
can be written as follows:


Robustness of the QQ Tool
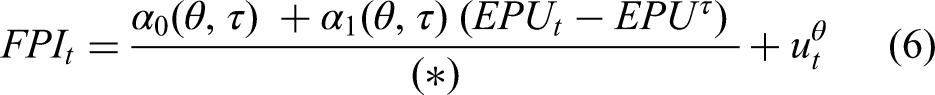
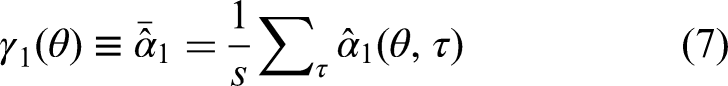
The QQ technique distinguishes itself from the QR method by providing highly accurate estimations for the EPU (independent variable) and the FPI (dependent variable). The QR tool mostly scrutinizes the θth quantile of EPU, while the QQ regression analyzes the impact of the θth EPU quantile on the τth FPI quantile. The QR parameters are computed by taking the average of the parameters of QQ connected with τ. In the QR methodology, the slope coefficients, embodied as
Results and Discussion
The ongoing section unveils the precursory and key outcomes of the estimation along with a comprehensive discussion.
Introductory Results
Table 1 depicts descriptive statistics that comprehensively understand the attributes of both EPU and FPI.
Descriptive Statistics of EPU and FPI.
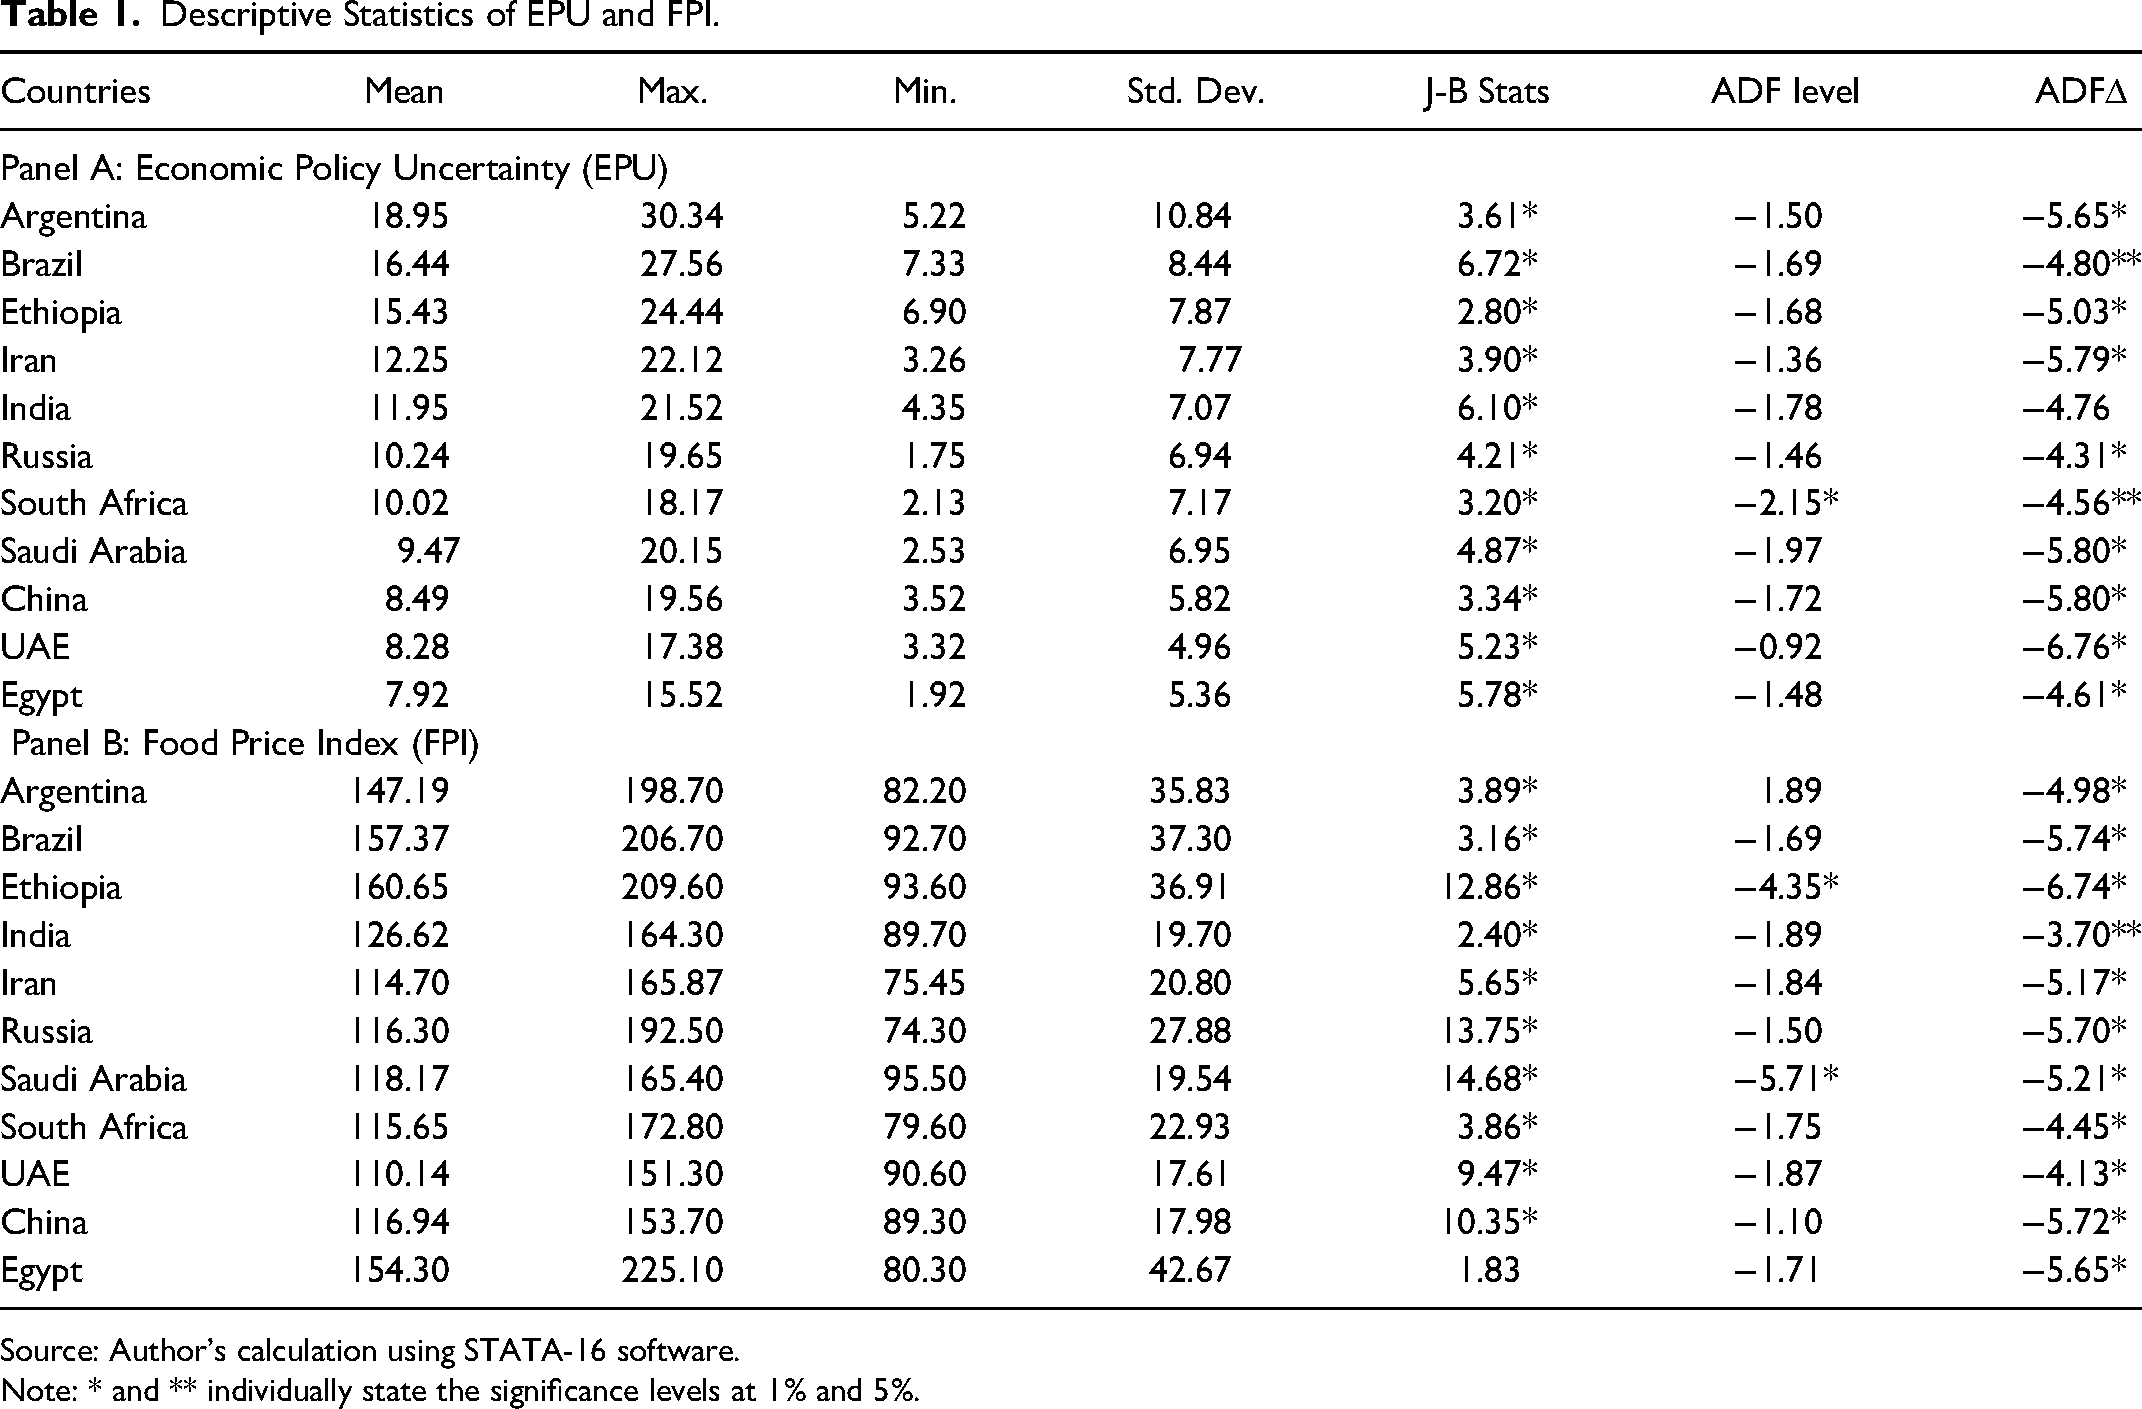
Source: Author's calculation using STATA-16 software.
Note: * and ** individually state the significance levels at 1% and 5%.
Argentina shows the most significant economic policy fluctuations, with an average EPU index of 19.15, extending from 5.22 to 31.34. Brazil follows with an average EPU index of 16.44, fluctuating between 7.33 and 27.56. Ethiopia ranks third, with the highest average FPI value of 160.65, ranging from 93.60 to 209.60. Brazil is second in FPI, followed by Egypt, Argentina, and India. The Jarque-Bera (J-B) test indicates that, excluding Egypt, both EPU and FPI deviate from normality in all economies, highlighting the suitability of the QQ tool for evaluating non-normally distributed data. The Augmented Dickey-Fuller (ADF) test suggests that converting variables into their first differences achieves stationarity in our selected nations, aligning with previous studies by Bossman et al. 21 and Cao et al. 43 Therefore, we have selected differenced data series to confirm stationarity.
Table 2 exhibits a significant positive correlation between EPU and FPI in all selected economies. South Africa designates the highest correlation coefficient of 0.85 among these countries followed by Egypt (0.82), China (0.80), and Brazil (0.79).
Correlation Between EPU and FPI.
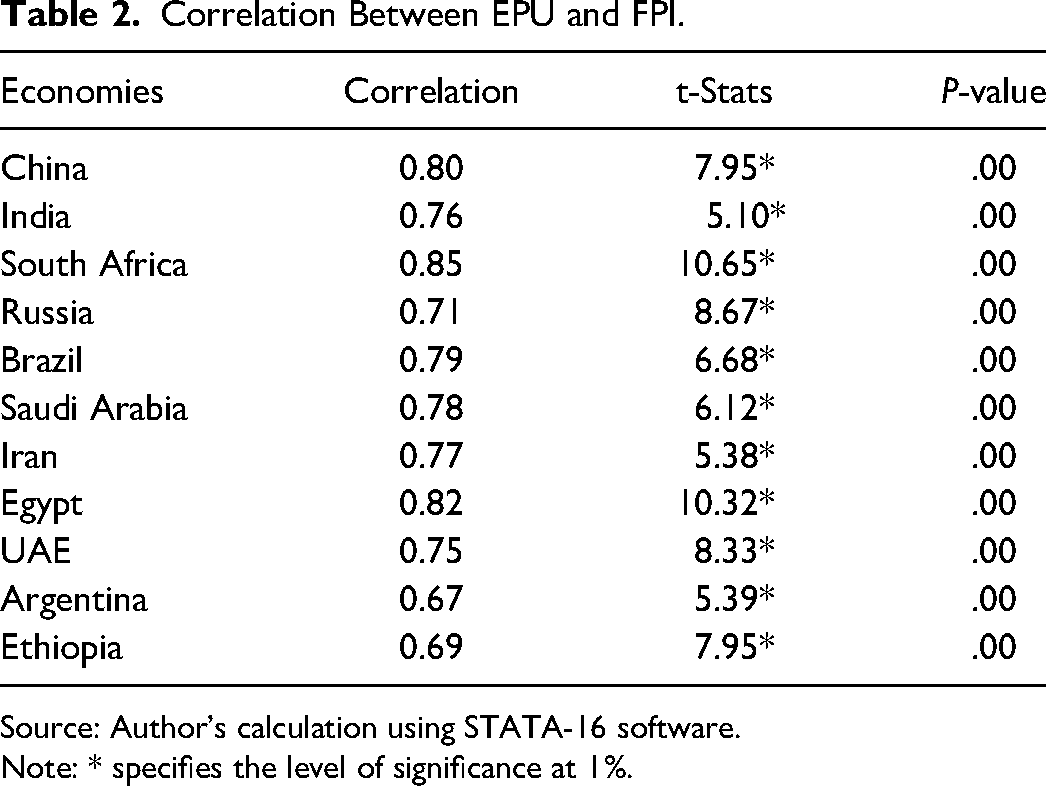
Source: Author's calculation using STATA-16 software.
Note: * specifies the level of significance at 1%.
Core Results
In Table 3, the QC assessment evaluates the stability of the variables. This analysis utilizes supremum norm coefficients (α and γ) derived from Equation 3, with τ serving as the τth FPI quantile.
Findings of QC Test (EPU and FPI).
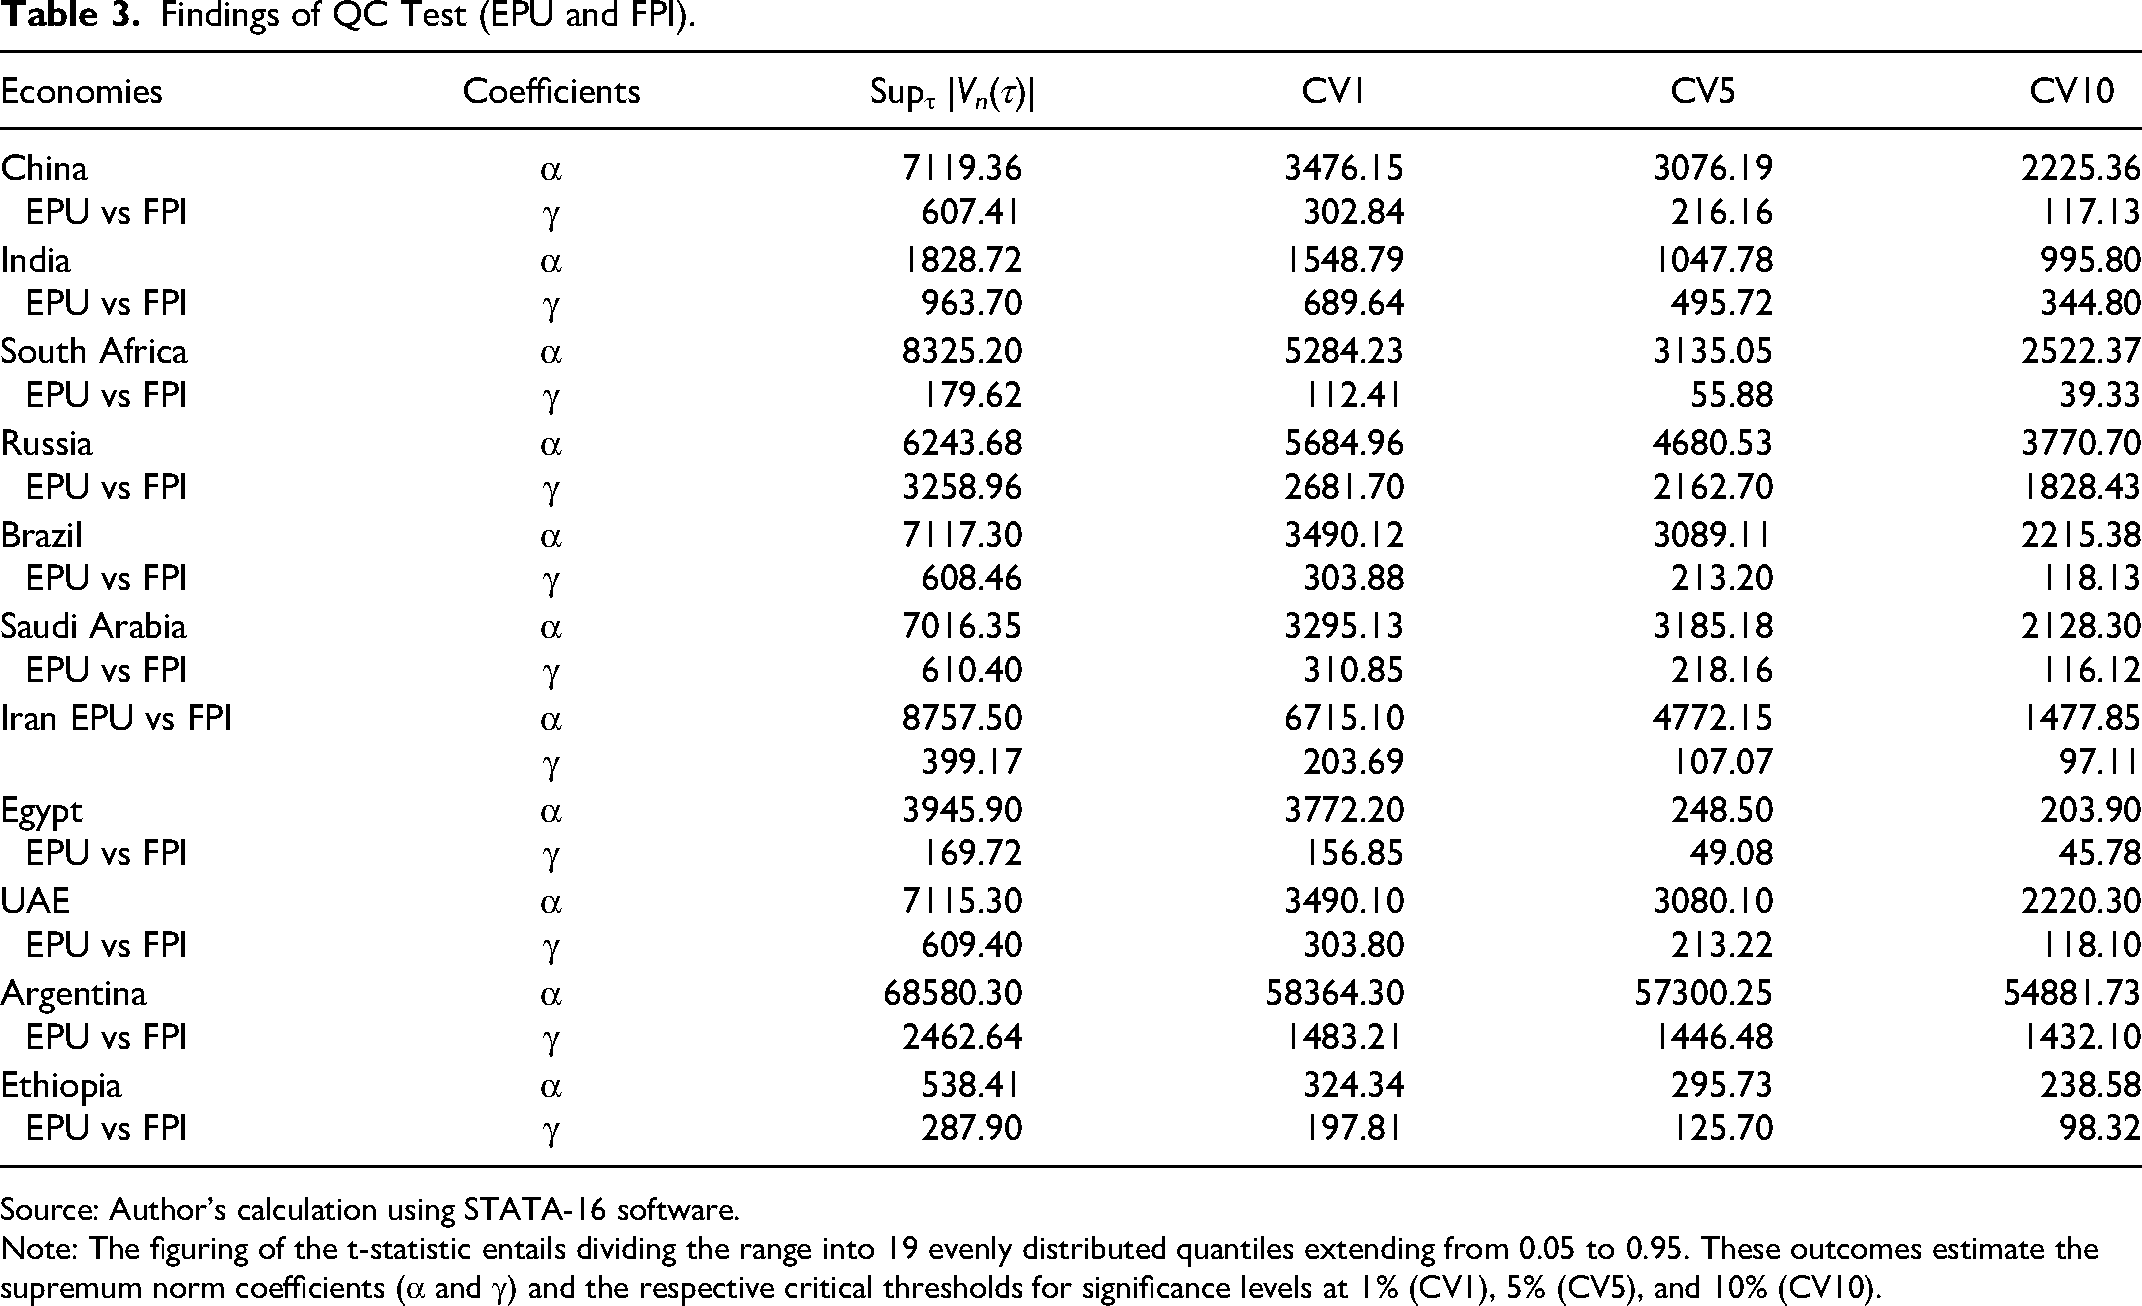
Source: Author's calculation using STATA-16 software.
Note: The figuring of the t-statistic entails dividing the range into 19 evenly distributed quantiles extending from 0.05 to 0.95. These outcomes estimate the supremum norm coefficients (α and γ) and the respective critical thresholds for significance levels at 1% (CV1), 5% (CV5), and 10% (CV10).
The findings of QC test uncover nonlinearities in the link between EPU and FPI within various quantiles in all economies. It is important to stress that the supremum norm values regarding the parameters α and γ persistently surpass their critical bounds, specifying a nonlinear, significant, and long-run EPU-FPI nexus across all selected economies.
In Figure 1, the slope parameters α1 (θ, τ) illustrate how the θth quantile of EPU impacts the τth FP quantile for various combinations of θ and τ. In China and South Africa, a strong positive bond of high EPU quantiles with FPI quantiles ranging from medium to high (0.35–0.95) exists. Conversely, a weak negative correlation appears where high EPU quantiles align with low to mid-FPI quantiles (0.05–0.30). A strong inverse correlation is noted where low to mid-EPU quantiles align with the lowest FPI quantiles. Moreover, a weak negative association is observed in China, where low EPU quantiles align with high FPI quantiles. The domination of a vigorous positive linkage between EPU and FP in China and South Africa is consistent with the studies of Cao et al. 43 and Wen et al.. 13
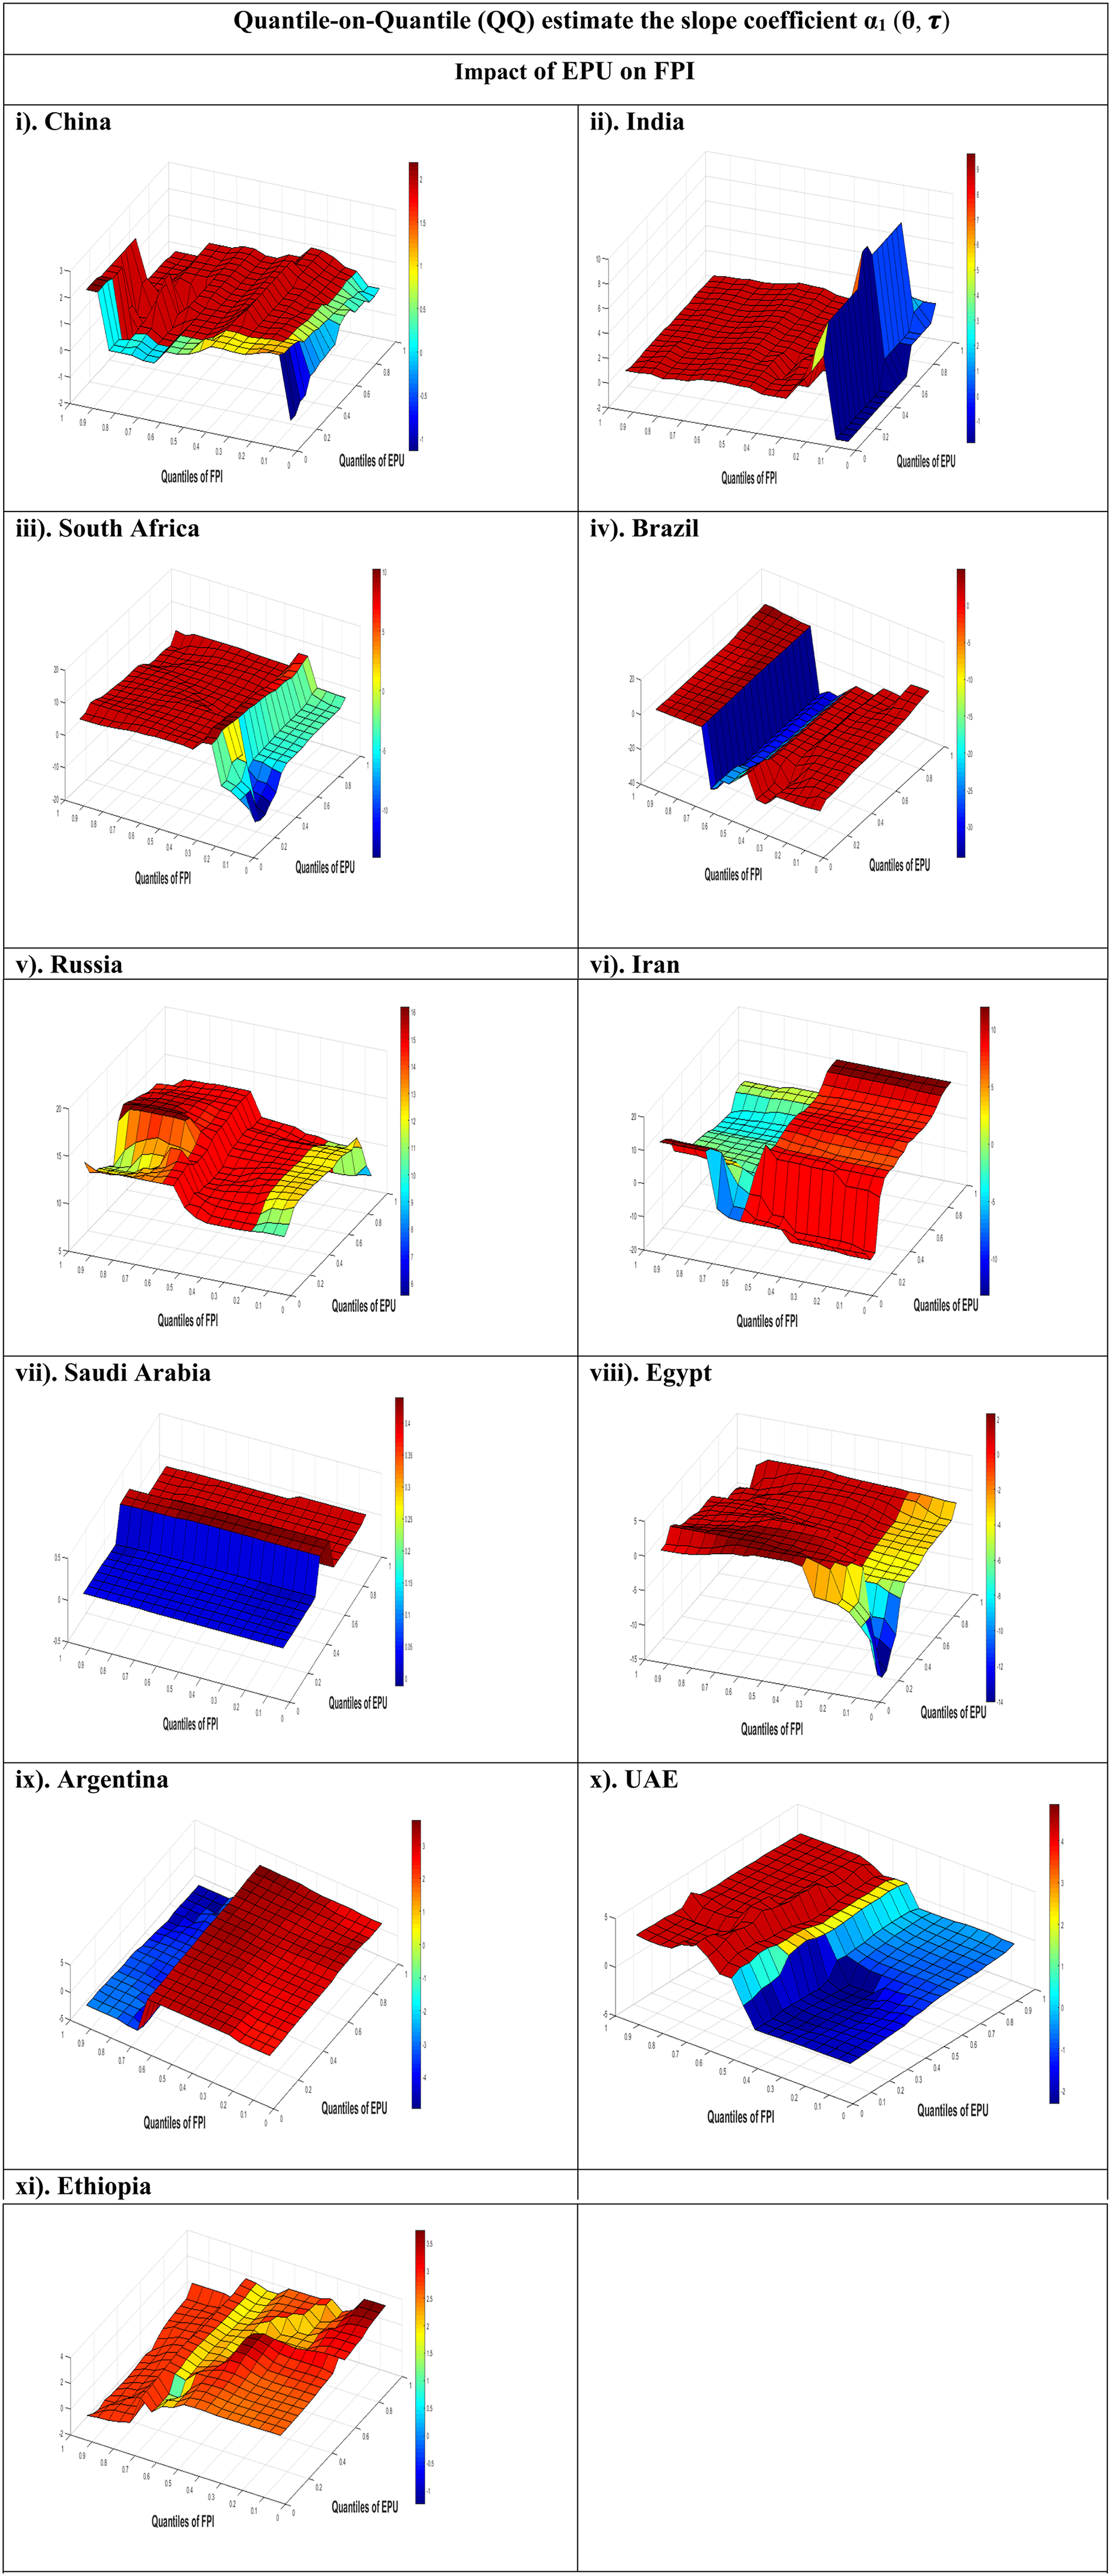
Quantile-on-Quantile (QQ) estimate the slope coefficient α1 (θ, τ).
In India, a powerful positive EPU-FPI bond is observed where high EPU quantiles align with medium-low to high FPI quantiles (0.30–0.95). Conversely, a strong negative correlation occurs where high EPU quantiles align with low to mid-high FPI quantiles (0.05–0.65). In Brazil, a strong positive bond of EPU with FPI is seen where high EPU quantiles align with FPI quantiles from low to medium-lower and high-medium to highest (0.05–0.40 and 0.75–0.95). Conversely, a strong negative correlation occurs where high EPU quantiles align with medium-low to middle-high FPI quantiles (0.45–0.70). The presence of a positive, powerful interrelation between EPU and FP in India and Brazil is confirmed by Sun et al. 9 and Hailemariam et al. 50
In Russia and Egypt, a strong positive bond between EPU and FPI is identified, where high EPU quantiles align with lower-middle to highest FPI quantiles (0.35–0.95), indicating that EPU significantly increases FPI at these ranks. In Egypt, a strong negative correlation is observed where both EPU and FPI quantiles are at their lowest, showing that EPU expressively decreases FPI at the lowest levels. The positive, powerful bond between EPU and FP in Russia and Egypt is confirmed by Long et al. 46 and Cao et al. 43 In Iran and Argentina, a strong positive correlation between EPU and FPI is found where high EPU quantiles align with the lowest to moderately higher FPI quantiles (0.05–0.65), indicating that EPU significantly raises FPI at these levels. In Argentina, a strong negative correlation occurs where high EPU quantiles align with high-middle to highest FPI quantiles (0.70–0.95), showing that EPU significantly decreases FPI at these levels. The positive and vigorous EPU-FP bond in Iran and Argentina is endorsed by Wang & Zheng 51 and Long et al. 46 In Ethiopia, a strong positive EPU-FPI tie is observed where whole quantiles of EPU align with the bottom to mid and mid-upper to higher FPI quantiles (0.05–0.50 and 0.70–0.95). It indicates that EPU significantly boosts FPI at these levels. A weak positive relationship is found where whole EPU quantiles align with medium-upper FPI quantiles (0.55–0.65). This domination of a vigorous positive EPU-FP linkage in Ethiopia is sustained by Wen et al. 13 and Zhang and Yan. 52
Saudi Arabia exhibits a mixed bond between EPU and FPI. A strong positive correlation is seen where EPU quantiles range from medium to highest (0.55–0.95) across all FPI quantiles, indicating that EPU significantly increases FPI at these levels. Conversely, a strong negative correlation exists where EPU quantiles range from lowest to medium (0.05–0.50) across all FPI quantiles, indicating that EPU significantly decreases FPI at these levels. The mixed solid bond of EPU and FP in Saudi Arabia is validated by Sodji 44 and Fang et al. 20 Similar to Saudi Arabia, the UAE shows a mixed EPU-FPI bond. A strong positive correlation is observed where EPU quantiles range from mid to highest (0.55–0.95) across all FPI quantiles, indicating that EPU significantly increases FPI at these levels. Conversely, a strong negative correlation exists where EPU quantiles range from lowest to middle (0.05–0.50) across all FPI quantiles, indicating that EPU significantly decreases FPI at these levels. A mixed EPU-FP relationship in the UAE is supported by Sohag et al. 53 and Das and Kumar. 1
Table 4 summarizes the association between various EPU and FPI quantiles across the evaluated economies based on insights from Figure 1. The outcomes highlight a significant positive bond between EPU and FPI in most of our selected nations, signifying that higher EPU is generally associated with higher FPI. However, the UAE and Saudi Arabia have mixed findings regarding this relationship.
Summary of Results (Relationship b/w Diverse Quantiles of EPU and FPI).
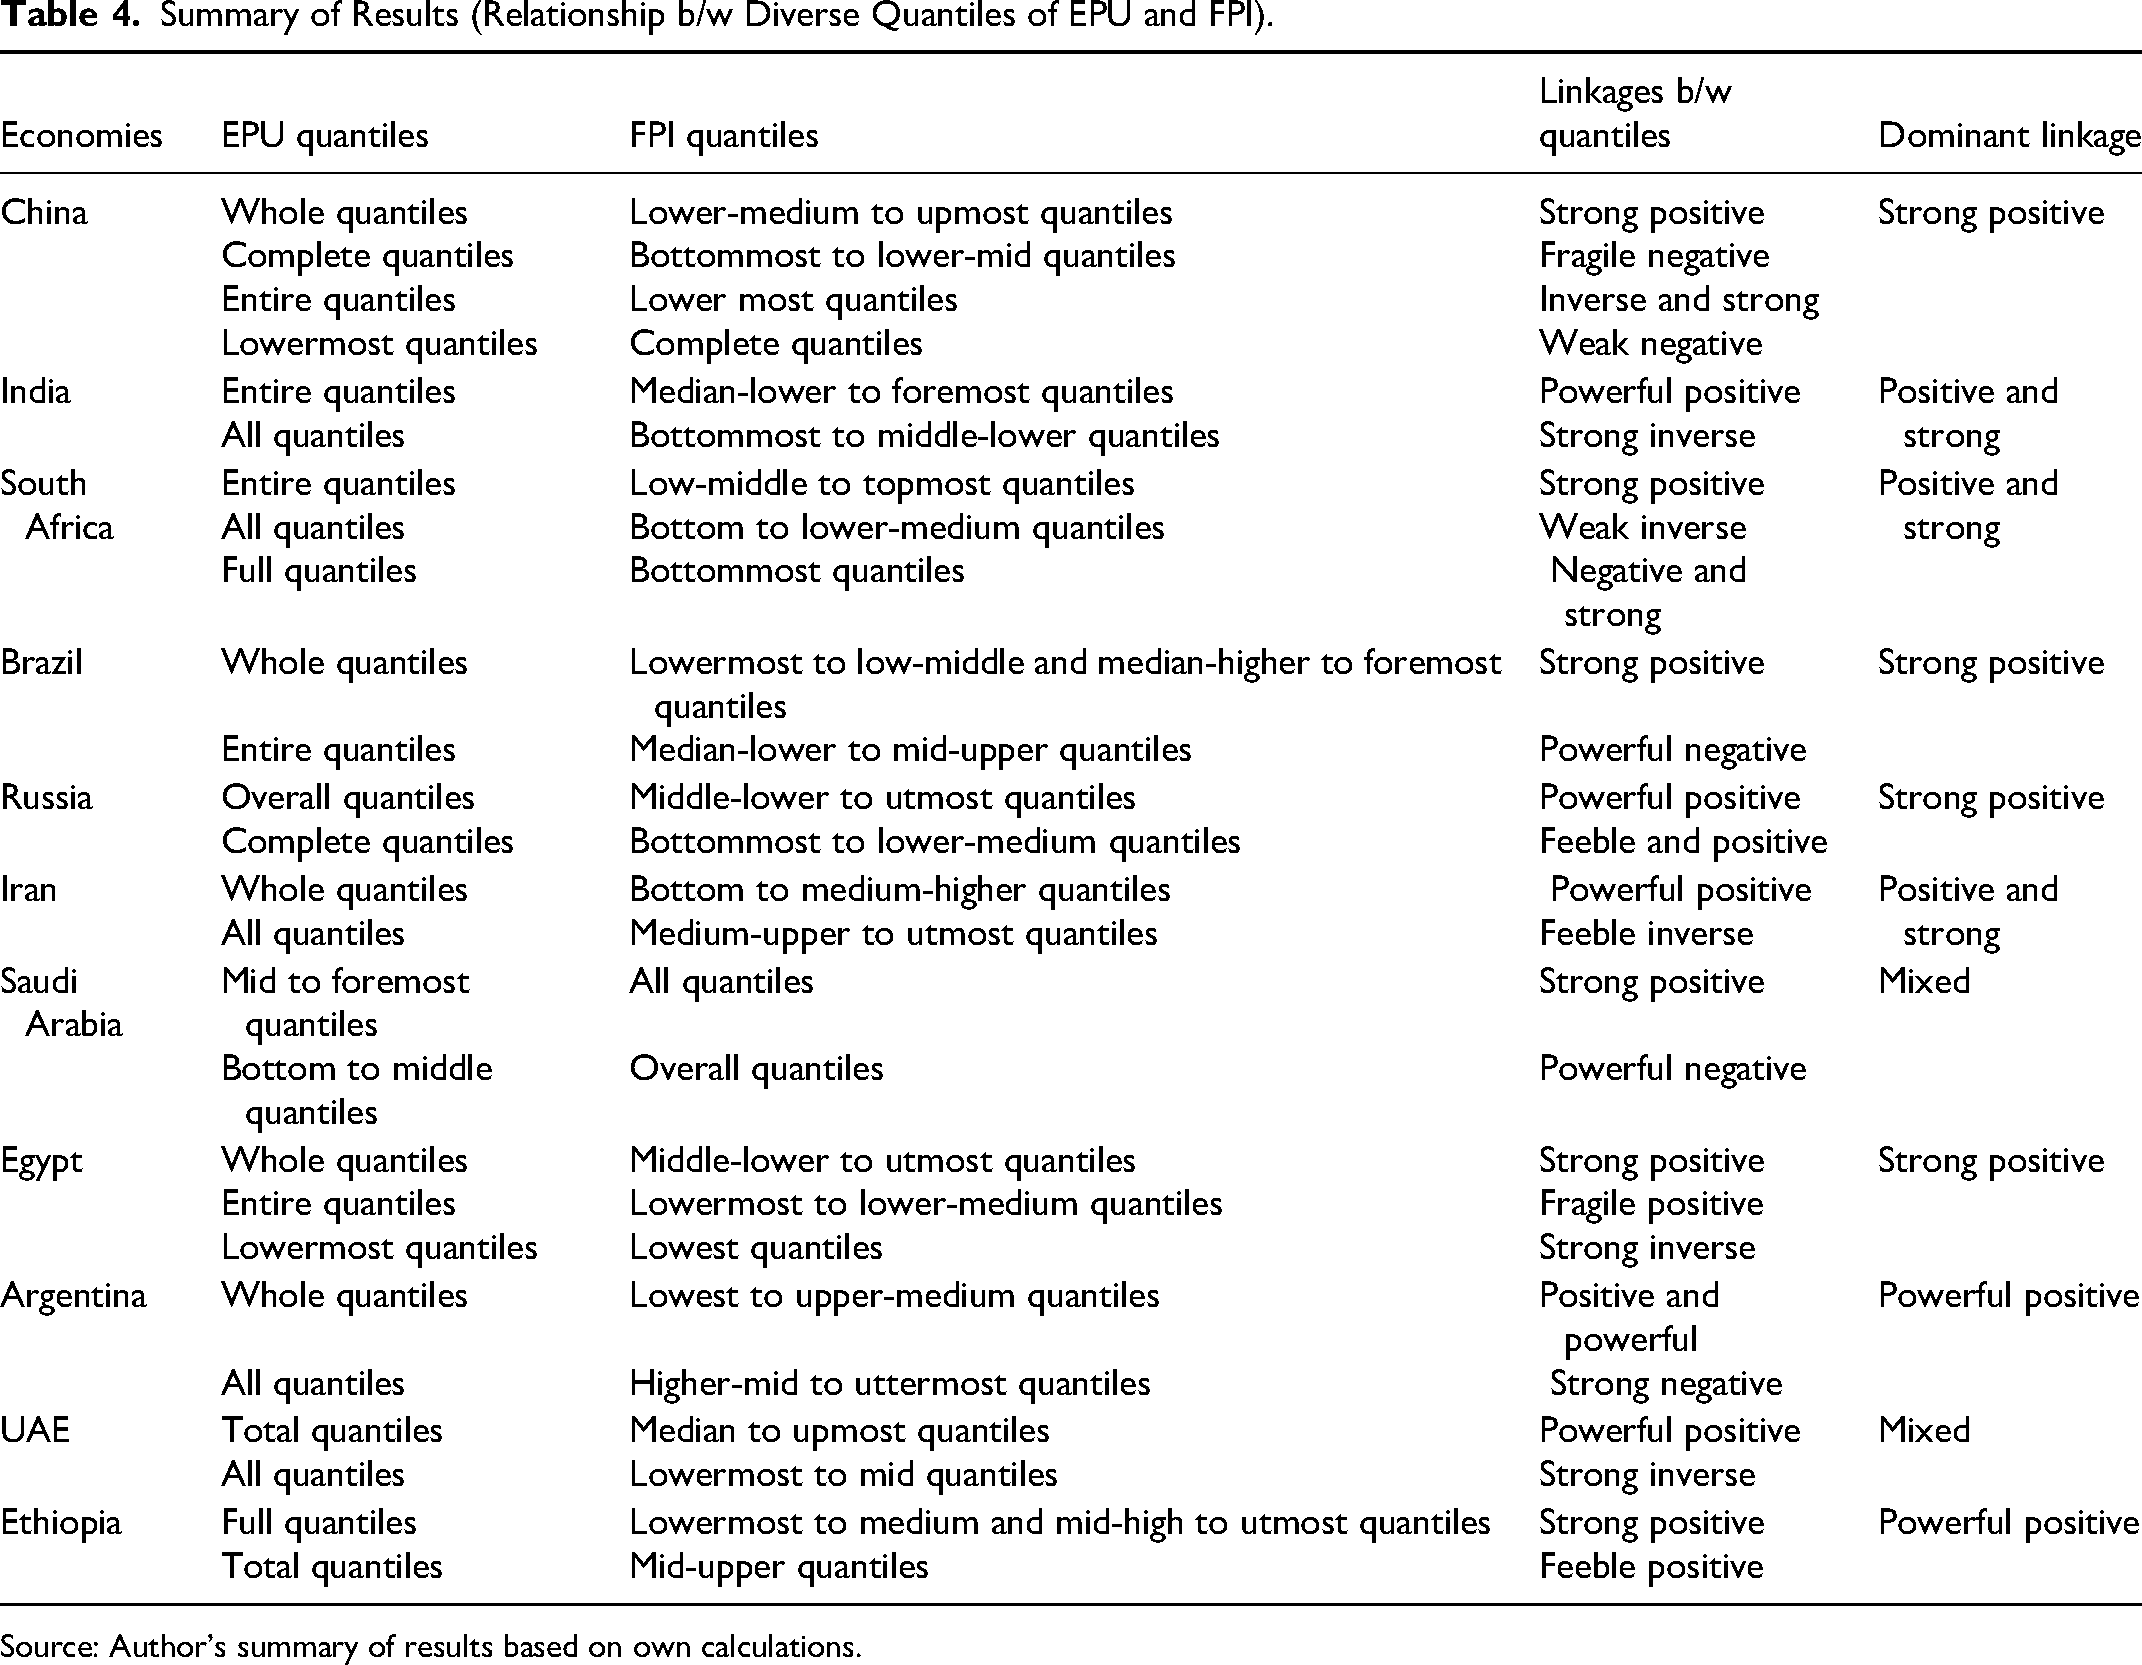
Source: Author's summary of results based on own calculations.
Verifying the Robustness of the QQ Methodology
A detailed appraisal measures the similarity between QR and QQ estimations. Figure 2 endorses previous outcomes from the QQ examination, showing strong correspondence between mean QQ slope parameters and QR estimations across nations. It discloses consistent analytical outcomes from both estimation methods.
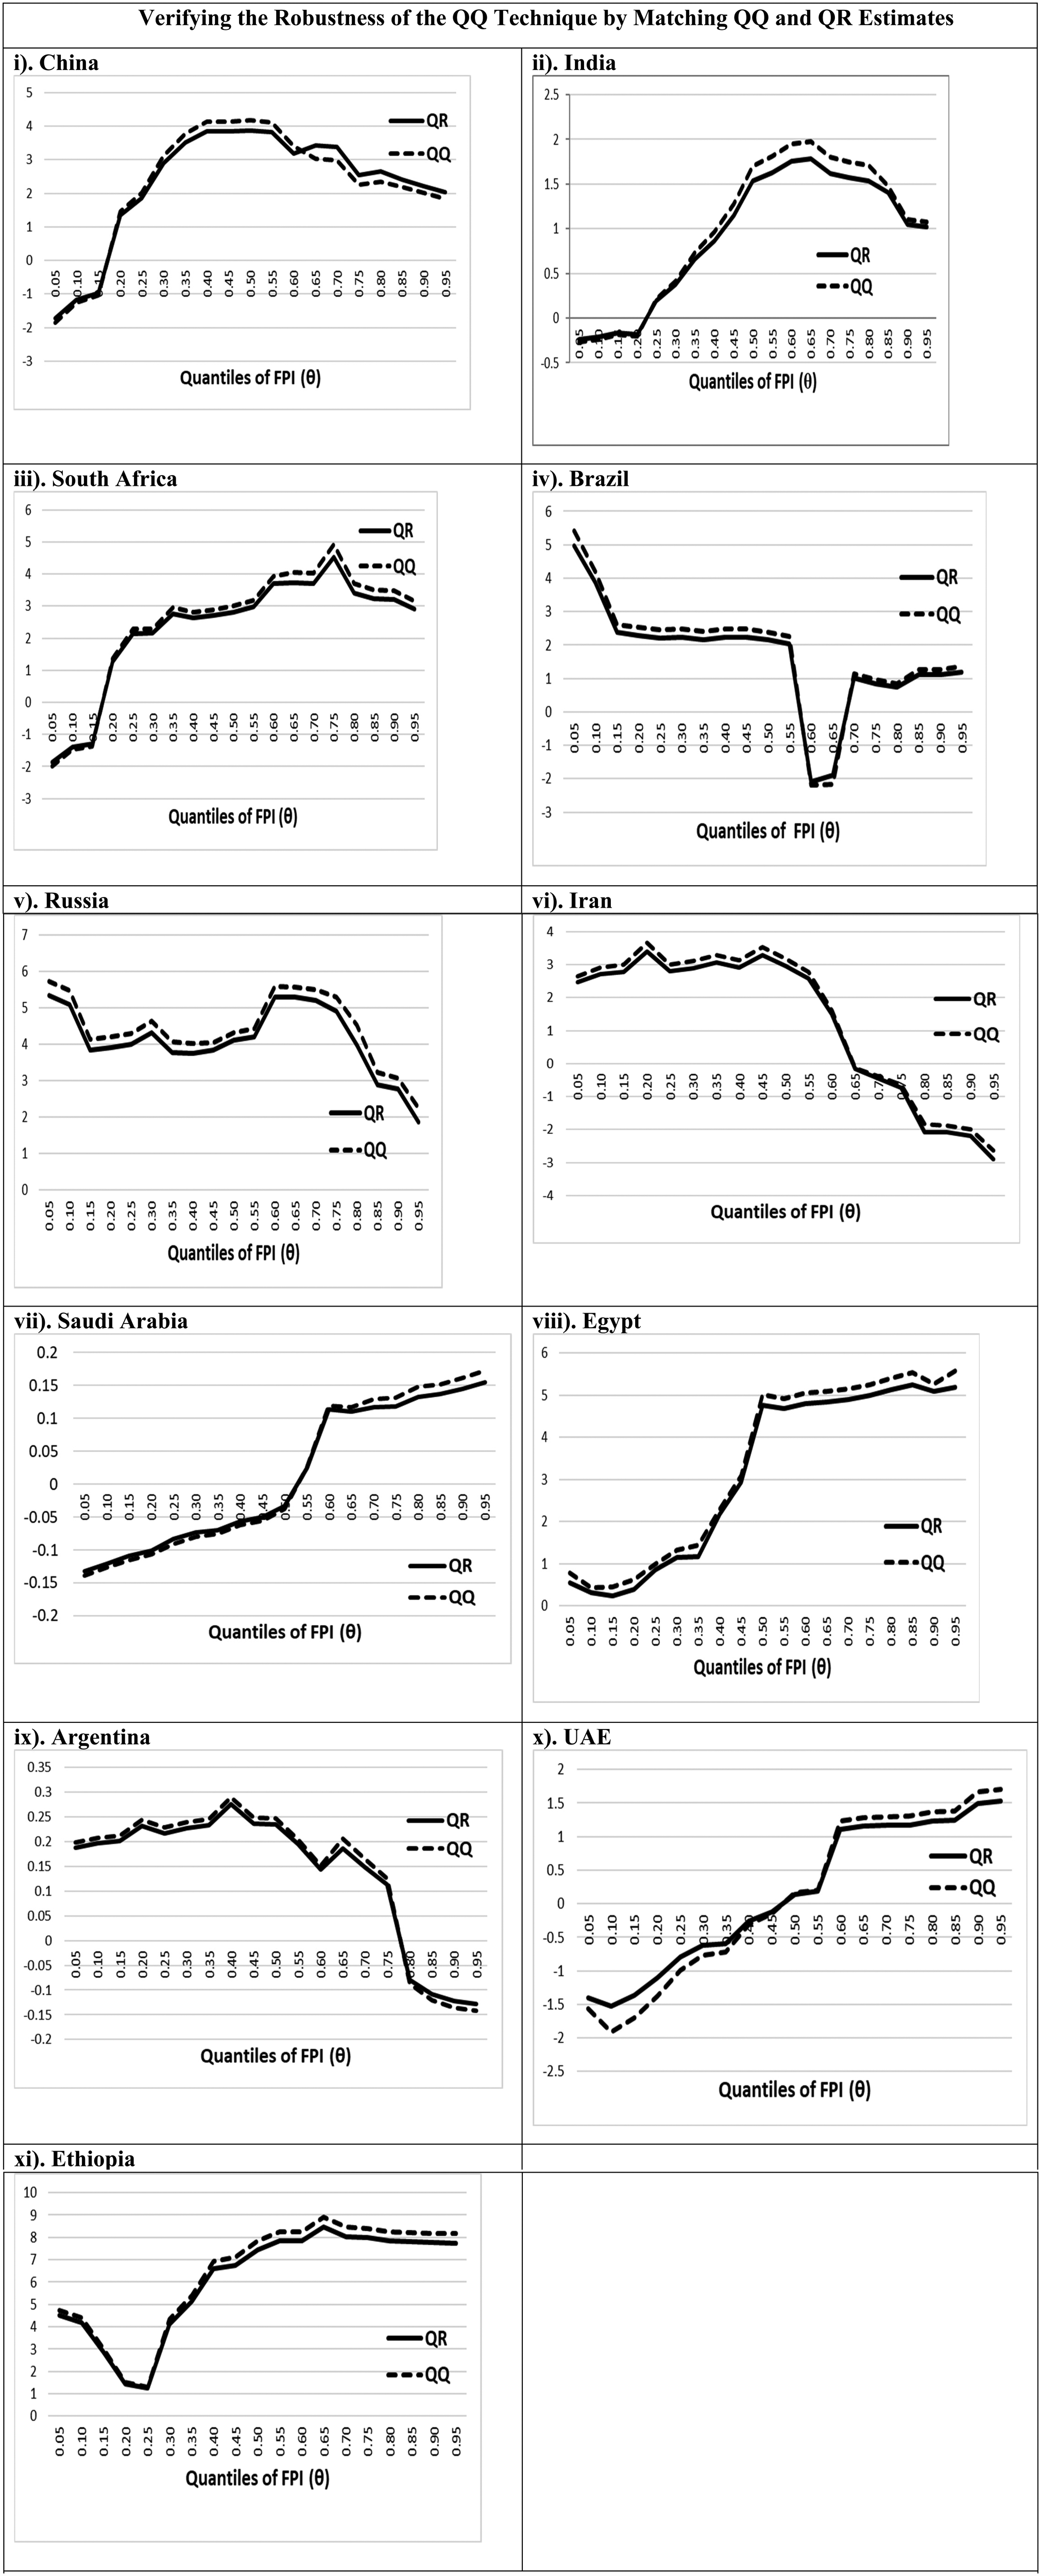
Verifying the robustness of the QQ technique by matching QQ and QR estimates
Figure 2 reveals a strong positive connection between EPU and FPI in most selected economies, except for the mixed results in Saudi Arabia and the UAE. These outcomes highlight asymmetries in the EPU-FPI bond across nations. The most prominent influence of EPU on FPI is seen in South Africa, China, Russia, Brazil, Iran, Egypt, and Ethiopia, while Argentina and Saudi Arabia show less pronounced effects.
Discussion of Results
Most nations reveal a positive EPU-FP relationship, with 9 out of 11 economies showing this association. This aligns with findings from Long et al., 46 Cao et al., 43 Wen et al., 13 and Sun et al. 9 This study is also partially supported by Sodji 44 for Saudi Arabia and Sohag et al. 53 for the UAE, indicating varied impacts of EPU on FP. Unlike prior research, our study provides nuanced insights into the EPU-FP linkage across different data segments, offering valuable implications for policymakers crafting tailored policies for varying levels of EPU and FP.
The relationship between EPU and FP varies between Saudi Arabia and the UAE, showing both positive and negative connections. Visual representations highlight how EPU influences FP over time, duration, and geography. Increased EPU during economic crises raises FP due to market volatility and supply chain disruptions. Conversely, stability weakens this link, sometimes resulting in moderate or negative associations. Short-term uncertainty causes temporary FP increases, while prolonged uncertainty disrupts supply chains and sustains inflationary pressures. Geographical factors contribute to these mixed effects. Despite similarities in economic policies and dependence on global oil markets, differences in domestic food production, reliance on imports, and regional geopolitics influence the EPU-FP relationship differently in Saudi Arabia and the UAE. Despite unique contexts, these shared characteristics lead to a parallel impact of EPU on FP in both countries. Climate and natural resource availability also play a crucial role in local food supply, influencing FP's sensitivity to EPU in specific geographic regions. This mixed bond of EPU and FP aligns with findings from previous studies, such as Sodji. 44
In China, India, Brazil, Russia, South Africa, Egypt, UAE, and Ethiopia, a powerful positive bond exists between EPU and FPI, particularly at higher FPI quantiles. This link is intensified by income inequality, as lower- and middle-income households assign a significant share of their earnings to food. Rising EPU disrupts supply chains, leading to shortages and higher FP, impacting disposable income. Supply chain disruptions are more pronounced at higher FP quantiles, where demand for essential food items is strained due to natural disasters or geopolitical instability. Additionally, the inelastic nature of food demand means consumers must buy essential items despite price increases, strengthening the EPU-FP relationship, especially for lower-income groups. 54
The relationship between EPU and FP shifts from negative to positive in Saudi Arabia and the UAE beyond a specific EPU threshold, initially indicating that lower EPU levels correlate negatively with FP as economic policy certainty boosts investments in agriculture. However, heightened uncertainty reduces agricultural investment and productivity beyond this threshold, leading to food supply shortages and higher FP. External factors like global market trends and regional conflicts also contribute to this shift. Government interventions, supported by oil revenues, stabilize the food sector during uncertainty by injecting liquidity or subsidizing essential commodities. 55 At higher EPU levels, authorities address uncertainties through explicit policies or secure food supplies, mitigating FP volatility and shifting the relationship from positive to inverse. 44
Changes in slope coefficients of EPU and FP show economic influences on FP. During recessions, the positive link between EPU and FP intensifies as demand for essential goods surges. Conversely, in economic booms, reduced supply chain disruptions occur due to decreased consumer price sensitivity and improved business efficiency. Governments implement stabilization measures during prosperity. 19 Tailored approaches are essential due to each country's unique challenges, guiding us to use the QQ technique to understand their distinct features comprehensively.
Conclusion and Policy Implications
This research has evaluated how EPU influences FP in expanded BRICS countries (Brazil, Russia, India, China, South Africa, Egypt, Ethiopia, Iran, Argentina and Saudi Arabia, and the UAE). The results of QQ estimation indicate a significant and positive association between EPU and FP across various quantiles in the selected economies. However, it is essential to note that Saudi Arabia and the UAE have exhibited a mixed pattern of results in this regard.
Governments should improve policy clarity and transparency in economies like South Africa, China, Brazil, India, Russia, Egypt, Iran, Argentina, and Ethiopia, with a clear positive association between EPU and FP. Effective communication of economic policies can mitigate uncertainty for producers and consumers, reducing the adverse impact on FP. 56 In Saudi Arabia and the UAE, where the correlation shifts from negative to positive beyond a certain threshold, policymakers should mitigate EPU-induced FP volatility by diversifying food supply chains and investing in domestic agriculture to enhance resilience against EPU-related shocks and stabilize FP.
In order to appraise the varied influences of EPU on FP across expanded BRICS countries, tailored policy interventions are crucial. Governments should implement adaptive social safety nets, including food subsidies and cash transfers, to shield vulnerable populations from FP fluctuations driven by EPU. These initiatives must remain flexible to adapt to changing FP dynamics. Additionally, promoting economic diversification is vital. Policies should encourage investment in sectors less susceptible to EPU, such as technology and renewable energy, while fostering education and skill development for a resilient workforce. 57 By combining targeted safety nets with diversification strategies, a comprehensive approach can be taken to mitigate EPU's adverse effects on FP, aiming for sustainable stability and growth. 58 Targeted policy measures are necessary in China, South Africa, India, Brazil, Russia, Egypt, Iran, Argentina, and Ethiopia, where EPU and FP correlate strongly. Prioritizing policy predictability and transparency can reduce FP volatility. Investing in the agricultural sector, improving infrastructure, promoting research, supporting sustainable practices, and enhancing food security measures like strategic reserves and aid to small-scale farmers are essential. Effective market regulation to prevent speculation and price manipulation during high EPU periods and robust monitoring and enforcement can maintain fair practices and foster a stable pricing environment. 59
This research acknowledges few limitations that offer valuable directions for future investigations. Firstly, our paper centered solely on FP, disregarding other significant factors like uncertainties in food and nutrition-related policies, global supply chain dynamics, and the influences of climate change on agricultural productivity. Incorporating these additional indicators in future research could reveal important outcome variations when using different analytical frameworks and variables. Studying the correlation between EPU and FP across other economic blocs like the European Union, G7, MENA, and G20 could considerably boost our understanding of this relationship. All-inclusive explorations from diverse perspectives can reveal potential variations across regions. Moreover, the QQ tool has constraints when integrating additional variables, which affect the EPU-FP bond. Prospective studies could utilize multivariate tools, including Quantile ARDL modeling, to gain a more comprehensive awareness. Tackling above-mentioned limitations in future studies will improve our grasp of the intricate dynamics between EPU and FP.
Footnotes
Author's Note
Muhammad Khalid Anser is now affiliated with Department of Economics, Faculty of Economics and Administrative Sciences, Recep Tayyip Erdoğan University, Rize,Türkiye.
Data Availability
The datasets adopted in this study can be obtained from the corresponding author upon plausible request.
Declaration of Conflicting of Interest
The authors declared no potential conflicts of interest with respect to the research, authorship, and/or publication of this article.
Funding
The authors received no financial support for the research, authorship, and/or publication of this article.
Human and Animal Rights
This research was conducted without causing harm to any animals or humans.
Correction (February 2025):
Article updated online to update the category of the article from “Original Research” to “Food and Nutrition Policy”.