
Abstract
Background
Studies on intrahousehold inequality in food distribution typically have focused on the distribution of total energy within the household. While some members within the household can satiate their hunger primarily from the consumption of inexpensive staple food items, others can consume a significantly larger share of much more expensive nonstaple food items rich in bioavailable micronutrients. This potential inequality, which significantly impacts micronutrient malnutrition in developing countries, can be influenced by the gender-related sociocultural norms.
Methods
This article uses a “food share over energy share (FS/ES)” methodology applied to the Philippines 2013 intrahousehold individual food consumption survey to examine patterns of dietary quality by age and gender.
Results
No pattern of age or gender discrimination is found; females consume most nonstaple foods somewhat more intensively than males. Preschoolers and young children relatively intensively consume higher amounts of milk and milk products, eggs, processed meat, noodles, sweets/desserts, sugars/syrups, and chocolate drinks. Adults relatively intensively consume fresh meat, organ meat, fish and seafood, vegetables, coffee, and alcohol. Adolescents transition between the two patterns as they grow older.
Conclusion
The FS/ES methodology focuses on distribution choices of specific foods that family members explicitly know about. The implications of these behavioral choices (some foods are nutrient-dense, others not) for meeting nutrient requirements (of which most households are unaware) may be investigated separately. Several types of follow-up studies using the FS/ES methodology are suggested for a better understanding of the factors that drive food distribution behavior, which is key to effective nutrition messaging.
Plain language title
Distribution of food among household members in the Philippines: Understanding how we share meals
Plain language summary
This study explores how food is divided among members in households. Staple foods are inexpensive sources of energy to stave off hunger. Nonstaple foods are denser in vitamins and minerals, but are much more expensive sources of energy, especially fish and animal products. Societal norms, especially those related to gender, influence how this sharing happens, which affects the quality of diets. We use a method called “food share over energy share” to analyze data from household food intake surveys conducted in the Philippines in 2013 to study patterns of family sharing of several food groups which together comprise all foods consumed. There are substantial differences in the
Introduction
Poor-quality diets in low- and middle-income countries (LMICs) and resulting mineral and vitamin deficiencies have led to compromised cognitive development, stunting, higher morbidity and mortality, and restricted economic growth. 1 Lower incomes due to the recent COVID pandemic and rising food prices due to the war in Ukraine and other factors have raised concerns that the “hidden hunger” crisis has worsened in the short term.
One piece in the puzzle of a better understanding of the drivers of inadequate dietary patterns is to understand how food is distributed by age and gender within households. Mineral and vitamin requirements are higher for preschool children and women of reproductive age, due to rapid growth and reproduction, respectively. Therefore, are preschool children and their mothers relatively favored in terms of the level of dietary quality which their families can afford?
In some societies, there is an explicit belief that boys should be favored over girls. For example, for Bangladesh, ethnographic studies as cited below, document strong evidence of gender discrimination in intrahousehold food distribution: “Women are quite literally a residual category in the distribution of food, eating after men and usually after the children, and making do with what is left. This is partly self-imposed deprivation since it is women who prepare, distribute, and serve meals. But it is sanctioned by a widely held belief that the practice ensures the longevity and good fortune of the male guardians.”
2
“According to the women they undergo self-deprivation because they have to feed men and children well. Since men undertake a lot of manual labor, they are perceived as having greater food requirements, while children go to school and need sufficient food for the development of their brains. Thus, when food is scarce women sacrifice their share. Girls may also be fed less frequently than boys, which women justified by the fact that they are often not in school. They also mentioned that the girls must get used to such deprivation.”
3
By contrast, the ethnographic and linguistic studies from the Philippines document no evidence of favoritism toward male compared to female. For instance, Palabrica-Costello
4
finds: “ … nearly all the parents interviewed claimed that they were not favoring their sons over their daughters when it comes to the distribution of food to the children … Adults interviewed do not think that working members of the family are necessarily entitled to extra food. This is viewed as being ‘unfair’ to other members because ‘everyone is doing his/her own share in the household.’ … Parents express repugnance at the suggestion that males should be entitled to better food than females, or that family members that earn more should be entitled to better food.”
Similarly, the absence of gender discrimination is also evident in the linguistic analysis as stated by Bouis et al
5
: “Linguistic analysis of Filipino kin terminology has a striking lack of gender differentiation,
6
a pattern that is generally incompatible with strongly discriminatory patterns against females. For example, the Tagalog language has a general term for child (anak), but no specific word for either ‘daughter’ or ‘son.’ Fertility studies, too, almost invariably show that Filipinos are just as likely to desire a daughter as a son. Indeed, a few studies
7
have shown a slight preference for a girl among Philippine parents.”
This article endeavors to make a contribution to Philippine nutrition policy by examining the patterns of food distribution across age and gender groups in the Philippines. Which groups consume the most nutritious foods most intensely; which groups consume less nutritious foods most intensely for which other more nutritious foods might be substituted for the same food expenditure?
This article uses a “food share over energy share (FS/ES)” 8 applied to household survey data collected in 2013 by the Department of Science and Technology-Food and Nutrition Research Institute (DOST-FNRI) to characterize intrahousehold food distribution in the Philippines. The DOST-FNRI nationwide surveys undertaken periodically over several decades are a rich, almost unique, but under-utilized source of information on dietary patterns, economic factors such as wealth and food prices that drive these dietary patterns, and measures of nutritional status that are determined in large part by diets.
The FS/ES methodology is explained in the following section. Dietary patterns are described by age and gender from the perspective of this methodology. A third section draws conclusions and areas for further research.
Methods and Results
Philippine Dietary Patterns by Wealth Quintile
To provide intuition for construction of the FS/ES ratio, dietary patterns at the
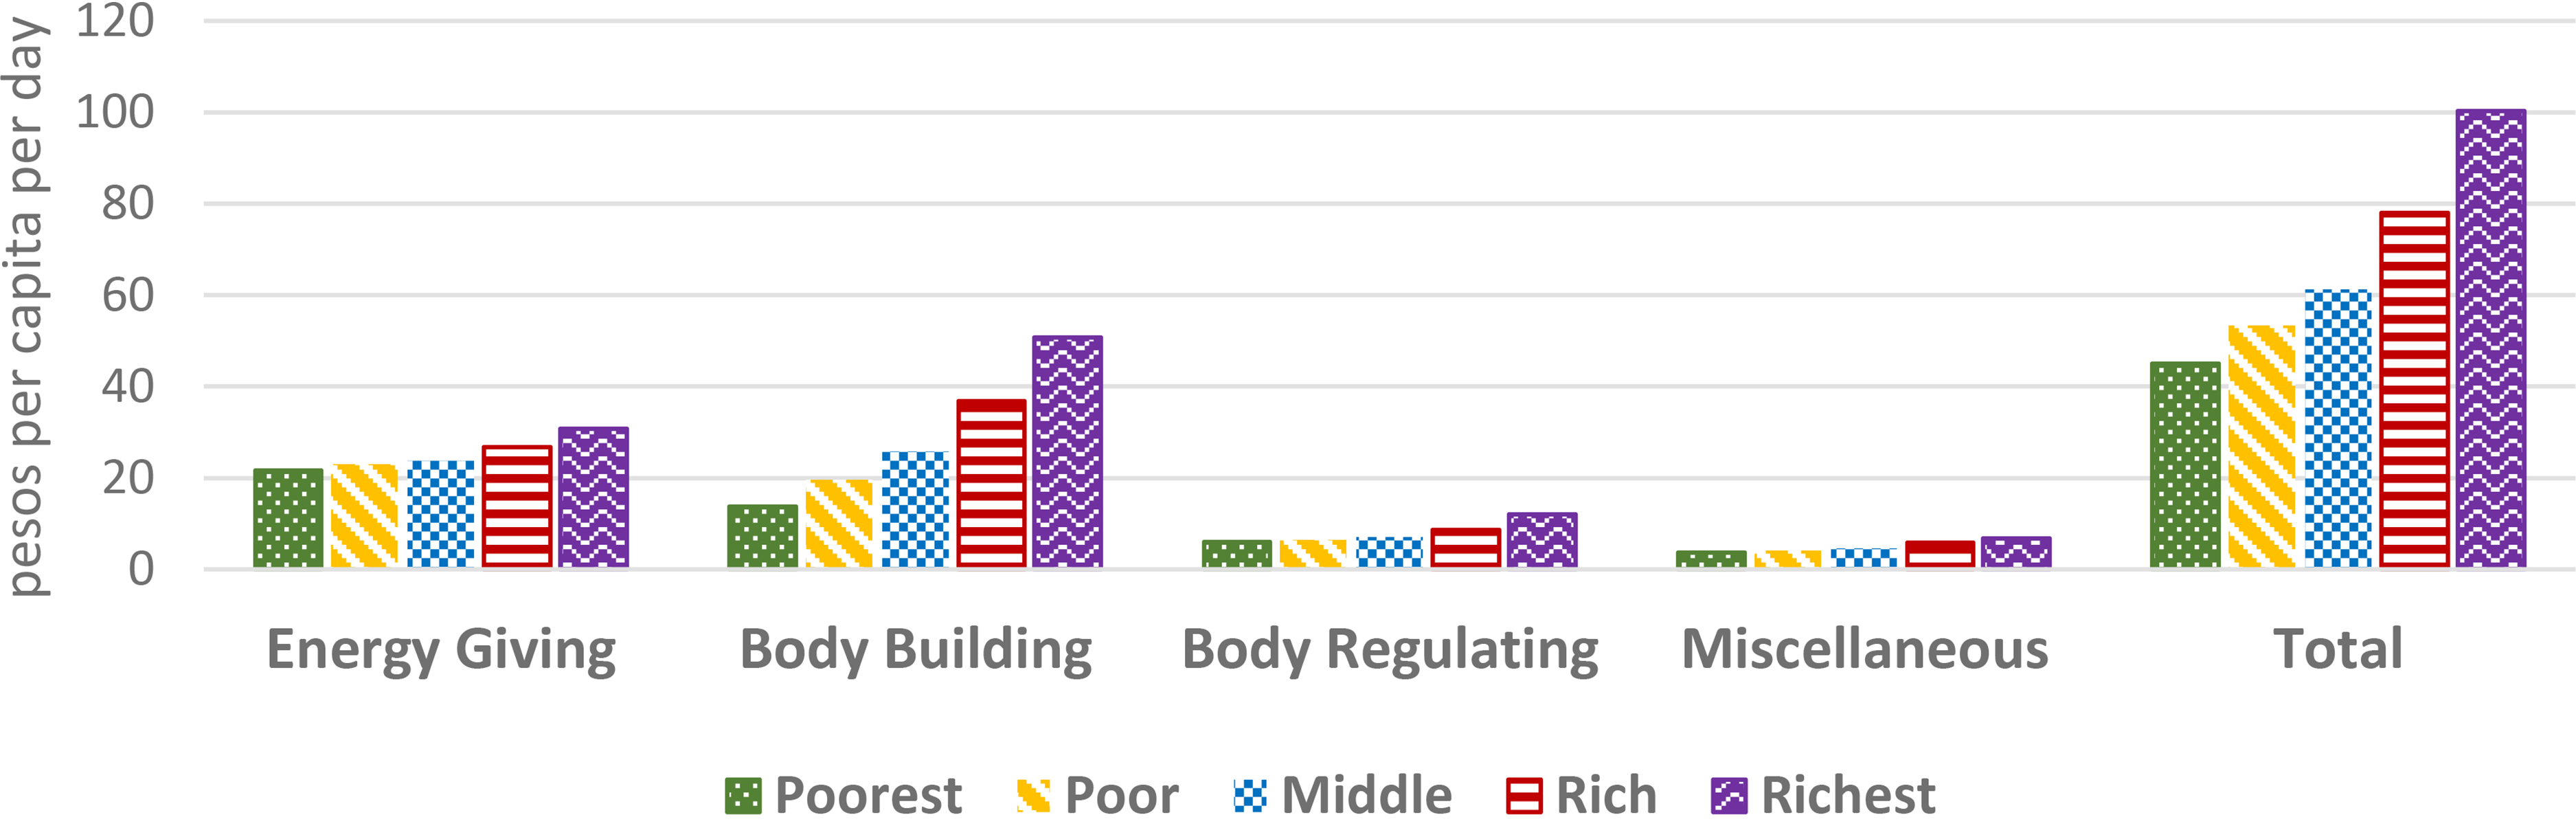
Food expenditures by wealth quintile by broad food group: Philippines, DOST-FNRI 2015 Food Consumption Survey.
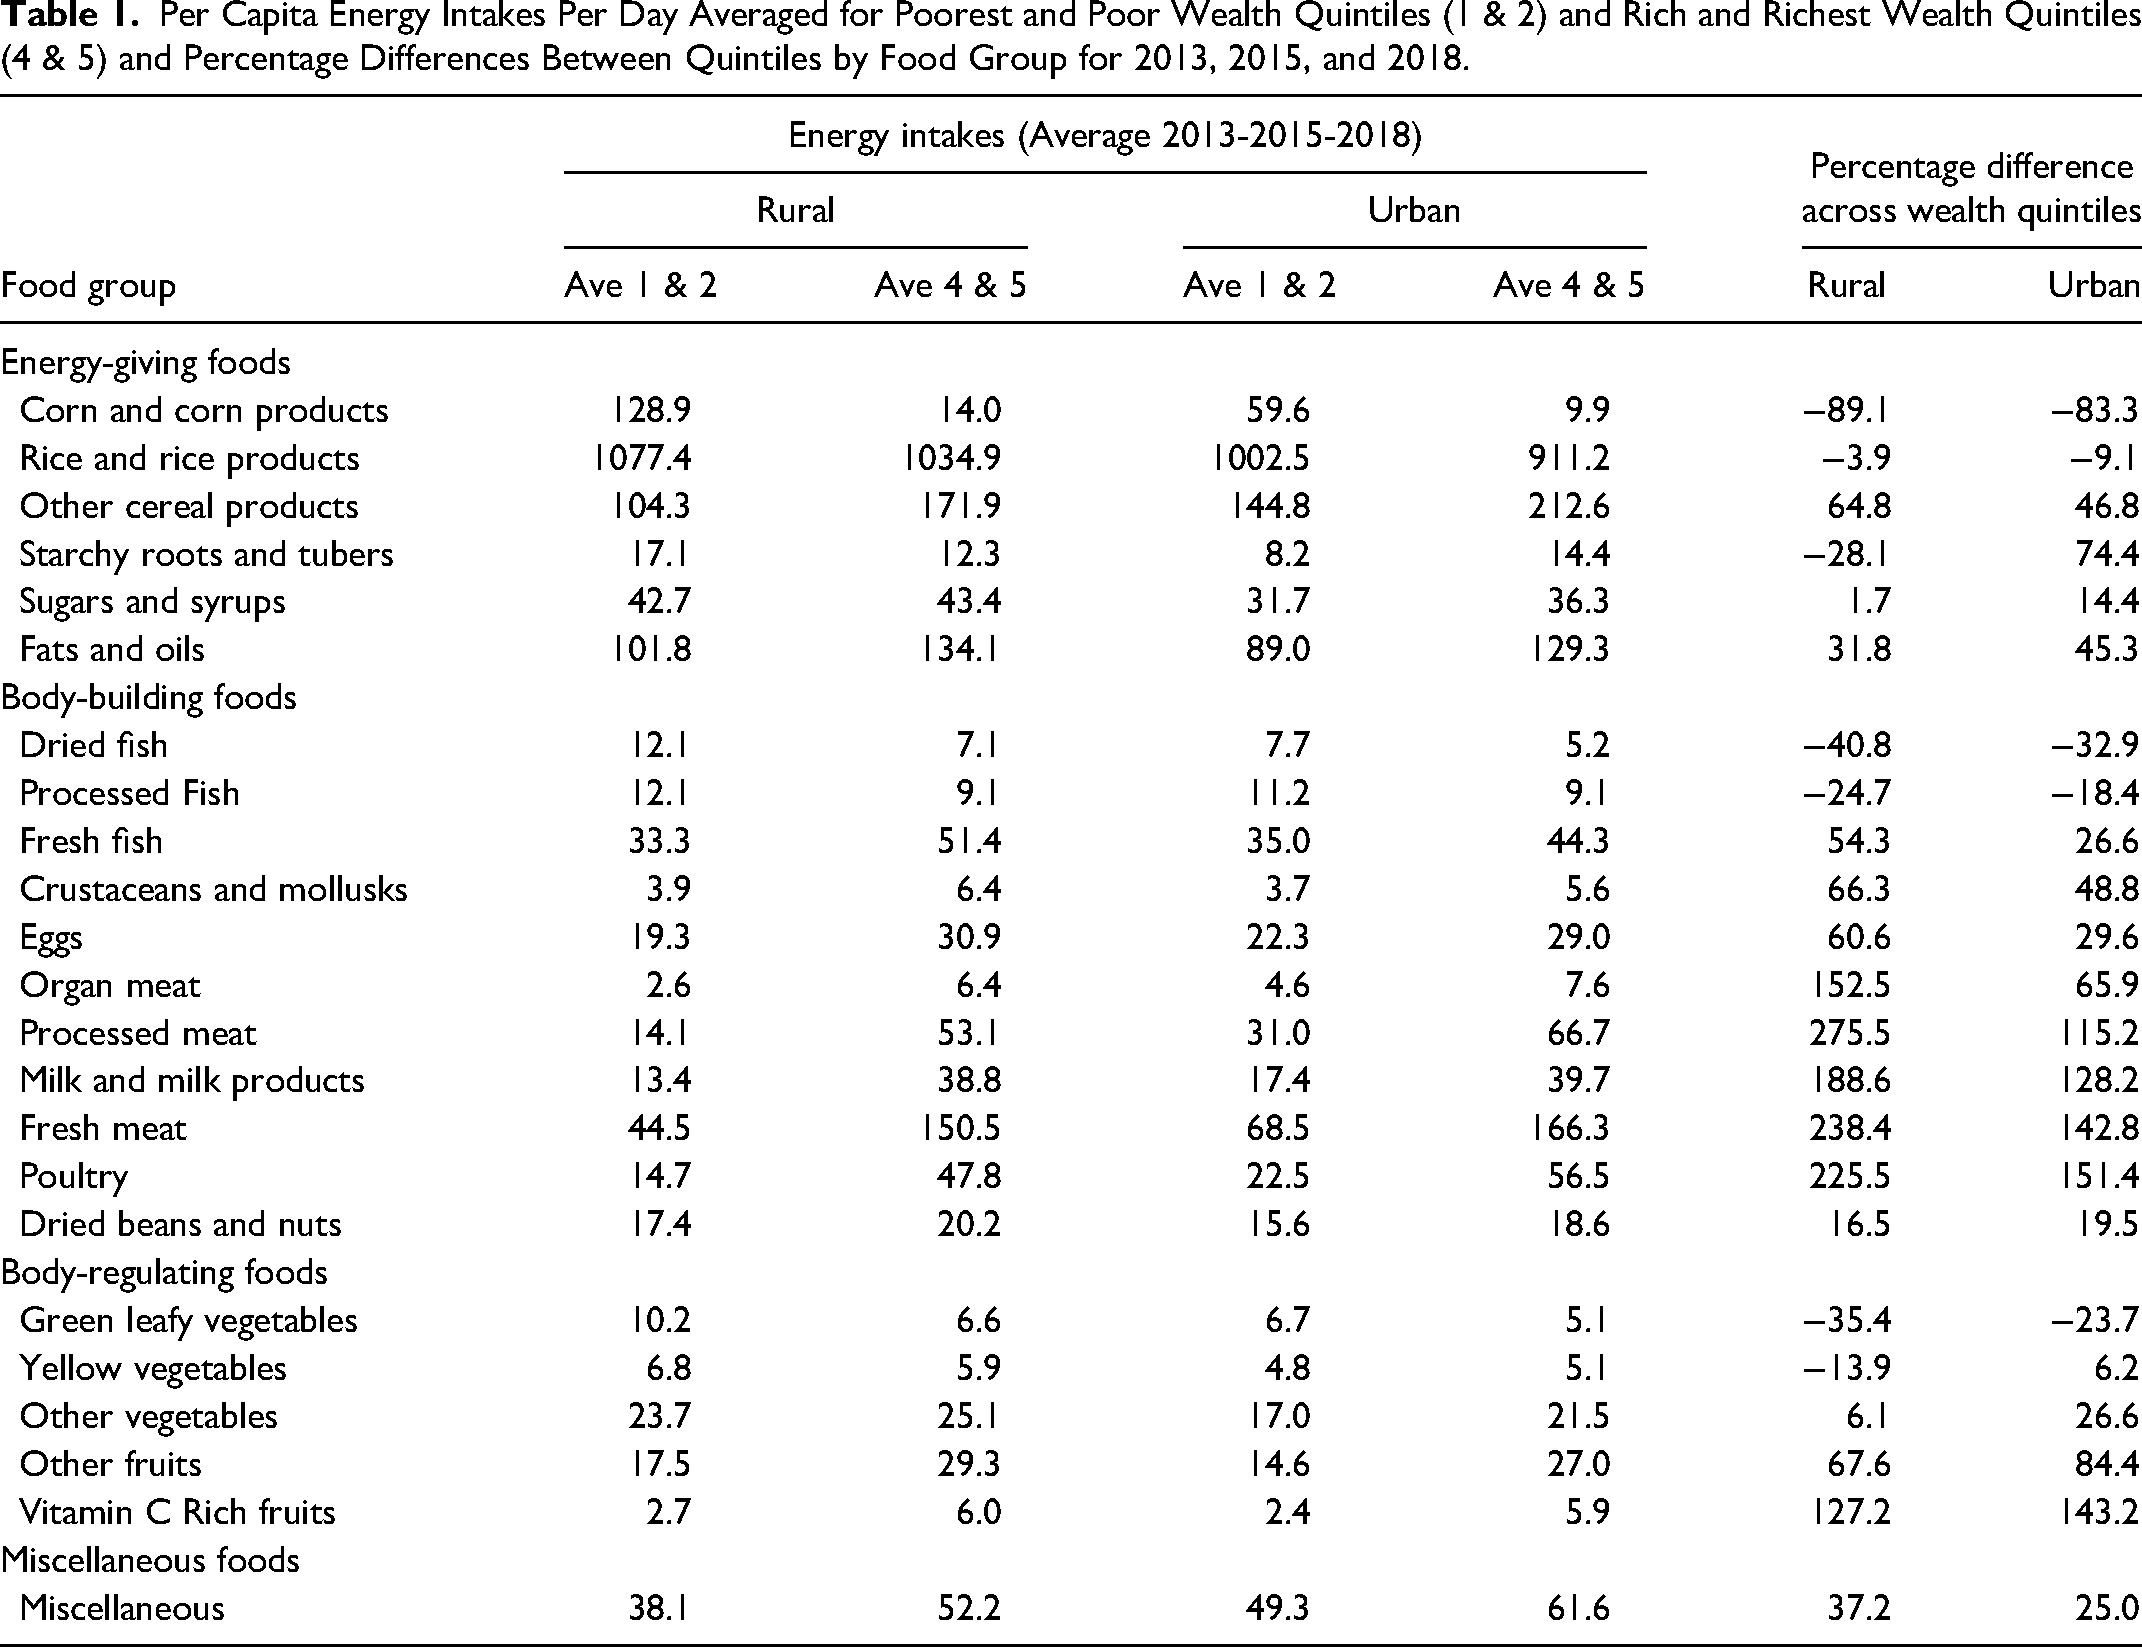
Per Capita Energy Intakes Per Day Averaged for Poorest and Poor Wealth Quintiles (1 & 2) and Rich and Richest Wealth Quintiles (4 & 5) and Percentage Differences Between Quintiles by Food Group for 2013, 2015, and 2018.
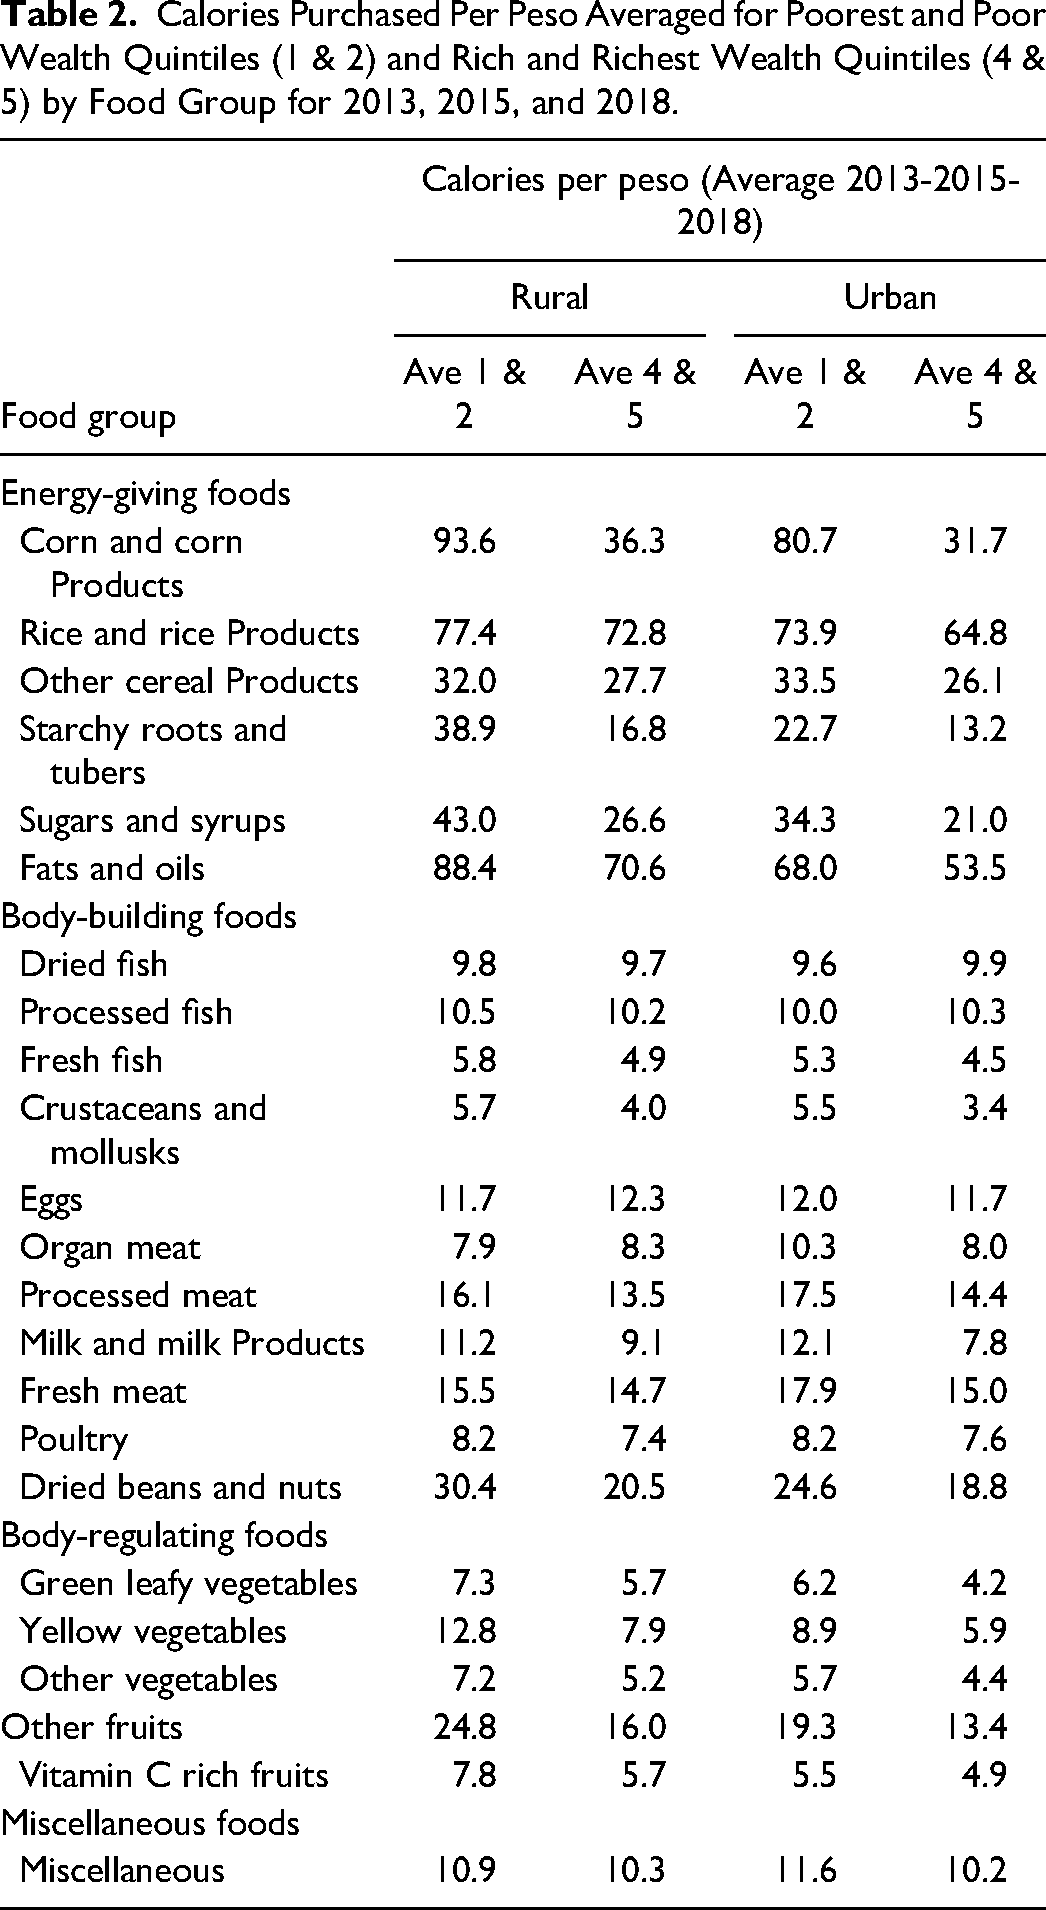
As shown in Table 2, rice is one of the least expensive sources of calories in the diet. Rice consumption does not vary by income group; rice is as plentiful in low-income households as in high-income households (this pattern for food staple consumption to remain constant with income was noted 30 years ago, for example in Bouis et al 9 ). Household members get their fill of rice to keep from going hungry, then increase fish and meat consumption to the extent that their household income allows. Are particular members of the household (distinguished by age and gender) favored who consume disproportionately higher shares of fish and meat (rich in bioavailable minerals and vitamins), while others may eat a disproportionate share of rice to keep from going hungry?
Calories Purchased Per Peso Averaged for Poorest and Poor Wealth Quintiles (1 & 2) and Rich and Richest Wealth Quintiles (4 & 5) by Food Group for 2013, 2015, and 2018.
The Food Share Over Energy Share Methodology
The FS/ES methodology examines the proportions of specific foods in each family member's diet calibrated by individual total energy intake. To take a hypothetical example, suppose that two children of similar age, height, weight, and activity patterns, had very different meal patterns (consuming only rice and meat), but with the same energy intake. The first child eats mostly rice while the second child eats some rice, far less rice, but with generous helpings of meat. Both have satiated hunger to the same degree because their energy intakes are the same, but the second child has much better dietary quality. Mineral and vitamin intakes of the second child are higher due to the density of minerals and vitamins in meat, and the second child's meals are far more expensive to purchase. It would be presumed in the Filipino culture that the second child is being favored as compared with the first child in this hypothetical example.
Formally, the FS/ES ratio is computed as follows: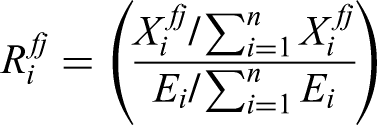
In the hypothetical example above, if the two children constitute the entire household, the denominator would be 50% for each child. The numerator for the second child (the meat share) would be above 50% and the FS/ES meat ratio would exceed one for the second child. Conversely, the FS/ES rice ratio for first child is greater than 1.0.
FS/ES ratios above 1.0 indicate that the individual is consuming a disproportionately high share of a particular food. The numerator could be a maximum of 100% divided by a denominator of the energy share of the individual in the total household diet. Individuals who are consuming a disproportionately low share of a particular food will have an FS/ES ratio that falls between zero and one. The range of possible FS/ES values is asymmetrical around 1.0.
In some sense, the denominator calibrates the FS/ES ratio for the energy requirements of the individual. A person who is older, therefore taller (up to a certain age), and is more active than another individual can be expected to consume more energy than a family member who is younger, therefore smaller. Again, the FS/ES ratio examines the proportions, not the absolute amounts. An implicit assumption is that hunger is satiated equally across household members. For any given individual, some consumption of a more expensive nonrice food can be converted to rice to satiate hunger, which is a primal desire (e.g., the first child in the hypothetical example above).
Use of the FS/ES Ratio for Nutrition Policy Analysis
The FS/ES ratio focuses on the first column in Figure 2. In general, families are not aware of the total nutrient intakes of their diets, nor their individual nutrient requirements in the second column, although parents have some information that animal products are important sources of protein, vegetables and fruits are good for nutrition and health, milk is important for children, and so forth. Information in the second column is largely invisible and does not drive family food choices.
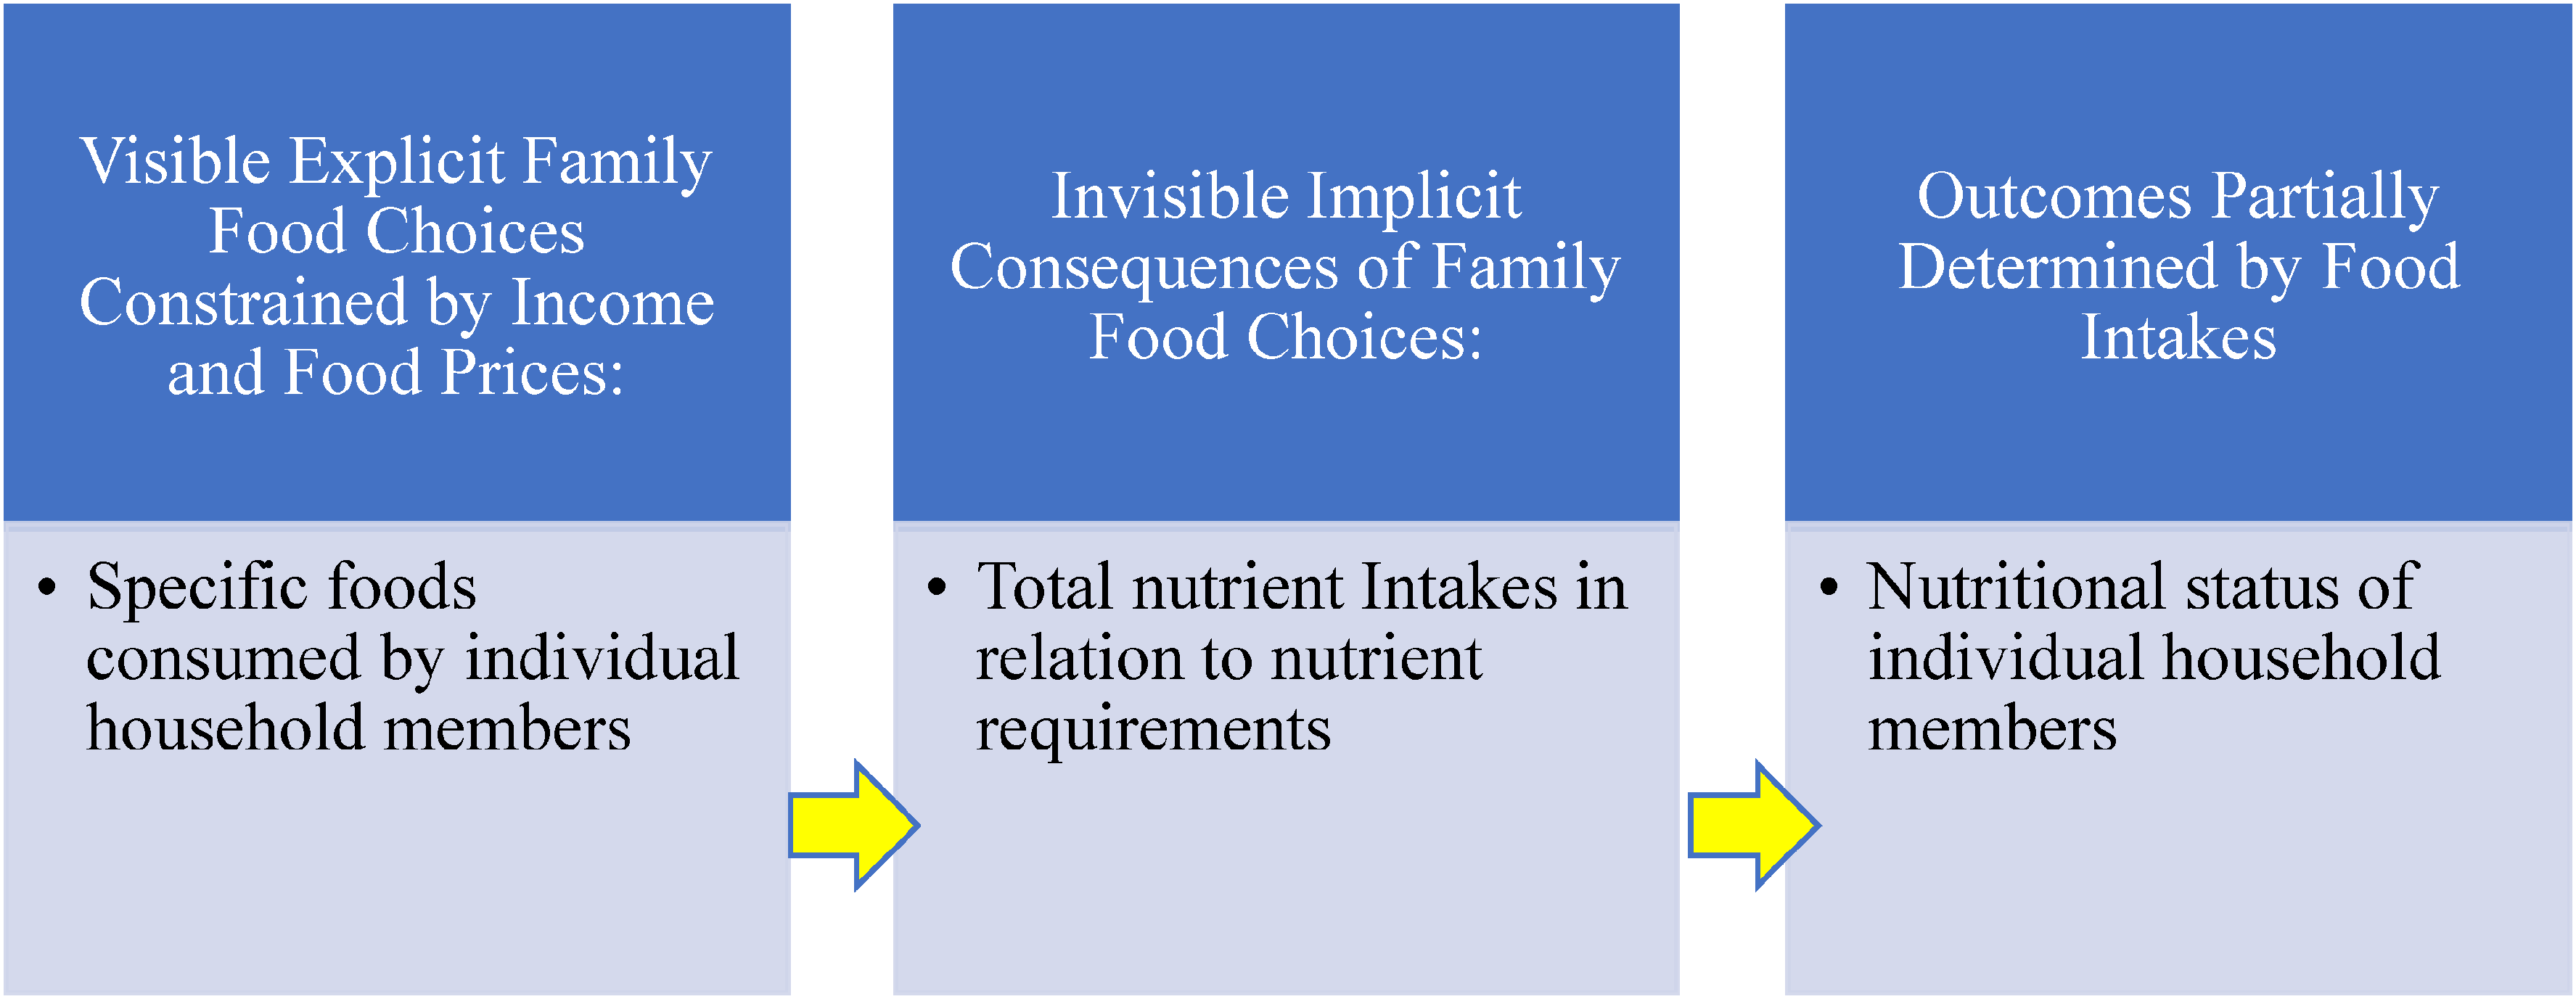
Use of the FS/ES ratio for nutrition policy analysis.
Using the FS/ES ratio (applied to information in the first column) provides insights on societal norms in terms of intrafamily food distribution of specific foods. As will be demonstrated in the data analysis below, in the case of the Philippines females and males consume about the same proportions of nutrient-dense foods, controlling for age. In terms of deriving policy conclusions—because starting with adolescence female nutrient requirements are higher than for males—the policy focus would be to inform the population that actually females should be eating better quality diets than males—females should be relatively favored. Perhaps there are particular nutritious nonstaple foods that could be emphasized for women in this regard.
Measures of intrahousehold distribution of food that include nutrient requirements in their algorithms might well indicate that older females (from adolescence onward) in the Philippines are being discriminated against in the intrahousehold distribution of food. Such messaging would not ring true with the Philippine public. Rather the problem is the invisibility of the information in the second column in Figure 2.
In countries other than the Philippines (see qualitative evidence for Bangladesh cited above), it may well be that females are consuming significantly less animal products than males. The societal norm may be that males should eat better than females because they are the family “breadwinners.” This gives a different policy focus—a two-step process, as it were, compared to the Philippines—first at minimum that women need to eat as well as men (as in the Philippines), and second in fact that women require better dietary quality than men. The FS/ES methodology gives insight into the explicit behavioral pathways through which societal norms are driving unfavorable nutrition outcomes.
Application of the FS/ES Methodology to the Philippine Data
Data Source
This study analyzed the individual food consumption data from the Dietary Survey component of the 2013 National Nutrition Survey (NNS) conducted by DOST-FNRI from June 19, 2013 to April 15, 2014. The 2013 NNS adopted the 2003 Master Sample (MS) developed by the Philippine Statistics Authority (PSA). The survey employed a stratified three-stage sampling design to select sample households from 17 regions and 80 provinces in the Philippines. The Dietary Survey utilized only one (1) of the four (4) replicates of the 2003 MS. Further details on the survey and its sampling design are published elsewhere. 10
The Dietary Survey gathered food consumption data at the household and individual levels. Of the 10 094 eligible households, 8592 (85.1%) households participated in the Dietary Survey. At the individual level, 19 831 (96.1%) out of 20 636 eligible household members were covered.
The Dietary Survey was the only component of the 2013 NNS which used the paper and pen method. The dietary forms were pre-edited in the field by registered nutritionist dietitians. Several rounds of alternating manual and machine validations were likewise done to check for errors and ensure consistency until data was completely cleaned and validated.
Individual Food Consumption
A 2-day, nonconsecutive 24h food recall was conducted to estimate individuals' food intake. Data were collected from all sampled households through face-to-face interviews. Participants were asked about all foods consumed from the time they woke up until bedtime, including morning, afternoon, and late PM snacks. The food items consumed were recorded, including details such as cooking methods and brand names. The mean of the two nonconsecutive days of food recall was calculated and analyzed.
The Food Composition Library, Visuals of Foods, and List of Alternates and Substitutes were utilized to identify the specific foods consumed. The weights of foods consumed in the Individual Food Consumption (IFC) were converted to purchased values, and the energy and nutrient content of foods consumed were assessed using the Individual Dietary Evaluation System (IDES). Further details on the IFC Survey are available in separate publications. 10
Ethics Approval
The 2013 NNS was reviewed and approved by the DOST-FNRI Institutional Ethics Review Committee (FIERC) under Protocol Code FIERC-2012-001 on February 19, 2013. Oral and written consent was obtained from the surveyed households prior to the actual data collection.
Sample Size and Computation of FS/ES Ratios
Out of the 19 831 individual-level intake observations residing in 4533 households, 367, or 8% of the total households, were single-member households and thus were excluded from the analysis. The mean individual intake and standard deviation were computed for each food and population group. Individual intakes for specific foods that exceeded the 99th percentile were considered outliers, assuming a non-normal distribution. Individuals associated with these outlier observations (830 individuals) were removed from the analysis. After the exclusion of outliers from the dataset, 82 households became single-member households, which were further excluded from the analysis, resulting in a total of 4072 households with 18 552 individuals. And 548 multimember households included in the analysis had individuals who were dropped due to outlier intakes. While this exclusion possibly introduces some small bias by not including the excluded person's intakes in the calculation of the FS/ES ratios (total household calories and total household consumption of each food), there was minimal difference in the mean values or in the tests of statistical significance presented in the tables below compared to those generated where the outlier observations are included.
Calories consumed through breastmilk for the 0-24 months breastfeeding group are not observed and treated as zero in the calculations. If breastmilk accounts for (say) 50% of their calorie intake, then the ratios shown for all food groups would be multiplied by 0.5; in this example, the numerator of the denominator of ES for infants would be doubled in the FS/ES ratio for these infants. This bias should be taken into consideration in interpreting the FS/ES values for breastfeeding infants. Adding infant calorie intakes through breastmilk would also affect the computation of the total calorie intake of the entire household (the denominator in the ES computation), but this would result in relatively minor adjustments of the FS/ES ratios for the remaining household members. Breastfeeding infants account for 1.3% of the total observations and calorie intake from breastmilk is low compared to the total calorie intakes of other family members.
FS/ES ratios were computed for each individual in each household in the dataset. Simple averages are shown in Tables 3-8 for the various age-gender and food groups shown. 1
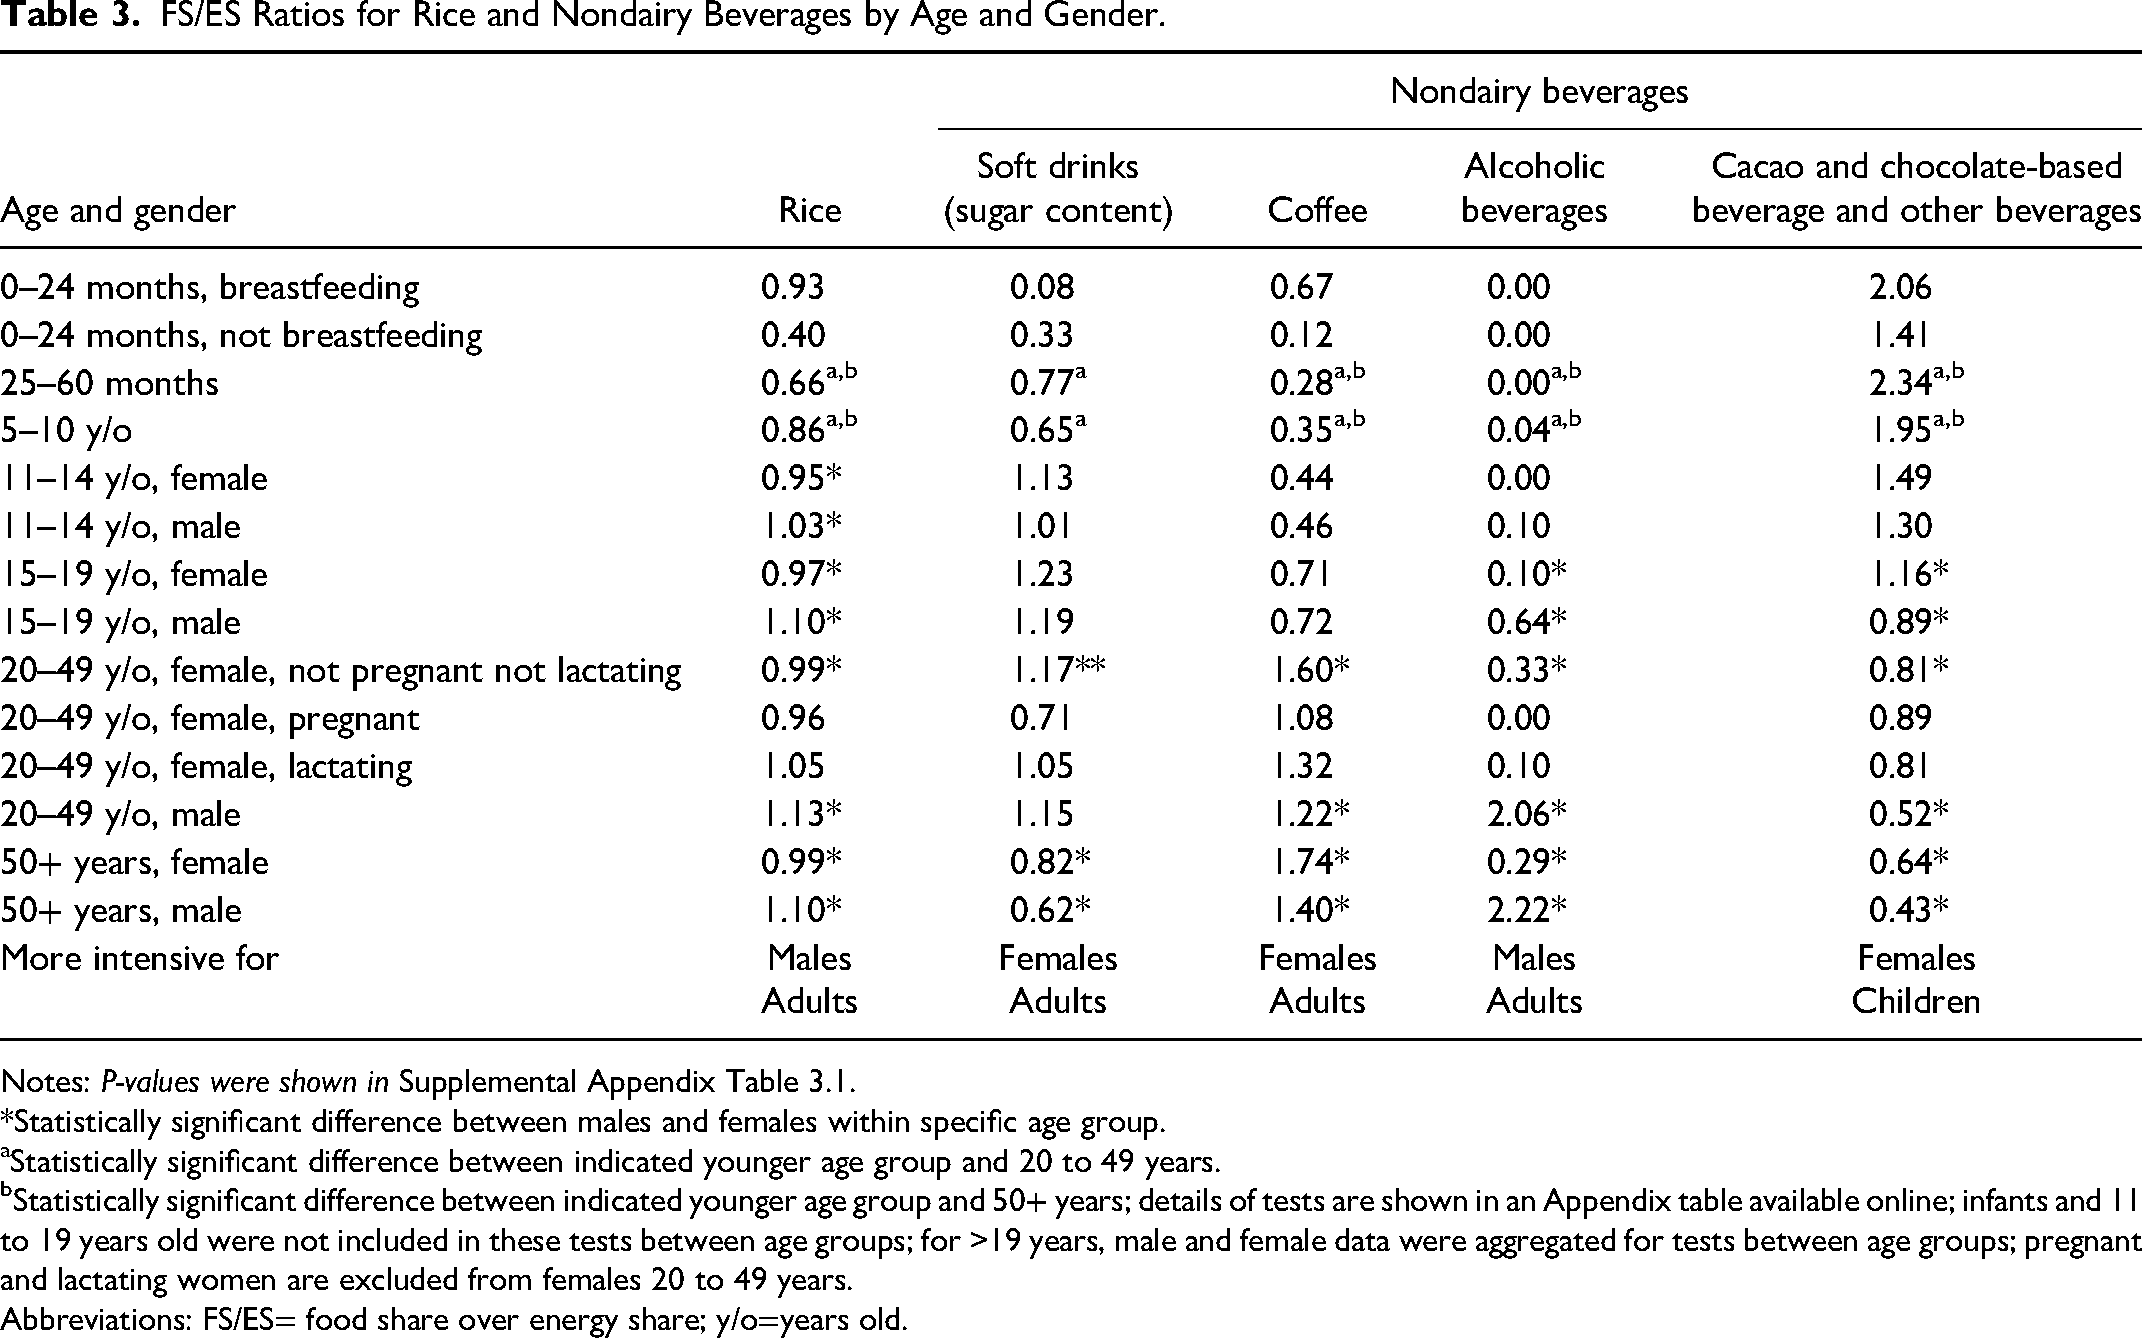
FS/ES Ratios for Rice and Nondairy Beverages by Age and Gender.
Notes: P-values were shown in Supplemental Appendix Table 3.1.
Statistically significant difference between males and females within specific age group.
Statistically significant difference between indicated younger age group and 20 to 49 years.
Statistically significant difference between indicated younger age group and 50+ years; details of tests are shown in an Appendix table available online; infants and 11 to 19 years old were not included in these tests between age groups; for >19 years, male and female data were aggregated for tests between age groups; pregnant and lactating women are excluded from females 20 to 49 years.
Abbreviations: FS/ES= food share over energy share; y/o=years old.
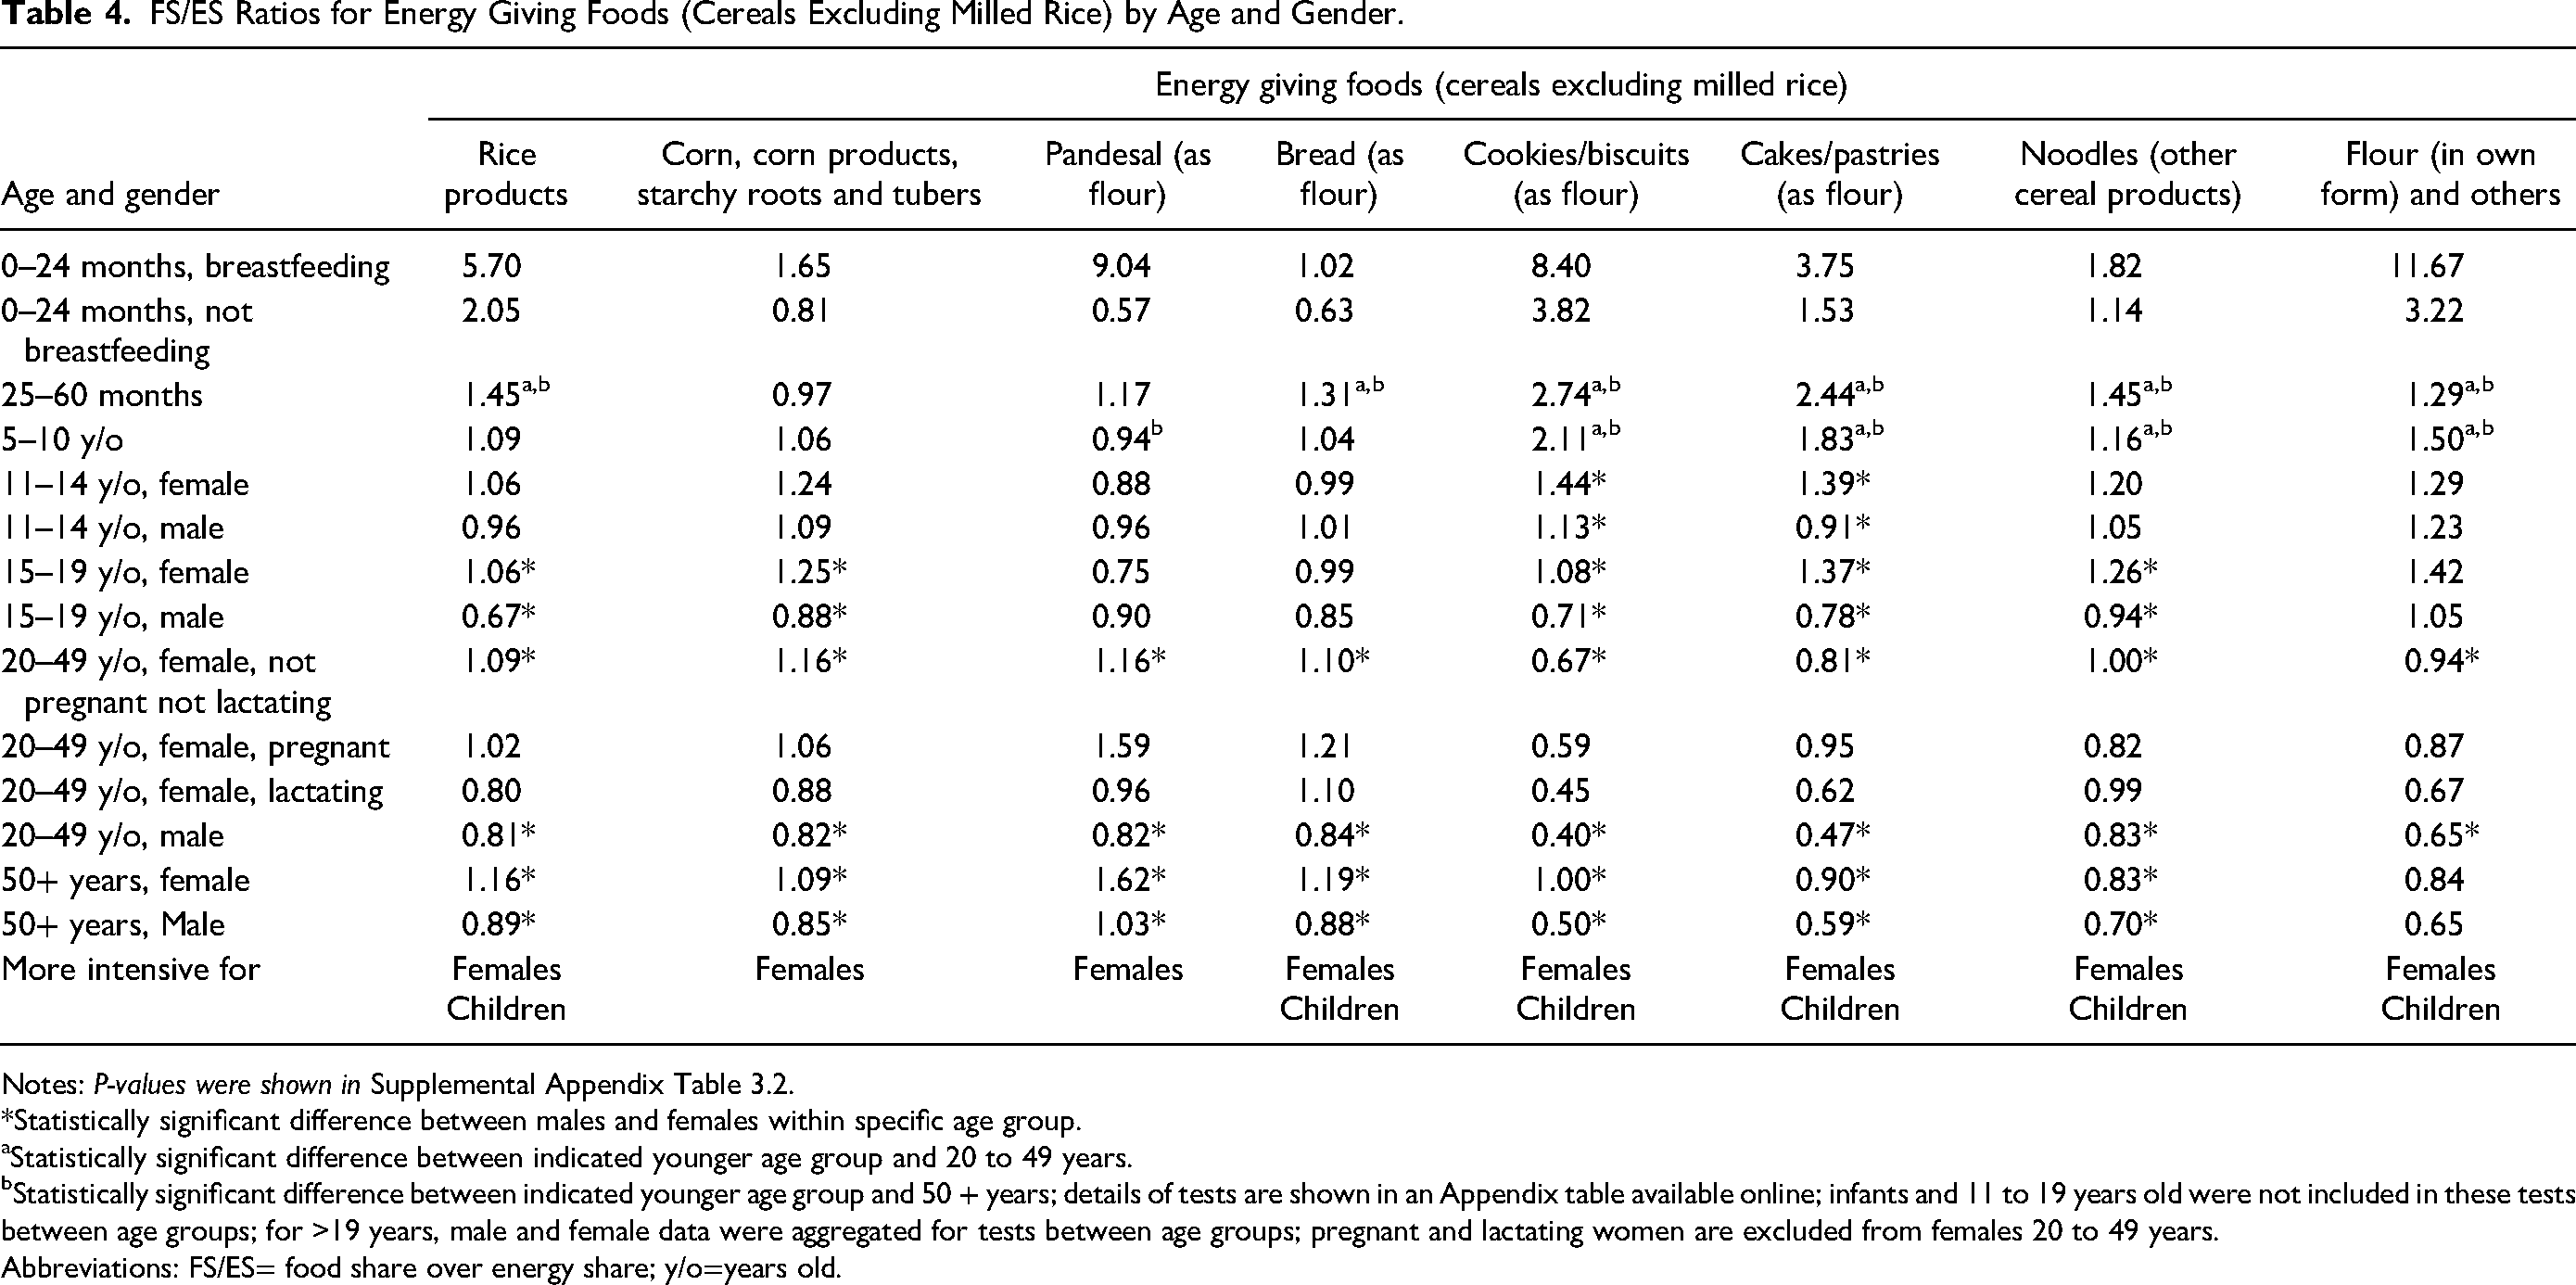
FS/ES Ratios for Energy Giving Foods (Cereals Excluding Milled Rice) by Age and Gender.
Notes: P-values were shown in Supplemental Appendix Table 3.2.
Statistically significant difference between males and females within specific age group.
Statistically significant difference between indicated younger age group and 20 to 49 years.
Statistically significant difference between indicated younger age group and 50 + years; details of tests are shown in an Appendix table available online; infants and 11 to 19 years old were not included in these tests between age groups; for >19 years, male and female data were aggregated for tests between age groups; pregnant and lactating women are excluded from females 20 to 49 years.
Abbreviations: FS/ES= food share over energy share; y/o=years old.
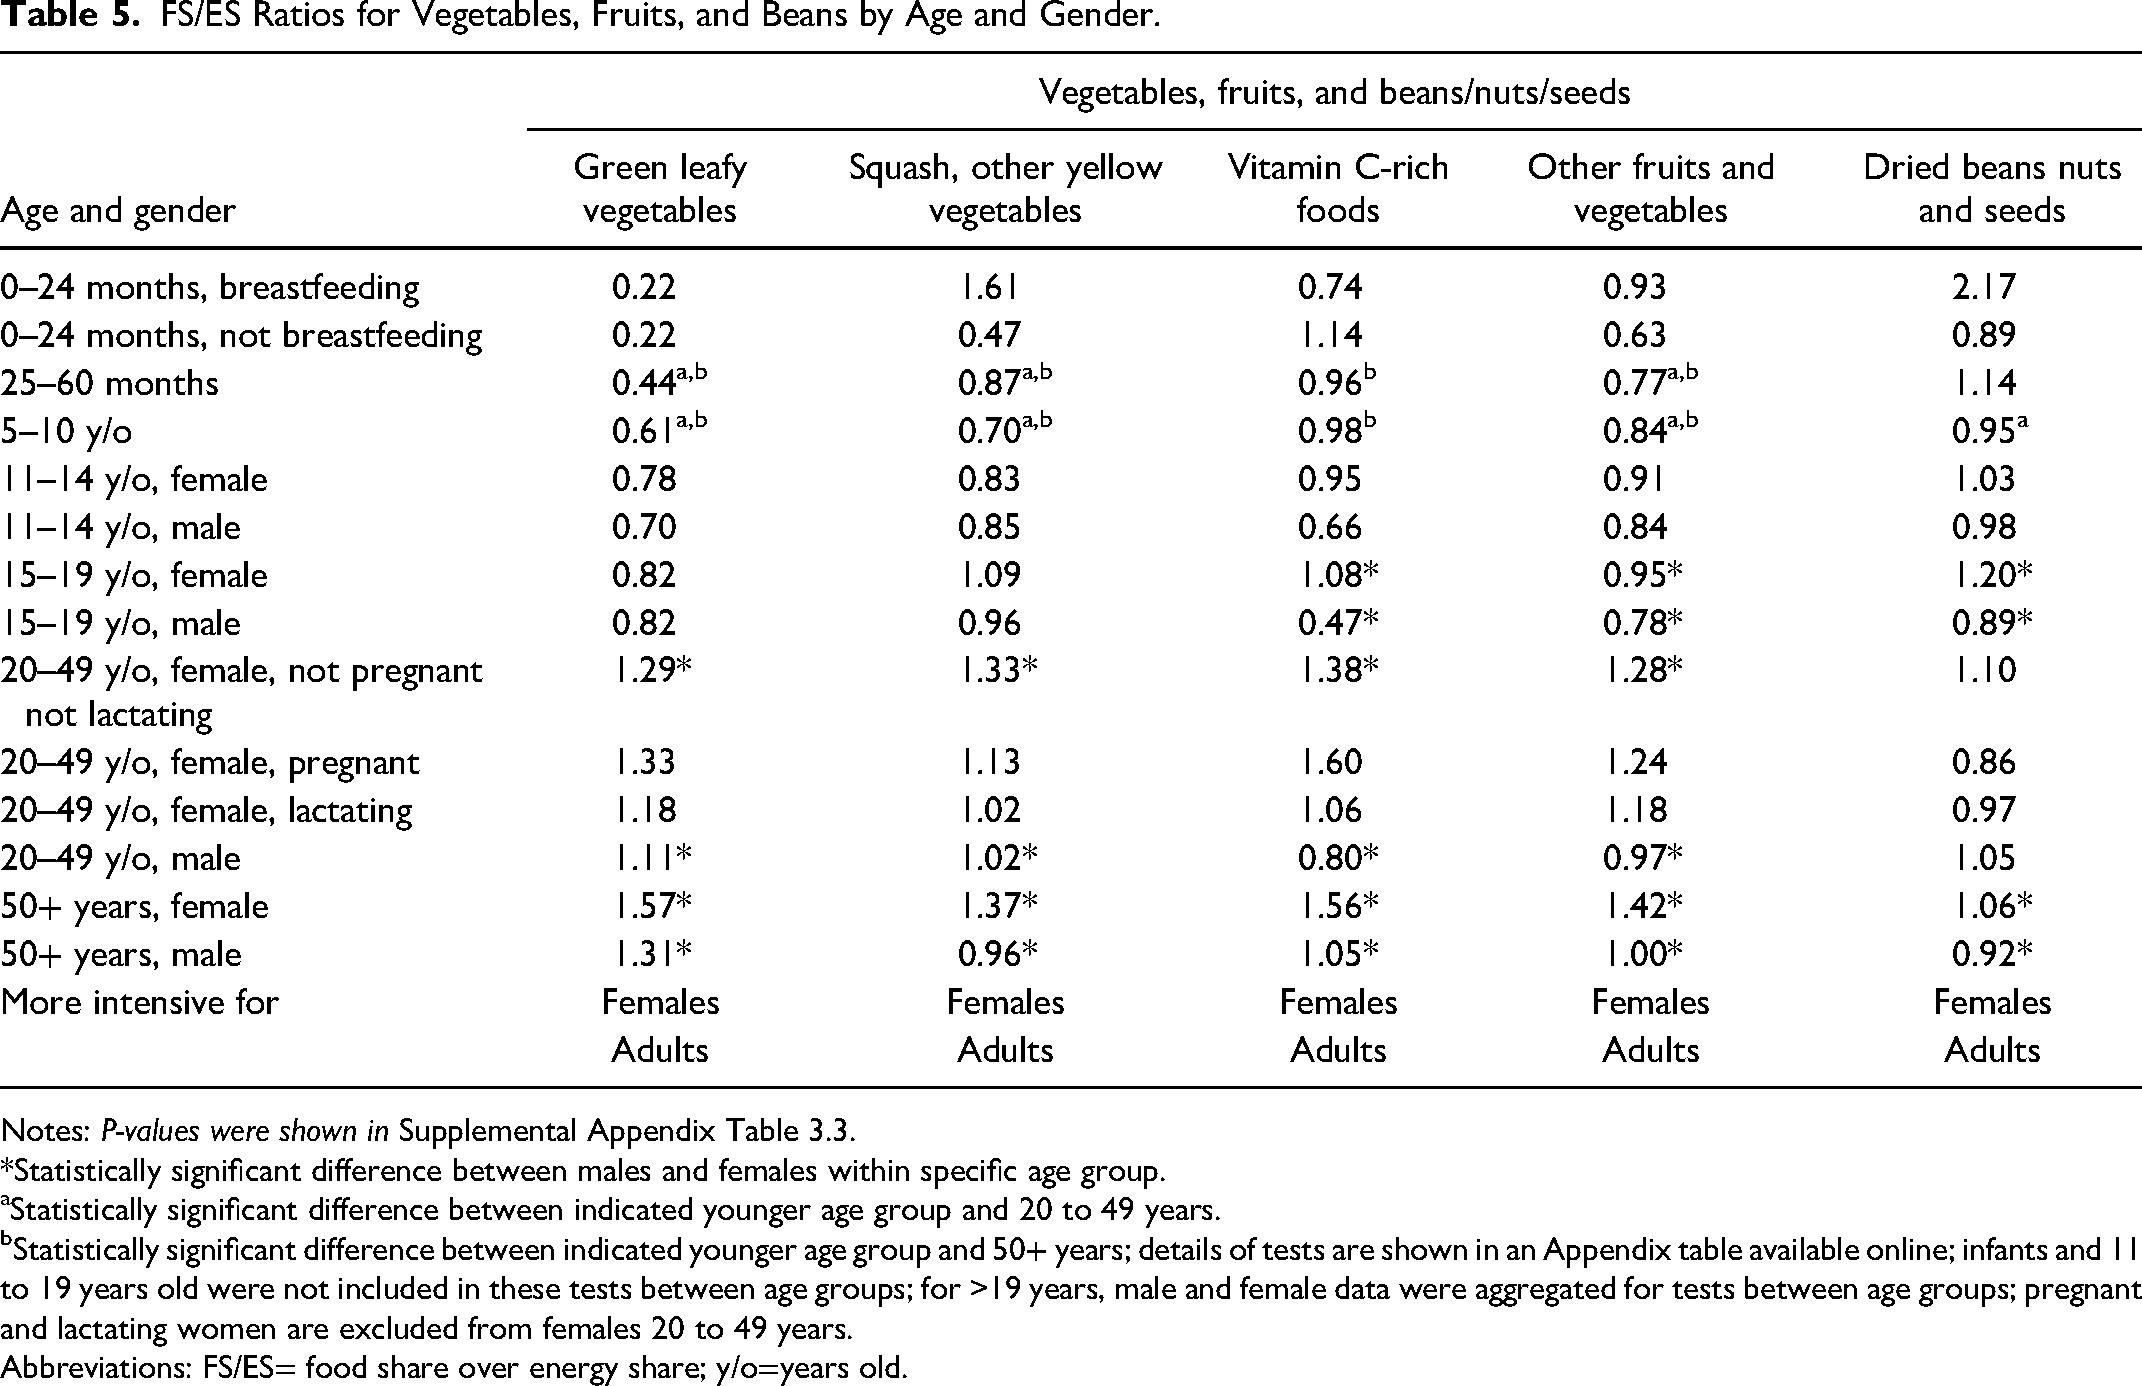
FS/ES Ratios for Vegetables, Fruits, and Beans by Age and Gender.
Notes: P-values were shown in Supplemental Appendix Table 3.3.
Statistically significant difference between males and females within specific age group.
Statistically significant difference between indicated younger age group and 20 to 49 years.
Statistically significant difference between indicated younger age group and 50+ years; details of tests are shown in an Appendix table available online; infants and 11 to 19 years old were not included in these tests between age groups; for >19 years, male and female data were aggregated for tests between age groups; pregnant and lactating women are excluded from females 20 to 49 years.
Abbreviations: FS/ES= food share over energy share; y/o=years old.
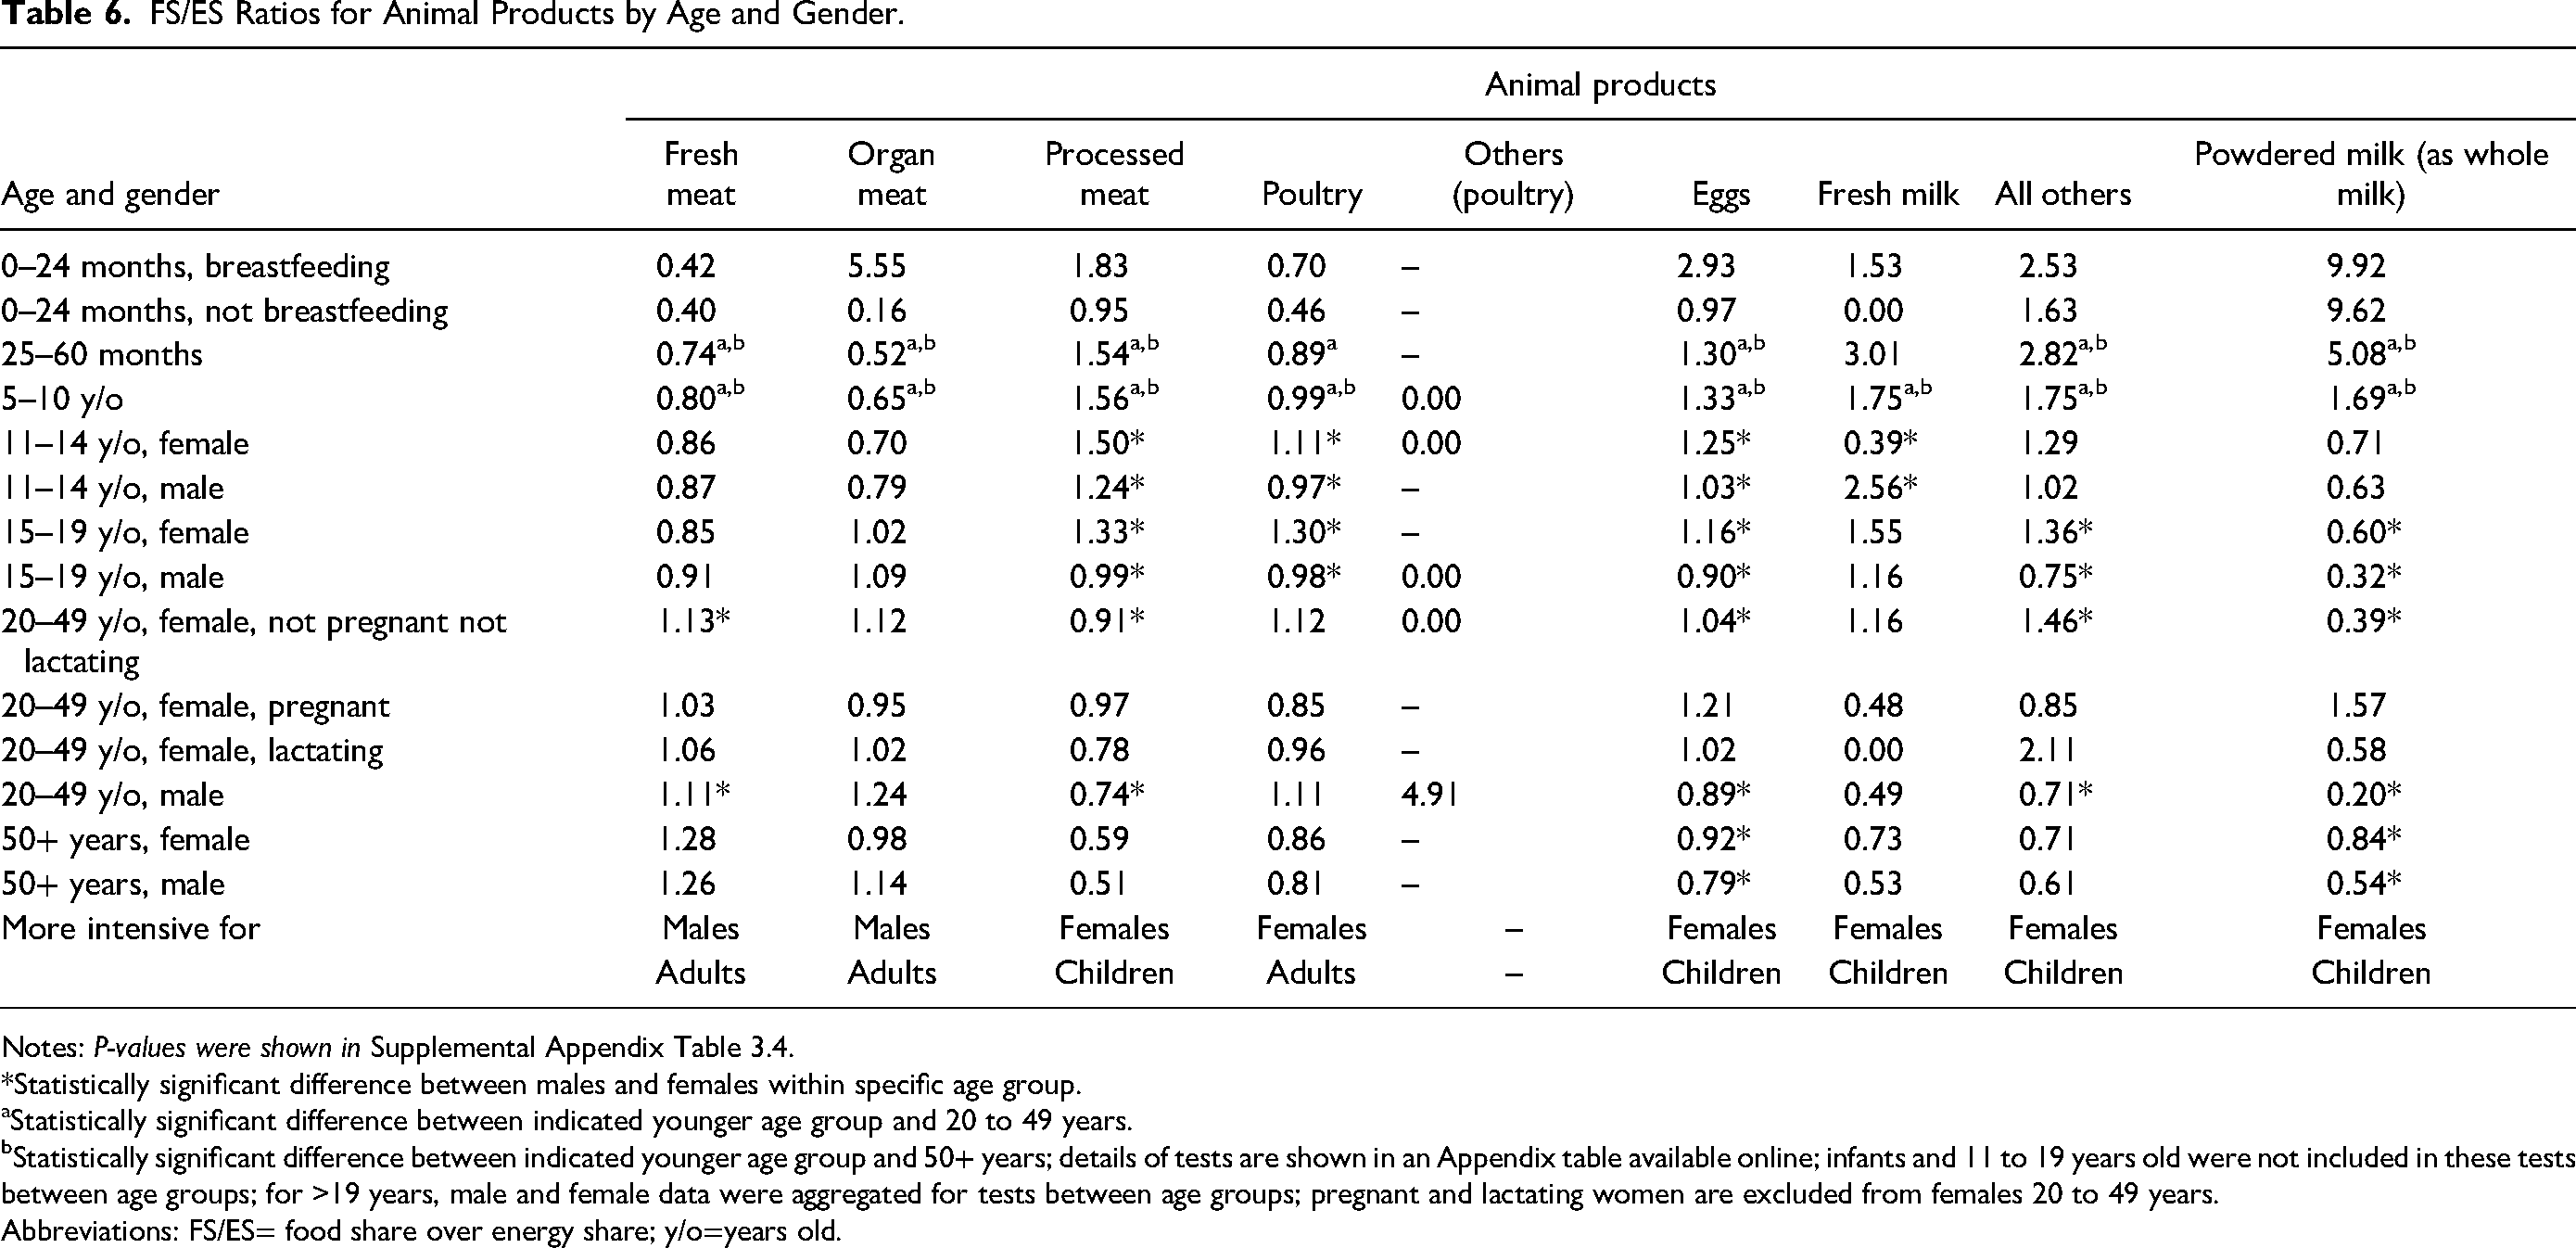
FS/ES Ratios for Animal Products by Age and Gender.
Notes: P-values were shown in Supplemental Appendix Table 3.4.
Statistically significant difference between males and females within specific age group.
Statistically significant difference between indicated younger age group and 20 to 49 years.
Statistically significant difference between indicated younger age group and 50+ years; details of tests are shown in an Appendix table available online; infants and 11 to 19 years old were not included in these tests between age groups; for >19 years, male and female data were aggregated for tests between age groups; pregnant and lactating women are excluded from females 20 to 49 years.
Abbreviations: FS/ES= food share over energy share; y/o=years old.
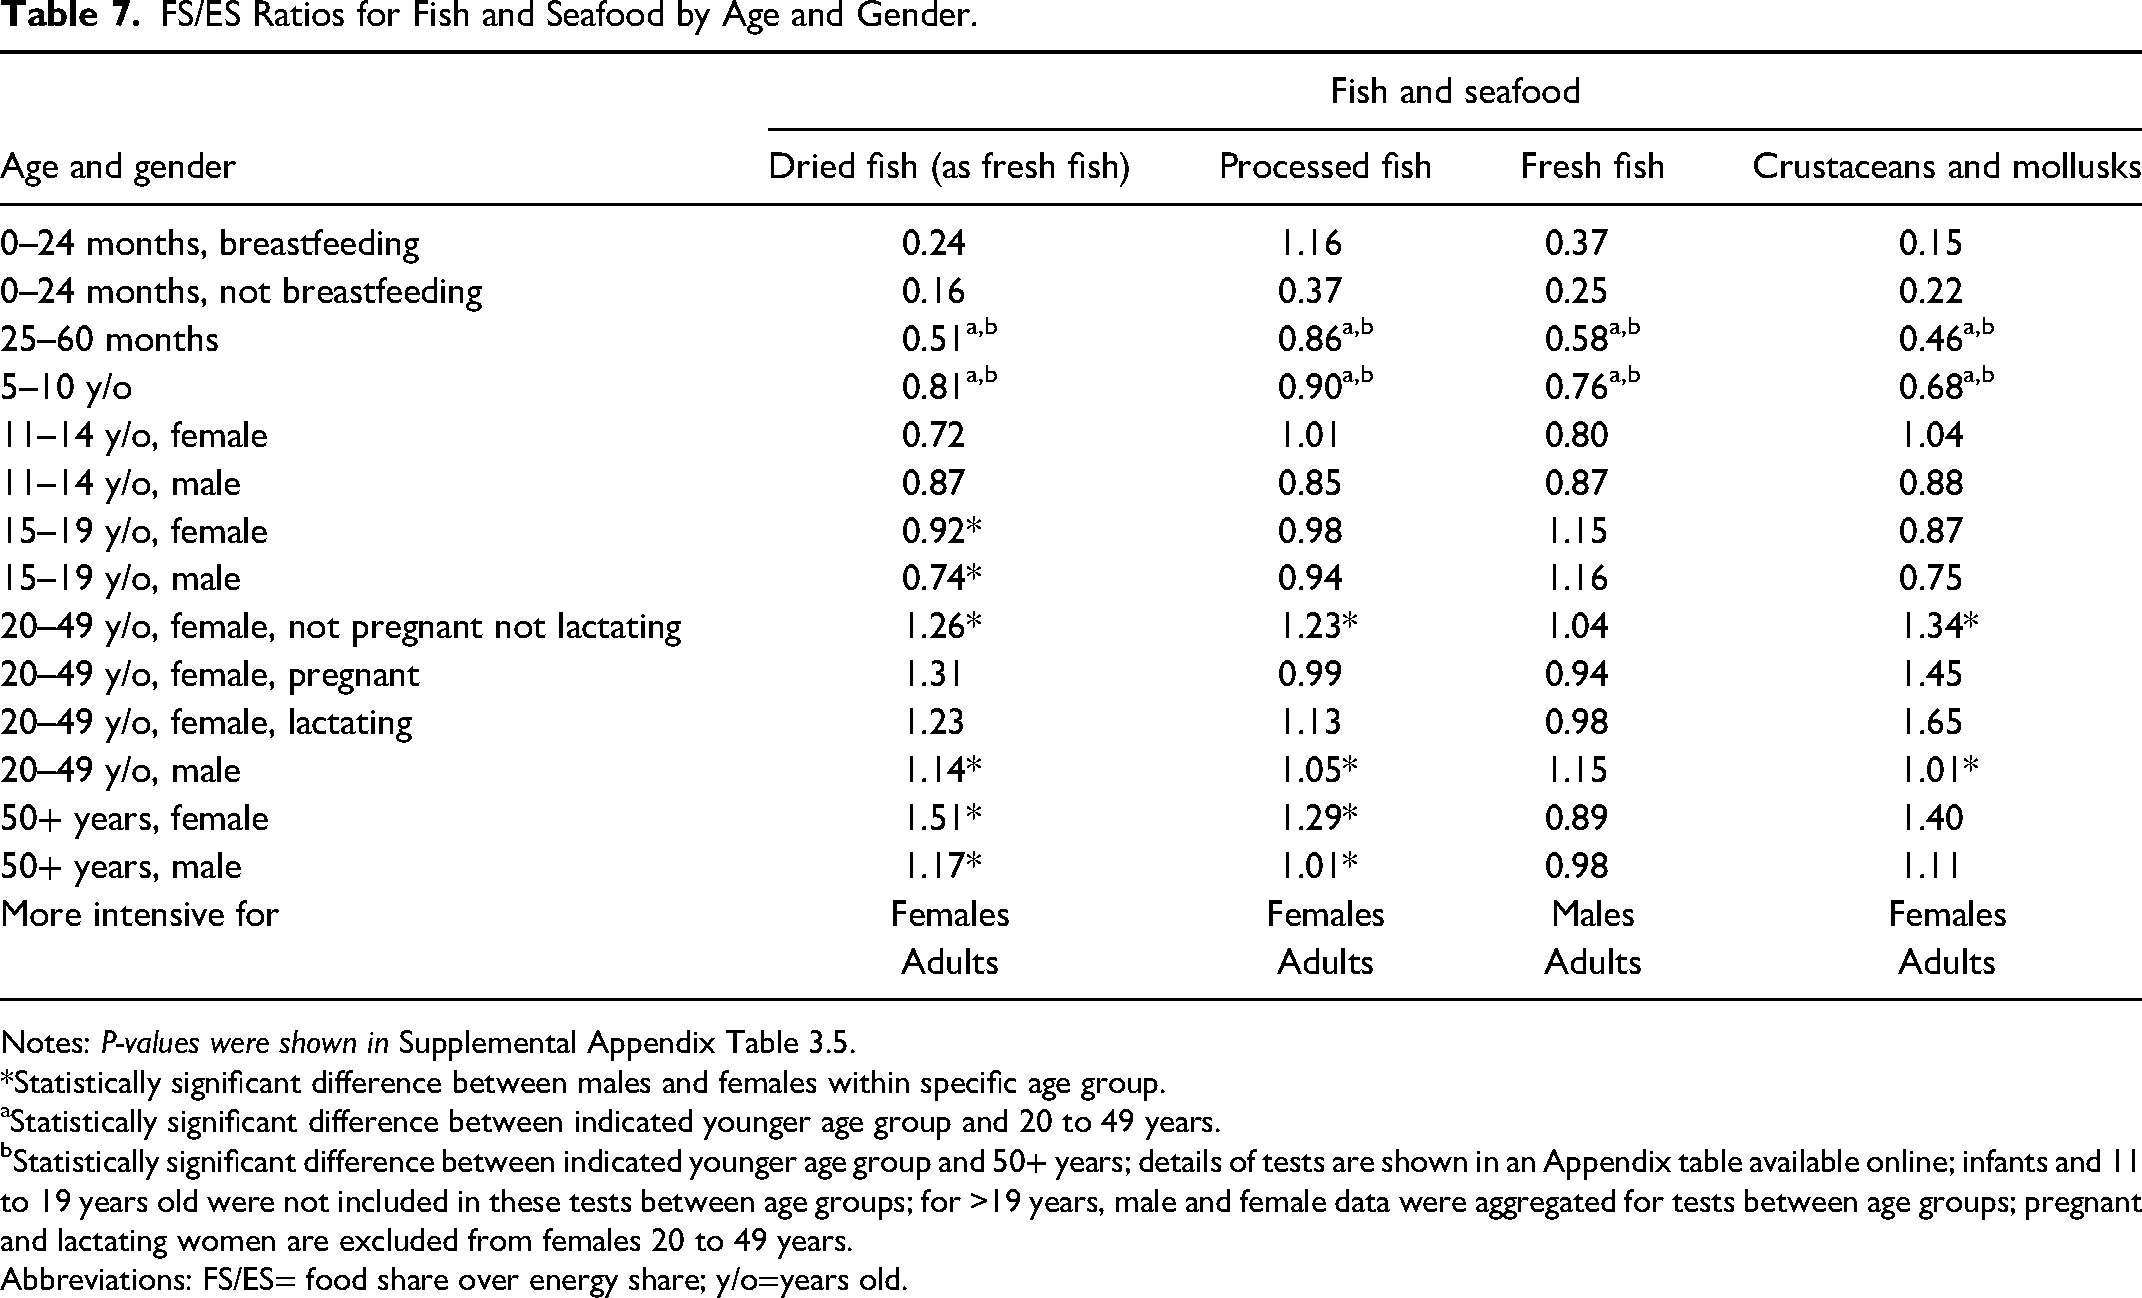
FS/ES Ratios for Fish and Seafood by Age and Gender.
Notes: P-values were shown in Supplemental Appendix Table 3.5.
Statistically significant difference between males and females within specific age group.
Statistically significant difference between indicated younger age group and 20 to 49 years.
Statistically significant difference between indicated younger age group and 50+ years; details of tests are shown in an Appendix table available online; infants and 11 to 19 years old were not included in these tests between age groups; for >19 years, male and female data were aggregated for tests between age groups; pregnant and lactating women are excluded from females 20 to 49 years.
Abbreviations: FS/ES= food share over energy share; y/o=years old.
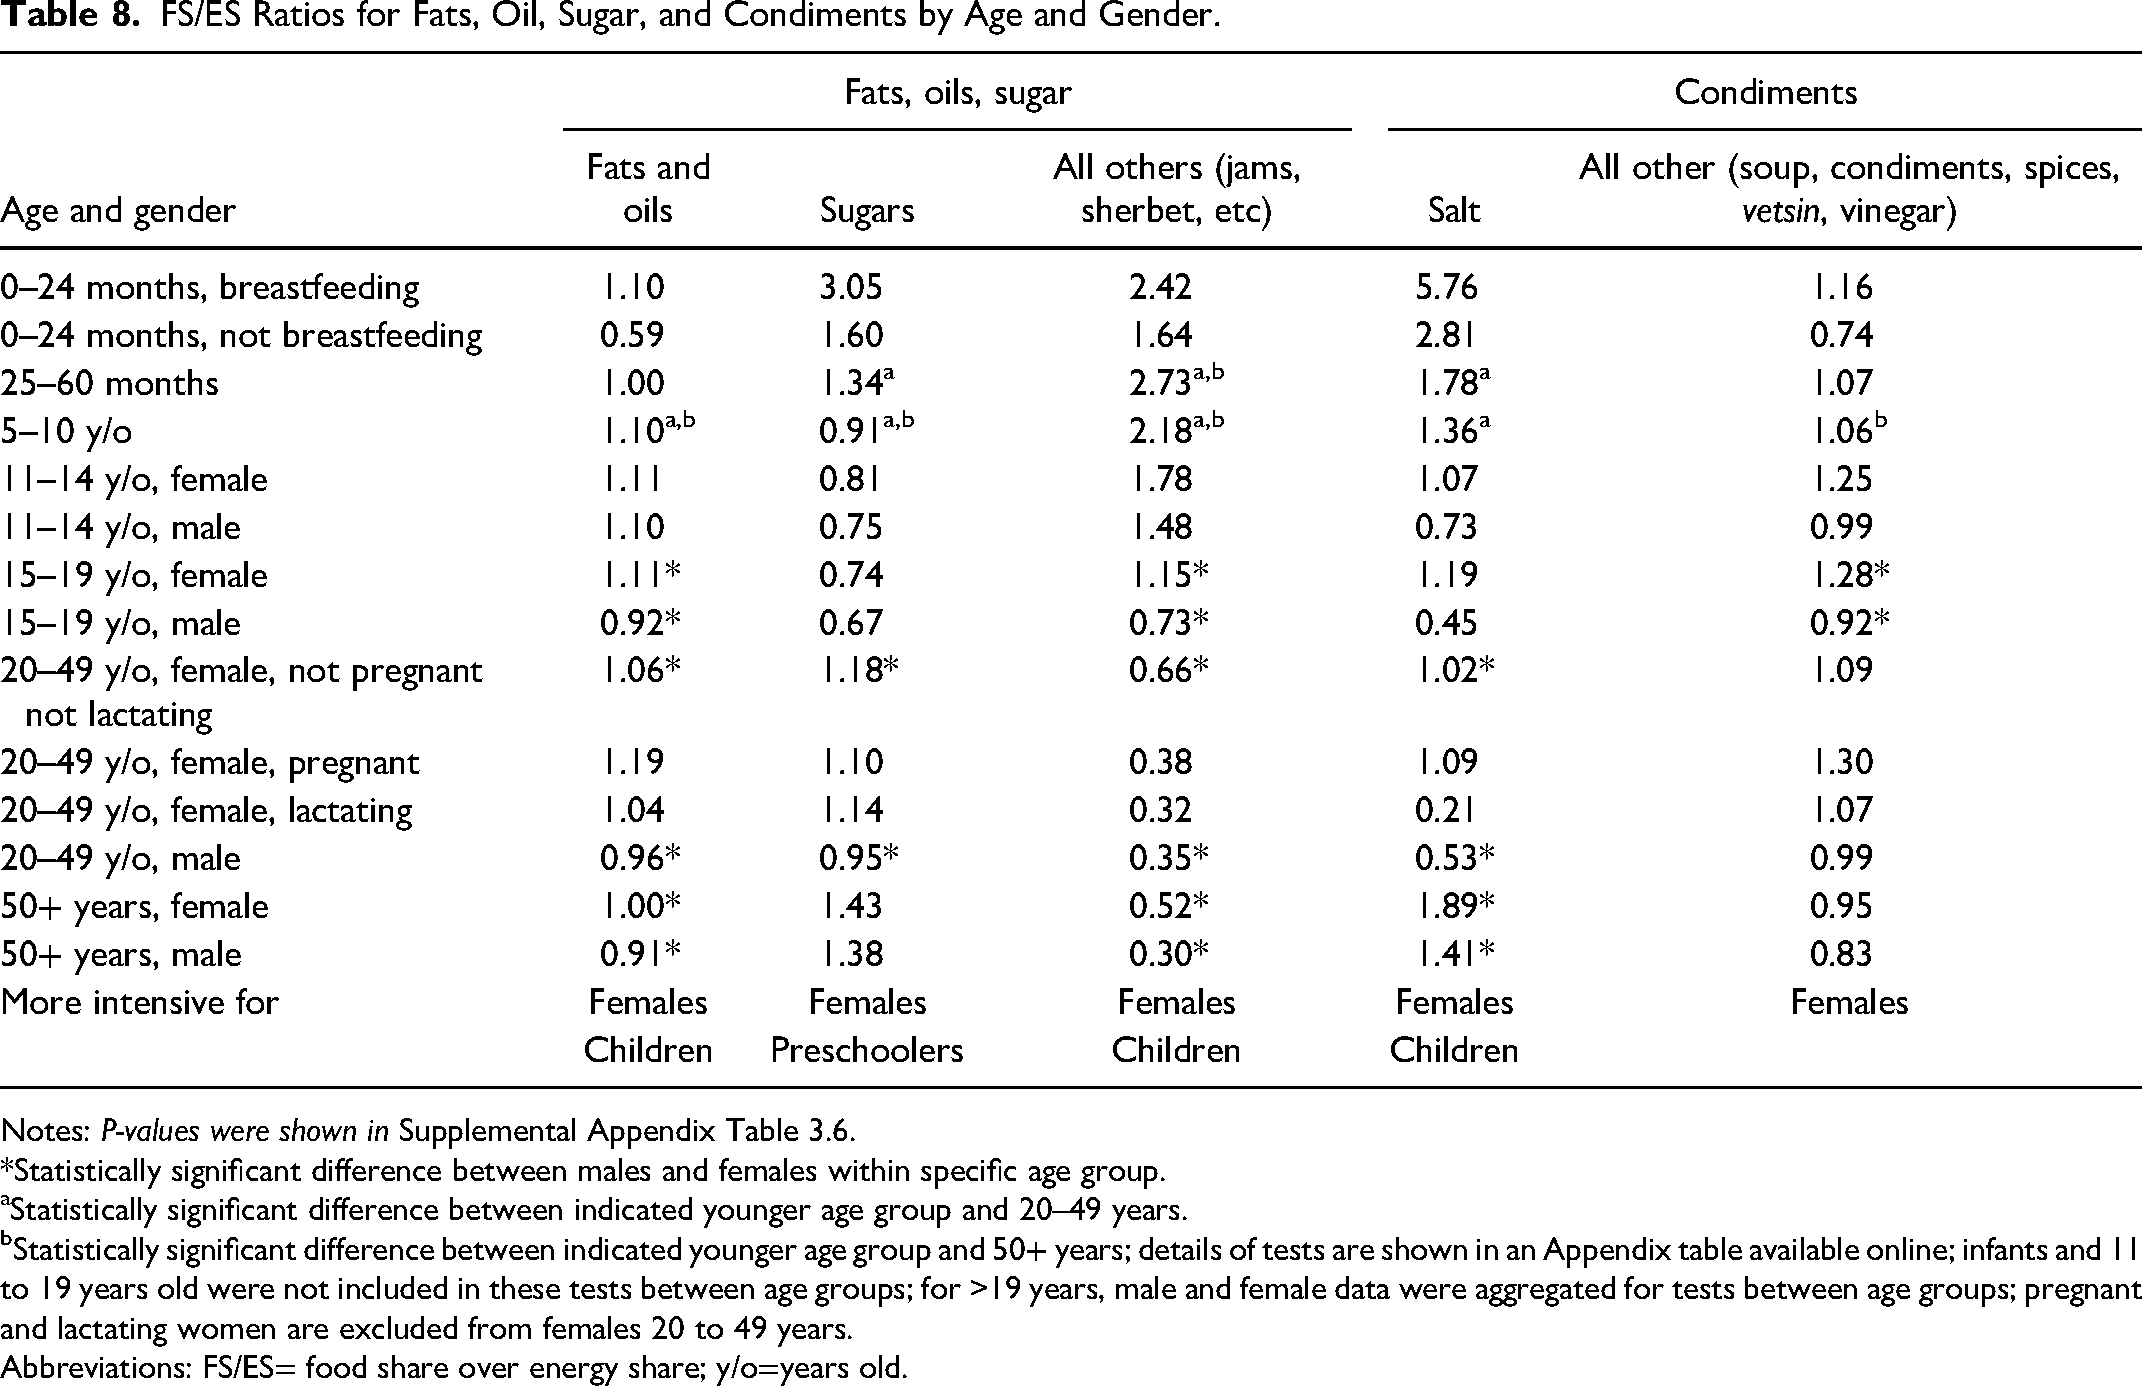
FS/ES Ratios for Fats, Oil, Sugar, and Condiments by Age and Gender.
Notes: P-values were shown in Supplemental Appendix Table 3.6.
Statistically significant difference between males and females within specific age group.
Statistically significant difference between indicated younger age group and 20–49 years.
Statistically significant difference between indicated younger age group and 50+ years; details of tests are shown in an Appendix table available online; infants and 11 to 19 years old were not included in these tests between age groups; for >19 years, male and female data were aggregated for tests between age groups; pregnant and lactating women are excluded from females 20 to 49 years.
Abbreviations: FS/ES= food share over energy share; y/o=years old.
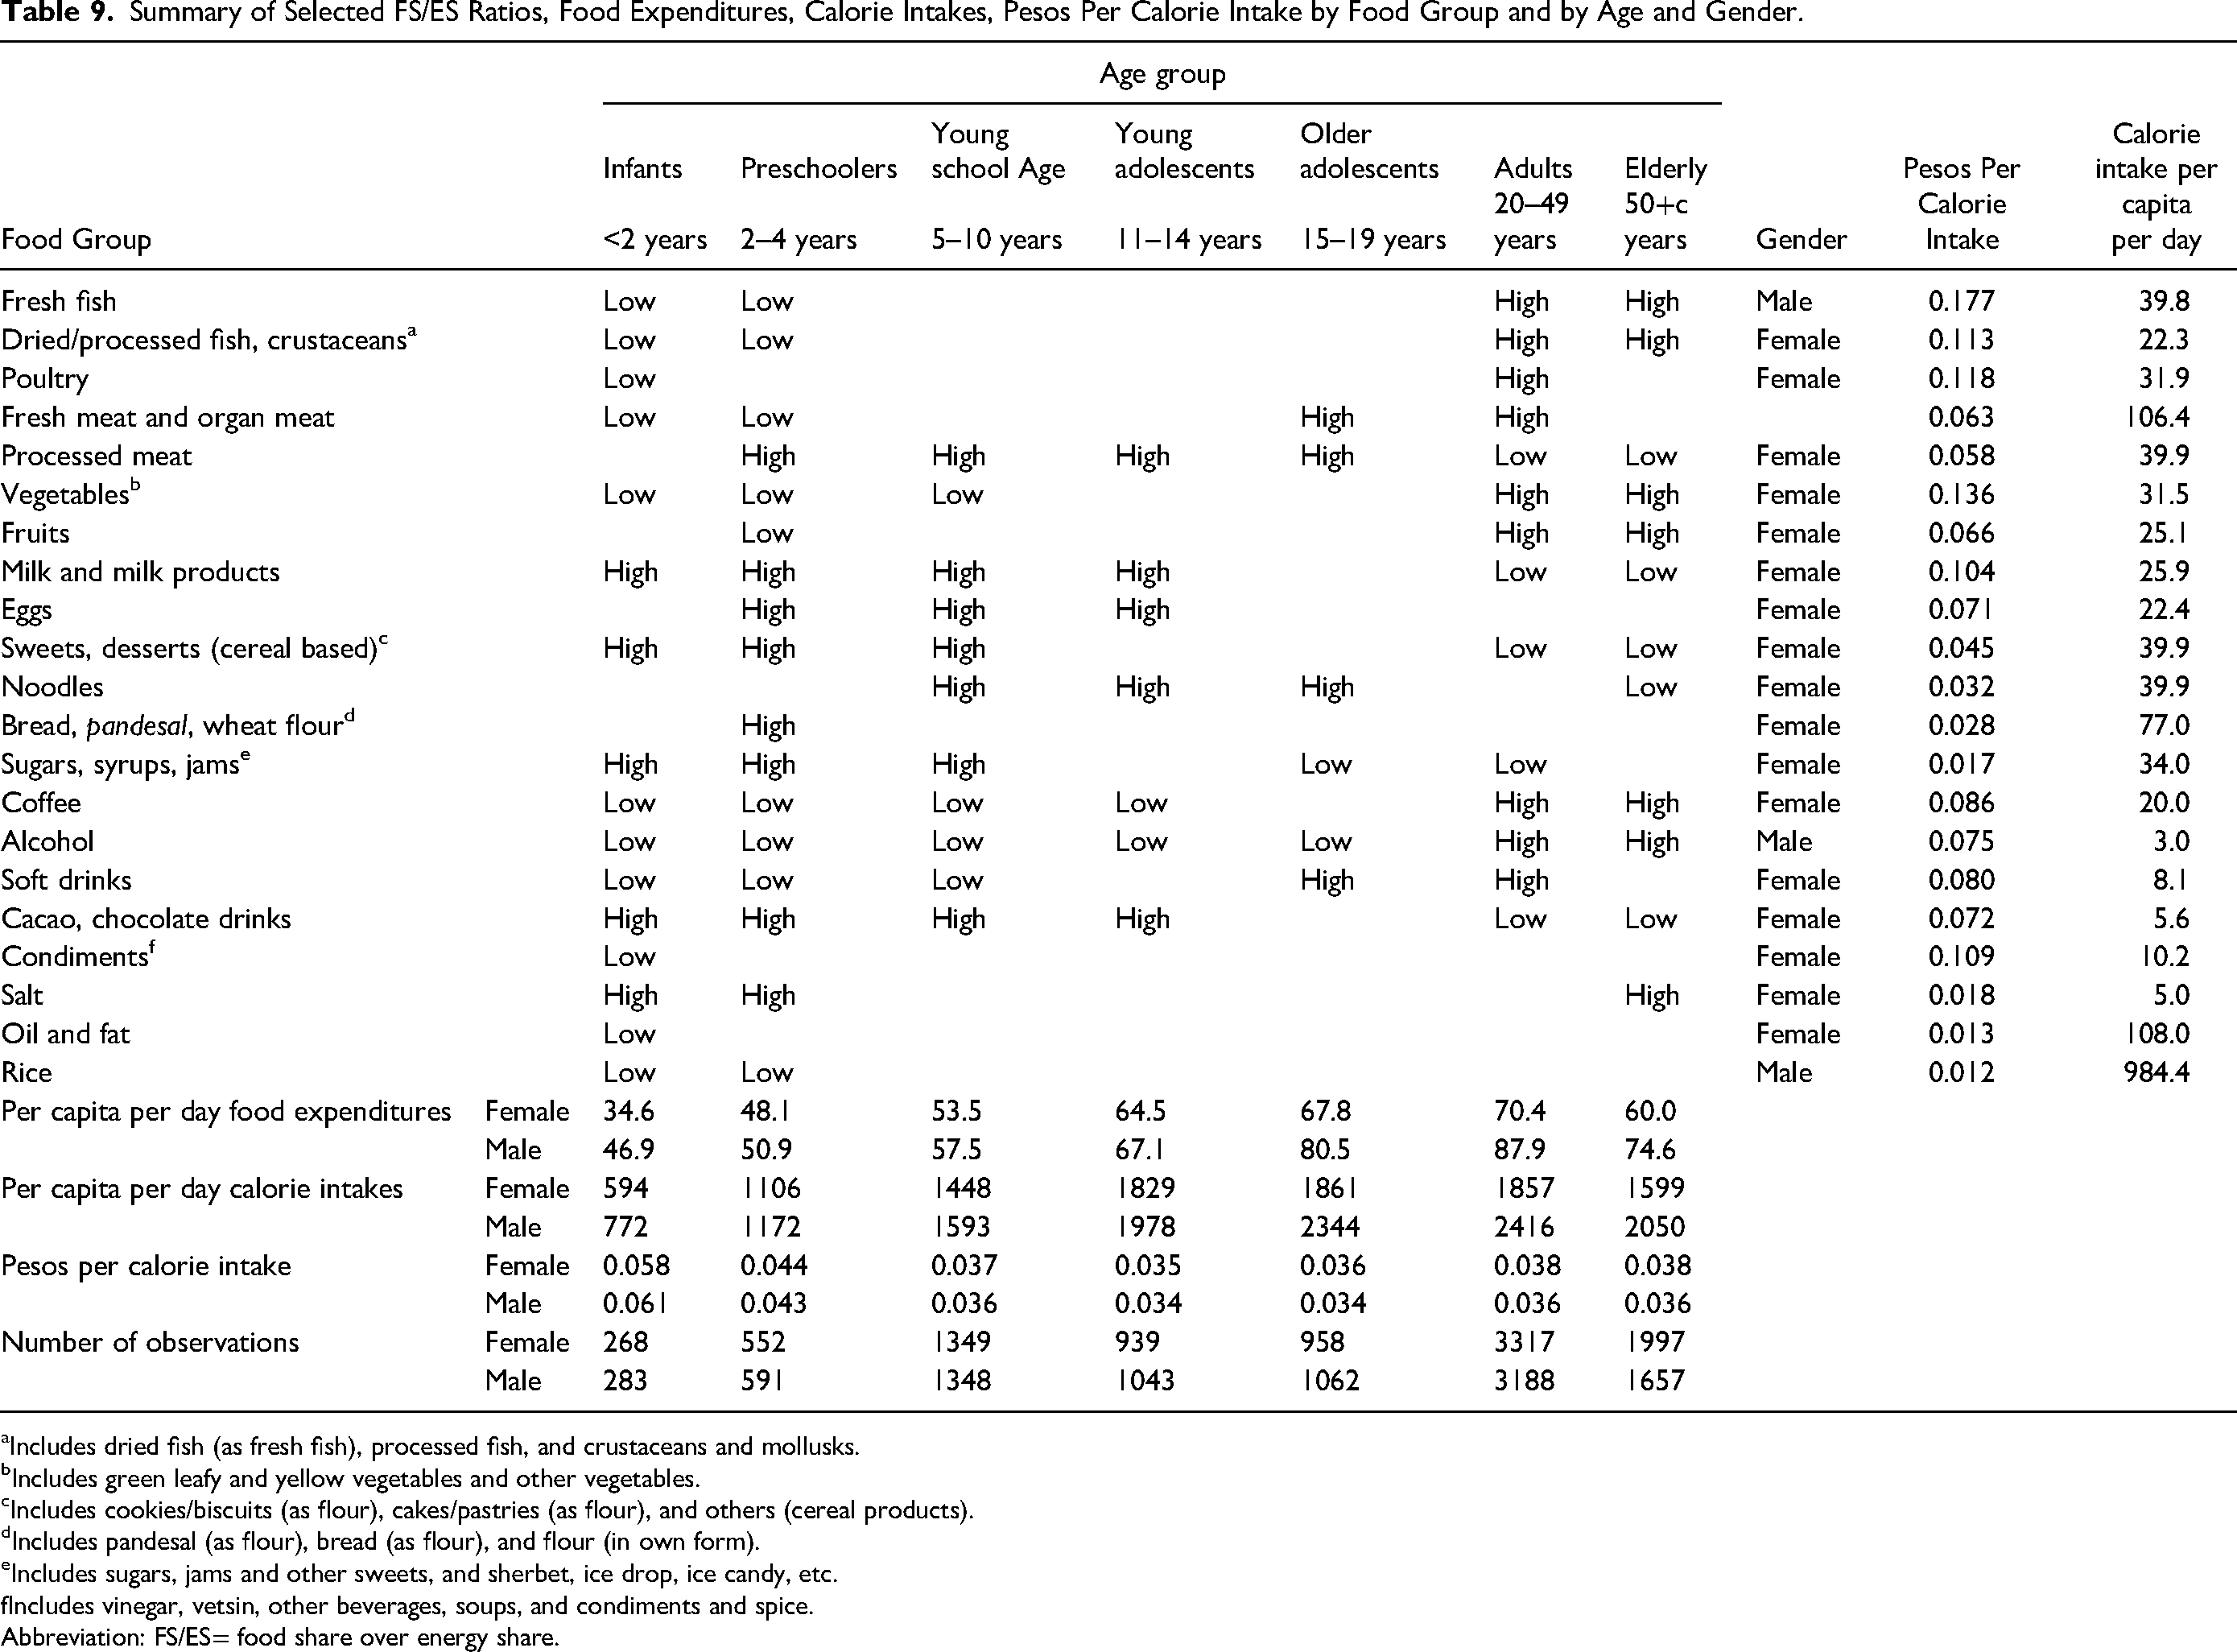
Summary of Selected FS/ES Ratios, Food Expenditures, Calorie Intakes, Pesos Per Calorie Intake by Food Group and by Age and Gender.
Includes dried fish (as fresh fish), processed fish, and crustaceans and mollusks.
Includes green leafy and yellow vegetables and other vegetables.
Includes cookies/biscuits (as flour), cakes/pastries (as flour), and others (cereal products).
Includes pandesal (as flour), bread (as flour), and flour (in own form).
Includes sugars, jams and other sweets, and sherbet, ice drop, ice candy, etc.
Includes vinegar, vetsin, other beverages, soups, and condiments and spice.
Abbreviation: FS/ES= food share over energy share.
Table 3 shows the FS/ES ratios for rice and for nondairy beverages. Nondairy beverages are presented first, not because of their importance in diets, but because they give an (expected) intuitive sense of what the FS/ES ratios describe. Starting with alcoholic beverages, males 20 years and older drink most of the alcohol. Adolescent males are beginning to consume alcohol.
Women 20 years and older are the heaviest coffee drinkers. Some coffee drinking occurs for all age and gender groups. Children below 15 years are the most intensive cacao and chocolate-based drink consumers; adult males and the elderly consume the least intensively. Compared with the other beverages, soft drink consumption is relatively evenly distributed, with the most intensive consumption extending across the 11-49 age range.
Rice is the primary food staple, eaten in all households. For most gender and age groups the ratios fall in a relatively narrow range between 0.86 and 1.13. Infants and preschoolers consume the least rice-intensive diets. Subsequent tables will show which is more expensive, nonstaple foods are eaten more intensively in infant and preschooler diets. This indicates that preschoolers are
Table 4 shows the FS/ES ratios for all cereal food groups, excluding milled rice. These foods tend to be prepared in the form of sweets for between meal snacks (merienda) and desserts—although not all, for example, Filipino bread roll (pandesal) is commonly consumed for breakfast. It is the youngest children who are given these foods most intensively. For each of the age groups shown above 10 years of age, the diets of females tend to be more intensive in the consumption of these foods than the diets of males.
Table 5 shows FS/ES ratios for vegetables, fruits, and beans. In general, adults 20 years and older eat vegetables and fruits more intensively (almost all FS/ES ratios exceed 1.0) than those <20 years old (almost all FS/ES ratios are <1.0). For a given age group, females consume vegetables somewhat more intensively than males—and even more intensively than males when it comes to fruits.
Table 6 shows FS/ES ratios for animal products. Milk and milk products (fresh and powdered) are consumed most intensively by infants and young children, declining with progressively older age groups. Females consume more milk and milk products than their male counterparts of a similar age. Similar age and gender patterns hold for eggs, although there is less difference in egg consumption between younger and older groups as compared with milk and milk products.
Processed meat is a favorite of those under 20 years of age, and is eaten least intensively by the elderly. Females eat processed meat more intensively than their male counterparts of a similar age.
Fresh meat and organ meat are eaten most intensively by adults. There is no statistically significant difference between males and females of any age group. Poultry is eaten with relatively the same intensity for the 11-49 years age groups with females consuming poultry more intensively only in the 15- to 19-year age group.
Table 7 shows FS/ES ratios for fish and seafood. Consumption of all four food groups is lowest under 6 years of age, then starts to increase with age, with adults 20+ years consuming these foods most intensively. Females consume dried fish, processed fish, and crustaceans and mollusks more intensively than males. Males 20 years and above consume fresh fish more intensively than females.
The FS/ES ratios for the remaining food groups—fats, oils, sugars, salt, and condiments are shown in Table 8. Sugar and salt consumption is most intensive for infants, preschoolers, and the elderly. Ratios are higher for females than males. Fats and oils are among the most evenly distributed foods with all ratios falling in the 0.91-1.11 range for ages 2 years and above.
Discussion
Table 9 summarizes the intrahousehold dietary patterns presented in Tables 3-8. Adults relatively intensively consume fresh meat, organ meat, fish and other seafood, vegetables, coffee, and alcohol. Infants and young children relatively intensively consume high amounts of milk and milk products, eggs, processed meat, noodles, sweets/desserts, sugars/syrups, and chocolate drinks. Adolescents transition between the two patterns as they grow older. Most of these foods are eaten in somewhat greater intensity by females.
The “peso per calorie intake” column in Table 9 shows which individual foods are relatively inexpensive and relatively expensive sources of energy. The rows at the bottom of Table 9 show for all foods, the per capita food expenditures and the per peso per calorie cost of the entire diet. For all family members 5 years and older for both genders, the average peso per calorie cost for all food intake varies little—between 0.034 and 0.038. Comparing across genders within particular age groups, the peso per calorie cost for females is slightly higher. This indicates that there is no significant difference in overall food expenditure allocations explicitly favoring particular age and gender groups.
However, males on average are physically larger than females and require more calories (controlling factors such as energy expenditures and pregnancy). Thus, food expenditures per capita are larger for males than females. Per capita food expenditures are highest for adult males and females and decline for younger children.
For infants and preschoolers, the cost per calorie intake is higher—0.043 to 0.044 for 24-59 months and in the 0.058 to 0.061 range for 0-23 months—than for those 5 years and older. The higher cost is due to the relatively high intakes of milk and milk products and relatively low intakes of rice. There is a curious anomaly in the divergent trends for boys and girls. Per capita food expenditures for boys for <24 months at 46.9 pesos, are about the same as for older boys 24-59 months, while per capita food expenditures for girls for <24 months at 34.6 pesos, are substantially lower than for girls 24-59 months.
This pattern is elucidated by Table 10 which disaggregates the data by breastfeeding and nonbreastfeeding infants. A higher percentage of girls are breastfed (48.1% as compared with 41.3% for boys). For breastfed infants, the peso per calorie intake is the same for boys and girls. The pesos per calorie intake figures are much higher for the nonbreastfed infants, in the 0.064-0.065 range. Households spend 41-45 pesos more per day for food when an infant is not breastfeeding as compared with an infant who is breastfed (although the average age of breastfeeding infants in the sample is somewhat lower than the average age of nonbreastfeeding infants).
Per Capita Food Expenditures, Calorie Intakes, Pesos Per Calorie Intake for Infants by Breastfeeding and Not Breastfeeding.
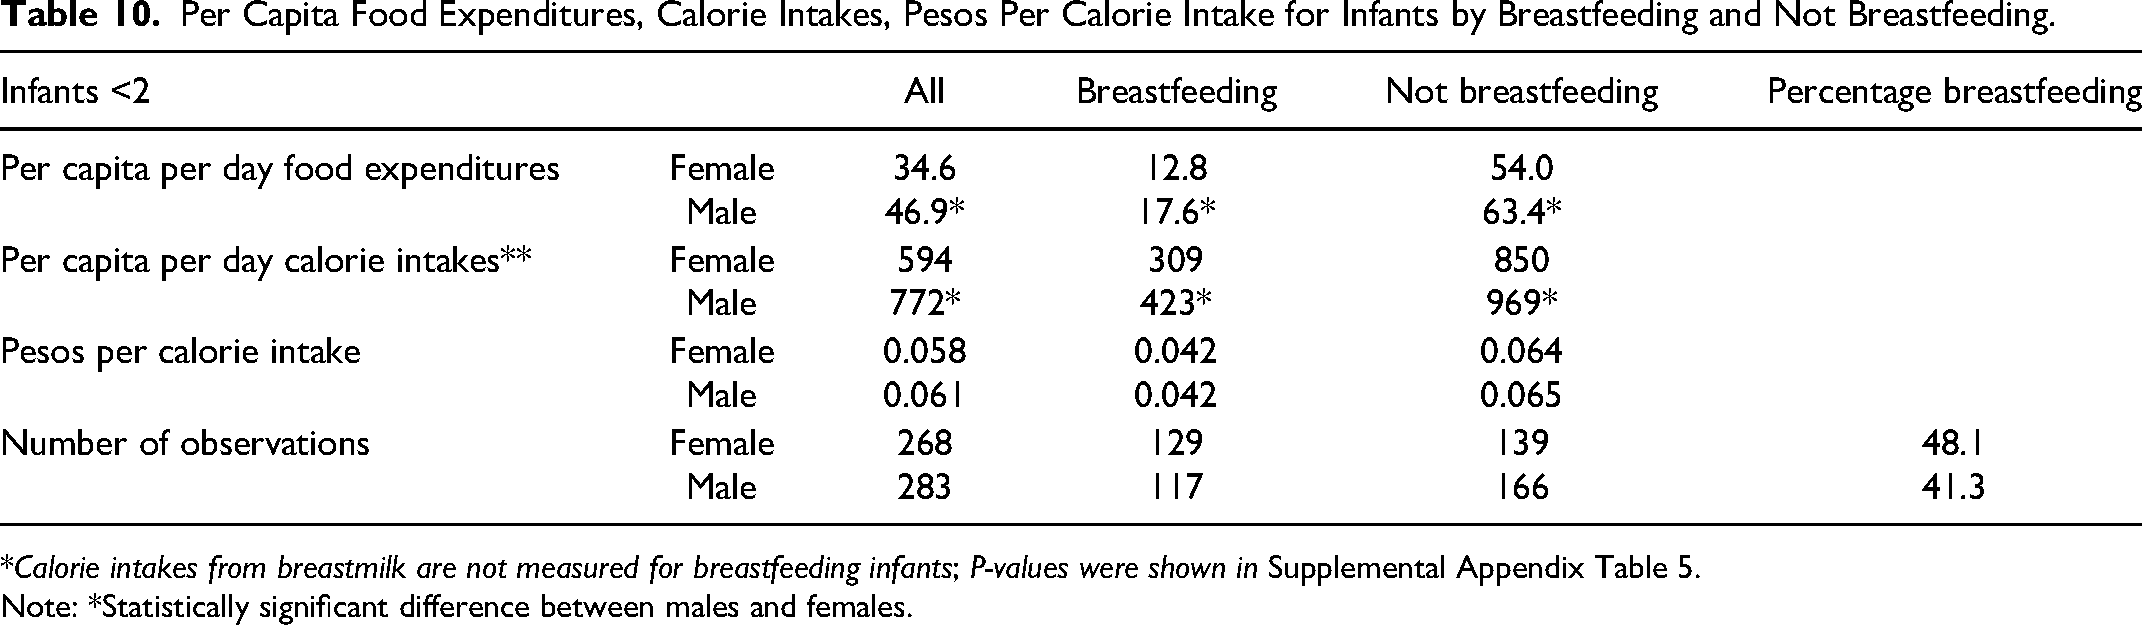
Calorie intakes from breastmilk are not measured for breastfeeding infants; P-values were shown in Supplemental Appendix Table 5.
Note: *Statistically significant difference between males and females.
Why are girls breastfed more than boys? Although this is a topic for a future paper, one hypothesis might be that boys are larger and require more calories. Mothers may feel that their breastmilk is not enough at a certain point, supplement with breastmilk substitute, then move entirely to breastmilk formula. The higher number of nonbreastfeeding boys may have been breastfed when they were younger. This is a cross-section of households at a particular point in time.
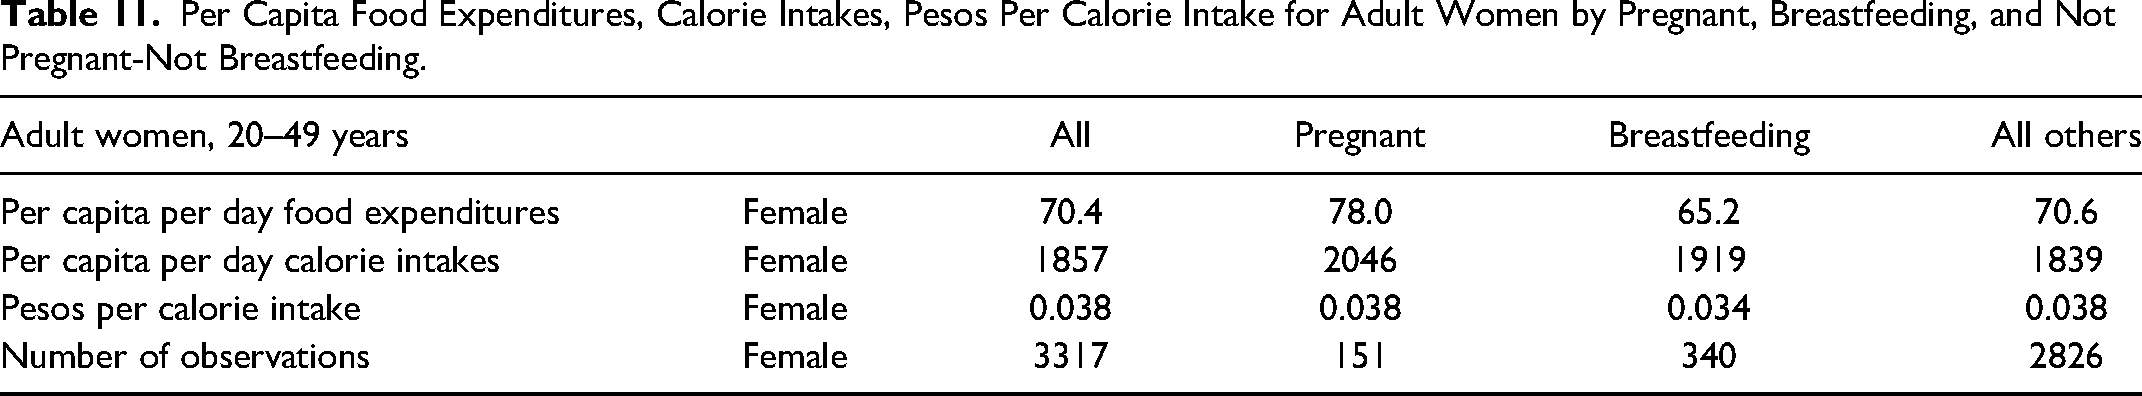
Table 11 shows analogous data as for Table 10, but for adult women disaggregated by pregnant, breastfeeding, nonpregnant, and nonbreastfeeding. There are no striking differences in peso per calorie intake. Calorie intakes are highest for pregnant women, then next highest for breastfeeding women.
Per Capita Food Expenditures, Calorie Intakes, Pesos Per Calorie Intake for Adult Women by Pregnant, Breastfeeding, and Not Pregnant-Not Breastfeeding.
The fact that infants, preschoolers, and elderly women consume salt intensively may be a concern for their development and health.
Conclusion and Recommendations
In conclusion, the intrahousehold food distribution patterns for the Philippines discussed in this article are consistent with the ethnographic evidence cited in the introduction that there is no intended discrimination against preschool children and women of reproductive age in the intrahousehold distribution of food. However, it may be that if there is an overlay of nutritional requirements on nutrient intakes (information which mothers generally do not have), the nutrient gaps may be higher for these two groups due to their relatively high requirements for rapid growth and reproduction, respectively.
The FS/ES methodology focuses on distribution choices of specific foods which are known explicitly to family members. FS/ES ratios indicate tendencies for how various foods are distributed among family members at a given level of income and set of food prices. Thus, there are many interesting questions which future research could address using this methodology How do patterns described in Tables 3 through 8 differ between low income and high-income households? Obviously, at higher incomes it is easier to share, to be generous. Fewer sacrifices must be made, with the opposite holding at lower income levels. Obesity is a growing problem. Are high FS/ES ratios for particular types of food (eg, cereals, cereal-based desserts and sugars) positively associated with child obesity? Is this association reversed for high FS/ES ratios for vegetables and fruits? This may provide insights into focused recommendations for dietary change, and empirical evidence to back up these recommendations. How are these patterns of food distribution within the family influenced by education level of the parents, the nutritional knowledge of the parents, ages of the parents, and the time constraints of (say working) mothers? Urban-rural differences and farm-non-farm differences within rural areas were not explored in this paper. Preschool diets may be characterized as dairy-intensive as compared with meat, fish, and vegetable-intensive adult diets. Is this an appropriate tradeoff from a nutritional perspective? Why is there a higher breastfeeding rate for girls than boys? Although sample sizes are low for pregnant and breastfeeding women, FS/ES ratios for some foods differ markedly for some foods by the three status categories for adult women in Tables 3 through 8. Are these dietary shifts appropriate from a nutritional perspective? Through personal experience, does a mother alter her diet when pregnant/lactating for her last child, as compared with her first child? How are children of different birth orders treated in the intra-household distribution of food—the first born to young family and the last born of a larger family? Is a girl with several brothers treated differently, as compared with where there is one boy and several sisters?
Answers to these questions will give insights into how diets may change when shocks occur, such as the COVID pandemic, or when food prices rise rapidly. Public policies and advocacy often seek to change behaviors. Obtaining credible answers may require larger datasets with more observations. The hope is that the FS/ES measure and methodology can provide useful insights for structuring successful nutrition programs and policies.
Supplemental Material
sj-docx-1-fnb-10.1177_03795721241282415 - Supplemental material for Intrahousehold Food Distribution in the Philippines: A Food Share Over Energy Share Perspective
Supplemental material, sj-docx-1-fnb-10.1177_03795721241282415 for Intrahousehold Food Distribution in the Philippines: A Food Share Over Energy Share Perspective by Imelda Angeles-Agdeppa, Howarth Bouis, Roehlano M. Briones, Isabel B. Espineli and Ma. Lynell V. Maniego in Food and Nutrition Bulletin
Footnotes
Author Contributions
IA-A, HB, and RMB were involved in conceptualization and study design; IBE and MLVM in data acquisition and processing; HB and IA-A in data interpretation; HB, IA-A, MLVM, and RMB in drafting and revision of the manuscript; and IA-A, HB, RMB, IBE, and MLVM in finalization and approval of the manuscript.
Declaration of Conflicting Interests
The authors declared no potential conflicts of interest with respect to the research, authorship, and/or publication of this article.
Funding
The authors received no financial support for the research, authorship, and/or publication of this article.
Supplemental material
Supplemental material for this article is available online.
Notes
References
Supplementary Material
Please find the following supplemental material available below.
For Open Access articles published under a Creative Commons License, all supplemental material carries the same license as the article it is associated with.
For non-Open Access articles published, all supplemental material carries a non-exclusive license, and permission requests for re-use of supplemental material or any part of supplemental material shall be sent directly to the copyright owner as specified in the copyright notice associated with the article.