
Abstract
Background:
Africa’s drylands have unique food environments and persistently high rates of wasting and stunting. This article documents findings and experiences from Fill the Nutrient Gap (FNG) processes conducted in 7 Sub-Saharan African countries that include drylands.
Objective:
This study advocates for a comprehensive consideration of the specific food environments of drylands using a novel analytical framework and shares findings and best practices for improving food and nutrition security in these contexts.
Methods:
Three analyses are combined. Analysis 1 re-analyzes cost and non-affordability of nutrient-adequate diets indicators from FNGs by reclassifying areas as drylands and non-drylands. Analysis 2 uses malnutrition estimates in drylands and non-drylands and examines associations with non-affordability of nutrient-adequate diets. Analysis 3 synthesizes evidence from FNG processes to document how those indicators were used to engage stakeholders and inform nutrition policy and practice in drylands.
Results:
The nutrient-adequate diet of a 5-person household was 2.60 USD (41%) more expensive in drylands. A nutrient-adequate diet was not affordable to 71% of households in drylands, compared to 55% in non-drylands. Wasting and stunting prevalence and non-affordability of nutrient-adequate diets were simultaneously high in drylands.
Conclusion:
The article presents new evidence that contributes to elucidate specific characteristics of the food environment of Africa’s drylands and suggests a framework to improve on those factors systematically. The FNG is innovative in combining an analytical framework with multistakeholder review and dialogue, as well as modeling of possible strategies, to build consensus on possible transformation pathways to improve diets in drylands.
Plain language title
Findings of high non-affordability of diets and malnutrition enhances systems thinking for action in Africa’s drylands
Plain language summary
The article documents findings and experiences from the World Food Programme’s Fill the Nutrient Gap (FNG) processes conducted in 7 Sub-Saharan African countries that include drylands. The objective is to advocate for a comprehensive consideration of the specific food environments of drylands using a novel analytical framework and share findings and best practices of how this can support improvements in food and nutrition security in these contexts. The FNG process relies on 2 metrics of cost of a nutrient-adequate diet and the proportion of people who cannot afford it which capture important dimensions of the local food environment. Three analyses are combined. Analysis 1 reanalyzes the indicators of cost and non-affordability by reclassifying areas as drylands and non-drylands. Analysis 2 uses malnutrition estimates in drylands and non-drylands and examines associations with non-affordability of nutrient-adequate diets. Analysis 3 synthesizes evidence from FNG processes to document how indicators of cost and non-affordability were used to engage stakeholders and inform nutrition policy and practice in the 7 countries. The nutrient-adequate diet of a 5-person household was found to be 2.60 USD (41%) more expensive in drylands. A nutrient-adequate diet was not affordable to 71% of households in drylands, compared to 55% in non-drylands. Examining the link between non-affordability of nutrient-adequate diets and different forms of malnutrition, wasting, and stunting prevalence and non-affordability of nutrient-adequate diets was simultaneously high in drylands, whereas this relationship appeared more nuanced in non-drylands. The article also synthesizes findings from FNG reports on the specific characteristics of the food environment of Africa’s drylands that can help make sense of cost, affordability, and malnutrition patterns. The FNG is innovative in combining an analytical framework with multistakeholder review and dialogue, to build consensus on the priority actions for transformative, system-wide changes toward improved diets and nutrition in drylands.
Introduction
In 2019, 3 billion people could not afford a healthy diet. Sub-Saharan Africa faced the greatest burden, with 85% of people unable to afford a healthy diet (that is, as recommended by food-based dietary guidelines). Out of these, 75% could not even afford a diet that just meets nutrient requirements. 1 Although global food security and nutrition reports have recently contributed to important global advocacy on the cost and non-affordability of nutrient-adequate diets at the national level, subnational nuances remain insufficiently captured. Indeed, current methods and analytical frameworks have only assessed these indicators at the national level for country-to-country comparison, failing to provide more granular insights to tailor national policy and programs. 1
Africa’s drylands, whose characteristics strikingly differentiate them from other ecosystems, require consideration of these subnational nuances. There, extreme climatic conditions shape people’s lives, livelihood systems, and opportunities. 2 Livelihood adaptation to low and variable rainfall is dominated by pastoralism, rainfed agriculture, and alternative income sources, 3 thereby determining the availability and affordability of nutritious foods. Drylands show persistently high levels of wasting, stunting, and other forms of malnutrition, such as anemia that is highly prevalent in adolescent girls and adult women. 4 A closer examination of the links between extreme aridity, the characteristics of the local food environment, and persistent malnutrition is needed.
The specific conditions in drylands call for a tailored systemic approach to address the basic and underlying drivers of malnutrition in Africa’s drylands. 4 This includes measuring indicators that characterize these ecosystems, at subnational and livelihood levels, and examining how the food environment impacts food and nutrition security. The cost of a nutrient-adequate diet and the proportion of people who cannot afford it are 2 valuable metrics capturing main dimensions of the local food environment. They provide an indication of the constraints on food choices faced by individuals, important determinants of diets, and nutrition outcomes. 5
These metrics are at the core of the World Food Programme (WFP)’s Fill the Nutrient Gap (FNG) analysis. The FNG provides an analytical framework to understand the constraining nature of the food environment at the subnational level, with a focus on cost and affordability of diets, and engage stakeholders from multiple sectors to review this evidence for decision-making. 6
This article leverages experiences and findings from FNG processes conducted in 7 Sub-Saharan African countries that include drylands. The overarching objective of the article is to demonstrate how such an analytical framework can support a comprehensive consideration of the specific food environments of drylands and share findings and best practices for improving food and nutrition security in these contexts.
The first objective is to generate novel evidence across Africa’s drylands on how aridity is associated with the cost and non-affordability of nutrient-adequate diets. The second objective is to examine the link between non-affordability of nutrient-adequate diets and different forms of malnutrition in dry and nondry areas to further assess the link between these dimensions of the food environment and persisting malnutrition. The third objective is to document how these new indicators of subnational cost and non-affordability of diets were and can be used in a multistakeholder and multisectoral engagement process to define a systems approach to improving nutrition in drylands.
Methods
This article brings together evidence and documents experiences from FNG analyses conducted in 7 countries: Burkina Faso, Cameroon, Chad, Ethiopia, Mali, Mauritania, and Somalia. These were selected using 3 criteria: (1) being in Sub-Saharan Africa and located along the Sahel belt and into East Africa, (2) presenting dryland and nondryland livelihood systems, and (3) where an FNG process took place between 2018 and 2021.
Background on the FNG Analysis
The conceptual principles and methodology of the FNG analyses are described in Bose et al.
6
The FNG is an analytical framework that combines an analysis of the barriers to nutrient intake and the contributions across sectors needed to overcome these barriers, with a multistakeholder engagement process to support decision-making for improved nutrition policy and practice. Every FNG includes the following: A stakeholder engagement process: The FNG engages stakeholders from food, education, health, and social protection systems, including the government, private sector, academia, UN organizations, and national and international nongovernmental organizations. Through workshops, stakeholders review initial results, jointly define the interventions they want to see modeled to improve affordability of diets, validate findings, discuss implications across sectors, and define multisectoral priority interventions that can improve nutrient intake considering subnational specificities. A baseline data analysis: The FNG process relies on a calculation of a least cost energy-sufficient diet (henceforth “energy-sufficient diet”) and a least cost staple-adjusted nutrient-adequate diet (henceforth “nutrient-adequate diet”) using linear optimization.
7
The nutrient-adequate diet is optimized for energy, protein, fat, 9 vitamins, and 4 minerals. It includes quantities of local staple foods that cover about 50% of total energy needs, and selected staples are adjusted so that optimized diets better reflect actual consumption patterns. Estimates of the nutrient-adequate diet are compared against household expenditure to estimate the percentage of households who would be unable to afford this diet (henceforth “non-affordability”). Costs of energy-sufficient and nutrient-adequate diets are calculated using local market price data collected at subnational levels. Food prices data sources depend on the country context and availability. They can come from primary market data collection carried out directly by WFP staff or third-party enumerators or leverage existing data sources such as the Consumer Price Index (CPI) or other government market monitoring data. Costs of diets are then calculated at the subnational unit level (henceforth “assessment zones”) and estimated at the national level using population-weights. The relevant subnational unit varies depending on the country and is defined by country stakeholders. In some countries, costs are calculated at the administrative level (eg, province, region), while in others, it is calculated at the livelihood level (eg, as per FEWS NET classification). To calculate the non-affordability indicator, average household expenditure is estimated at the assessment zone level using secondary expenditure data. These data often do not align with the time period during which food prices are collected such that an adjustment is applied to align time periods across sources. A review of secondary data sources and modeling of potential individual and packages of interventions: A review of secondary data sources on the production, availability of nutritious foods, food expenditure patterns, and consumer behaviors is conducted to gain a better understanding of the context-specific drivers of availability, access, and choice of nutritious foods. Based on this review as well as discussions with stakeholders, key barriers to adequate nutrient intake in different contexts are identified as well as potentially relevant interventions to address those. Modeling is done through the linear optimization software and allows to evaluate the impact of individual or packages of interventions on the cost and non-affordability of diets. Modeling can include, for example, introducing fortification of staple foods, which would reduce the cost of meeting nutrient intake, or a cash transfer through social safety nets, which would increase income and affordability of diets. Interventions can target the whole population or a specific target group, such as adolescent girls or school-aged children. Priority setting: Results of the baseline and modeling analysis are consolidated and summarized into key findings. A comprehensive report is written. These documents serve as a basis for discussion between stakeholders to define recommendations and entry points for different sectors to improve nutrition. A road map is defined with stakeholders where key priority actions are identified. Information gaps are also highlighted.
Analytical Approach of This Article
This article combines 3 analyses based on secondary data sources. Analysis 1 reanalyzes cost and non-affordability of diets indicators from the 7 FNGs with a new classification of areas between dry and nondry areas to highlight commonalities across Africa’s drylands. Analysis 2 uses secondary data sources of malnutrition estimates for 5 countries reclassified into dry and nondry areas and examines associations with non-affordability of nutrient-adequate diets across these ecosystems. Analysis 3 synthesizes findings from FNG analyses to document how they were used to engage stakeholders and inform nutrition policy and practice in drylands.
Data sources
Analyses 1 and 2 make use of WFP’s FNGSTAT database (note 1), which is a compilation of subnational estimates from FNG analyses of the cost of the energy-sufficient and nutrient-adequate diets (note 2) as well as their non-affordability. Cost estimates are standardized to a 5-person household and to January 2020 using standard market exchange rates and Purchasing Power Parity (ppp) rates based on a 3-step methodology described in Dhaliwal et al 8 to allow for comparison across countries. As the World Bank conversion does not exist for Somalia, costs estimates could not be standardized and are, therefore, not included in this article.
Table 1 summarizes the price and expenditure data sources used for analyses 1 and 2. In 5 countries, primary price data from WFP market surveys were used, while secondary government price data were used in 2 countries. In 3 countries, data had been analyzed at the livelihood level for the FNG, while in 4 countries, it had been analyzed at the administrative level. In 4 countries, data were collected and aggregated for multiple months of the year.
Summary of Data Sources per Country.
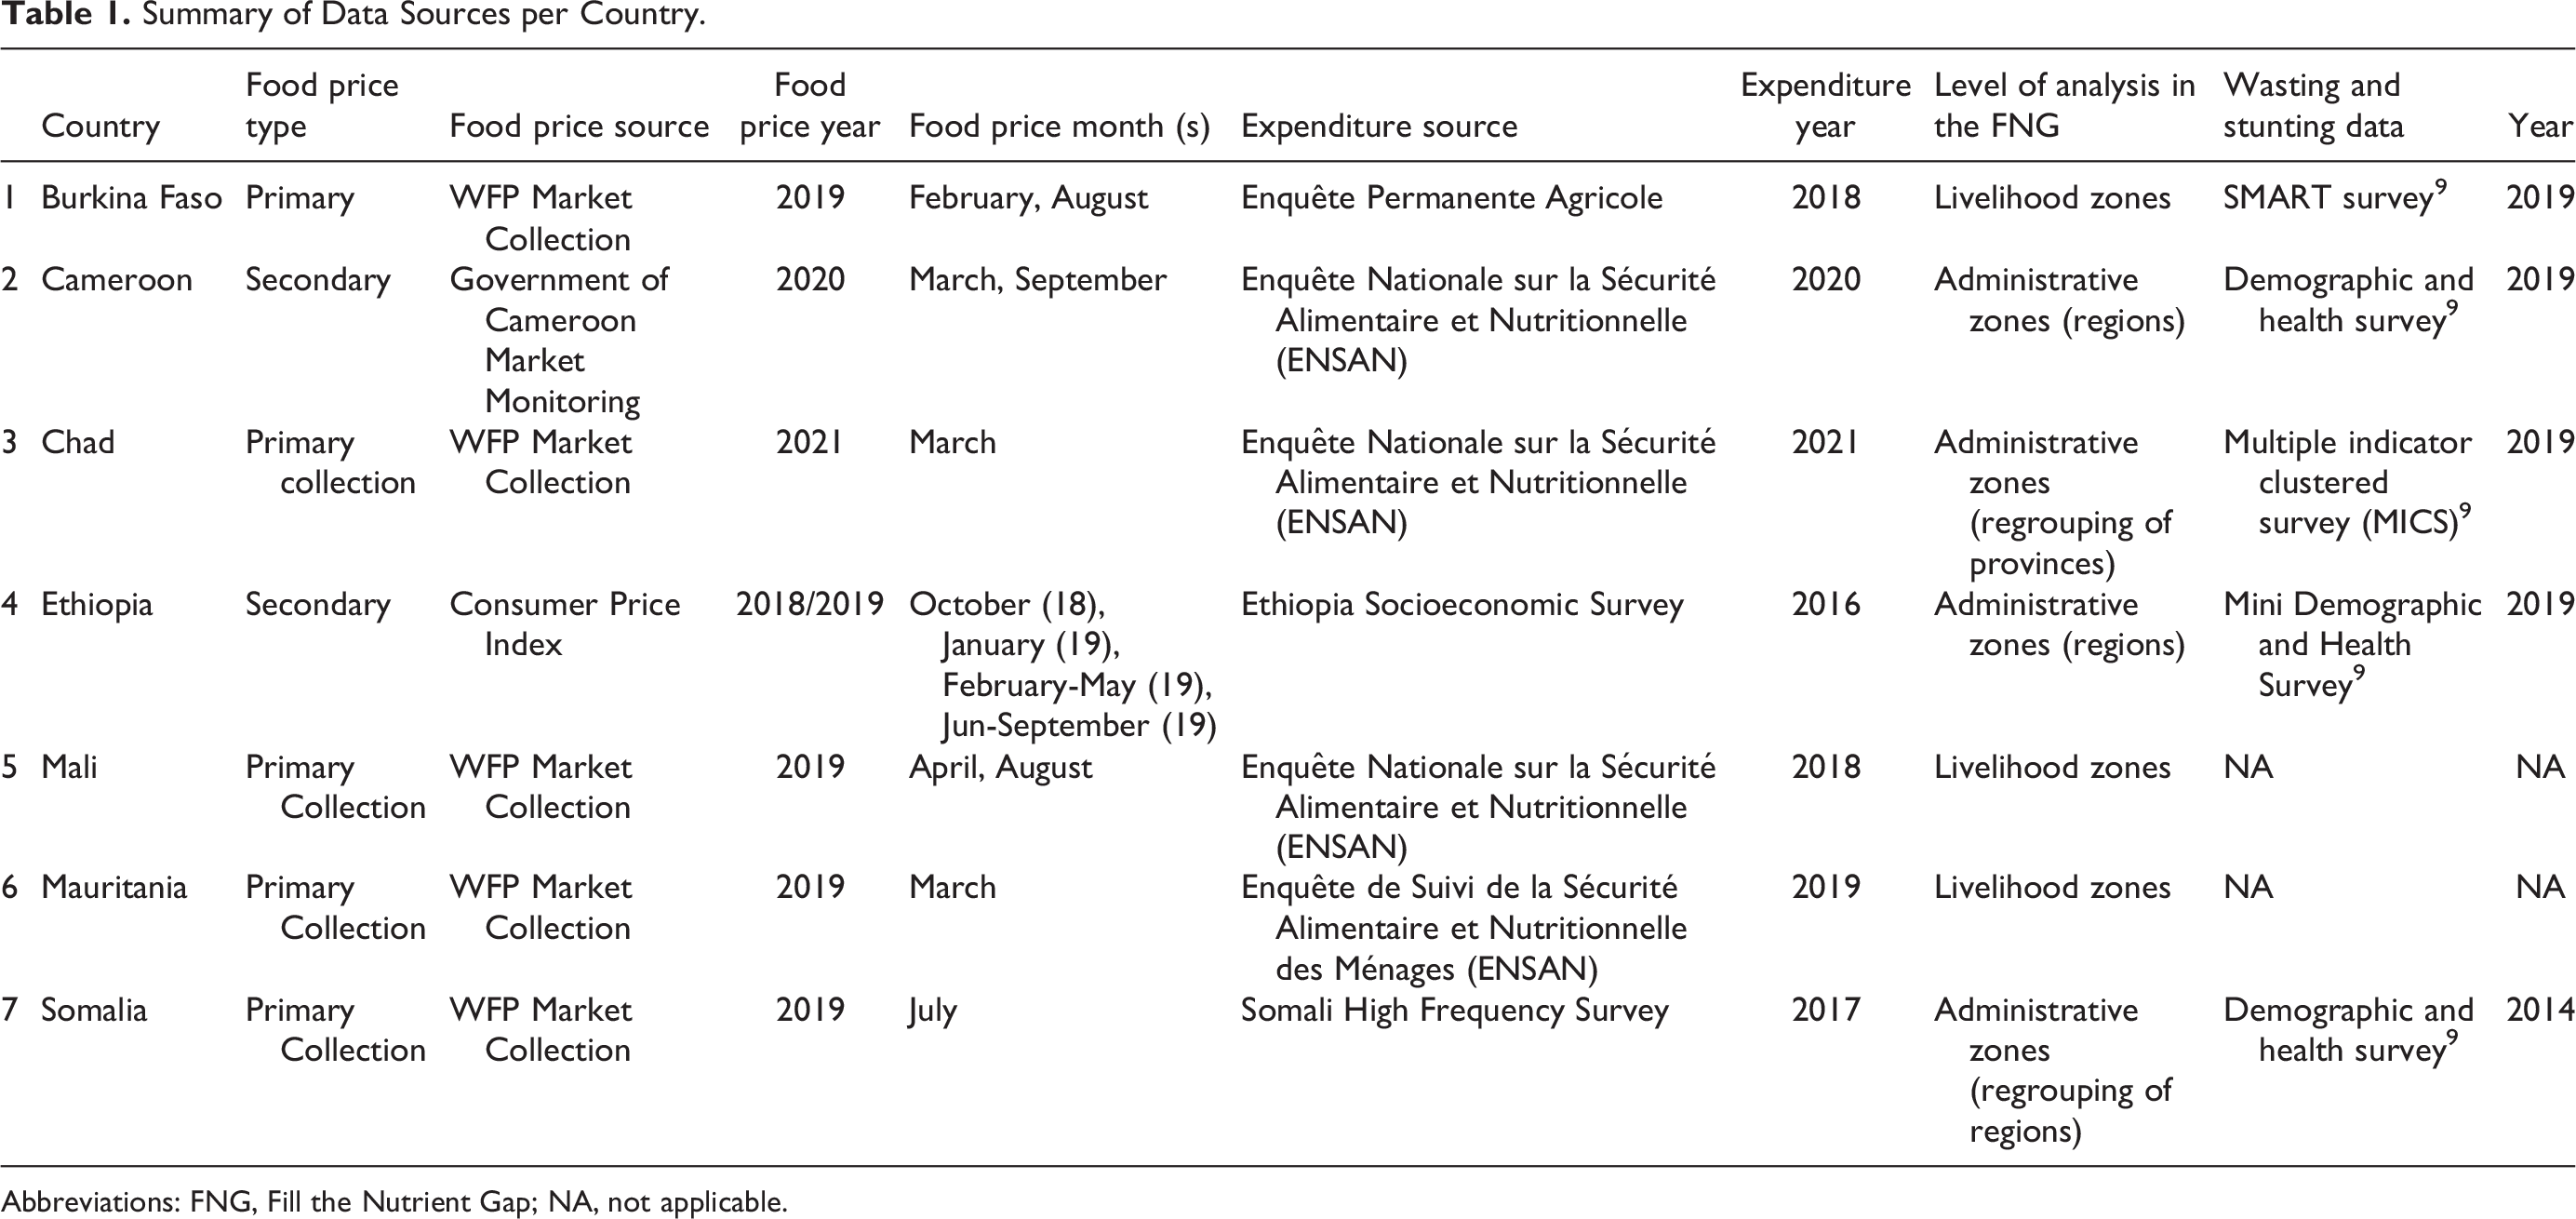
Abbreviations: FNG, Fill the Nutrient Gap; NA, not applicable.
For analyses 1 and 2, assessment zones (livelihood or administrative), as defined during the FNG process, were reclassified between arid, nonarid, and urban areas. Drylands include hyperarid and arid zones (note 3). All other zones are considered non-drylands. A wider definition of dryland that includes semiarid zones is used for sensitivity analyses. Urban zones are limited to the capital city and surrounding area, except in Mali where it is an average of capital and regional urban centers (note 4). In total, 62 zones over 7 countries were included in this article, though only a subset is used in some of the analyses, depending on data availability for a zone. Overall, 18 (29%) zones were classified as drylands, 38 (61%) were classified as non-drylands, and 6 (10%) as urban. No data were collected for urban zones in Chad. Table S1 shows the classification for each assessment zone.
Sample sizes differ between cost and non-affordability indicators and are presented in Table 2. The full sample as detailed above (62 zones) is used for the non-affordability calculations. Only 56 zones are included in the cost calculations as cost estimates from Somalia are excluded (see section “Methods”): 17 dryland zones (30%), 34 nondryland zones (61%), and 10 urban areas (18%).
Sample Size by Dryland Type.
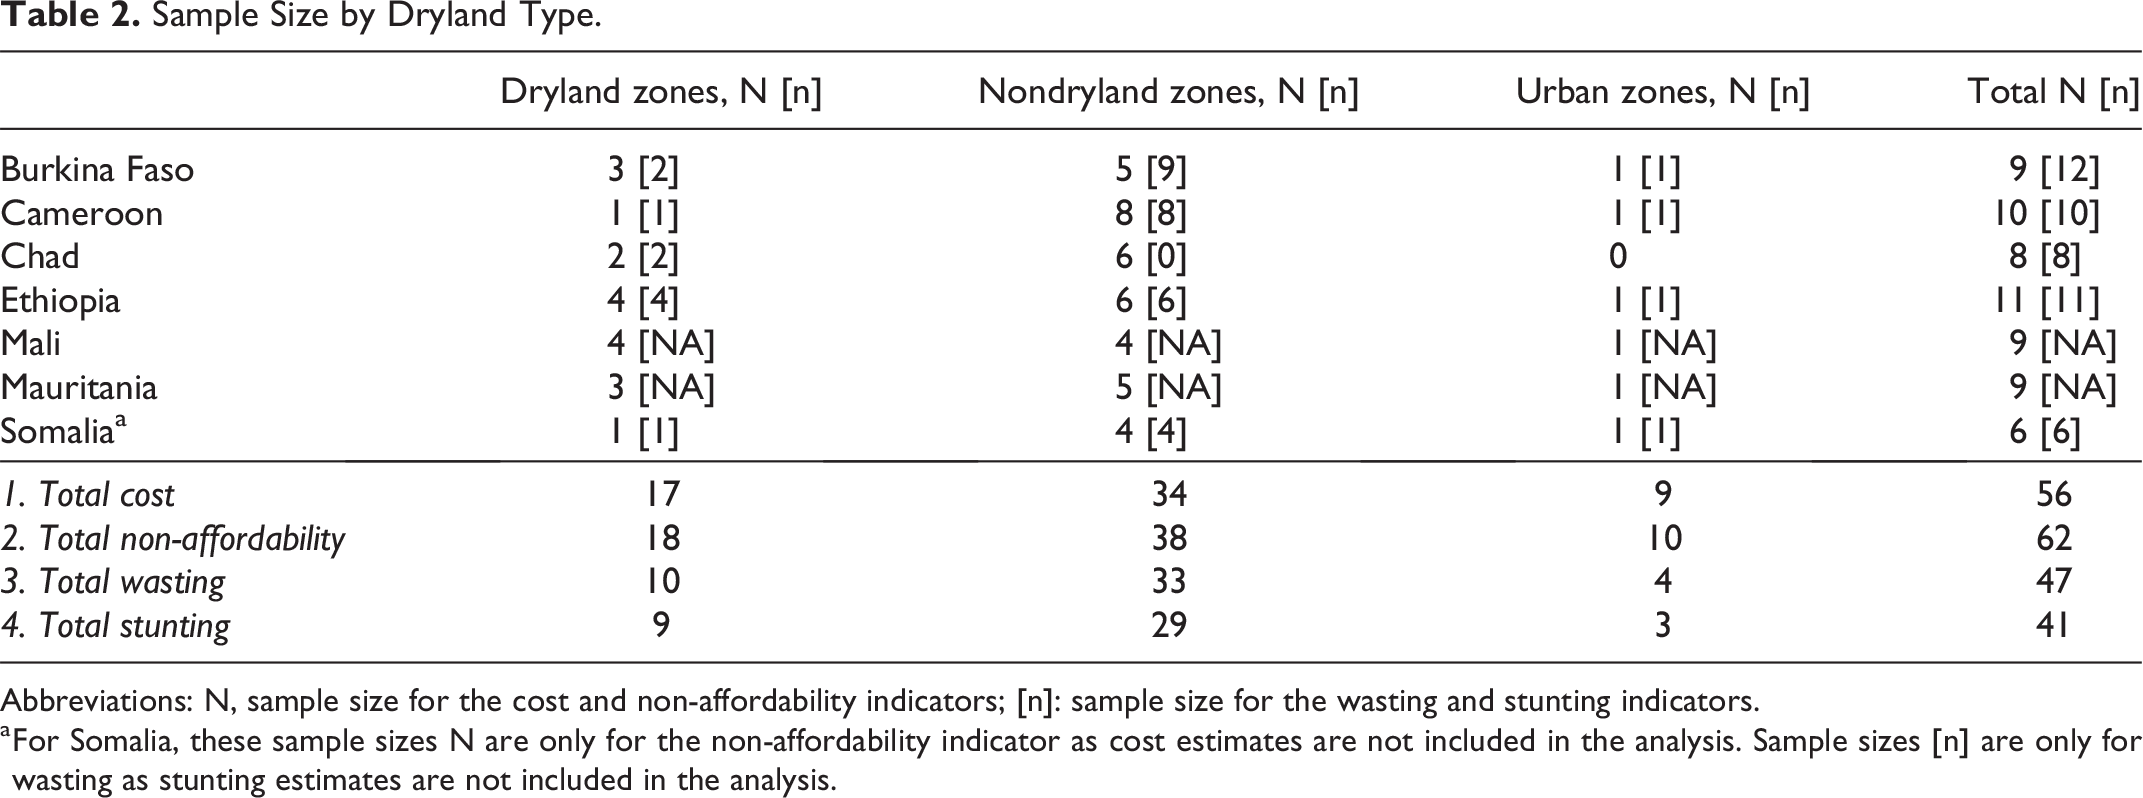
Abbreviations: N, sample size for the cost and non-affordability indicators; [n]: sample size for the wasting and stunting indicators.
a For Somalia, these sample sizes N are only for the non-affordability indicator as cost estimates are not included in the analysis. Sample sizes [n] are only for wasting as stunting estimates are not included in the analysis.
In analysis 2, wasting prevalence is defined as the proportion of children aged 6 to 59 months whose weight for length or height z-score (WHZ) is below −2 standard deviations (SD). Stunting prevalence is defined as the proportion of children aged 6 to 59 months whose height/length for age z-score (HAZ/LAZ) is below −2 SD. Table 1 summarizes the sources of data for the malnutrition indicators. Analysis 2 aims to explore the relationship between cost, non-affordability, and malnutrition indicators, using data aggregated at the same level of analysis. Malnutrition indicators are collected to be representative and estimated at the administrative (eg, province, region) and national levels. On the other hand, FNG analyses estimated cost and non-affordability of diets according to geographical disaggregation as chosen by in-country stakeholders. In some countries, this included livelihood zones (ie, zones determined by livelihood opportunities) that matched well dryland areas, but not administrative zones. As such, analysis 2 only includes 5 of the 7 countries: Mali and Mauritania are excluded because cost and non-affordability of diets are estimated at the livelihood level. In Burkina Faso, however, administrative and livelihood boundaries are broadly aligned such that cost and non-affordability of diets could be reestimated at the administrative level. Additionally, in Chad, the FNG analysis grouped some provinces together and produced average at the “province group” level. To match this, results from the multiple indicator clustered survey (MICS) were grouped as per the FNG groupings and averages were calculated for those groups using province population as weights. Finally, stunting estimates for Somalia were not included due to age estimates considered unreliable by national experts. 10 The WHO thresholds are used to interpret wasting and stunting findings. 11
In total, 47 and 41 zones across 5 countries (Burkina Faso, Cameroon, Chad, Ethiopia, Somalia) were included in analysis 2 for wasting and stunting, respectively, as detailed in Table 2.
Analyses 3 consists of a review of FNG reports from 6 countries: Burkina Faso, 12 Cameroon, 13 Ethiopia, 14 Mali, 15 Mauritania, 16 and Somalia. 10 The FNG Chad report was not included as the FNG was still ongoing at the time of the review.
Data processing
Analysis 1
This analysis assesses whether cost and non-affordability of diets differ significantly between drylands and non-drylands. Urban centers, which present very specific characteristics, are presented separately. First, the article presents unweighted means across all subnational assessments disaggregated by dryland type and country. Median and SD are presented in Table S2. Population weights are not applied as the analysis compares drylands and non-drylands and, in Mali and Mauritania, livelihood zones are used, rather than administrative boundaries at which population sizes are defined. Unweighted aggregated estimates for the Sahel region are also presented. Second, statistical tests are run between drylands and non-drylands overall to allow for larger sample sizes. As all variables are found to be non-normally distributed, Mann-Whitney U tests were used to test whether distributions differ significantly between drylands and non-drylands zones. In addition, a sensitivity analysis was run using a wider definition of drylands, which includes semiarid areas (results presented in Table S4).
Analysis 2
First, this analysis investigates whether wasting and stunting prevalence differs significantly between drylands and non-drylands. The article presents the unweighted mean across all subnational assessments and disaggregated by dryland type and country. Median and SD are presented in Table 2. Second, to explore patterns between malnutrition and non-affordability, the article includes scatter plots disaggregated by drylands and non-drylands and by country.
Analyses 1 and 2 are conducted using Stata version 15.0.
Analysis 3
Analysis 3 is a synthesis of the experience and findings from FNG processes to document how cost and non-affordability of diets indicators were and can be used and their specific contribution toward enhancing systems thinking for nutrition in drylands. The main findings of this synthesis are identified through a review of the 6 FNG reports available at the time of this analysis, which include a comprehensive review of secondary data in addition to the measures of cost and non-affordability (for more details, see Bose et al 6 ). Taking note of points that repeat themselves across reports, commonalities valuable to identify where systems require strengthening to improve diets in drylands is extracted and synthesized.
Limitations
There are limitations to this article. The sample size for the FNG indicators is relatively small, which might weaken the conclusions of the statistical analyses, despite using nonparametric tests and sensitivity analyses. Similar analyses with larger sample sizes should be undertaken to further explore the relationships highlighted in this article. Furthermore, exploring the relationship between malnutrition and drylands is limited by the level of data available. In Mali and Mauritania, diet costs were calculated at the livelihood zones level, which is also how dry and nondry areas break down in these countries. However, malnutrition data are only reported at administrative level. Since, in Mali and Mauritania, administrative and livelihood boundaries do not align, these countries were excluded from the malnutrition analyses, further reducing the sample size. Results need to be interpreted keeping these caveats in mind. It is also important to note that wasting prevalence is sensitive to seasonality and, therefore, only represents a fixed snapshot at the time of data collection, which might not reflect the situation throughout the year and over the years. Additionally, time of data collection of wasting, price, and expenditure data was often not aligned, likely weakening significantly the relationship between those variables. Finally, this analysis estimates cost and non-affordability of diets for a 5-person household and does not reflect individual needs. For example, women, girls, and children have higher and more specific needs than other household members and are at higher risk of their nutrition needs not being met where nutrient-adequate diets are not affordable. 17
Results
Analysis 1
Cost of nutrient-adequate diet
The nutrient-adequate diet of a 5-person household was, on average, 2.6 USD (or 41%) more expensive in drylands than in non-drylands (Figure 1). The cost difference between drylands and non-drylands was significant (p = .0105, see Table S3). This was robust to the use of the wider definition of dryland, including semiarid areas (P = .0287; see Table S4). The diet was more expensive in drylands than in non-drylands in Burkina Faso, Chad, Ethiopia, and Mali. For the aggregated Sahel region, the average cost was 2.2 USD (39%) more expensive in drylands as compared to non-drylands. The average energy-sufficient diet cost was also higher in drylands as compared to non-drylands, in all countries except in Cameroon and Mauritania, and about 0.6 USD more expensive in drylands than in non-drylands overall (data shown in Table S2). This difference was significant and robust to the use of a wider definition of drylands (p = .0105 and p = .0184 respectively; data shown in Tables S3 and S4).
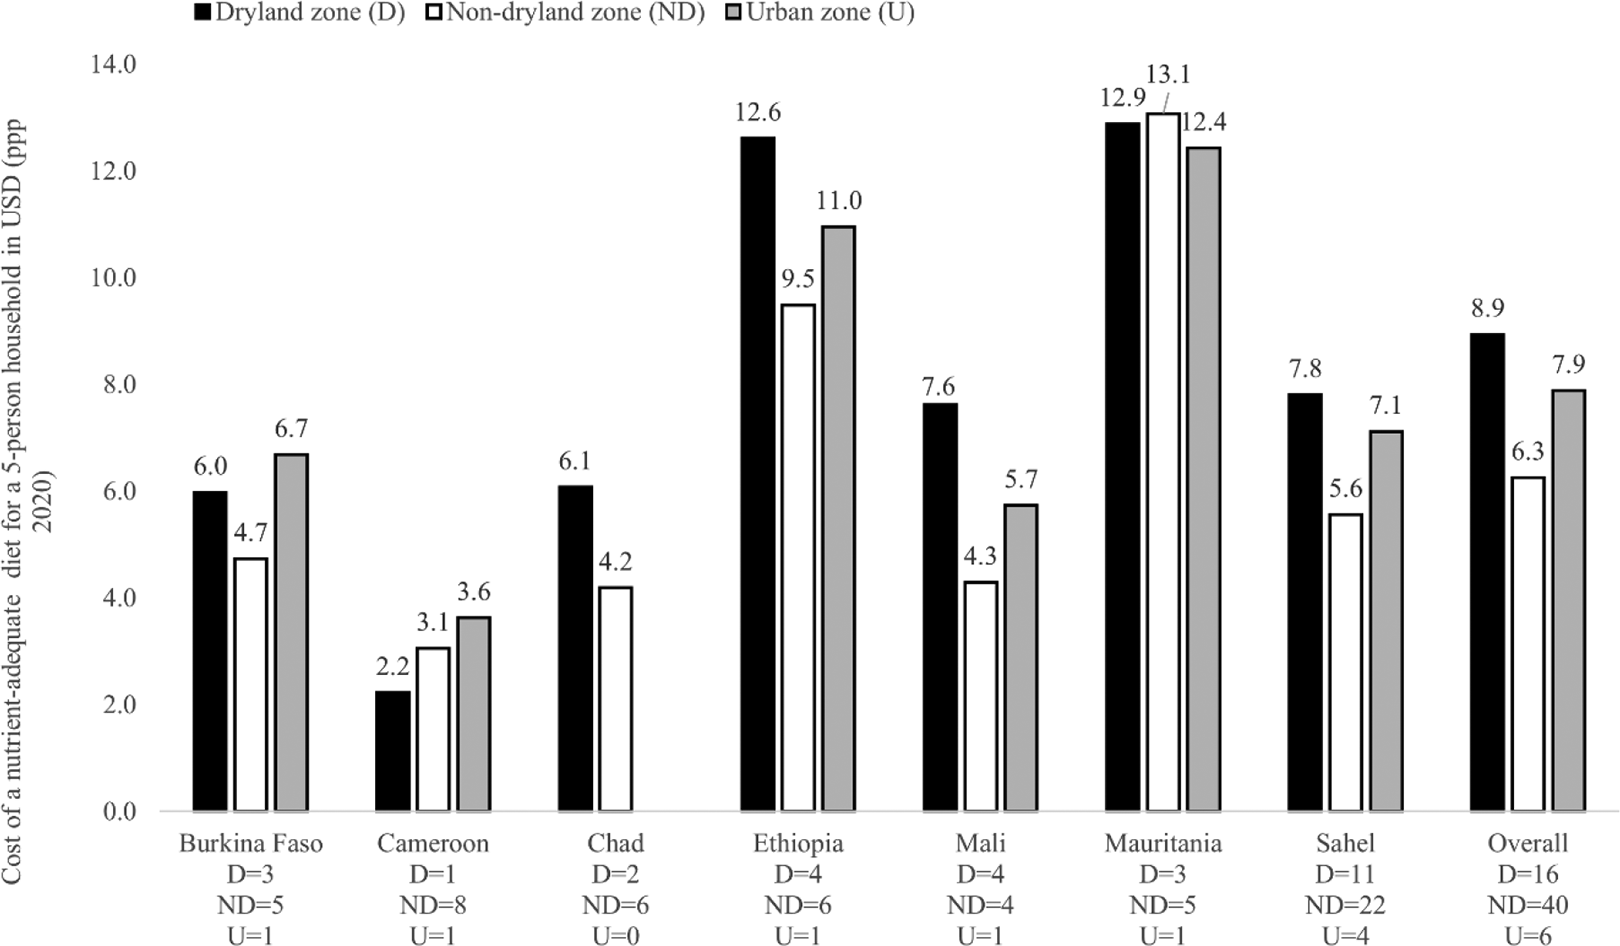
Nutrient-adequate diet cost (ppp 2020) by dryland types by country and overall.
Non-affordability of nutrient-adequate diets
In drylands, non-affordability of the nutrient-adequate diet was found to be very high, ranging from 55.3% to 89.0% (70.8% average) compared to non-drylands (ranging from 36.8% to 73.9%) or urban settings (ranging from 21.3% to 96.0% [note 5]) (Figure 2). This was true for all countries and overall, with average non-affordability about 16 percentage points higher in drylands. This difference was significant (P = .0006, see Table S3) and robust to the use of a wider definition of dryland (P = .0096, see Table S4).
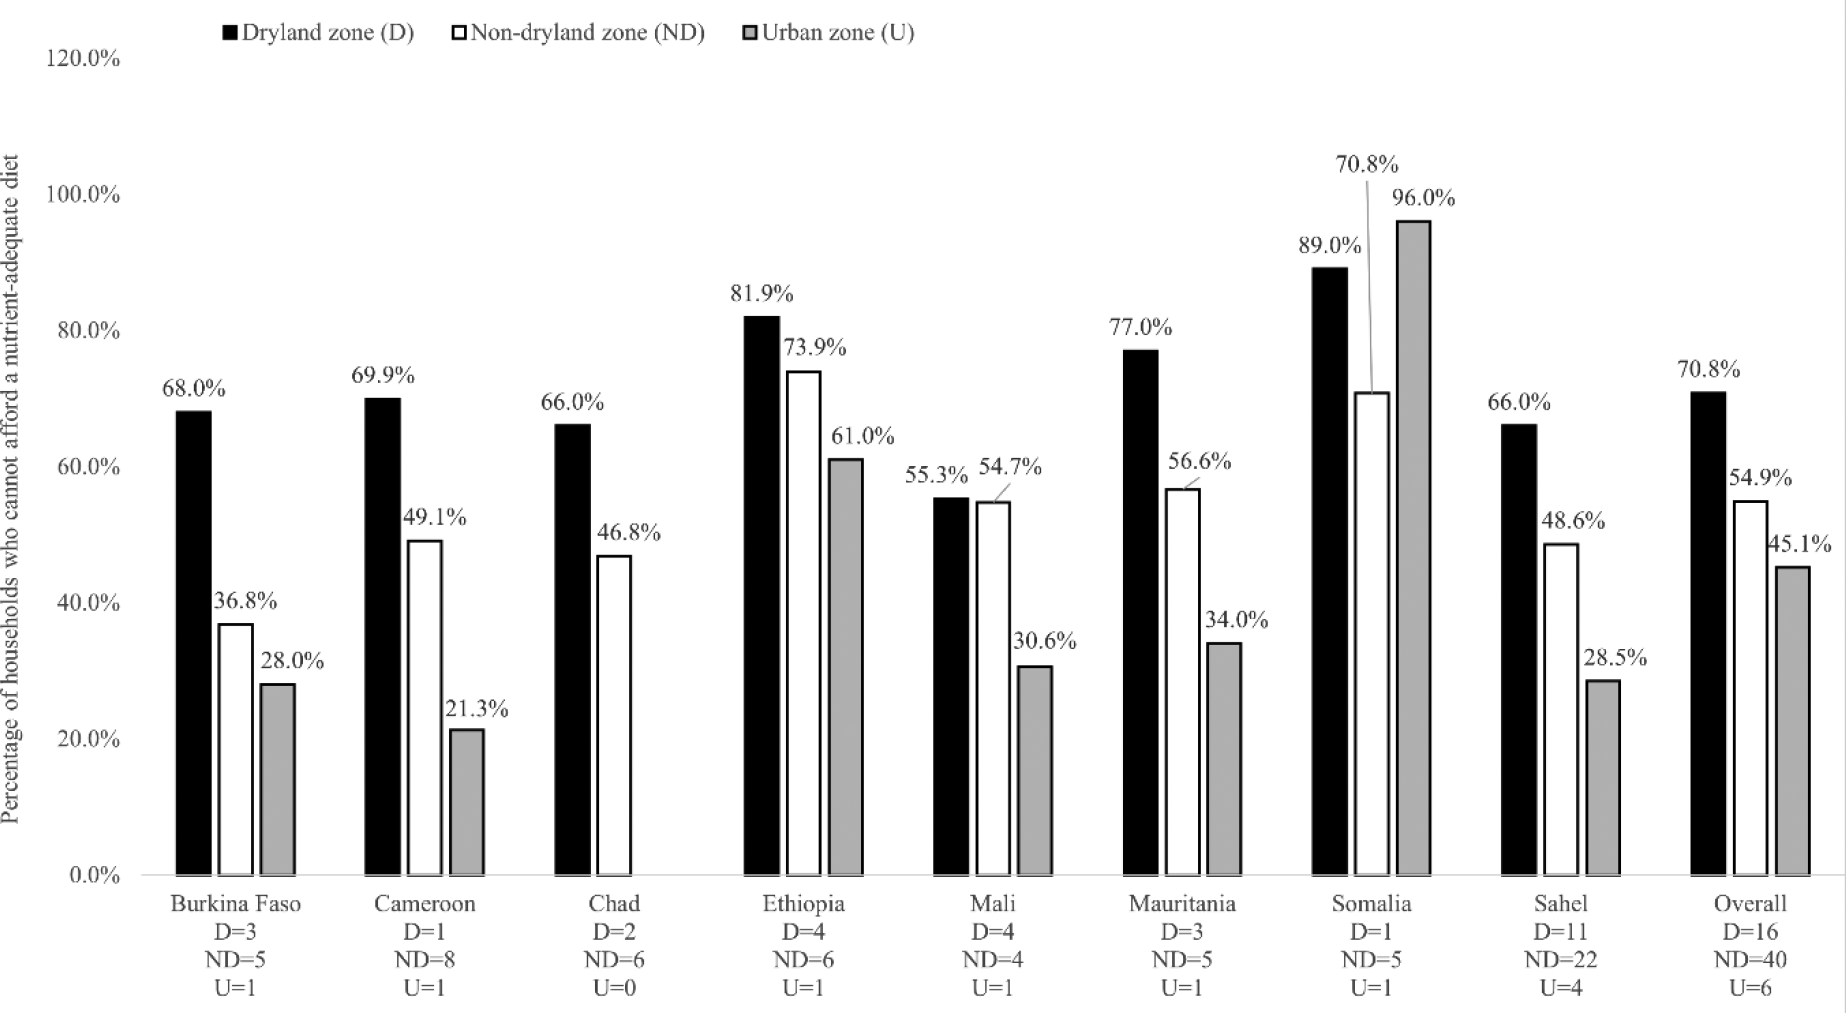
Non-affordability rates of the nutrient-adequate diet by dryland types by country and overall.
Analysis 2
Wasting and stunting were higher in drylands as compared to non-drylands in the countries included in this analysis (Figures 3 and 4). On average, wasting prevalence was 13.0% in drylands, above WHO’s 10% threshold for a “serious” situation in the GAM classification, 11 and 8.3% in non-drylands. Stunting was also higher in drylands (36.6%) than in non-drylands (31.4%). The stunting prevalence was higher than WHO’s 30% “very high” threshold in both drylands and non-drylands in the countries included. 11 Differences between drylands and non-drylands were significant for wasting (P = .0215, see Table S3) but only marginally for stunting (P = .0959, see Table S3). These differences were robust to the use of a wider definition of drylands for wasting (P = .0012, see Table S4) and stunting (P = .0026, see Table S3). Both wasting and stunting prevalence were lower in urban settings at 6% and 15%, respectively.
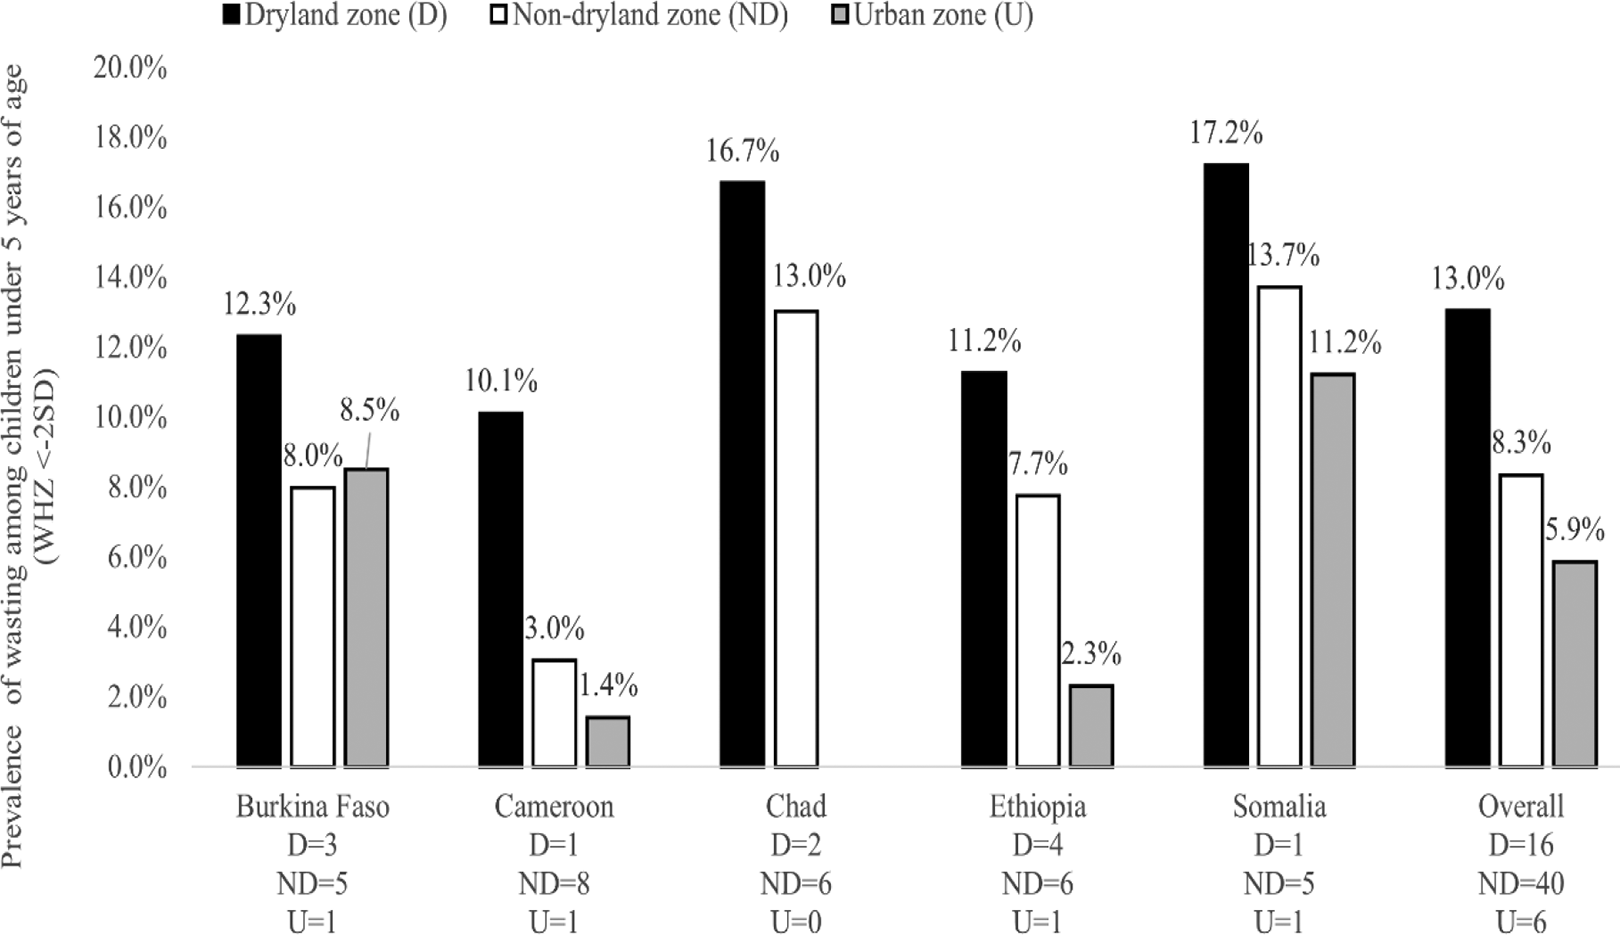
Wasting prevalence across drylands, non-drylands, and urban areas.
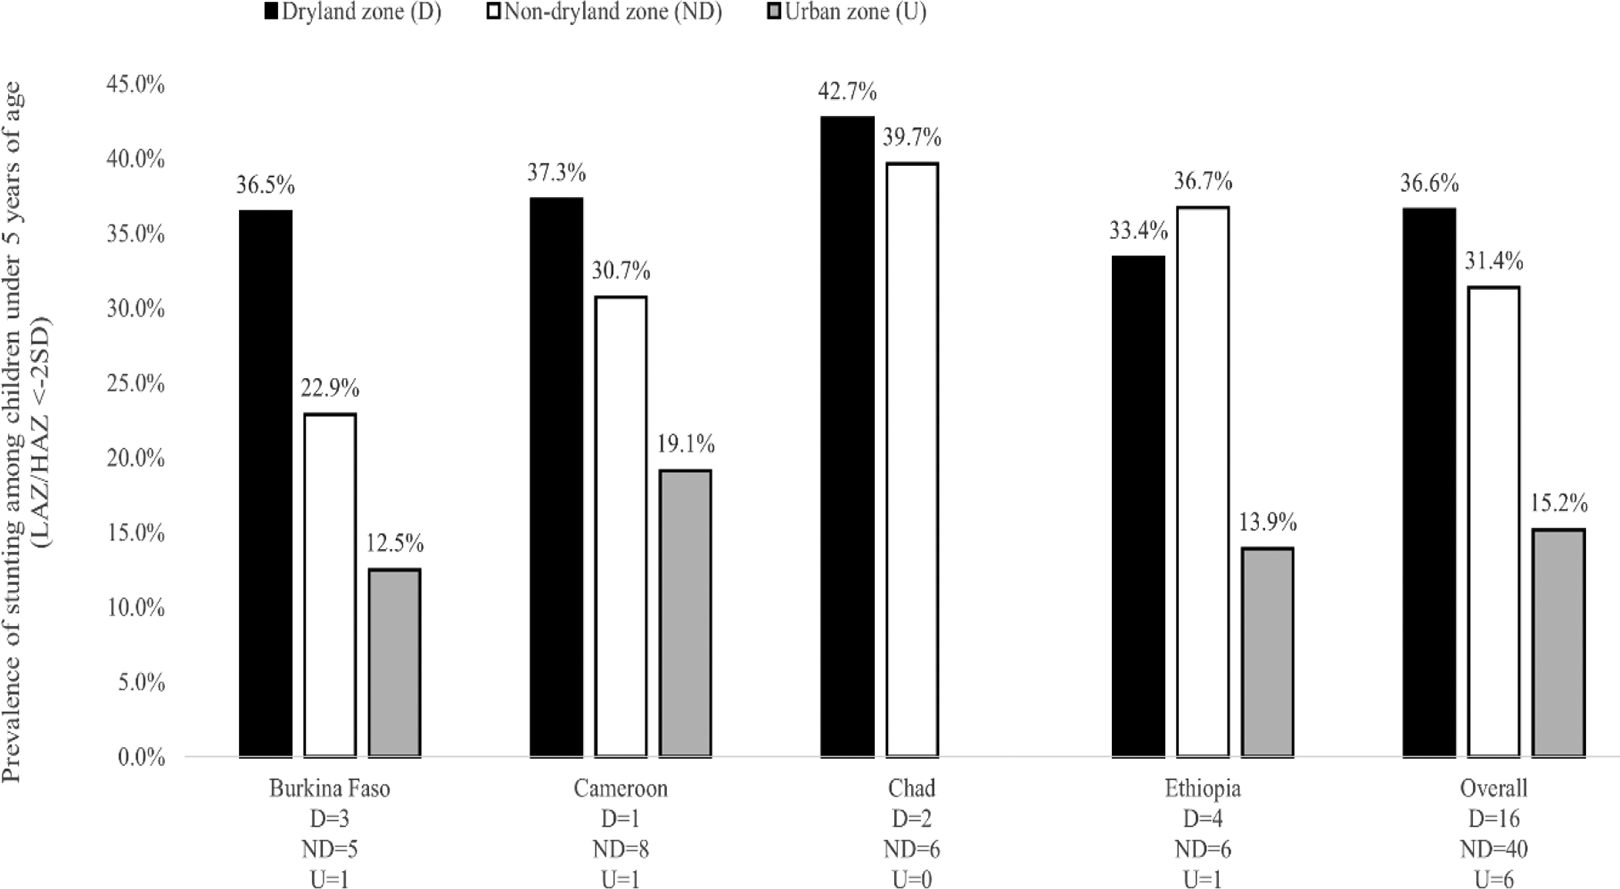
Stunting prevalence across drylands, non-drylands, and urban areas.
In drylands, wasting/stunting prevalence and non-affordability of nutrient-adequate diets were simultaneously high. This is shown by the circles in Figures 5 and 6. The 5 regions with wasting prevalence well above WHO’s 10% threshold for “serious” 11 (Somali and Afar in Ethiopia, Puntland in Somalia, the Wadi Fira/Ouaddai/Ennedi Est/Batha grouping in Chad, and Sahel region in Burkina Faso) were in drylands and have some of the highest non-affordability rates (more than 71%). Two outliers were noticeable in drylands: Dire Dawa and Harari in Ethiopia where wasting is relatively low (5.8% and 4.2%, respectively) but non-affordability very high (80.0% and 78.0%, respectively). Similarly, all drylands had a stunting prevalence close to or above WHO’s “very high” threshold of 30% 11 (except Dire Dawa) and high levels of non-affordability.
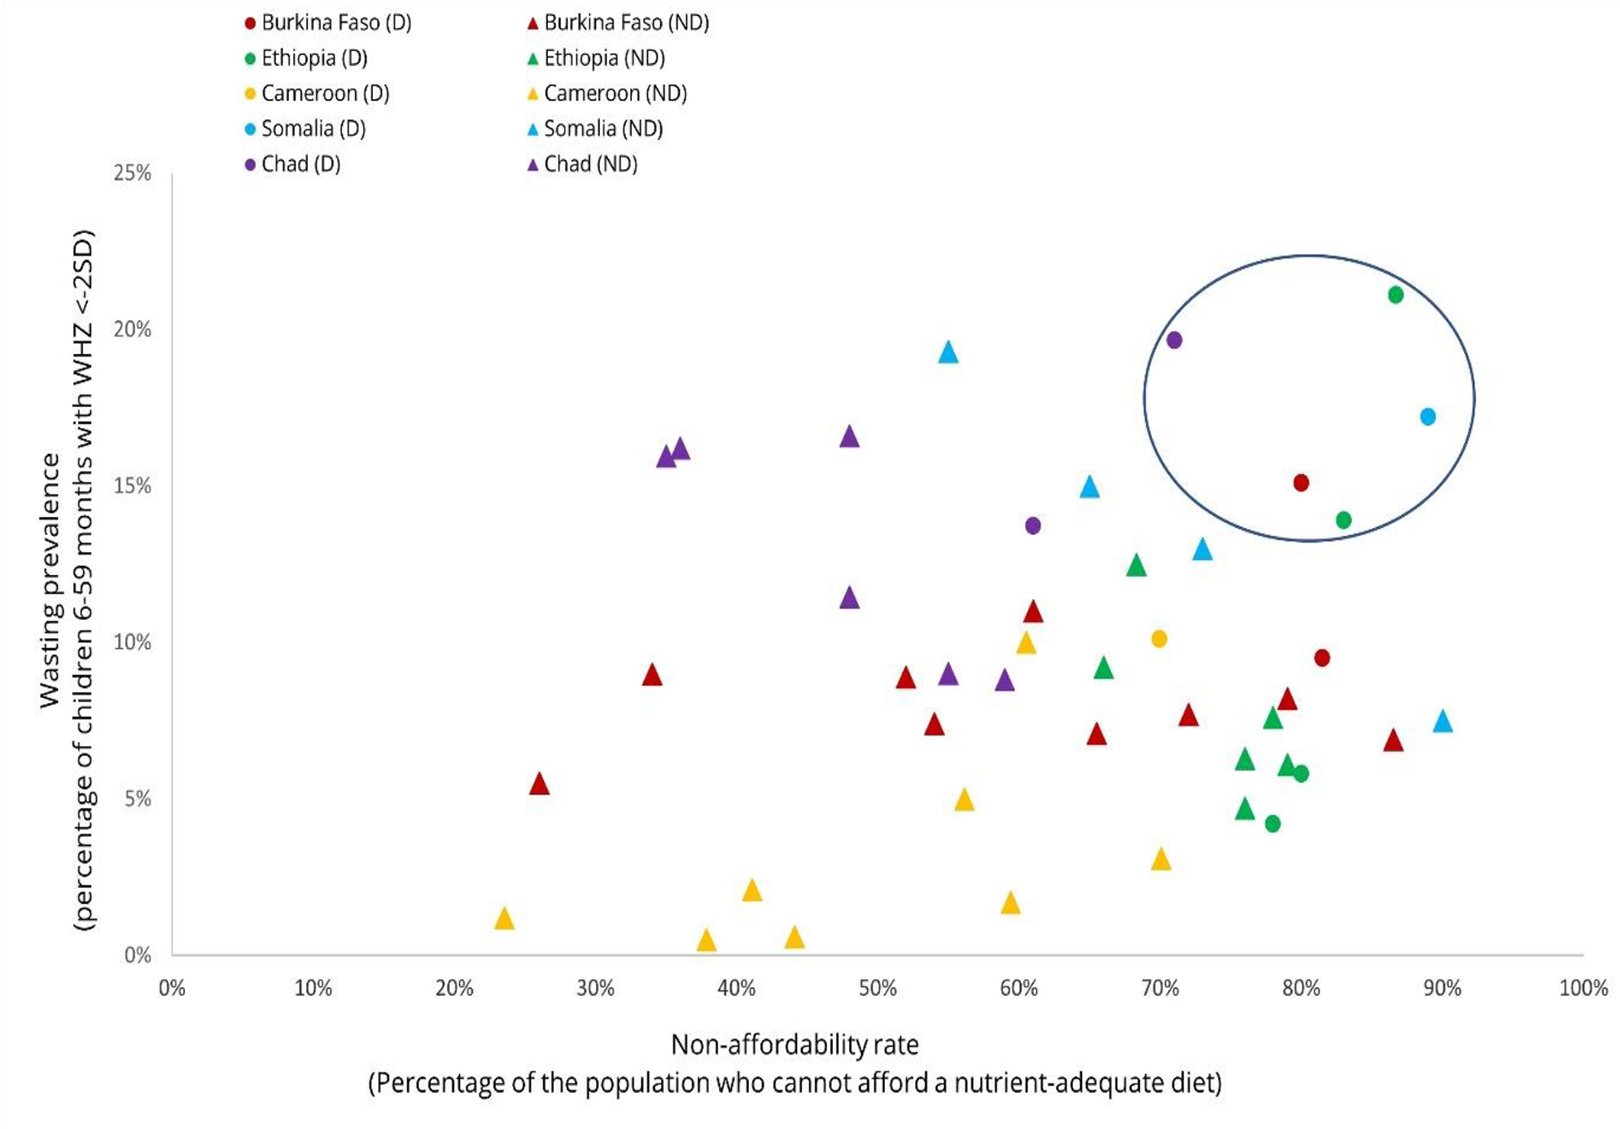
Scatter plot of wasting prevalence and non-affordability of nutrient-adequate diet by dryland type (dry (D), nondry (ND), and urban (U)).
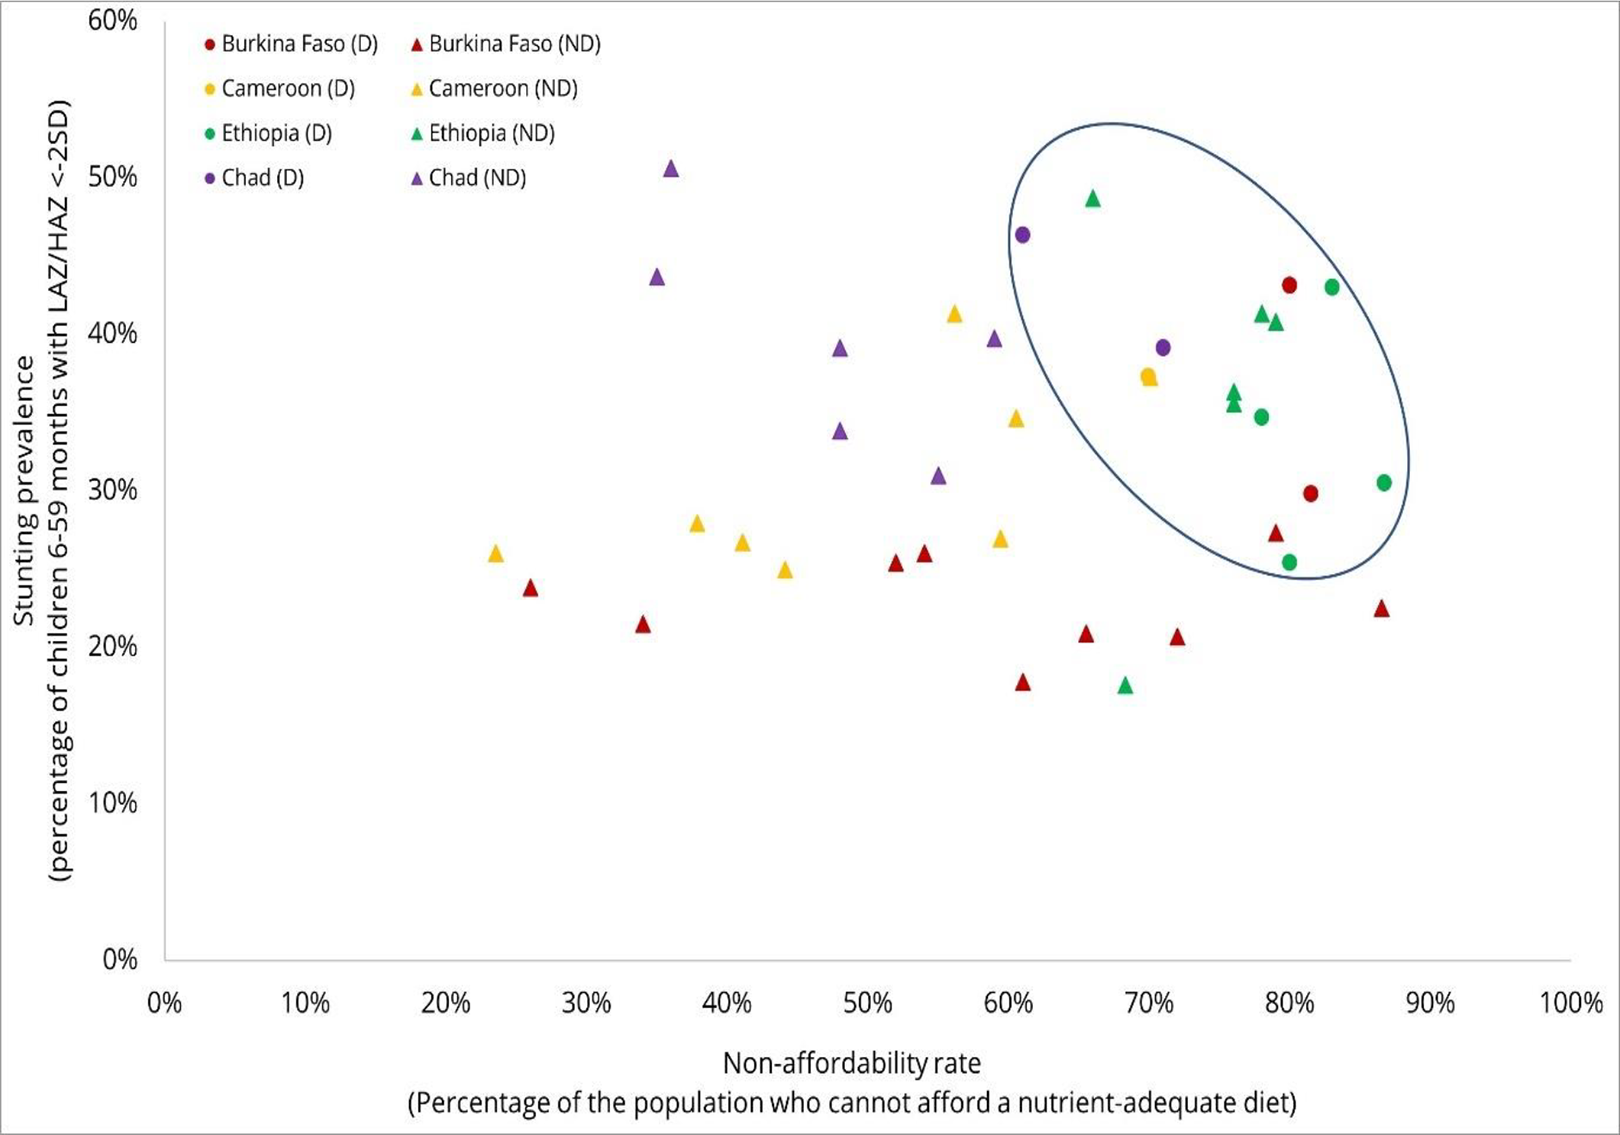
Scatter plot of stunting prevalence and non-affordability of nutrient-adequate by dryland type (dry (D), nondry (ND), and urban (U)).
In non-drylands, results suggested a diversity of scenarios in the relationship between wasting/stunting prevalence and non-affordability. For example, in the non-drylands of Tigray (Ethiopia), Boucle du Mouhoun (Burkina Faso), Jubaland (Somalia), and most province groupings in Chad, there was a combination of high wasting prevalence (more than 10%) but lower non-affordability (less than 65%). There was variation in stunting as well, such as in Ethiopia (eg, Amhara, Oromia) where stunting prevalence and non-affordability were, in some cases, as high as in drylands or in Chad where stunting was very high but non-affordability fairly low (eg, Salamat/Sila grouping, Guera/Chari Baguirmi grouping or Lac).
Analysis 3
Three key findings on strengthening systems thinking for better diets in drylands emerged from the synthesis of the FNG analyses from the 6 countries (note 6) included in this part of the review.
Cost and non-affordability metrics provided insights that enabled a better consideration of how the food environment affects people’s access to nutrient-adequate diets
The FNG analyses contributed novel information by estimating non-affordability of nutrient-adequate diets ranging from 55.3% to 89.0% (70.8% average) in drylands and was higher than in non-drylands or urban settings. The FNG analyses then unpacked the drivers of high non-affordability in drylands using secondary data review on the production, availability and cost of nutritious foods, food expenditure patterns, and consumer behaviours. 6 For instance, in Burkina Faso, the availability and cost of nutritious foods varied widely between non-drylands and drylands. In the dry Sahel region, green leafy vegetables, fruit, meat/fish/eggs, pulses, and cereals were, respectively, 71%, 43%, 93%, 22%, and 16% more expensive than in the nondry Haut-Bassin region. Only milk and dairy were found to be 18% cheaper in the Sahel region than in the Haut-Bassin region. Overall food availability was also lower in markets of the Sahel region, with an average of 80 food items per market where Haut-Bassin markets had over 120 food items per market. In particular, the Sahel region had fewer cereals, fish, fruit, and vegetables. Similar results were observed when comparing availability and cost of nutritious foods between other drylands and non-drylands in Burkina Faso and within other countries.
In addition, the FNG analyses examined the challenges of meeting specific nutrient needs and could highlight nutrients that were most difficult to cover from locally available foods (henceforth “limiting nutrients”), in each subnational unit. In all FNG analyses included here, limiting nutrients for children, women, and adolescent girls in drylands was primarily vitamin C, vitamin A, and folic acid compared to iron and vitamin B12 in non-drylands, highlighting specific constraints of the food environment in drylands, where fresh foods might be harder to find and access. Importantly, although limiting nutrients drive the costs of the nutrient-adequate diet, deficiencies can extend beyond these nutrients at such high levels of non-affordability. Recognizing those differentiated constraints was valuable to identify interventions toward improving specific nutrient intake.
Modeling of the contribution of, either individual and combined, multisectoral interventions informed policy and program development for improved diets in drylands
The FNG constituted a tool for examining the potential impacts of interventions to improve dietary intake. In the countries included in this article, the FNG analyses modeled packages of interventions, specifically for drylands, to identify the combination of nutrition-specific and nutrition-sensitive interventions that could best improve the affordability of nutrient-adequate diets. For this, and as per the FNG framework, stakeholders from multiple sectors were engaged to reflect upon the very high non-affordability of nutrient-adequate diets in drylands and discuss how different sectoral interventions could contribute to meeting nutrient needs.
In the FNG reports reviewed, multisectoral packages of intervention identified in drylands required a combination of livelihood-specific household and individual support to meet nutrient needs. Sectors involved and interventions modeled included (1) agriculture- and livestock-related interventions in pastoral and agro-pastoral areas to improve households’ access to fresh and animal-source foods as well as income; (2) social protection interventions such as cash transfers to increase income levels; (3) education interventions such as the provision of nutritious school meals; (4) health and private-sector interventions to increase the nutrient content of foods or to meet specific nutrient needs from fortification and supplementation. This allowed to compare the potential outcomes of different interventions and assess their compounded effect when layered and implemented together.
For instance, in Cameroon’s Far North region, a dryland in which non-affordability of a nutrient-adequate diet is as high as 70%, a package of multisectoral nutrition actions included the provision of micronutrient supplements for children aged 6 to 23 months, adolescent girls, and lactating women. It also included a nutritious school meal, the development of smallholder agriculture, seasonal in-kind food assistance, and a blanket supplementary feeding program for young children from food insecure households. In the modeling, this package could reduce the cost of the nutrient-adequate diet by 84%. If achieved at scale, this package could reduce non-affordability from 70% down to 9%.
Other examples of context-specific packages in Burkina Faso and Mali’s drylands included strategies that support livestock herding such as improving access to fodder and veterinary services, layered with promotion of dietary diversity through the consumption of locally available vitamin A- and vitamin C-rich fruit and vegetables, such as baobab or moringa leaves, jujube, and dried mango, and the consumption of animal-source foods such as fermented milk.
In contrast, as non-affordability was lower in nondry and urban settings, closing the nutrient gap required interventions adapted to agricultural or urban livelihoods. In Burkina Faso and Ethiopia, increasing linkages between health and agriculture was identified as necessary to improve access to and demand for locally available lower cost animal-source foods, with a high potential for poultry in Burkina Faso and small dried fish in Ethiopia. In the urban settings of Mali and Cameroon, linking private sector to social protection was identified as having the best potential for meeting limiting nutrients, through increasing access to fortified rice or wheat flour amongst urban poor.
Demonstration of sustained improved nutrient intake across the emergency, resilience, and development continuum
Given the structural causes of malnutrition in drylands, 3 the FNG modeled interventions across humanitarian, resilience, and development program platforms for all countries included in this review. On the one hand, modeling included short-term humanitarian seasonal support such as the provision of specialized nutritious foods to prevent the deterioration of nutritional status children younger than 5 years and pregnant and breastfeeding women, and food distributions in-kind or cash to protect household food security. On the other hand, models also included longer term actions to address the root causes of malnutrition, rebuild food systems, and ensure sustainable livelihoods. Modeling these different packages showed how they could best complement each other in times of shocks and over time and demonstrated to stakeholders the value of working across the humanitarian-development nexus for nutrition. As shown in the Cameroon’s Far North example above, addressing high non-affordability called for multisectoral consensus and collaboration across the humanitarian-development continuum, through optimal layering and sequencing of nutrition specific and sensitive actions, according to agriculture and livestock calendars and to phases of the shock response.
Discussion and Recommendations for Nutrition Action in Drylands
Unaffordable Diets and Malnutrition in Africa’s Drylands: System
Our analysis explored specific characteristics of the food environment of Africa’s drylands, particularly the dimensions of cost and affordability of diets. This article also includes a review of the in-depth diagnosis of drylands’ food environment from the FNG secondary data analysis to unpack the high cost and non-affordability of diets in drylands. 6 This diagnosis allowed to identify the potential factors that underpin variations in prices, availability, and affordability of different food groups to improve on those in a more systematic manner.
In the countries reviewed here, climatic conditions strongly influence the food environment, resulting in specific barriers to nutrient intake. As presented in the Burkina Faso example in analysis 3, high cost of nutrient-adequate diets in drylands is linked to lower availability and higher cost of nutritious foods. This points to bottlenecks in the supply chain of those foods in drylands. Insufficient local production, partially linked to livestock-focused livelihoods, results in a reliance on supply from elsewhere. 18 Additionally, the lack of infrastructure (transport, cold chain, etc), which was highlighted across all FNGs, hinders the reliability and quality of food supply. This particularly affects fresh foods that are more sensitive to arid climate conditions and less transportable from more distant areas than energy-dense staple foods. 18 In contrast, non-drylands and urban settings benefit from improved food supply conditions and infrastructure that reduce food prices and improve quality through reduced transport costs and food losses, better logistics, and higher number of traders increasing competition. 19 In addition, non-affordability was significantly higher in drylands, with an average of 70.8% of households who could not afford a nutrient-adequate diet. As food prices are relatively high in Africa compared with other regions and to nonfood items, low purchasing power limits households’ access to foods of sufficient quality and quantity. 20 These dynamics are further exacerbated in Africa drylands where an important share of the continent’s poor resides. 2
Implication for Malnutrition
Affordability is an important factor for ensuring diet quality, and lower diet quality is strongly associated with food insecurity and different forms of malnutrition. 1,5 The article finds that wasting, stunting, and non-affordability are simultaneously very high in drylands, while this relationship appears more nuanced in non-drylands. However, this does not mean that non-affordability is less of a cause of undernutrition in non-drylands: Where non-affordability is high, risk of undernutrition is high as adequate diets are beyond reach and where non-affordability is lower, undernutrition may not yet be low as other factors, including behavioral and intergenerational ones, may interfere.
This article sheds some light on the complex links between non-affordability and persistent undernutrition, which are currently underrated and would need to be further unpacked and better accounted for to formulate adequate solutions to prevent malnutrition, particularly in Africa’s drylands. However, this article also points to consumer behaviors related factors in areas where nutrient-adequate diets may be more affordable but where undernutrition rates remain high such as the regions of Salamat and Sila in Chad. In all cases, it calls for the formulation of tailored solutions to the different realities coexisting in the same country or region as shown by the disparities between dry and non-drylands.
Systemic Approach
On the one hand and as discussed above, food environments in drylands are characterized by a fragile supply of nutritious foods. On the other hand, drylands are also characterized by high poverty prevalence. 3 This points to the fact that purchasing power might be too low to generate demand for nutritious food in these highly vulnerable areas. In these contexts, supply and demand interact negatively within a system, resulting in very high non-affordability. 5 These dynamics reflect important structural and basic drivers of poor diet quality, which need to be addressed by deep systemic transformations, as outlined in the revised malnutrition framework in drylands. 3
Processes such as the FNG, which combine a stakeholder engagement and modeling approach, are essential to inform and build consensus on possible transformation pathways for drylands.
Livelihoods-Focused Analysis
The revised malnutrition framework in drylands also highlights the importance of failing or vulnerable livelihoods as determinants of poor nutritional outcomes. 3 This is well reflected in the FNG process where, in 5 out of 7 countries presented in this article, experts requested analyzing the nutritional situation using livelihood, instead of administrative, zones (note 7). Interestingly, results presented in this article show that the difference in non-affordability between drylands and non-drylands is highest in Burkina Faso (31 percentage points) and Mauritania (20 percentage points) where livelihood zones were used. This suggests that livelihood zones might provide a more accurate framework for vulnerability in countries where drylands and non-drylands coexist, particularly where livelihood zones and administrative boundaries do not coincide. Additionally, rethinking systems transformation from a livelihood perspective requires evidence. As highlighted in this analysis, design of data collection and reporting systems limited to administrative regions (when subnational data exist) constrain the analyses that can be conducted at the livelihood zone level.
To formulate context-specific programs and policies for food and nutrition in drylands, livelihoods should, therefore, be considered from the start as part of the study design phase and data collected more systematically at that level too.
Multisectoral Approaches
Findings around reinforcing supply and demand drivers of non-affordability highlight the need for interventions across multiple sectors and stakeholders to effectively minimize persisting negative outcomes, such as poor dietary intake. Examples from the FNG analyses, such as the model from Cameroon, show that no single intervention or sector could improve non-affordability on its own. However, multisectoral packages were found to reduce non-affordability to below 10%, emphasizing the reinforcing power of and virtuous circles created by multisectoral approaches. Additionally, in Cameroon, where non-affordability is much higher in drylands (70%) than in non-drylands (49%), different packages were designed to account for these varying levels of vulnerability and livelihoods and ensure that the same goal could be reached (a non-affordability of less than 10%) despite different starting points between those areas.
The high non-affordability rates in drylands require food, health, education, and social protection sectors to engage and reflect on the integrated responses needed across different systems. Additionally, interventions across multiple sectors need to be combined and layered to better reach the most vulnerable households and specific target groups within them and enable greater access to nutritious food. Different combinations of interventions should be selected based on the context of vulnerability, malnutrition, and non-affordability of nutrient-adequate diets. As highlighted above, these responses should also reflect livelihood specificities as important determinants of the specific food environment in drylands.
Shocks
Africa’s drylands are often remote and marginalized, characterized by weaker institutions, limited access to basic services, and general structural vulnerabilities. 2 In addition, drylands suffer from recurrent and compounded shocks such as droughts and conflict, adding further pressure on already challenging food environments. As such, attention to shocks and their effects on diets is critical in these contexts. 21 This is particularly important as drylands will be exposed to increasing climatic shocks. 22 As shown in the Cameroon example in analysis 3, the FNG models resilience-building programs and interventions that support livelihoods to improve access to nutritious foods, sequenced with protective packages of food and nutritional assistance to prevent the deterioration of the nutritional status after a shock.
Shock-responsive and resilience-building strategies are needed to reduce nutritional vulnerability in drylands and mitigate the impact of shocks on diets and malnutrition outcomes. As fragile environments, integrated responses in drylands should cover the full development-emergency continuum.
Stakeholder Engagement
Analysis 3 raises the importance of the stakeholder engagement process and of building consensus across food, health, education, and social protection systems. The FNG is innovative in combining an analytical approach with a structure to actively engage stakeholders in-country. By highlighting novel local evidence that builds consensus on the unique systemic bottlenecks of drylands, and by using this evidence to stimulate a multisectoral dialogue on the layered policies and programs required to improve the affordability of nutrient-adequate diets in drylands, the FNG analyses provides a framework for governments and their partners to apply a systems approach to nutrition in drylands.
In drylands where non-affordability levels are so high, coordinated efforts are required to achieve the structural system-wide transformational changes needed for the prevention of malnutrition. Engaging stakeholders early on to identify their contribution and holding them accountable is an essential steppingstone toward impactful, sustainable solutions to bring populations that are so far from being able to access nutrient-adequate diets, closer to meeting them.
Conclusion
A subnational analysis focusing on cost, non-affordability of nutritious diets, and their drivers in drylands can identify specific challenges to food security and nutrition across systems. When combined with multistakeholder review and dialogue, as well as modeling of possible strategies, this analysis can be instrumental to design a path forward for the shorter and longer term. Such country-led processes are practices that should be further promoted in drylands. This is effective in engaging governments and partners and leads to consensus on the priority actions for transformative, system-wide changes toward improved diets and nutrition.
Supplemental Material
Supplemental Material, sj-docx-1-fnb-10.1177_03795721231178065 - High Non-affordability of Diets and Malnutrition in Africa’s Drylands: Systems Analysis to Guide Action
Supplemental Material, sj-docx-1-fnb-10.1177_03795721231178065 for High Non-affordability of Diets and Malnutrition in Africa’s Drylands: Systems Analysis to Guide Action by Nora Hobbs, Julia Hug and Saskia de Pee in Food and Nutrition Bulletin
Supplemental Material
Supplemental Material, sj-docx-2-fnb-10.1177_03795721231178065 - High Non-affordability of Diets and Malnutrition in Africa’s Drylands: Systems Analysis to Guide Action
Supplemental Material, sj-docx-2-fnb-10.1177_03795721231178065 for High Non-affordability of Diets and Malnutrition in Africa’s Drylands: Systems Analysis to Guide Action by Nora Hobbs, Julia Hug and Saskia de Pee in Food and Nutrition Bulletin
Supplemental Material
Supplemental Material, sj-docx-3-fnb-10.1177_03795721231178065 - High Non-affordability of Diets and Malnutrition in Africa’s Drylands: Systems Analysis to Guide Action
Supplemental Material, sj-docx-3-fnb-10.1177_03795721231178065 for High Non-affordability of Diets and Malnutrition in Africa’s Drylands: Systems Analysis to Guide Action by Nora Hobbs, Julia Hug and Saskia de Pee in Food and Nutrition Bulletin
Supplemental Material
Supplemental Material, sj-docx-4-fnb-10.1177_03795721231178065 - High Non-affordability of Diets and Malnutrition in Africa’s Drylands: Systems Analysis to Guide Action
Supplemental Material, sj-docx-4-fnb-10.1177_03795721231178065 for High Non-affordability of Diets and Malnutrition in Africa’s Drylands: Systems Analysis to Guide Action by Nora Hobbs, Julia Hug and Saskia de Pee in Food and Nutrition Bulletin
Footnotes
Acknowledgments
The authors would like to acknowledge the contribution of all government partners, World Food Programme colleagues, and country stakeholders from Burkina Faso, Cameroon, Chad, Ethiopia, Mali, Mauritania, and Somalia for their contribution, technical expertise, and extensive support during the FNG analyses. We would also like to thank the donors which enabled WFP Country Offices to carry out FNG analyses. We also thank colleagues from the Systems Analysis for Nutrition team for their efforts in providing the data which makes up the FNGSTAT database. We would like to express a special thank you to Zuzanna Turowska and Janosch Klemm for providing the FNGSTAT data as well as Sabrina Kuri for supporting in sourcing part of the malnutrition data.
Author Contributions
NH: Conceptualization, methodology, analysis, Writing. JH: Conceptualization, methodology, analysis, visualization, writing. SdP: Conceptualization, supervision, writing—reviewing and editing, funding acquisition.
Declaration of Conflicting Interests
The author(s) declared no potential conflicts of interest with respect to the research, authorship, and/or publication of this article.
Funding
The author(s) received no financial support for the research, authorship, and/or publication of this article.
Supplemental Material
Supplemental material for this article is available online.
Notes
References
Supplementary Material
Please find the following supplemental material available below.
For Open Access articles published under a Creative Commons License, all supplemental material carries the same license as the article it is associated with.
For non-Open Access articles published, all supplemental material carries a non-exclusive license, and permission requests for re-use of supplemental material or any part of supplemental material shall be sent directly to the copyright owner as specified in the copyright notice associated with the article.