
Abstract
Background:
Information on food consumption, dietary diversity, and nutrient inadequacies are key for informing food security and nutrition programming. Household- and individual-level data together provide the most complete information, but individual dietary modules are not always feasible in humanitarian contexts due to cost and time constraints.
Objective:
This article asks to what extent it is possible to use food consumption data which is commonly collected at household level through food security and vulnerability surveys, to assess the household’s access to vitamin A and iron.
Methods:
The validation analysis uses household food consumption and expenditure surveys from Guatemala, Honduras, Nepal, and Uganda and the adult male equivalent approach for calculating nutrient access.
Results:
The results show a positive significant correlation between the frequency of consumption and adequacy as estimated from comprehensive household food consumption modules, with correlation in the range of 0.4 to 0.7. Frequency thresholds for distinguishing between adequate and inadequate nutrient access, based on how often foods rich in the relevant nutrient are eaten during 1 week, mostly fulfill standard sensitivity and specificity criteria.
Conclusions:
The article concludes that in humanitarian contexts, a frequency-based proxy for nutrient access based on household data commonly collected in emergency assessments and through monitoring systems can be used and can support this particular data gap. As a rule of thumb, a frequency threshold of 7 should be used for vitamin A and of 12 for iron.
Keywords
Introduction: Background
Information on food consumption, dietary diversity, and nutrient inadequacies are key for informing food security and nutrition programming. In humanitarian contexts, outputs from vulnerability assessments are crucial to inform rapid but accurate responses to address food insecurity and drivers of nutrition problems. Data on dietary diversity are essential in the analysis. Methods of assessing nutrient intake, such as detailed diet diaries or 24-hour dietary recalls for individuals, are cumbersome and expensive, and data are rarely available at regional or subnational level. Thus, it is helpful to understand how food consumption data that are collected in light household surveys can be used to proxy the most likely nutrient inadequacies.
Others have also tried to identify proxy indicators for adequacy of food intake. A study in southeastern Mali weighted individual food intake and compared this to simple food counts. One of the main conclusions from this work was that food scores can give “a fairly good assessment of the nutritional adequacy of the diet.” 1 In a rural area in Mozambique, another simple food recall method was assessed for the same purpose. In this approach, different food groups were assigned different weights based on nutrient density and typical portion size. Also, this study concluded that such an approach was useful. 2,3 With the view to validate the Food Consumption Score (FCS), Wiesmann et al 4 and Lovon and Mathiassen 5 asked whether a frequency-weighted score based on 8 food groups can be used to assess adequacy of calories consumed. Although the score and caloric consumption are well correlated, the studies were not able to identify well-defined thresholds for the former. Meanwhile, Arimond et al 6 asked whether a simple food group diversity score (the number of food groups eaten in a day) can be used to predict women’s adequacy of nutrient intake. Analysis resulted in the development of the dichotomous indicator Minimum Dietary Diversity – Women (MDD-W), with minimum 5 of 10 food groups to distinguish between inadequate and adequate dietary diversity. This has been inserted into certain household surveys—for example, the Global Alliance for Improved Nutrition methodology for coverage assessments of fortification programs. The resulting Fortification Assessment Coverage Toolkit includes a household questionnaire with an individual dietary diversity module from which MDD-W and dietary diversity of children aged 6 to 23 months can be derived.
The objective of the present study is to assess whether, from household-level data, the consumption frequency of a food group rich in a certain nutrient can be used as a proxy for household access to that nutrient. In humanitarian contexts, dietary data from households are more readily available than data from individuals. We aim to highlight those households that do not access enough quality food to meet their collective requirement for that nutrient by looking at 2 key nutrients separately. In our attempt to assess proxies for nutrient access, the study focuses on the household and not on individuals and looks at consumption over a week rather than just a single day. We also ask whether thresholds can be set for the frequency of consumption to identify groups of households whose nutrient access is too low. Although such a proxy will not be able to flag whether there are likely inadequacies in nutrient intake at individual level, it could flag households where the overall access is not sufficient to meet the total nutrient requirement of its members.
The UN World Food Programme (UN WFP) undertakes a wide range of data collection exercises every year, particularly in emergency situations. Central to each of them is information on food consumption—most commonly at the level of the household. Information on the number of days that foods from specific food groups are eaten in a week by the household is recorded. This information is used to build WFPs corporate food security indicator, the FCS, which is a composite score based on dietary diversity, food frequency, and relative nutritional importance of different food groups. It is used to categorize households into groups with adequate or inadequate food consumption, the thresholds being determined based on the frequency of the scores and is an essential component in identifying areas or populations in need of food assistance. The information gathered to construct the FCS can be further exploited to inform on intake of nutrient-rich food groups within the household. Obvious shortcomings in using household-level data to estimate nutrient intake within the household are that the analyst must make assumptions about food allocation between members in the household, and it cannot be assumed that vulnerable individuals within the household meet their requirements even if the nutrient-rich food groups are consumed within the household. If assessment results show that the household has limited consumption of food groups rich in micronutrients, it infers that the optimal dietary quality is not being met. Being able to use household data is essential, particularly in emergency settings, since food security assessment design is not always suitable or convenient to include individual-level food consumption indicators as it has implications on sample size, data collection burden, and budget. The analytical outputs provide one piece of information that WFP uses prior to program design and it is important to note that even if a household reports consumption of nutrient-rich food groups, it does not infer that all the individuals within in the household—and especially the most nutritionally vulnerable children younger than 2 years of age, pregnant and lactating women, and adolescent girls—are consuming those nutrient-rich food groups.
In this article, we assess to what extent the data collected to construct the FCS can be utilized to report on likelihood of vitamin A and iron inadequacies. These nutrients were selected due to their role in childhood growth, development and health as well as the fact that data on consumption of foods rich in those nutrients are readily extractable from the data. Vitamin A deficiency increases risk of morbidity and mortality. This risk is highest among young children and, if prevented among those younger than 5 years, can reduce mortality by up to 23% and infectious diseases such as measles, diarrhea, and malaria up to one-third. Iron deficiency, which contributes to anemia and many other health problems, affects approximately 25% of the world’s population, mainly preschool children and women. 7
For the validation analysis, we use household consumption and expenditure survey (HCES) data and the adult male equivalent (AME) approach for estimating the individual nutrient adequacy levels. Although the study aims to assess whether the collective requirement of nutrients is met at household level, we need to first estimate the individual adequacy levels as the different individuals within the household have differing requirements. The HCES are regularly produced in developing countries where micronutrient deficiencies are of great concern and are a much cheaper alternative to individual 24-hour recall surveys. 8 Several papers use HCES data as an alternative strategy for estimating nutrient intake patterns of population groups. For example, Fiedler and Afidra 9 discuss vitamin A consumption in Uganda using HCES data. Bermudez et al 10 estimate apparent intakes of vitamin A, iron, and zinc based on HCES in Bangladesh, and Fiedler and Helleranta 11 illustrate how HCES data can be used for a food fortification program in Guatemala. Jariseta et al, 12 Coates et al, 13 and Sununtnasku and Fiedler 14 assess whether HCES data can be used to make inferences about nutrient adequacy assuming that food is distributed within the household according to energy requirement, using the AME approach. Jariseta et al 12 use data from HCES and 24-hour recall data undertaken for different households at different points in time, whereas Coates et al 13 and Sununtnasku and Fiedler 14 compare results from 2 such surveys administered to the same households. Jariseta et al 12 use data from Uganda and conclude that HCES data are not only “a close proxy for 24-hour recall data in estimating nutrient density” but also allowed “to identify the same major nutrient inadequacies and the same order of magnitude of those inadequacies.” Coates et al 13 validate the AME method for estimating nutrient intake (of calories, protein, iron, and animal source protein) in Bangladesh and Ethiopia. They find that the AME method is generally accurate within 10 percentage points of individually reported iron intake, but less accurate for infants in Bangladesh. They conclude that energy-based AME estimates from household data can provide a useful proxy for average intake for most demographic groups in both countries but that “one risks missing potentially useful information about differences between one country or region and another in the pattern of distribution.” Sununtnasku and Fiedler 14 analyze another data set from Bangladesh. They consider 4 micronutrients including vitamin A and iron. They find that more than 97% of the population has the same estimated prevalence of adequate and inadequate vitamin A and iron intakes using the 2 survey tools. The difference is largest for the children below 3 years with 13% inconsistent adequacy status. They conclude that the results are “remarkably consistent.” Although these 3 studies provide support for using HCES data for nutrient analysis and the AME approach for food and nutrient distribution within the household, they urge researchers to make similar validation studies in more countries to be able to arrive at more general conclusions. Moreover, Fongar et al 15 finds that household-level dietary indicators are positively correlated with most individual-level dietary indicators, including micronutrient intakes. Berti 16 reviews a total of 28 articles analyzing intrahousehold distribution of food. The purpose of this review is to make general inferences of using household-level data for food fortification analysis. Although there are several difficulties in comparing these studies, the review concludes that “household-level food consumption data can be used to roughly approximate food intake at the individual group level” but that “for evaluation purposes, studies at the individual level are still needed to assess the real contribution of the fortified foods to increasing micronutrient intakes.”
Information from the analysis of the FCS is used to flag households and geographical areas where consumption of nutrient-rich food groups is low and where more detailed data are required.
Based on the finding that HCES could provide a close proxy for estimating nutrient adequacy, the hypothesis is simply that the frequency in consumption of foods rich in a specific nutrient will provide a good indication of the presence of that nutrient in the overall household diet and can therefore be used to proxy overall access level of that nutrient.
All HCES data sets used include comprehensive information on consumption of food items that is used to calculate quantities and requirements of each nutrient for each household. In addition, the consumption frequency of a food rich in the specific nutrient is derived for each household. This information is used to test whether a simple proxy can be used to assess the likely deficit of the nutrient at household level.
Countries were selected with the aim of representing regions with food and nutrient problems and required that HCES included a frequency module, that is, the number of days in a week the food groups were eaten so that the proxy could be constructed. Four countries from 3 regions are represented: Uganda, Nepal, Guatemala, and Honduras.
Methods
Data
The data sets for this analysis were obtained from Living Standard Measurement Surveys conducted by the national statistical offices in Uganda and Nepal and specific food consumption surveys undertaken in 2011 by WFP in 2 Central American countries: Guatemala and Honduras. All surveys asked, for each food item, a separate question on the number of days in the week the food was eaten and separate questions to capture the quantities eaten.
The original purpose of the Guatemala and Honduras studies was to validate the FCS thresholds against calorie consumption. The surveys were undertaken by WFP in cooperation with government institutions (Ministry of Agriculture, Ministry of Health, and the disaster management agencies). Samples were subsamples of larger Food and Nutrition Security Assessments being conducted in rural areas. For both countries, the sample frame covered most livelihood zones, giving a good picture of the diversity of dietary intake patterns in the rural areas of both countries. Samples were drawn by means of a 2-stage sampling procedure. Sample sizes were calculated based on the prevalence of poor and borderline FCS from previous WFP surveys at around 15%. After quality checks and cleaning, the final number of households with valid data for this analysis remained at 343 for Guatemala and 401 for Honduras. The relatively high number of trimmed households in Guatemala is related to the fact that a tropical storm hit areas covered by the study at the time of data collection. Data from the most affected department showed a greater number of outliers (in terms of energy consumption). This is likely because households affected by the disaster were not consuming their “normal” diet or not reporting their real consumption. Systematic cleaning of data, that is, where households with a particular consumption pattern are excluded from the data set (eg, those with the “worst” food consumption), is likely to have a bearing on the results. The dropping of households in Guatemala was systematic with respect to geography, meaning that we still have households with “all types of food consumption” included in our data set. The cleaning is, therefore, less likely to have implications on the analysis in this article.
The food consumption modules in the Central American countries recorded information from the household member responsible for food preparation, on the quantities of food consumed in the household during the 7 days preceding the data collection exercise, as well as the number of days each food was eaten. Quantities were recorded for a comprehensive list of 150 to 200 food items.
The surveys for Uganda and Nepal are nationally representative and consist of a larger sample of households. The Uganda National Panel Survey was administered to 2563 households in 2009/2010 17 and the Nepal Living Standards Survey 18 to 5988 households in 2010/2011. After cleaning of databases, the final number of households was 2452 and 5368 for Uganda and Nepal, respectively. Not all HCES data are suitable for nutrient analyses. Fiedler et al 19 provide a set of criteria for assessing their quality and relevance in this respect (note 1). One important issue is whether it is food acquired or food consumed that is reported. Both Nepal and Uganda report the latter, which is important for nutrition analysis. The recall period is 7 days in both surveys as recommended. The food consumption module in both surveys enquired about the monetary value and quantities, for a list of 50 food items for Uganda and 60 for Nepal. The recommendation is that these lists cover the most important foods in the country. However, organ meat (note 2), an important food group for iron-rich foods, is not specified in either Uganda or Nepal. The modules also included a question about the consumption frequency of each food item. In Nepal, a few questions asked about food groups, rather than individual food items (eg, households were asked about consumption of “green leaves” and “other vegetables”). This may influence the respondent’s precisions of the quantities as well as the days food groups were consumed.
All consumption modules aim to capture all foods eaten regardless of how they were sourced, that is, bought, grown, given as gifts, and not only food acquired in the previous 7 days. Although foods eaten by family members outside the home were collected in all surveys, these data were only used in the analysis for the Central American countries where the type of mixed dishes was specified and the composition was well known. In the Uganda and Nepal surveys, there is no information on the type of dish the household member(s) consumed outside the household. All questionnaires included a general demographic module to ascertain household sex and age distribution, which is needed to estimate the dietary energy requirements. In the Central American surveys, information on pregnancy and lactation were collected too.
Ideally, a comprehensive national food composition table is the best source for micronutrient contents of food items. However, this is not available for most of the countries. For Central American countries, the Food Composition Table compiled by the Institute of Nutrition of Central America and Panama contains energy and nutrient contents for a comprehensive list of food items. 20 It also includes compositional data for specific local foods and prepared dishes commonly consumed in the region. For Nepal, we used the Association of South East Asian Nations Food Composition Table. For food items not covered in the mentioned composition tables, the US Department of Agriculture nutrient database was used. For Uganda, the food composition database already compiled by Food and Agriculture Organization (FAO) for the use with the Uganda household surveys was used, and for some specific local foods the composition table compiled by Harvest Plus project was used. 21
In the Nepal survey, informed decisions were taken for a few food groups: For green leafy vegetables, the nutrient content was calculated by averaging spinach, mustard, and turnip greens—leafy vegetables typically eaten in Nepal. A similar approach was taken for “other” vegetables, fruits, and meat.
None of the questionnaires recorded information about the consumption of fortified foods. Moreover, the proportion of fortified ingredients in prepared foods (eg, bread, cookies) was unknown. Except in the case of vitamin A–fortified sugar in Guatemala where fortification is widespread, 22,23 all food items in the other countries were treated as not fortified.
Estimation of Nutrient Access
To translate household food consumption data into individual intake, we follow other studies (see eg 23 ) assuming that the household food is distributed proportionate to the energy needs of each household member, applying the concept of AME.
The AME is the individual’s daily energy requirement expressed as a percentage of the energy requirement of an adult male (19-30 years of age). The household’s AME is the sum of the individual AME of the household members. 24 We have assumed that moderate activity level and the AME ratio that was assigned to different individuals according to age and sex were the same across the 4 countries. There are alternative ways in which intrahousehold food allocation could have been treated (eg, in proportion to the respective vitamin A and iron requirement). We have chosen to follow the approach of assuming food allocation within the household according to the energy needs, as it has been tested to work well. 13,14
The procedure to estimate nutrient intake can be summarized as follows: First, household nutrient intake is the total nutrient content in the foodstuffs consumed by the households over the recall period; second, total household nutrient intake is divided among members using FAO/World Health Organization (WHO)/United Nations University 25 guidance on energy requirements to estimate how food is distributed within a household; and third, the nutrient intake adequacy for each household member is found by relating the estimated individual intake to the respective requirement, specific for each age group, sex, and physiological status.
For vitamin A and iron, the estimated average requirements (EARs), provided by FAO/WHO, 26 were used (note 3). Vitamin A adequacy was estimated as a percentage of the requirements covered by the estimated individual intake, while iron adequacy is estimated by the probability method. 27 Probability of adequate iron intake tables are adapted by bioavailability (following the approach in 28 ). Individuals are then assigned a mean probability of adequacy (MPA) by taking the average (ranging from 0 to 1).
Nutrient requirement adjustments for pregnancy and lactation are made for Central American countries only. Uganda and Nepal did not have the necessary data. There is no standard approach in how to deal with outliers, so we decided to follow Wiesmann et al. 4 as we rely on similar data and similar analysis. In this study, households with daily energy intakes below 500 or above 5000 calories per male adult equivalent were considered as outliers. In addition, households with specific nutrient intakes per person per day that exceeded the upper tolerable intake limits were dropped from the subsequent analysis. For vitamin A intake, households with more than 3000 µg retinol equivalents (RE) per AME were considered as outliers. 29 Only 1 household (Guatemala) was excluded based on the latter criteria, all other outliers were energy related.
The Nutrient-Rich Food Groups and Frequencies
Following FAO, 30 individual food items have been aggregated into nutrient-dense food groups by summing up the consumption frequency of the items belonging to each group. The food groups that are used in the WFP FCS module include those which are rich in vitamin A and those rich in heme iron. These groups form part of a total of 16 (note 4) different food groups consumed at household level. Vitamin A–rich foods consist of dark green leafy vegetables (DGLV) (note 5); yellow and orange roots and vegetables (YORV) (note 6); vitamin A–rich fruits; milk and dairy products; eggs; and organ meats. Iron-rich foods include heme iron-rich foods (red meat and poultry; offal; fish and sea food) and nonheme iron-rich foods (legumes and nuts; and DGLV). In the context of developing countries, where meat is often unaffordable for a significant part of the population and/or when a large proportion is vegetarian, it may be relevant to look at both heme and nonheme iron-rich foods. Looking at only heme-rich foods is also explored in the analysis.
In the FCS module, households report on the number of days per week a food group (as those listed above) is eaten. In the HCES, the households report the number of days per week each food item is consumed and not which days it was consumed. To proxy the frequency information collected in the FCS module, the food items frequencies in the HCES are summed for each food group and truncated at 7 so that the maximum frequency will be interpreted as “every day.” Clearly, if some items in the same food group are consumed in the same day, the detailed HCES module may overestimate the number of days the group is eaten, compared with a lighter module asking about the number of days a food group is eaten. To arrive at the final frequency of the nutrient-rich food groups, we sum the consumption frequencies in the nutrient-rich food group: 6 vitamin A–rich food groups and 5 iron-rich food groups (both heme and nonheme rich). The maximum frequency using this method is 42 for vitamin A–rich foods and 35 for iron-rich foods.
Excluding Small Quantities
Not counting frequencies when only small quantities are consumed has proven to improve the association between the benchmark and the proxy in several studies (see eg 6,31 ). The reason is that small quantities add insignificant amounts of nutrient but count heavily in the proxy, “frequency.” The analysis in this article is performed with and without small quantities, namely, those that average less than 15 g (see also 4,5 ).
Analytical Approach
In order to assess whether frequencies can be used to distinguish between likely adequacies of the respective nutrient, we use correlation and sensitivity/specificity analysis. We define the household nutrient access level as the mean adequacy level for individuals within the household.
For the sake of clarifying the link between household food and nutrient consumption, it may be useful to express the relationship formally. Consider for simplicity a household that only consists of a male (M) and a female (F). This analysis is generalizable to households with several members and children. Let z
j denotes the access of a given nutrient level to household j and
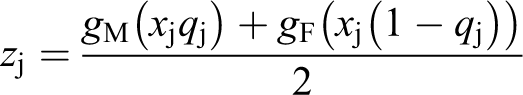
where
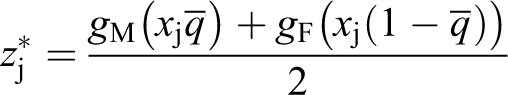
which can be calculated from the data. By first-order Taylor expansion, it follows that
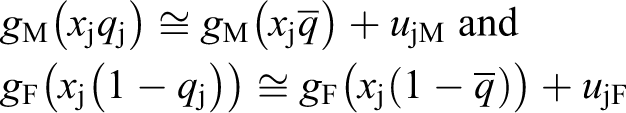
where
where
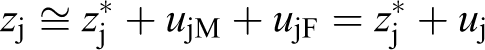
Given the assumptions above, we have that
We are interested in predicting the nutrient access in the households by means of the number of days foods rich in the nutrient were consumed, denote
where ρ is an unknown correlation coefficient and
Provided
Thus, if this condition holds, we can provide an unbiased estimate of the correlation between frequency in consumption and household access level.
Using descriptive statistics, we first describe the importance of the nutrient-rich food groups used in the analysis for the total intake of a specific nutrient. In other words, taking vitamin A as an example, we report the importance of DGLV, YORV, and vitamin A–rich fruits for total vitamin A intake. Further, as we are primarily interested in the levels of ranking between households’ consumption frequency of the nutrient-rich food groups and adequacy level of the respective nutrients, we use the Spearman correlation coefficient to assess the correlation.
We assess whether acceptable frequency cutoffs can be identified. We discuss frequency thresholds that indicate if the household adequacy level is at least 0.7. This threshold was selected based on tests done for the MDD-W indicator using 0.5, 0.6, and 0.7 MPA for each nutrient. 32 For the MDD-W indicator, a threshold reflecting 0.6 was decided upon on empirical grounds. We decided to consider the highest of the MDD-W thresholds as we are looking at household- rather than individual-level adequacy.
Sensitivity–specificity analyses are used to assess whether frequency of consumption can be used to classify households with adequacy level below and above 0.7. Take the example of vitamin A: Sensitivity measures the percentage of households with lower than 0.7 adequacy level of vitamin A that is also classified as low by the proxy indicator (the frequency of consuming vitamin A–rich foods). Specificity measures the percentage of households with higher than 0.7 adequacy level of vitamin A that is also classified as “high” in this micronutrient by the proxy indicator. Both sensitivity and specificity should be as high as possible.
There is always a trade-off between sensitivity and specificity, and the area under the curve (AUC) from receiver operating characteristic (ROC) analysis is an important test statistic to assess the general suitability of a proxy indicator (see 4 ). It summarizes the relationship between the “true” frequency threshold based on HCES data and the proxy threshold based on frequency data across all possible cutoff points of the proxy indicator. AUC = 1 represents a perfect prediction with 100% sensitivity (no false negatives) and 100% specificity (no false positives). AUC = 0.5 indicates that the proxy is not better than a random guess and thus not suitable to predict the “true” classification. As a general rule of thumb, the AUC should be at least 0.7 to indicate acceptable predictive power as in. 4,6 An AUC below 0.6 is generally considered not acceptable, above 0.7 is good, and greater than 0.9 is excellent.
For establishing frequency cutoffs, in addition to sensitivity and specificity, the proportion misclassified is considered. “Optimal” frequency thresholds are found by maximizing sensitivity and specificity and minimizing the percentage misclassified. For acceptable thresholds, we follow the rule of thumb previously established with criteria for sensitivity and specificity at least 60% and the proportion misclassified less than 30%. 4,6 Sometimes several thresholds fulfill the criteria; the best threshold as presented in Tables 1 to 4 is the one that maximizes the sum of sensitivity and specificity, with preferably both above 60% and the proportion of misclassified as low as possible. We also calculate calibrated thresholds, such as the frequency thresholds that correspond to the actual household adequacy level at 0.7 of the respective nutrient as established by data from the HCES. This is done because sensitivity/specificity identified thresholds tend to be tilted toward too high (low) values if the prevalence of households with inadequate access is low (high). As the most important thing is to identify the proportion of population with adequacy level above or below 0.7, the calibrated thresholds will be more relevant, provided that the close association between the proxy indicator and the benchmark variable has been proved through the ROC analysis (see eg 4 ).
Results
Results of the Validation for Vitamin A
Average household adequacy level of vitamin A for the 4 countries (Table 1) is around 1 (from 0.9 for Honduras to 1.8 for Uganda). Including fortified sugar in the calculation gives a very high mean household adequacy level (3.4) for Guatemala. Since the interest here is to validate the relationship between frequency and food consumption, we excluded sugar in the remainder of the analysis, which then gives similar adequacy levels compared to the other countries. The relatively high level of vitamin A consumption in Uganda is partly due to frequent consumption of orange sweet potatoes (excluding sweet potatoes give an average household adequate level of vitamin A at 0.7).
Vitamin A Access.
Between 24% and 56% of the households have a mean household adequacy at 1 or more of vitamin A, whereas between 35% and 67% of households have a mean adequacy at 0.7 or more. Most of the intake of vitamin A comes from consumption of foods rich in vitamin A.
Household adequacy levels are significantly higher with higher consumption frequency of vitamin A–rich foods (Figure 1 and Appendix Figure 1). However, households that do not eat vitamin A–rich foods also have some intake of vitamin A. In Uganda, the adequacy level is 0.4 for this group and in Nepal 0.1.
Average access level of vitamin A by frequency of vitamin A–rich food consumption.
Appendix Table 1 shows the portion sizes by consumption frequency of vitamin A–rich food groups. For example, households in Uganda that eat vitamin-rich foods 1 to 3 days a week consume on average about 900 µg RE per capita per portion. For Uganda and Nepal, there is a monotonic tendency for smaller portion sizes by how often vitamin A–rich foods are eaten. The average portion size for Uganda is much larger than that for the other countries (due to sweet potatoes). None of the other countries eats a staple food rich in vitamin A on a regular basis.
The correlation coefficients between vitamin A adequacy level and frequencies in consumption of vitamin A–rich food groups are significant and vary from 0.55 (Nepal) to 0.70 (Honduras; Table 2, column 1). Excluding small quantities mostly improves the correlations, although the differences in correlations with and without small quantities are not very large, see column 2. An ROC analysis for household adequacy level shows AUC statistics for the 4 countries at significant and all AUCs are well above the threshold 0.7.
Correlation Coefficients and Sensitivity–Specificity Results for Vitamin A.a
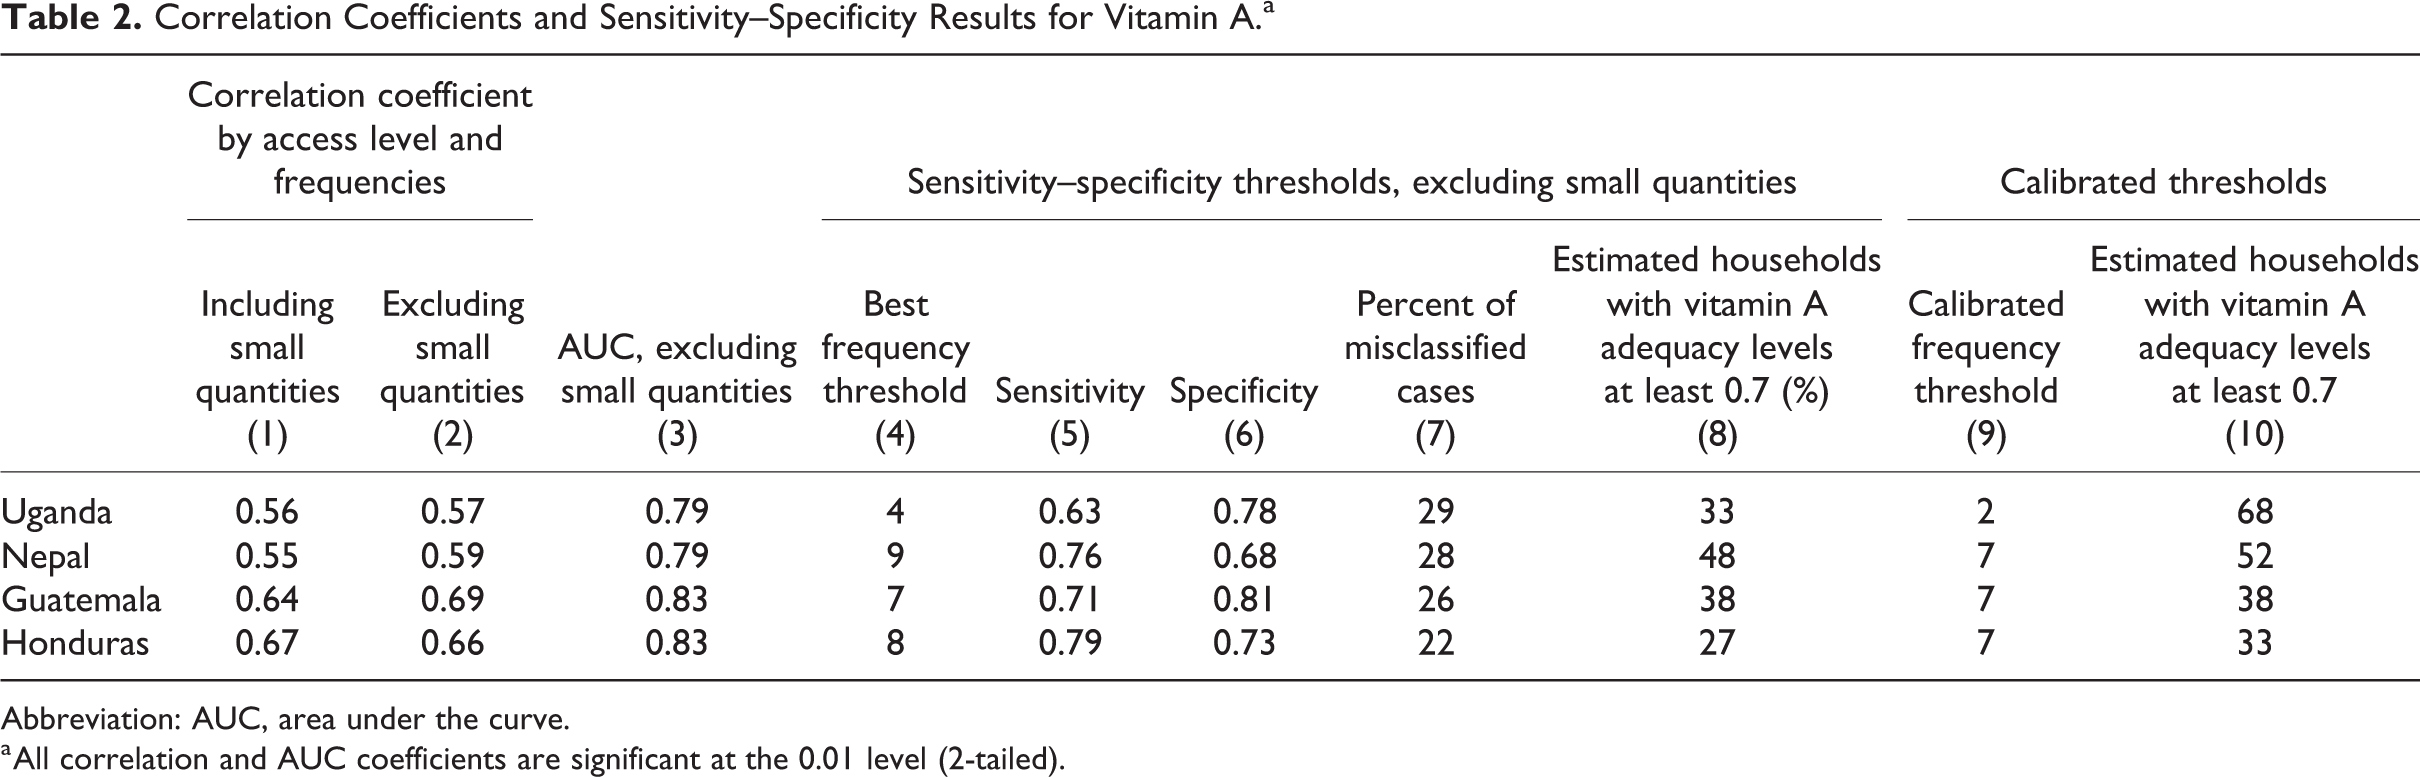
Abbreviation: AUC, area under the curve.
a All correlation and AUC coefficients are significant at the 0.01 level (2-tailed).
Columns 4 to 8 of Table 2 present results with best thresholds. In all cases, sensitivity and specificity are above 60% and the percentage of misclassified is less than 30% (note 7). For all countries except Uganda, the best thresholds for distinguishing those with an adequacy level at least 0.7 would have been to eat vitamin A–rich foods 7 days (or more). For Uganda, the threshold is 4 times since sweet potatoes are used as a staple food. To be able to evaluate the effect of high consumption of a staple food rich in vitamin A, we remove sweet potatoes from the analysis. In this case, we find that the threshold increases to 7, but the percentage of misclassified is too high (38%). Column 8 shows the estimated prevalence of households with an adequacy level at least 0.7 while using this threshold.
Finally, Table 2, column 9, shows the calibrated thresholds. As explained in section “Methods,” the calibrated thresholds provide the closest estimate of the true prevalence of households with adequacy levels at least 0.7. How close this estimate is can be seen by comparing column 10, Table 2 to the “true” prevalence in Table 1. In all cases except for Uganda, the calibrated threshold is 7. Removing sweet potatoes from the analysis brings the calibrated threshold for Uganda up to 6.
Results of the Validation for Iron
Average household adequacy level for iron at national level is low for all countries. Table 3 indicates that less than 1% of households has an adequacy level at 1 or higher. The majority also has an adequacy level below 0.7.
Iron Access.
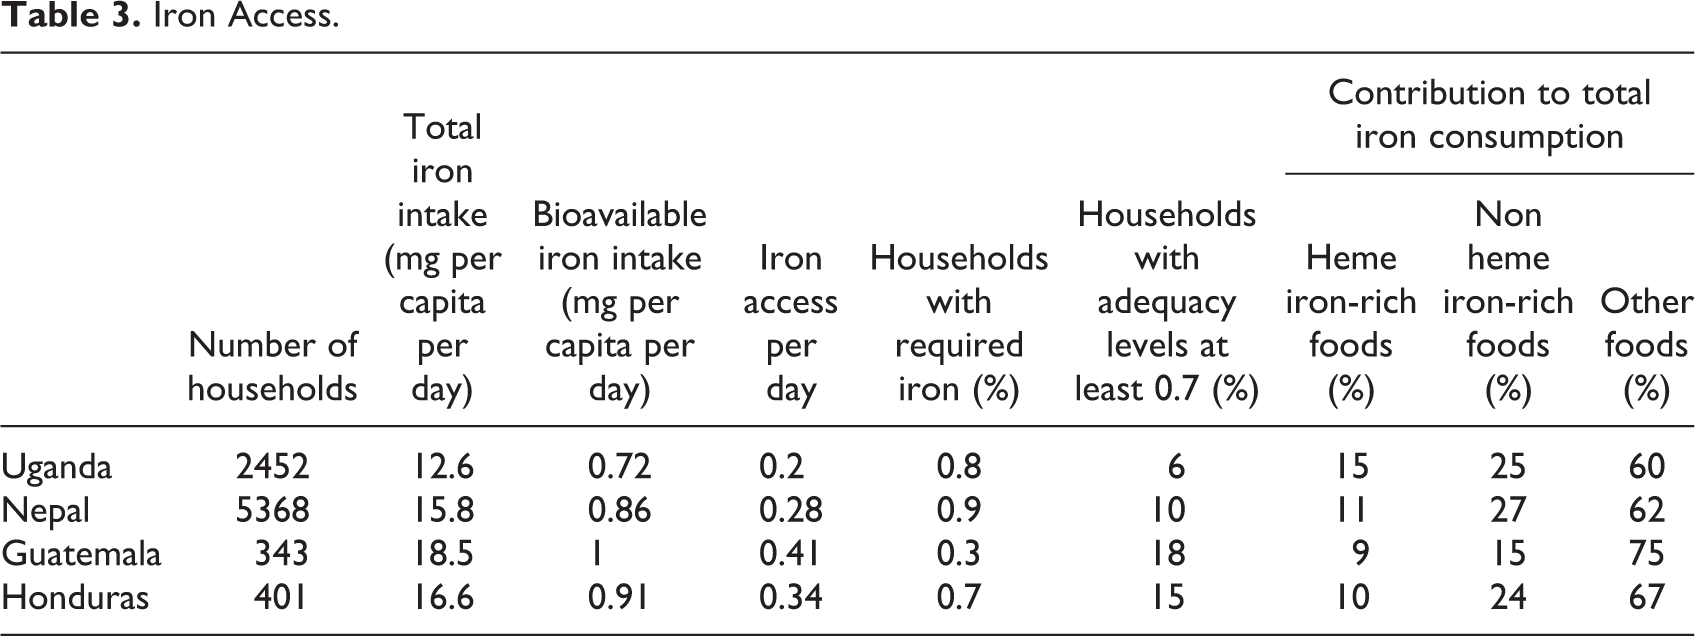
The majority of the total consumption of iron comes from consumption of non-iron-rich foods (for instance, cereals or eggs). Iron-rich foods (including both heme and nonheme for consistency) as part of all iron intake is lowest in Guatemala and highest in Honduras. The share from nonheme foods is always larger than the share from heme foods in total iron access level.
Although adequacy level is significantly higher when iron-rich foods are consumed more frequently, it is on average low, even for high consumption frequencies (Figure 2). Note that in Guatemala very few households (3) did not consume iron-rich foods at all and they are therefore excluded from Figure 2. Most households eat iron-rich foods in a week (Appendix Table 2), and the proportion of households that eat iron-rich foods on at least 7 days varies from 49% in Uganda to 70% in Honduras. There is a general tendency to decreasing nutrient content per portion of iron-rich foods with increasing frequency of these foods eaten, as also reflected in Appendix Figure 2.
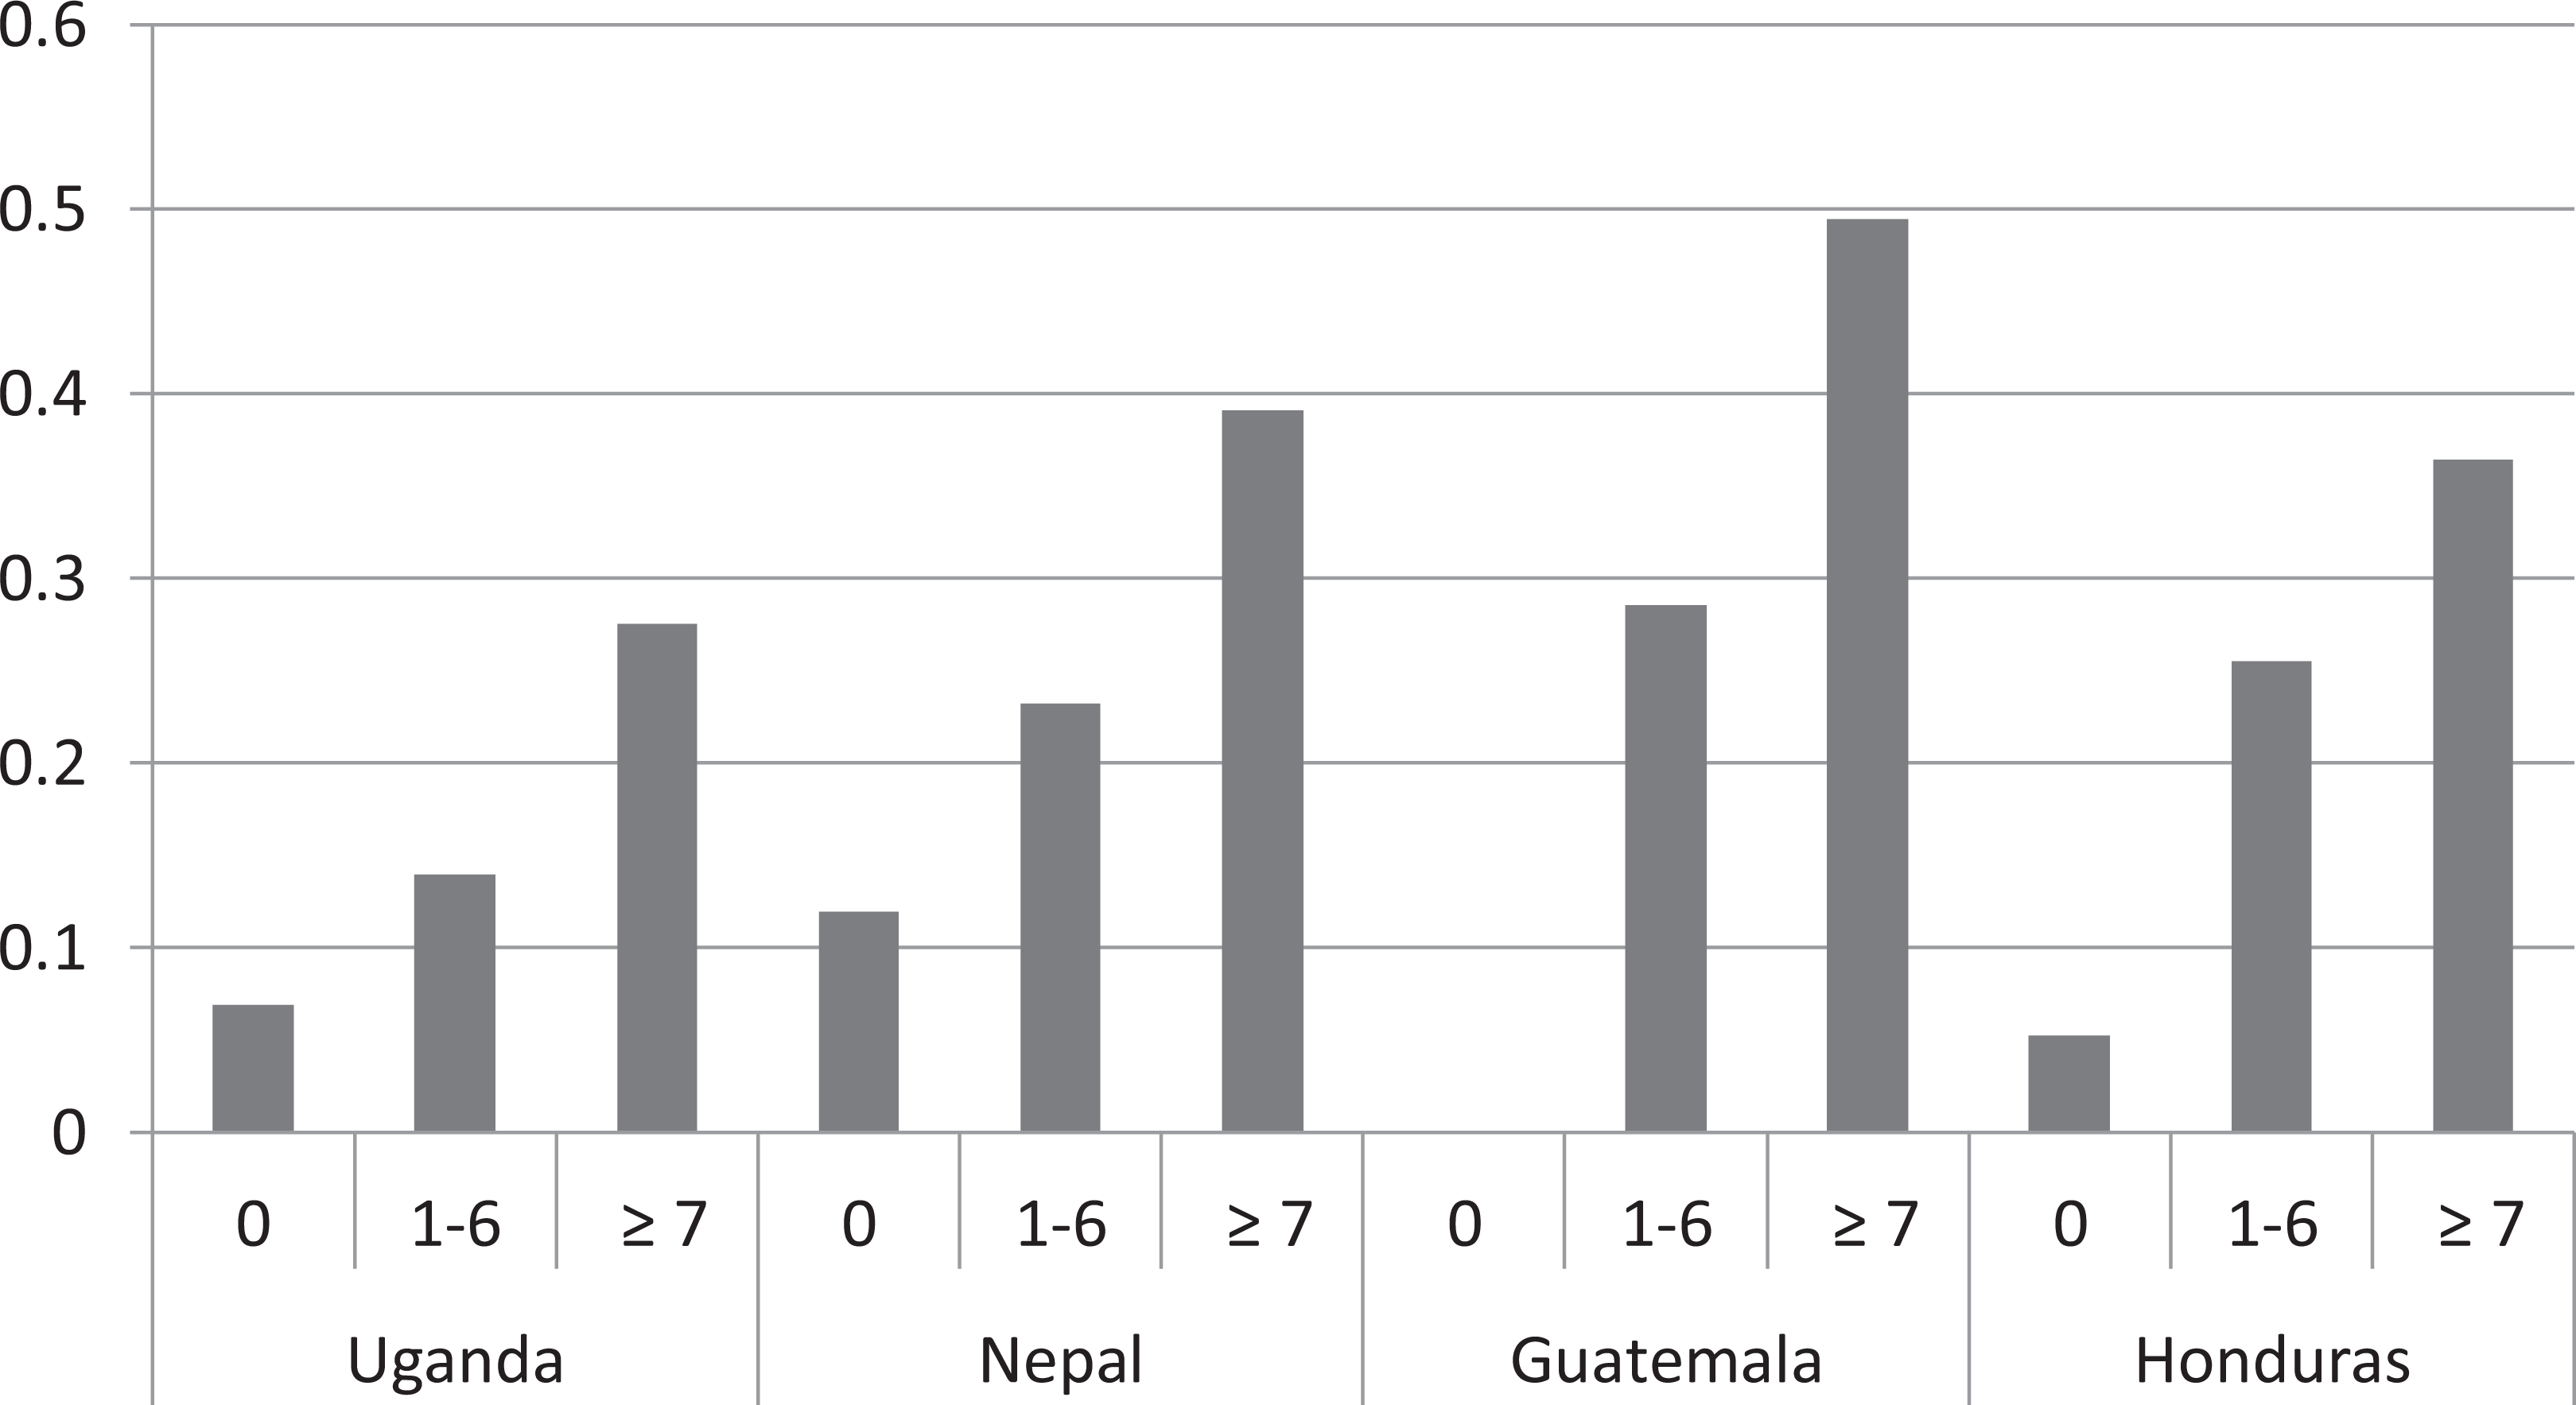
Average level of access to iron by groups of frequency of iron-rich food consumption.
The correlation coefficients between adequacies and frequencies in consumption of iron-rich food groups are all significant and vary from a low 0.26 (Nepal) to 0.50 (Guatemala; Table 4, column 1). The correlations are the same, or slightly higher, when excluding small quantities from the frequencies, except for Nepal where the correlation is substantially improved, see column 2.
Correlation Coefficients and Sensitivity–Specificity Results for Iron.a
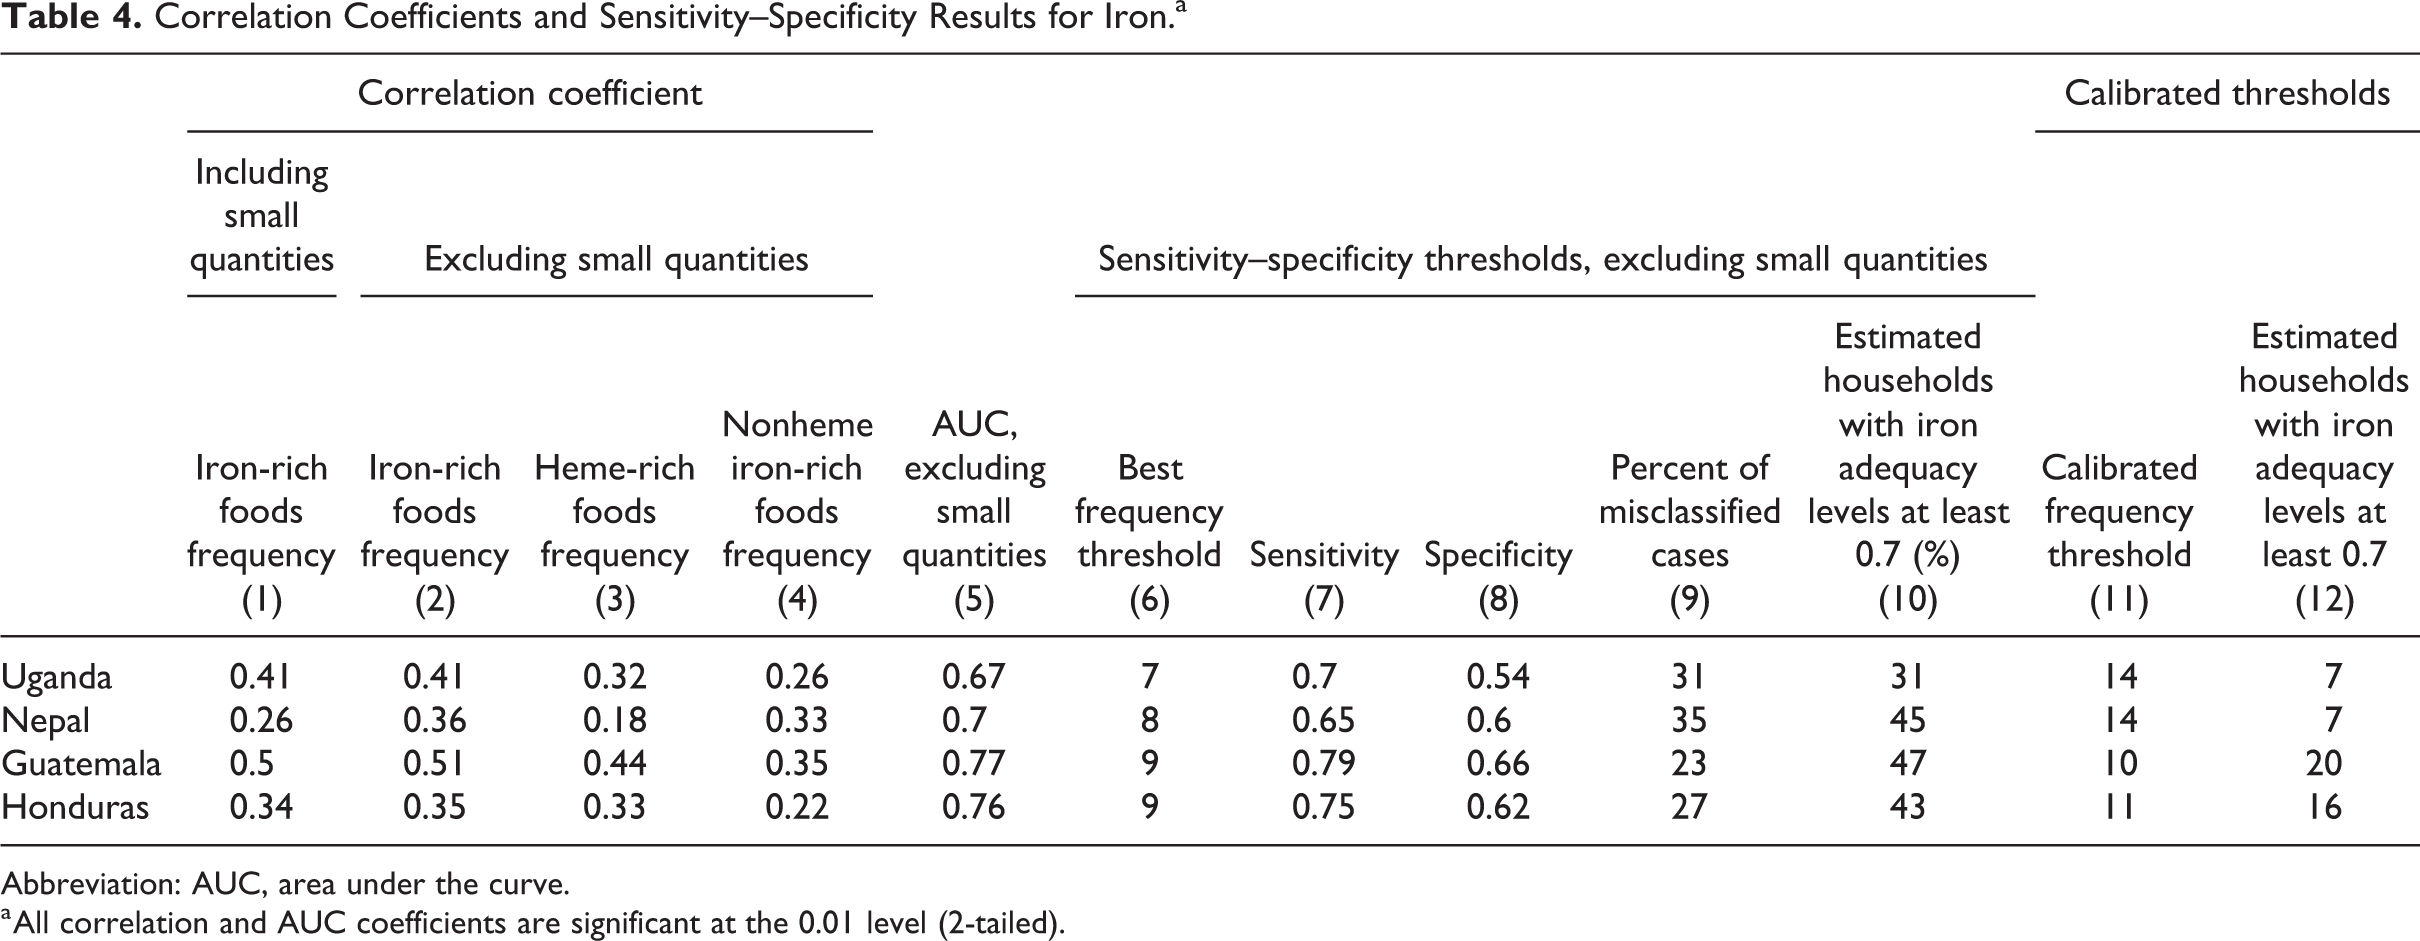
Abbreviation: AUC, area under the curve.
a All correlation and AUC coefficients are significant at the 0.01 level (2-tailed).
The results of heme and nonheme separately are mixed (columns 3 and 4). In all cases, except for Nepal, nonheme has the lowest correlation. In all countries, the correlation is strongest when considering heme and nonheme foods together in one food group. Table 4, column 5, shows that the AUC in all cases except 1 (Uganda) is 0.7 or above.
All criteria for appropriate thresholds are met in 2 of the cases (Table 4, columns 7-9). For Nepal and Uganda, the percentage of misclassified is above 30%, and in Uganda, there is no threshold where both sensitivity and specificity are above 60%. The frequency thresholds are in the range of 7 to 9. Table 4, column 11, shows the calibrated thresholds that best match the true prevalence of households with an adequacy level of iron at least 0.70 and column 12 the estimated prevalence using the calibrated thresholds. The threshold is the same in Nepal and Uganda (14) and a bit lower in the 2 other countries.
Discussion
The analysis has shown that there is a clear relationship between the frequency of consumption of a food group rich in a nutrient and household adequacy levels of the respective nutrient as measured by quantity data at household level, for all the countries analyzed. In particular, the correlations for vitamin A are high, and a reason for this is likely to be that the vitamin A–rich foods contributed to the largest share of total consumption of vitamin A (between 56% and 85% in the country cases). For iron, the share of the total nutrient consumption coming from the respective nutrient-rich food groups is much lower, between 30% and 48%.
Excluding quantities consumed in amounts of less than 15 g in general improves the correlation. This is consistent with results from other studies. 6,28 An earlier study confirms the importance of not counting the consumption of small quantities in the FCS. 5 It is a challenge to exclude small quantities in practice. When doing the actual data collection for the FCS, small quantities equivalent to less than 15 g are established according to the context. For example, cheese or fish powder spread over a meal is considered as small quantity to facilitate data collection. In addition, one may question whether small quantities should be the same for all foods, as some foods are nutrient dense and some not. Thus, challenges in this area remain, and more work should be done to improve how to handle small quantities.
In Guatemala, sugar is fortified with vitamin A, bringing the average household adequacy to more than 3. This point illustrates the potential impact of fortification. The further analysis does not include fortified foods in the calculations as the aim is to assess whether consumption of foods naturally rich in the nutrient can be used as a proxy for adequacy levels of the same nutrient.
Uganda is one of the few countries where orange sweet potato is consumed as a staple food (note 8). It contains high amounts of vitamin A and the intake of vitamin A increases substantially when it is eaten in large amounts. This is reflected in the finding that the threshold of the frequency of intake of foods from vitamin A–rich food groups is lower in Uganda than that in the other countries. Not including sweet potatoes in the analysis brings the threshold within the range of the other countries. The 2 preceding examples highlight that it is important to capture consumption of fortified foods used regularly in the diet or of foods, especially rich in a nutrient used as a staple. Fortified vegetable oil, which is the food most commonly fortified with vitamin A, and supercereal form part of a food basket in humanitarian contexts and provide important contributions to nutrient intake. Not having the ability to include fortified foods is thus recognized as a shortcoming.
For iron, the average adequacy level is very low for all countries, and even for households consuming foods rich in iron on average at least daily, the average adequacy level is between 0.2 and 0.5 in the countries analyzed. Note that since the Uganda and Nepal surveys do not specifically ask about organ meat, iron intake and frequencies will be underestimated in both the countries. In Nepal, this is likely to pose less of a problem than in Uganda where it is more common to eat organ meat. Less than 1% of the households meet the full requirement level. Although high frequency of consumption of iron-rich foods reduces the nutrient gap, the portion sizes of iron-rich foods eaten on a general basis are so small that the requirement is far from reached. Data from WHO suggest that this is a global problem, reflected in high rates of anemia.
The statistical results show that the correlation coefficients are in general high, mostly to be found in the middle between the lowest coefficient at 0.26 and the highest at 0.69. The AUCs are below 0.70 in only one of the empirical analyses (0.7 indicating reasonable relevance of a dichotomous proxy indicator), and in 2 cases above 0.8. For 2 cases (for iron) of the 4 tested, all the criteria (sensitivity, specificity, and misclassified) was not achieved.
The calibrated thresholds for vitamin A are uniform across the countries varying from 6 to 7, and the most common threshold of 7 should be used out of a maximum of 42. For iron, the calibrated thresholds vary from 10 to 14. Considering the available span for the score from 0 to 35, this is not a large variation. As a rule of thumb, we suggest the midpoint 12 of 35 as a threshold for iron. Although we cannot claim that frequency thresholds that are predictive of vitamin A and iron adequacy are valid across all contexts, for the 4 countries in our study, it is reasonable to use these thresholds. This point would require further validation of additional country databases. It is, in that respect, important to highlight that not all HCES collect food consumption data in a way that makes them suitable for food access analysis.
For reference, it is useful to compare the analysis leading to the development of the MDD-W dichotomous indicator of whether or not women aged 15 to 49 years have consumed at least 5 of 10 defined food groups the previous day or night, which showed that “results are consistent enough to recommend the use of a dichotomous food group indicator for global uses.” 33 The proportion of women aged 15 to 49 years who reach this minimum in a population reflects one important dimension of diet quality. Although our study looks at individual nutrients against a frequency score that is reported at household level, the statistical approach to test the proxies is the same in the 2 studies. The MDD-W study was based on 9 datasets (24-hour recall of women’s food consumption) from 6 countries. 6,32 The nutrient score is the MPA score based on vitamins A, B, and C and the minerals calcium, iron, and zinc. The study tested several proxies for the nutrient score, based on different numbers of food groups and with and without small quantities. The “best” score, in terms of correlations with the MPA score and sensitivity–specificity results, is based on 10 food groups excluding small quantities. The correlations with the MPA ranged from 0.25 to 0.56. The AUC was always above 60%, but in 3 cases below 70%. Only 1 country data set met all criteria determined (same criteria used in this study). The dichotomous indicator with 5 or more food groups reflecting a mean probability of overall adequacy at 0.60 was endorsed in the MDD-W study.
We cannot use the method identified to discuss nutrient inadequacies for individuals within the household—and especially not for those who are nutritionally vulnerable—infants, young children, and pregnant and lactating women, for example. In addition, if adequacy had been defined at the level of the Recommended Nutrient Intake (RNI) rather than the EAR (giving approximation of adequate intake for only 50% of the population), the number of servings required would have been higher. However, the method provides a first insight into likely insufficiency of nutrient access, which can be identified through standard surveys and which requires no additional data, nor training of enumerators, nor cost to increase the sample size for individual dietary consumption modules. The information from the FCS can flag a potential issue, which should be complemented with further analysis to fully understand food consumption habits of the household and its members. This can include individual dietary diversity modules delivered to those households with a less than adequate FCS (MDD-W for children aged 6-23 months), detail on cultural habits regarding food consumption within the household, intrahousehold allocation, and previous studies from the area that could be quantitative dietary assessments to help describe likely implications for nutritionally vulnerable groups within a population.
We should bear in mind that 7 days is not sufficient to capture variability of food consumption over time—a factor that has a major impact on micronutrient intake. The fact that the body is able to store vitamin A, meaning that a “less good week” can be compensated by a better one, will not be captured in a 7-day recall. 26 Nor is seasonal variation taken into account unless the data are collected at multiple points in time over the seasonal calendar. This limitation applies even more strongly to individual-based 24-hour recall surveys as they fail to capture the variability of food consumption across time. Multiple nonconsecutive 24-hour recalls could handle this limitation, but this greater level of accuracy has important consequences on time and cost.
Limitations with the HCES data are that any plate waste is not quantified, which could lead to an overestimation of the quantities consumed in our analyses. In addition, it is difficult for one person in the household to record consumption correctly for the other members, especially for foods eaten outside the household, and reported consumption is based on a 7-day recall period, which is subject to memory bias. Two further limitations related to the specific approach taken in the analysis used here should be kept in mind when interpreting the results. As noted before, the questionnaire used in Central America included a longer and more detailed list of food items than in Uganda and Nepal: In the latter, some food groups are also already aggregated in the list (such as green leafy vegetables and “other” vegetables). We would expect this shorter list to result in a relative underestimation of quantities and frequencies. However, it is not clear if and how this would affect the results regarding thresholds and nutrient content per portion. If an important source of the food is not on the predetermined HCES food list, nothing can be done about it, but the HCES food list is designed to capture the common foods eaten. Although these food lists do not include fortified foods, this does not pose any problem for our analysis as we aim to assess whether frequencies of foods rich in a nutrient can proxy consumption of that nutrient. It is of utmost importance to take note of fortified foods, such as vegetable oil and supercereal, in the collection of frequency data in a light survey as we have seen with sugar as this will have a huge implication on household access level. Furthermore, as also noted in the methodological section, the way the frequencies have been calculated in the HCES overestimates the frequencies compared with the way it is reported in a light module. If there is any effect at all, we would expect thresholds corresponding to the frequencies collected in a “light” module to be lower than the ones we have estimated here; this is however not likely to affect the association between access level and frequency.
Finally, the study should be followed up with further research to quantify the limitations with using HCES data rather than individual dietary consumption data, for the analysis. A main issue is that we must postulate a distribution rule of food in the household to arrive at the collective household adequacy (access). Another issue is that we derive the frequency information from the same data as the consumption data. A follow-up study with data collected to measure the difference in the approach taken in this study (to use household-level food consumption) to the gold standard (individual food consumption) as well as adding a separate frequency module to the questionnaire should be carried out. While recognizing that the data sets used have limitations, the 4 countries show the same pattern, supporting the robustness of the approach taken especially as they are very diverse (Appendix Figures 1 and 2).
Food Consumption Score is only one of numerous other pieces of information that is analyzed to inform programs and a sound nutritional analysis is a prerequisite to any program designed to identify and fill nutrient gaps. In El Salvador, the method (now referred to as FCS-Nutrition or FCS-N) provided a key piece of information in a “Fill the Nutrient Gap” (note 9) (FNG) study showing that only 7% of households met or exceeded 70% of RNI for iron. 34 The study highlighted an increasing trend at the household level toward energy dense diets, but not adequately nutrient dense (in particular, in terms of micronutrient content) and among recommendations suggested improving availability of nutritious complementary foods on the market and improving access to these foods among the most vulnerable. As part of this finding, a food-for-assets program was developed for households affected by disasters with promotion of nutrition-sensitive asset creation activities. These are aimed at stimulating early recovery and rebuilding inclusive and equitable livelihoods to support households to have year-long access to nutritious food, thus reducing long-term vulnerability to food insecurity and malnutrition. The FCS-N not only provided information in support of the project development but is also an indicator to monitor the program.
Indeed, the proxy indicator has particular value in monitoring and has been utilized in a number of countries to monitor programs that have been designed to improve dietary diversity. In Mozambique where an FNG study also took place, the FCS-N is used as a monitoring indicator to track dietary changes in shock-affected households. The program that is monitored provides unconditional cash and/or food-based transfers to households so that they are able meet basic food and nutrition requirements and is enhanced with messaging on nutrition and healthy diets. The FCS-N clearly shows any changes in consumption of nutrient-rich foods within the household over time.
Conclusion
The research set out to determine whether information on the number of days on which food groups are eaten in a household can be used to assess the household’s access to 2 important nutrients, namely, vitamin A and iron. The analysis suggests that consumption frequency of nutrient-rich foods can identify likely risks of insufficient access to important nutrients. Thus, we conclude that where rapid methods are needed to inform response options and especially the nutrient density of the food assistance ration, collecting information on frequencies of consumption of foods from specific food groups is a useful piece of information to assist in defining programs that address nutrient gaps. The frequency analysis of vitamin A–rich and iron-rich foods at household level can reveal access problems to key nutrients using data that are widely and readily collected.
As a rule of thumb, more than at least an average daily access to food rich in vitamin A is necessary to reflect that a household mean adequacy at 0.70 of that nutrient is met. For iron, this threshold corresponds to an average at almost twice a day. The study also suggests that in contexts where orange sweet potatoes is eaten as a staple food, or fortified foods contribute substantially to vitamin A access, such as vitamin A–fortified sugar or oil, the thresholds for frequencies of vitamin A–rich foods should be set much lower (at 2).
The results show the extent to which households have access to foods to cover the minimum of vitamin A or iron using an existing indictor—FCS. These indicators are used separately to show the likelihood that the household as a whole could potentially meet requirements of vitamin A and iron, respectively, if sharing within the household is according to needs. Results suggest that household-level food consumption data can be a proxy to identify insufficient nutrient access at the household level and can be collected in light household surveys that are relatively quick to implement and analyze. It is, however, important to stress that although the approach of analyzing frequency of foods is more feasible in humanitarian contexts, it is not a substitute for a properly conducted quantitative dietary assessment.
Footnotes
Appendix
Nutrient Content of Iron Per Portion from Iron-Rich Foods by Frequency Groups.
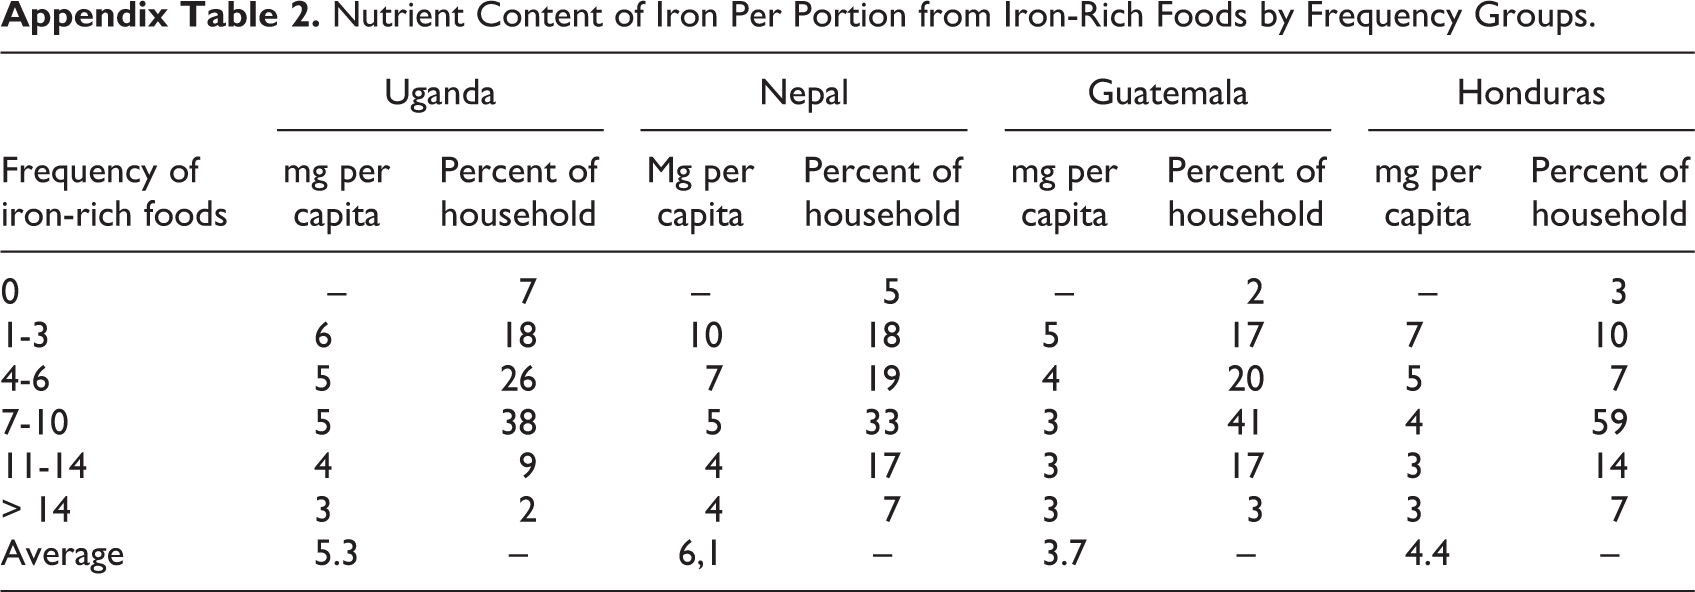
| Frequency of iron-rich foods | Uganda | Nepal | Guatemala | Honduras | ||||
|---|---|---|---|---|---|---|---|---|
| mg per capita | Percent of household | Mg per capita | Percent of household | mg per capita | Percent of household | mg per capita | Percent of household | |
| 0 | – | 7 | – | 5 | – | 2 | – | 3 |
| 1-3 | 6 | 18 | 10 | 18 | 5 | 17 | 7 | 10 |
| 4-6 | 5 | 26 | 7 | 19 | 4 | 20 | 5 | 7 |
| 7-10 | 5 | 38 | 5 | 33 | 3 | 41 | 4 | 59 |
| 11-14 | 4 | 9 | 4 | 17 | 3 | 17 | 3 | 14 |
| > 14 | 3 | 2 | 4 | 7 | 3 | 3 | 3 | 7 |
| Average | 5.3 | – | 6,1 | – | 3.7 | – | 4.4 | – |
Authors’ Note
Mathiassen A. and Lovon M. contributed to conception and design; contributed to acquisition, analysis, and interpretation; drafted manuscript; critically revised manuscript; gave final approval; and agree to be accountable for all aspects of work ensuring integrity and accuracy. Baille B. contributed to analysis, drafted manuscript, gave final approval, and agrees to be accountable for all aspects of work ensuring itegrity and accuracy. Ogden K. contributed to conception and design, drafted manuscript, critically revised manuscript, gave final approval, and agrees to be accountable for all aspects of work ensuring integrity and accuracy. Sandström S. contributed to analysis and interpretation, critically revised manuscript, gave final approval, and agrees to be accountable for all aspects of work ensuring itegrity and accuracy.
Acknowledgments
The authors thank inputs and comments to the article from Arif Husain, Yvonne Forsen, Saskia de Pee, Claudia Ahpoe, Sergio Regi, John K. Dagsvik, and 2 anonymous reviewers.
Declaration of Conflicting Interests
The author(s) declared no potential conflicts of interest with respect to the research, authorship, and/or publication of this article.
Funding
The author(s) received no financial support for the research, authorship, and/or publication of this article.