
Abstract
The “second 1000 days” is a period of rapid brain growth which consolidates developmental foundations and establishes school readiness. Understanding the relation between household characteristics, child diet, and child development remains incomplete, especially in resource-poor settings where >250 million children risk not achieving their full developmental potential. Child developmental performance was assessed (Ages & Stages Questionnaire [ASQ]) at ages 2 and 5 years in a cohort of Nepali children (n = 207) whose families participated in a nutrition/livestock management+community development intervention trial. Relationships between child developmental performance and mother’s education, family wealth, child diet (animal source food [ASF] consumption, dietary diversity score [DDS]), school attendance, and intervention group were examined by adjusted linear regressions. These relationships varied at the 2 ages. At age 2 years, ASQ scores related positively to “Full Package Intervention” and negatively to “Partial Package Intervention” membership. At age 5 years, intervention group did not relate to ASQ scores. Mother’s education did not relate to developmental findings for 2-year-olds. Mother’s education, wealth, and school attendance positively predicted ASQ scores for these same children as 5-year-olds. Animal source food consumption was related to child development more strongly at age 5 than at 2 years. DDS had a less pronounced relationship to development than ASF consumption at both ages. Over this time span bracketing the second 1000 days, household characteristics and child diet related differentially to developmental performance depending on child age. Better understanding of the timing and mechanisms of these relationships is needed to effectively design interventions targeting improved child development in resource-poor settings.
Highlights
Maternal education, household wealth, and animal source food consumption were more predictive of child developmental performance in a cohort of Nepali children at age 5 years than at age 2 years. In contrast, intervention group assignment was more predictive at age 2 years than at age 5 years.
These age-related differences highlight the complexity of the relationships between the individual and household characteristics that influence child development and emphasize the dynamic nature of child development.
Introduction
Development in early childhood establishes the basis for school performance as well as function in adult life and thus is important not only to the individual but also to the family and society. 1 Sadly, more than 250 million children in low- and middle-income countries (LMICs) are at risk of not achieving their full developmental potential. 2 In low-resource settings, the family and community environments may be far from ideal for optimal child development. 3 Dietary deficiencies, poor health, lack of parental education, limited financial and other resources, low-quality schooling, and many other corollaries of poverty may each contribute to the difficulties in achieving optimal development in early life. 1,2,4 -6 In resource-poor environments, such sociodemographic factors explain more of the variance in cognition than genes. 7,8
The particular contributions of family wealth, maternal education, the quality of the home environment, and nutritional status to child development have rightly been emphasized. 2,4,9,10 Children from better-off families are usually found to have better cognitive development than children from less wealthy families, as shown in studies from Asia, Latin and North America, and Africa. 7 -20 For example, household wealth quintile was related to intellectual and motor function in school-age Nepali children, even after adjusting for numerous other child and household factors. 11 In Bangladesh, disparities in development appeared as early as 7 months of age between children in the highest versus lowest wealth quintiles. 17
Parental educational levels, the quality of the home environment, and child nutritional status, among other factors, have been proposed as possible mediators of the association between family wealth and child development. 12,17 Considerable research supports these hypotheses. For example, a pooled analysis of 20 882 children from LMICs in Asia, sub-Saharan Africa, Latin America, and Europe found that children of mothers with secondary schooling had higher cognitive scores (0.14 SD, 95% CI: 0.05-0.25) compared with children whose mothers had only primary education. Similar findings have been reported from high-income countries. 21,22 The quality of the home environment, which includes parental involvement and the degree of stimulation and emotional support in home environments, 23 also relates to child developmental performance in many studies. 12,17,24 In Pakistan, for example, the quality of home stimulation predicted children’s verbal intelligence, performance intelligence, and executive function skills at age 4 years; in Bangladesh and Colombia, high-quality home environments mediated the association between poverty and preschool child development. 12,17
Poor child nutrition is another characteristic of many resource-poor environments. There is a logical basis for the association between child nutritional status and developmental outcomes. Children learn by exploring and interacting with their environments. Better nourished children are more responsive to environmental stimuli, and their more active behavior may elicit more parental engagement. Parental responses and expectations tend to be reduced for less active children, contributing to a vicious cycle of diminished stimulus and response 25 -27 and overall delayed development. Both growth faltering and deficits in neuronal growth occur after early exposure to malnutrition. 27 In fact, stunting (poor linear growth as reflected by low height-for-age z score [HAZ] 29 ) has often been used as a surrogate indicator of child development. 4,6,9,23,25,27,28 However, there is no consensus on the full mechanisms linking stunting and children’s development, 28 and stunting must therefore be considered as only a partial and incomplete proxy for developmental status. 1,25,29
Despite these and many other important contributions to the literature, understanding the relation of various household and child factors to child development remains incomplete. In large part, this is due to the complex interrelationships between these elements. Additionally, child development is a dynamic process comprising multiple domains. The developmental domains are interrelated; however, these relationships change over time. For example, the strong associations between motor and cognitive, social, or perceptual development during the first 2 to 3 years of life are much less evident at kindergarten age. 26 Risk factors for poor development in diverse domains may differ considerably 6,8,26,30,31 (eg, gross motor versus problem-solving skills); some domains may be more vulnerable to certain risk factors than others. For example, a recent meta-analysis found that father’s education related to child cognitive and motor skills but not language, 30 while another extensive meta-analysis found that nutritional inputs favorably affected socioemotional skills, with minimal effect on cognition, language, and motor skills. 31 Additionally, the responsiveness of each developmental domain to the same environmental input may change over time, 5,7,32 -36 reflecting differences in sensitive periods. Some elegant studies have highlighted the differential response to various social ecological factors of children at different ages. 9,10,12,17,26,28,37 Notably, the negative impact of poverty on child development increases (possibly due to its cumulative detrimental effects) with child age in most 9,12,17,37 but not all studies. 10 The number of contextual risk factors 1 and their timing, severity, and duration of exposure are also important considerations. Several researchers have called for more longitudinal studies to better understand the timing of sensitive periods in development and the relative importance of various social ecological factors over time. 6,12,23
We previously reported on the impact of diet on developmental performance of rural Nepali children. 38,39 The results indicated that consumption of a diverse diet and animal source foods (ASFs) was associated with better child developmental performance. These dietary measures reflect household wealth, as well as family feeding practices. Although we adjusted our analysis for both child- and household-specific factors, we did not examine the relative importance of these factors to child developmental performance at different ages. Our data set included developmental testing results on a small subset of the same children at 2 time points: age ∼2 years and age ∼5 years. These 2 age groups are of particular interest as they bracket the “second 1000 days,” a period during which the rapid brain growth characteristic of the first 1000 days continues. 28,40 During the “second 1000 days,” developmental foundations are consolidated and the fundamentals necessary for school readiness are established. Cognitive function on school entry is particularly important, as it predicts educational attainment and later adult functioning. 17
It is notable that the factors potentially influencing child development differ at age 2 and 5 years. In rural Nepal, health risks are much greater in the younger age group with more ill days, especially related to diarrheal disease. 41 Nutritional status also tends to be worse: stunting peaks at age 24 to 35 months and then decreases after that. 41 Of additional interest in this age group is preschool attendance—a factor strongly linked to child developmental performance in resource-poor settings. 21,22,24,42 Preschool attendance is rare at age 2 years in Nepal, 11,43 but common by age 5 years.
Our theoretical approach to this analysis was embedded in United Nations International Children’s Fund (UNICEF’s) Social Ecological and Behavioral Drivers Models, with additional elements drawn from “implementation science” and “Nurturing Care” frameworks. 44 -48 The Social Ecological model was designed to enhance understanding of the relationships between individuals and multiple levels of surrounding social systems, including the family, interpersonal, social networks, community, and the broader organizational environment. 44,45 The model was intended to account for contextual “social and structural dimensions that may act as enabling or constraining factors that influence behaviors” 46 or other outcomes. The Nurturing Care Framework (designed to assess the theoretical foundations of interventions promoting child development), 48 UNICEF’s Behavioral Drivers model, 46 and the Implementation Science 47 framework all strongly emphasize the crucial role of understanding context to effectively plan program implementation.
As we wished to establish a sound basis for planning future interventions to promote child development in rural Nepal, we therefore sought to understand the local social ecological factors which influenced child development, to account for constraints, and further, to explore the impact of different contextual factors at different ages. Given the complex and dynamic nature of child development, we examined a range of contextual factors for children in 2 distinct age groups to determine if they varied in their sociodemographic vulnerabilities. We sought to better understand the pathways and the timing through which poverty-related risk factors contributed to developmental outcomes among rural Nepali children. 12 We therefore examined the relationships between household (including intervention group assignment, maternal education, wealth) and child characteristics (child diet, age, gender) to child developmental performance to explore the relative importance of these factors at age 2 and 5 years. We chose to limit our analysis to this small cohort, each child tested at age 2 and again at age 5 years, in order to reduce the influence of unmeasured variables that could contribute to child developmental performance.
Methods
Ethics
This investigation was registered at ClinicalTrials.gov (NCT03516396) and was approved by the Nepal Health Research Council (approval #1369), as well as the Human Investigation Review Board of Tufts University (approval #1305009). The consent process was conducted in accordance with the regulations of these 2 review boards. Two types of consent were available, for literate and for nonliterate individuals. Literate individuals were provided with written materials, which were reviewed by one of the field enumerators. For nonliterate individuals, the consent form was read aloud by the field enumerator. In both cases, enumerators responded to any questions from the respondents. Consent forms were signed by the literate participants; oral consent was provided by the nonliterate individuals. In both cases, consent was witnessed by another of the field enumerators. Consent was obtained prior to commencing each household visit.
Study Design
The study of child development was nested within a larger community mobilization intervention trial implemented by Heifer International Nepal in Banke district in western Nepal, an area largely populated by low-income subsistence farmers. Heifer International Nepal is a nongovernmental organization concerned with poverty alleviation via livestock management practices and community empowerment. This larger study was designed as a longitudinal-controlled impact evaluation 49 to assess the contributions of in-depth community mobilization activities plus training in family nutrition and livestock management on household sociodemographic outcomes, as well as child growth and diet. Three nonadjacent communities from the same agroecological zone were identified based on similar sociodemographic characteristics. The communities were randomly assigned to one of 3 conditions: (1) full intervention, including community development, livestock management training, and nutrition education (full package) (2) livestock management training and nutrition education only (partial package), or (3) control (no inputs). The full package consisted of 12 months of closely supervised participatory community development focused on poverty alleviation and empowerment. Activities, conducted via biweekly women’s self-help groups, included values training, discussion of gender and family issues, social mobilization, group strengthening, microcredit, and enterprise development. Additionally, training was provided in optimization of livestock management and household nutrition practices (further details are provided in the study by Miller et al 50 ). Partial package and control communities received the full intervention package after the fifth round of data collection (1 year before the second developmental assessments were completed). Six household visits were conducted over 48 months. At all 6 visits, household demographics and diet information were collected (described below). At midline and end line, developmental testing was performed.
Participants
All 307 children in the study area between 23 and 38 months of age at round 3 were enrolled in the developmental study (Figure 1). Child age was determined by inspection of the birth or the vaccine certificate; either or both of these documents were available for all children. Exclusion criteria were physical or neurologic handicaps that prevented ingestion of a normal diet for age or children with severe intercurrent illnesses at the time of survey; however, no children met these criteria. A total of 207 of these children were retested at 52 to 66 months of age (round 6); the remainder were unavailable (n = 5) or had aged beyond the limits of the developmental testing instrument used (n = 95). These 207 children, who had complete anthropometry, diet records, household information, and developmental testing results at both times (age 23-38 months, or ∼2 years of age and again at age 52-66 months, or ∼5 years of age), are the subjects of this study. For simplicity, the ages are designated as 2 and 5 years throughout the text.
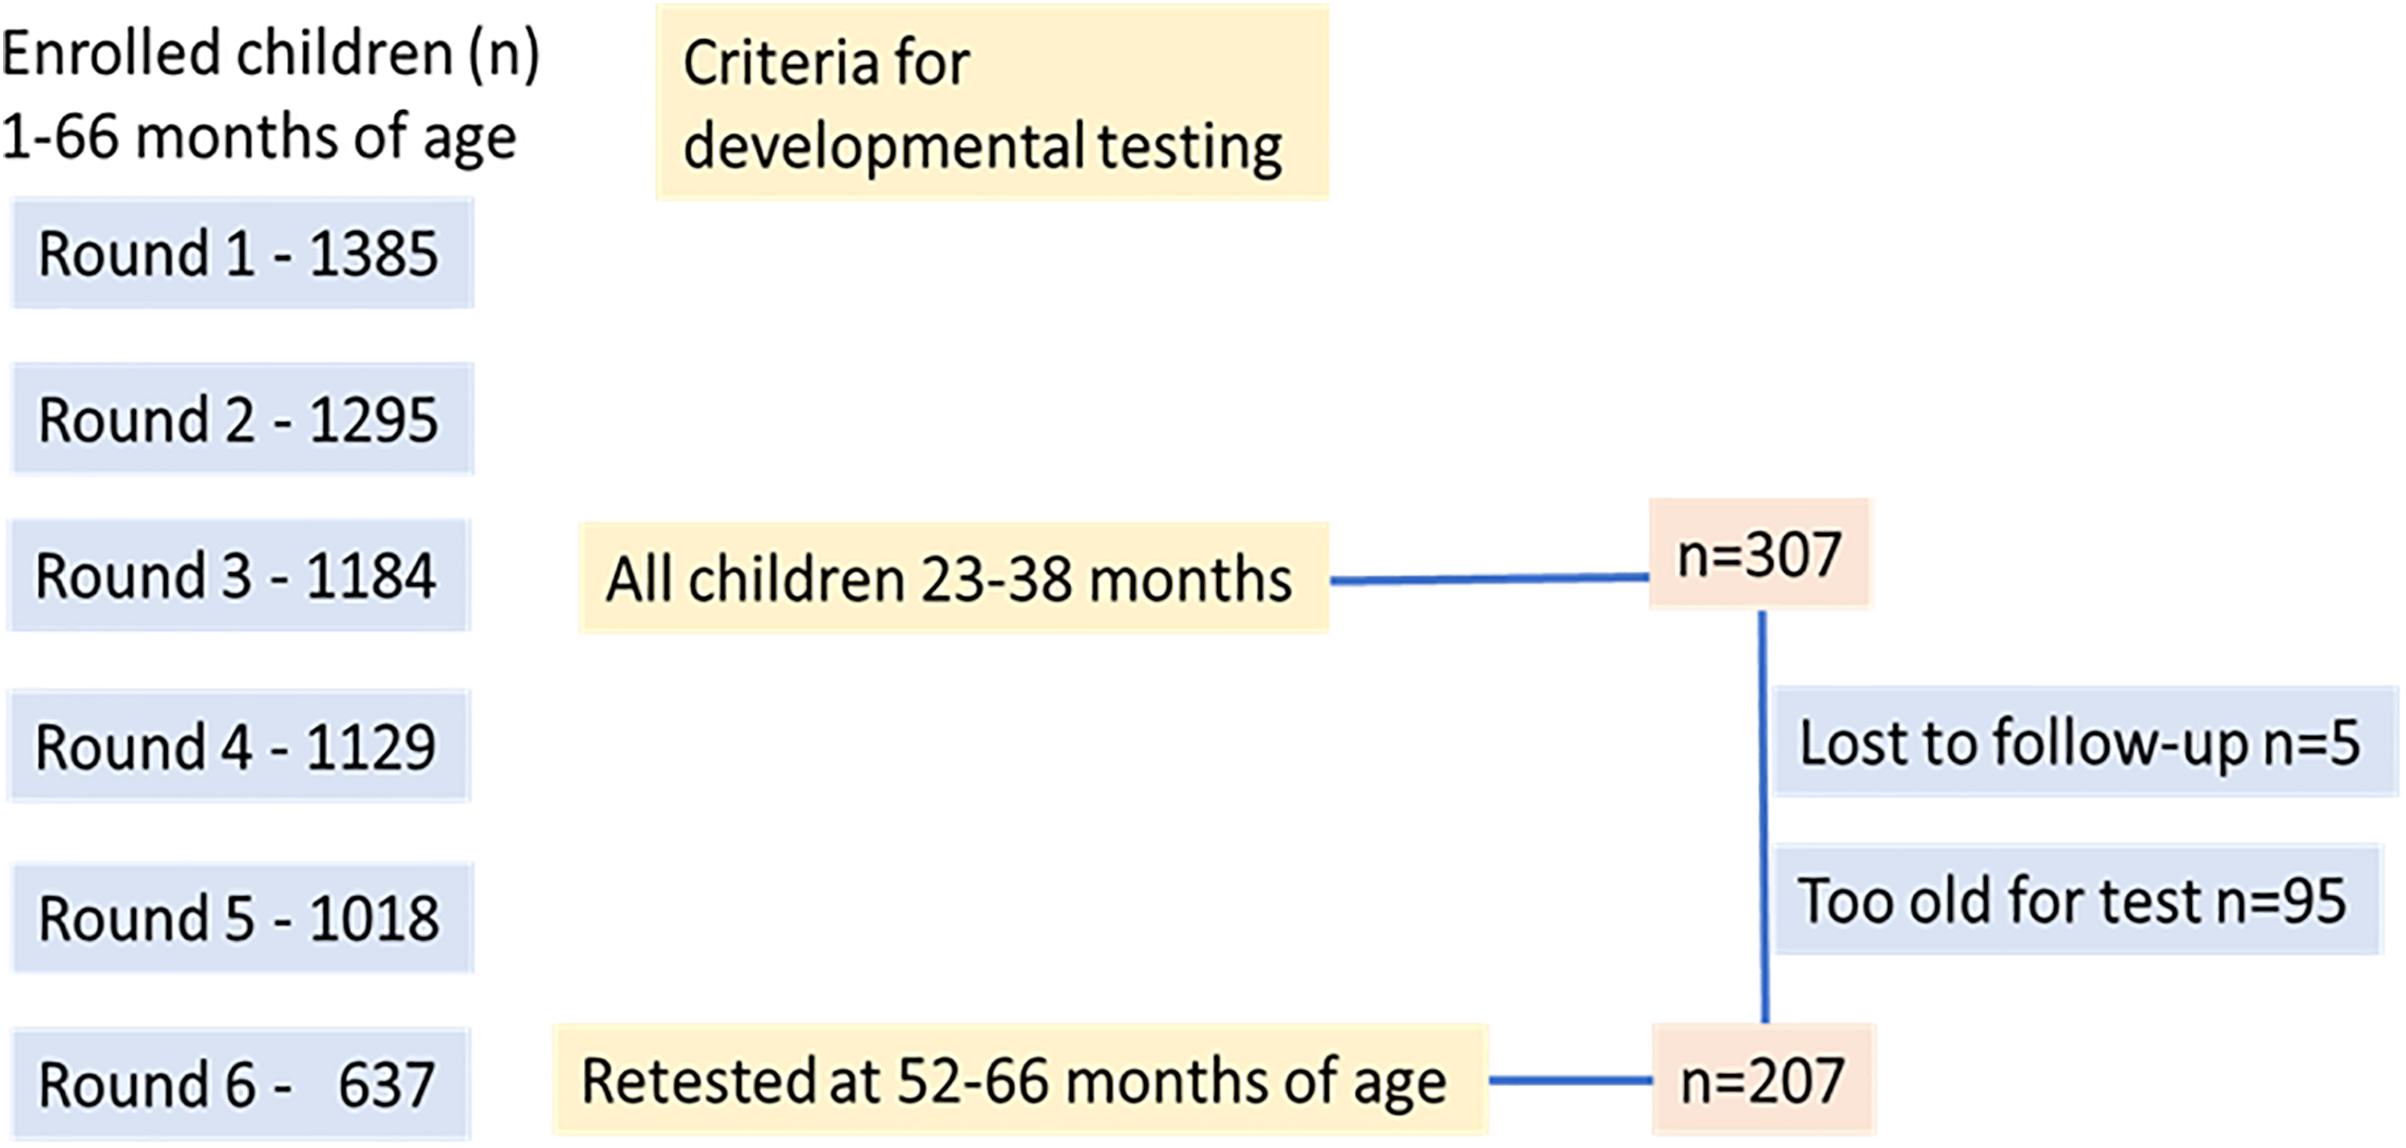
Flowchart showing enrollment in the study and criteria for inclusion in developmental testing. Only children who were tested on both occasions were eligible for inclusion in the cohort.
Field Procedures
For each household visit, field enumerators completed a 145-item questionnaire with the child’s mother; a supervisor was also present for part of each visit. The core of the questionnaire was based on the Nepal Demographic and Health Survey 41 with additional modules to assess child development and other relevant indicators as described below.
Child Developmental Assessment
Child development was assessed using the Ages & Stages Questionnaire 3 (ASQ-3). This standardized screening instrument is used worldwide (including Nepal) to assess child development. 38,39,51 -54 Feasibility and construct validity in northern India 55,56 as well as in Nepal have recently been reported. 54,57 The test is scored by observation (or parent report) and consists of 30 age-specific items within 5 domains: communication (eg, at age 30 months, correctly naming pictures of items such as a ball, a hat), gross motor (able to jump with both feet leaving the ground at the same time), fine motor (able to string beads), problem-solving (identifying his/her image in a mirror), and personal–social skills (able to put on a jacket or shirt independently). The instrument was translated and back-translated from English to Nepali, minor changes were made to adapt to local conditions, and pilot-tested for clarity.
The test was administered by field enumerators who received 7-day didactic and practical training before each round of testing; the training was conducted under the supervision of a Nepali child development pediatrician specialist. Interrater reliability exercises were conducted as part of the training for the 4 enumerators and 2 supervisors. At the end of the training period, 7 children were assessed by each trainee their results were compared to the results obtained by the child development pediatrician. Agreement between the assessments of the trainees and the expert was 96%. In addition, a child development nurse specialist accompanied the field enumerators to the study area and served as an on-site supervisor for the first 2 weeks of each of the 4-week periods of data collection. She also remained available to the field team by phone for consultations and problem-solving throughout the period of data collection.
Standard methods were used to score the ASQ-3 (hereafter, ASQ). 58 One advantage of the ASQ is that it can either be assessed directly by a trained examiners or answered by caregivers. 56,57 In this study, we used both approaches, prioritizing observations by trained examiners over caregiver response. A score of 10 was assigned if the child was observed/reported to “always” practice the behavior, 5 if the child sometimes practiced the behavior, and 0 if the child could not/did not practice it. Contributing variables for each subdomain were evaluated and those showing no variance were removed from the score, and the relative contribution of other items for that subdomain were weighted accordingly. Scores <50 points for total ASQ score were removed as these were felt to represent implausible scores; the scores of 3 participants thus were accordingly removed. Scores <10 for the 5 subscales were also removed for this reason (from 2 to 6 per subscale). The results of the ASQ testing was assessed in 2 manners: (1) total and subdomain scores as continuous variables and (2) total score quartile (bottom quartile vs top 3 quartiles). Children in the bottom quartile were designated as having poorer development, as previously described. 51 -54,59
Child Anthropometry
Child growth was assessed at each field visit by a team of 2 field enumerators assisted by a supervisor. Weight was measured with Seca 835 electronic scales, calibrated before each measurement. Standing height (>2 years) was measured with a portable Seca 213 stadiometer. Head circumference was assessed with disposable paper tapes at the maximum occipitofrontal measurement. Mid-upper arm circumference (MUAC) was measured with disposable insertion tapes (Harlow Ltd) on children <60 months of age. Enumerators received 7 days of didactic and practical training before each round of testing; the training was supervised by a US board-certified pediatrician. At the end of the training period, interrater reliability exercises were conducted: 11 children were assessed by each of the enumerators, and their results were compared to those of the supervisors. Correlations ranged from 0.83 to 0.99; median differences in the results obtained by the enumerators and supervisors were −0.1 kg, 0.4 cm, 0 cm, and −0.1 cm, respectively, for weight, height, head circumference, and MUAC. In the field, equipment was calibrated prior to each use. Measurements were obtained twice with anthropometry team members switching roles. Results were then averaged. If results were >5% discrepant, additional measurements were obtained to resolve the discrepancy. Results were converted to z scores (HAZ, weight-for-age [WAZ], head circumference-for-age [HCZ], mid-upper arm circumference-for-age [MUACZ]) using WHO Anthro 60 or for older children using WHO Anthro Plus. Weight-for-height z scores were calculated for children <60 months; for children >60 months, body-mass-index z score (BAZ) was used. The prevalence of underweight, stunting, and wasting was determined according to World Health Organization standards (< −2 for WAZ, HAZ, and WHZ/BAZ, respectively). 60
Child Diet
Several measures of child dietary quality were assessed at each household visit. Each mother responded to a questionnaire asking if the child had consumed any of 12 specific foods/food groups within the past 24 hours. 61 Diet intake questions used local terminology for common foods and included detail to capture all items in each category (for example, the question regarding grain intake was “Did your child consume rice, chapattis, or other foods made from millet, maize, or lito?”). Information about quantity or frequency (within the 24-hour time period) was not obtained. These foods were then combined into 8 food categories, based on the Food Agriculture Organization/Food and Nutrition Technical Assistance (FAO/FANTA) dietary diversity scores: starchy staples (grains and white potatoes); vitamin-A rich fruits and vegetables (including dark leafy green vegetables); other fruits and vegetables; offal, meat, and fish; eggs; legumes, nuts, and seeds; milk and dairy products; and oils. 62,63 This information was used to calculate the child’s diet diversity score (DDS). The DDS was thus the sum of the 8 food group categories consumed at each round of data collection (range 0-8). 64,65 We also separately enumerated each type of ASF consumed to create an ASF score. For this ASF score, each of the individual ASF types (meat, fish, offal, eggs, milk, other dairy products; range: 0-6) consumed in the previous 24 hours by each child was counted separately. 64,65 Thus, if the child ate meat and fish, the score was “2.” If the child consumed milk, yogurt, and fish, the score was “3.”
Child Education
The child’s educational experiences were also ascertained as part of the household questionnaire. Mothers responded to the question of whether their child attended school (including early childhood education programs).
Household Characteristics
Multiple indicators of socio-economic status (SES) were collected, including animal ownership (converted to a standardized score using FAO Global Livestock Units 66 ) and amount of land owned (square meters). Annual income (NPR, Nepali rupees) was collected directly and verified based on reports of the household’s monthly expenditures. Wealth scores were based on household possessions and quality of housing (including toilet and water) using principal components analysis following Demographic and Health Survey-Nepal guidelines. 41 The level of mother’s education on child outcomes was also incorporated into the analysis. The educational status of the mothers was classified as (1) none or simple literacy classes, (2) some or completed primary school, and (3) some or completed secondary school (or beyond).
Statistical Analysis
Data were entered and analyzed with JMP 13.1 and Stata 13.0. Analysis was conducted at the individual and household level, in accordance with the social ecological model. Individual child factors included age, gender, diet, anthropometry, and school attendance; household factors included intervention group assignment, mother’s education, wealth, animal and land ownership, and income. Analysis started with a description of the variables, including t-tests and analysis of variance, followed by a series of χ2 tests. Separate regression analyses were performed for the 2 time points (when the children were 2 and 5 years old) to consider a priori confounders of the relationship between social ecological factors and child development. First, unadjusted regressions were done including potential confounders related to the child (sex, diet, growth parameters [HAZ, WAZ, HCZ]) and household (intervention group assignment, SES [wealth, animal ownership], and mother’s education). Variance inflation factors were used to test explanatory variables for collinearity; except for the 2 diet measures, results were <1.4. As the DDS score incorporates measures of ASF consumption, the VIF for the 2 diet indicators ranged from 2.2 to 3.1; therefore, separate regressions were performed to test each of these measures separately. Variables were retained in the final model if they significantly (P > 10%) predicted the relationship in the unadjusted model at both age 2 and 5 years.
Results
The characteristics of the 207 children and their households are shown in Table 1, which compares the findings at age 2 years and at age 5 years (shaded in green), as well as the results by ASQ total score quartile (upper 75th vs lower 25th) at age 2 years (shaded in yellow) and age 5 years (shaded in blue). Over the 33 months between these 2 assessments, household income increased (P < .001), but not other measures of household wealth (possessions, land or animal ownership). Diet and growth also improved significantly. Most notable was the marked reduction in stunting between age 2 years and age 5 years, from 58% to 27% (P < .0001). As similar improvements in weight did not occur, a corresponding increase in wasting was also noted. Also notable was the change in preschool attendance, in accordance with the increasing age of the children. At age 2 years, none of the children attended preschool, but by the time the children reached age 5 years, 70% were in preschool.
Household and Child Characteristics.
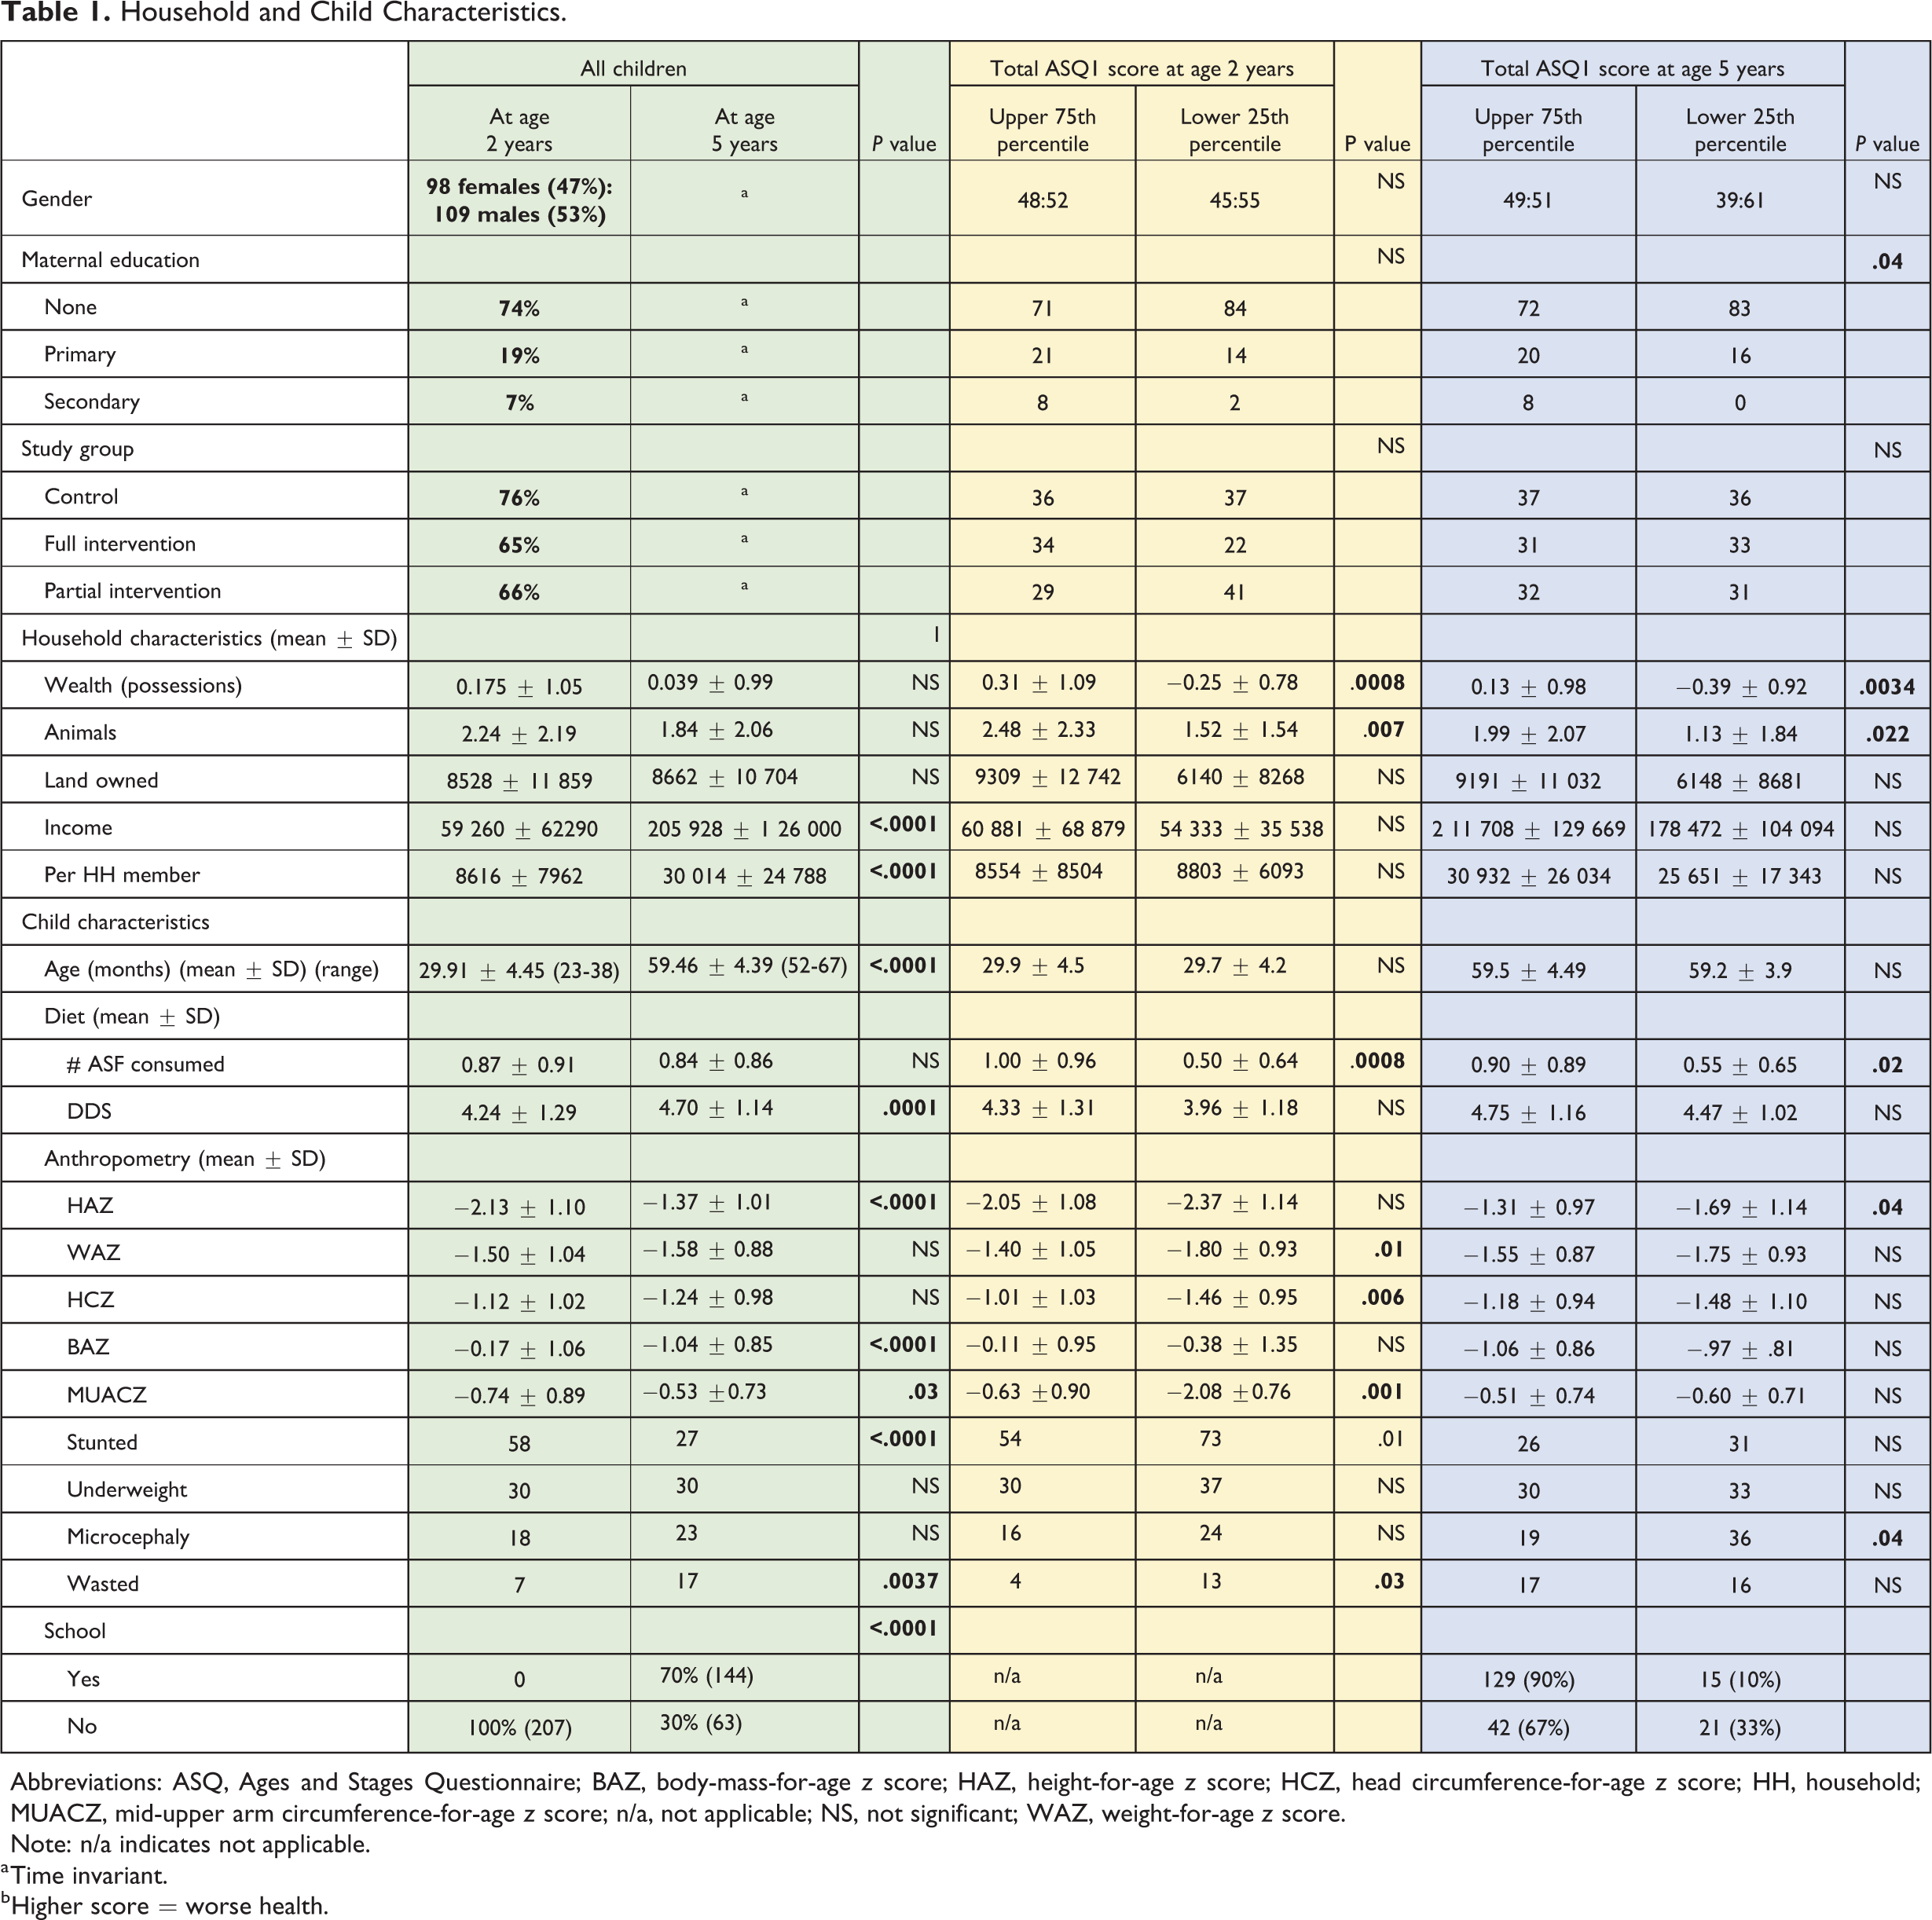
Abbreviations: ASQ, Ages and Stages Questionnaire; BAZ, body-mass-for-age z score; HAZ, height-for-age z score; HCZ, head circumference-for-age z score; HH, household; MUACZ, mid-upper arm circumference-for-age z score; n/a, not applicable; NS, not significant; WAZ, weight-for-age z score.
Note: n/a indicates not applicable. a Time invariant.
b Higher score = worse health.
The relationship of some household and dietary factors to child developmental performance was consistent at both age 2 and 5 years (Table 1). At both time points, children with ASQ total scores in the upper 75th percentile lived in households which had significantly higher wealth and animal ownership scores than those of children with scores in the lowest 25th percentile. Higher-scoring children also had better ASF consumption at both time points.
However, the relationship of child growth to developmental performance differed at age 2 and 5 years (Table 1). At age 2 years, children in the upper 75th percentile for total ASQ score had higher mean WAZ, HCZ, and MUACZ scores and less stunting and wasting than children with ASQ scores in the lowest 25th percentile. The relationship of anthropometry to developmental performance differed when the children were reassessed at age 5 years. At this age, the only differences found between children with high and low ASQ scores were that the former had higher HAZ and less microcephaly. Finally, mother’s educational level did not relate to child ASQ score when the children were evaluated at age 2 years. However, better educated mothers were more likely to have children who scored in the upper 75th percentile when the children were evaluated at age 5 years. Thus, relation of child development to child anthropometry and maternal education diverged between age 2 and 5 years, while the relation of child development to household wealth and child diet remained consistent at both ages.
Next, we examined the results of the ASQ subdomains at age 2 and 5 years (Table 2). Although the mean total ASQ scores did not differ significantly between these 2 assessments, the mean scores for 3 of the 5 subdomains decreased significantly (communication, fine motor, problem-solving), while mean scores for the remaining 2 subscales significantly increased (gross motor, personal–social). This suggested the possibility that the subdomains related differently to the household and child factors at age 2 and 5 years. The change in scores was related to school attendance; children who attended school had significantly greater increase in ASQ total between age 2 and 5 years than children who did not attend school. Although scores for fine motor and problem-solving domains both decreased from age 2 years to age 5 years, children who attended school showed smaller decreases in these skills. In contrast, children who did not attend school had significantly greater increases in their gross motor skills, possibly reflecting that these children had more time for outdoor free play than school goers 67,68 .
Change in ASQ Total and Subdomain Scores, Age 2 Years and Age 5 Years.
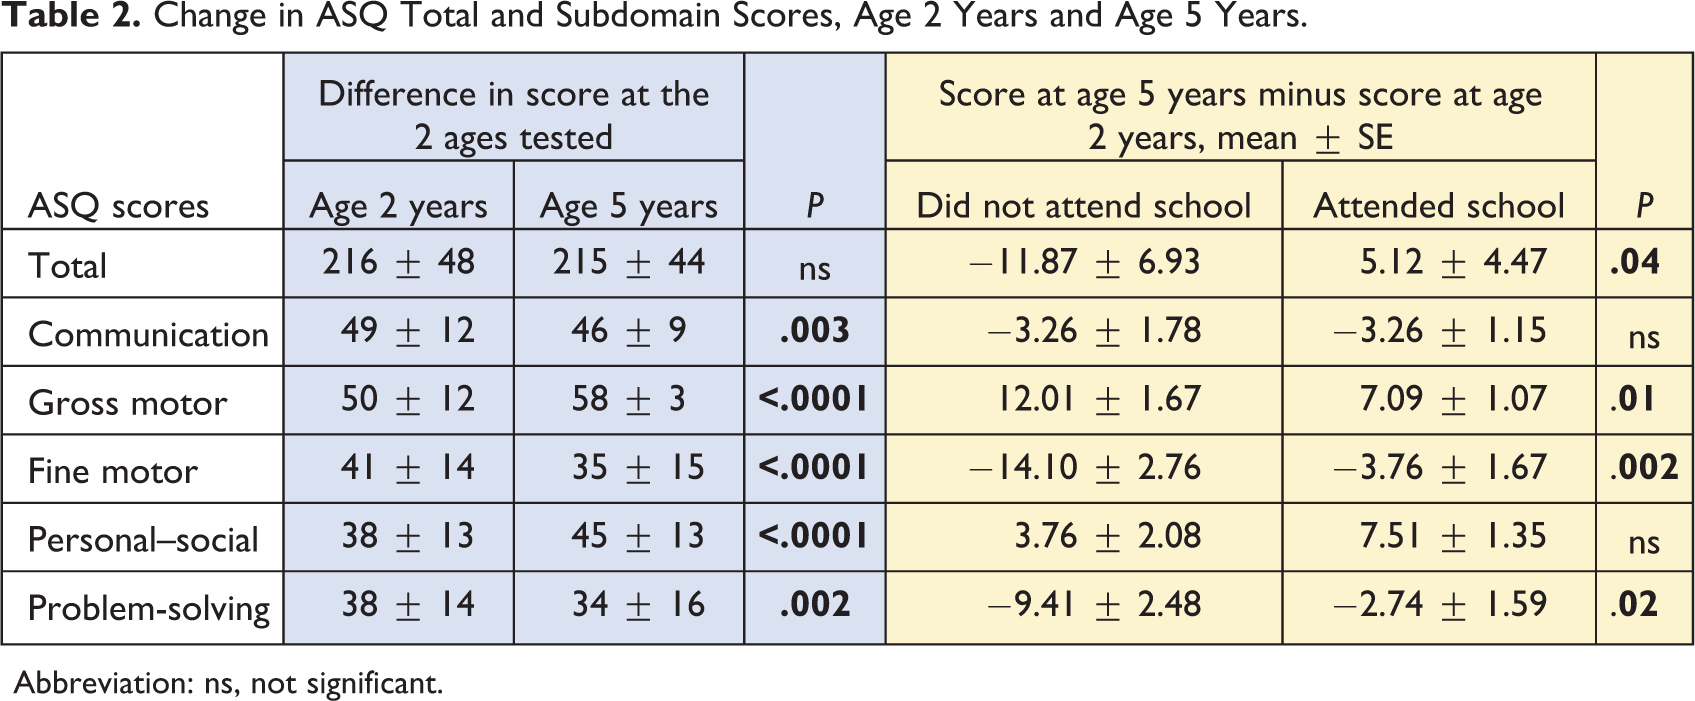
Abbreviation: ns, not significant.
To explore the relationship of household and child factors with ASQ subdomain scores.
Relationship of Household and Child Characteristics to Developmental Performance at Age 2 Years and Age 5 Years, Adjusted.
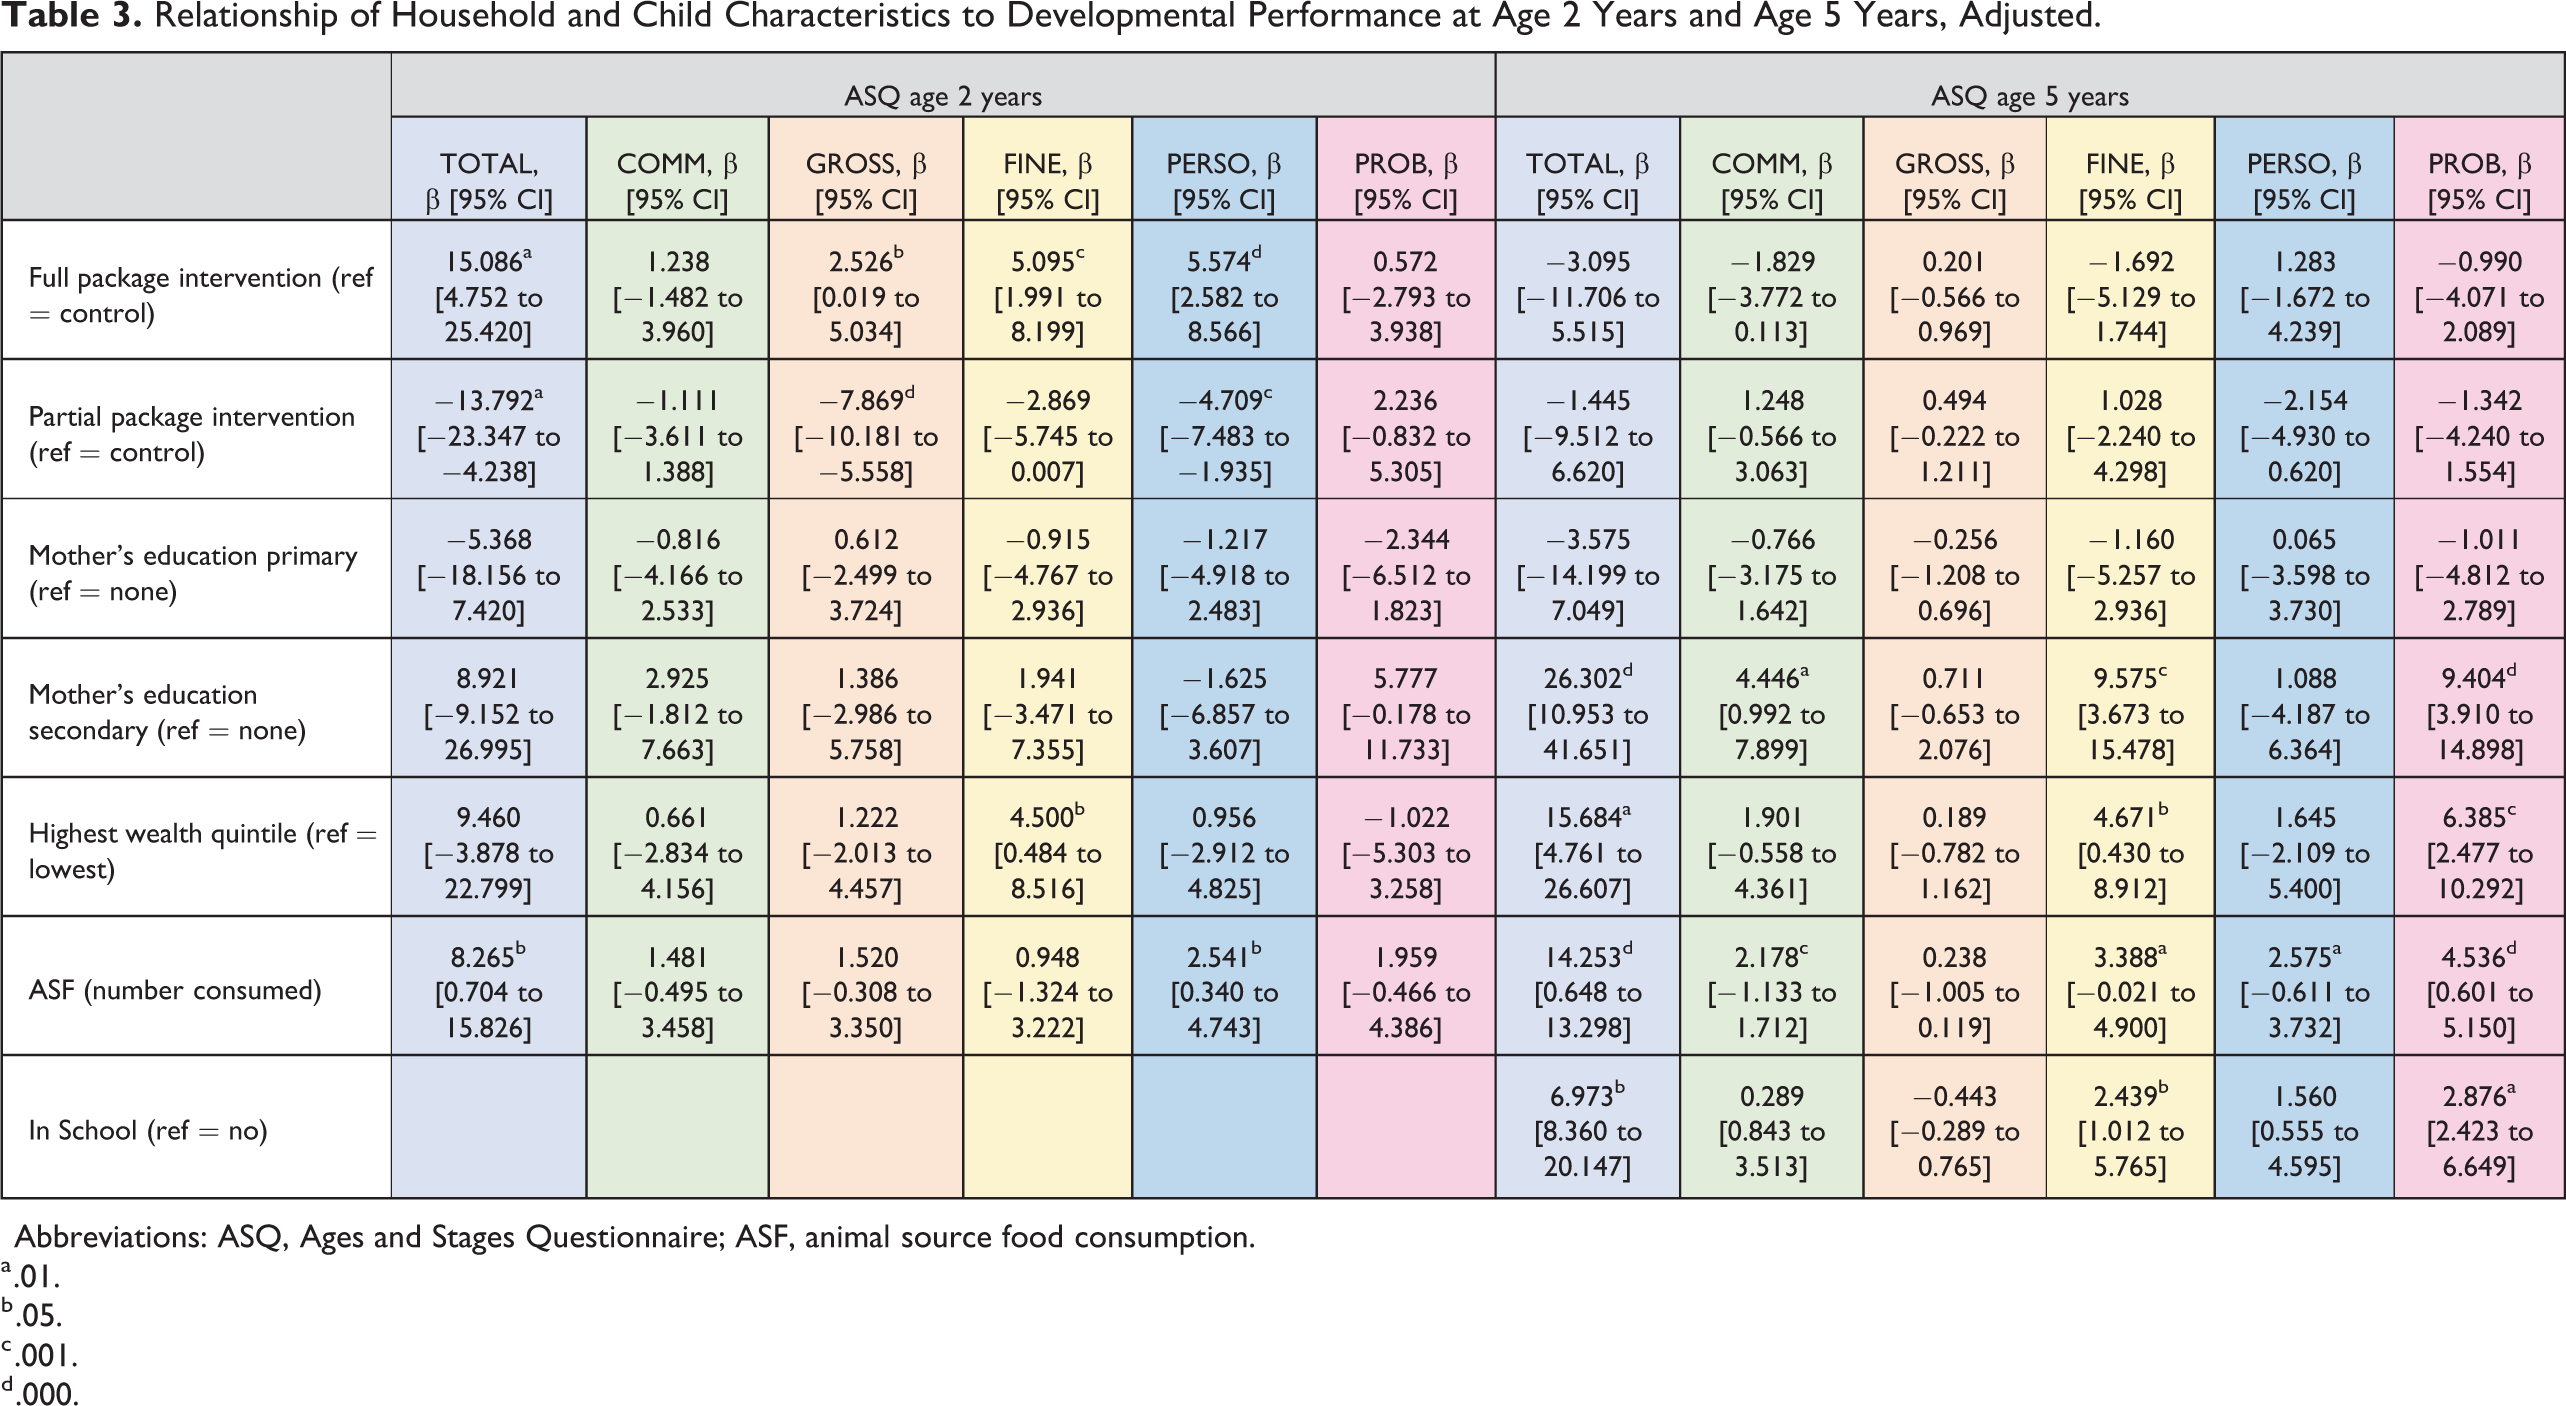
Abbreviations: ASQ, Ages and Stages Questionnaire; ASF, animal source food consumption.
a .01.
b .05.
c .001.
d .000.
To explore the relationship of household and child factors with ASQ subdomain scores at age 2 and at age 5 years, unadjusted (Supplemental Table 1) and then adjusted regression models (Table 3) were constructed, including each of the 2 dietary indicators (ASF consumption score and DDS) separately.
The adjusted models showed notable differences in the relationships between child diet and household factors when examined at the 2 ages (Table 3 shows model using ASF as the dietary indicator; the model including DDS is found as Supplemental Table 2).
At age 2 years, when ASF consumption was included as the dietary variable (Table 3), study area was an important predictor of ASQ results. Compared to membership in the control group, household membership in the full package intervention group was strongly associated with better ASQ total score, as well as better gross and fine motor and personal–social scores. In contrast, household membership in the partial package intervention group (compared to the control group membership) was negatively associated with total, gross motor, and personal–social scores. When DDS was used as the dietary variable (Supplemental Table 2), household membership in the full package intervention group was strongly associated with better ASQ total score, as well as better fine motor and personal–social scores (compared to the control group membership). Membership in the partial package group was negatively associated with total, gross motor, and personal–social scores (compared to the control group membership). In contrast, at age 5 years, intervention group assignment was no longer significant, regardless of the dietary variable included in the model.
Mother’s educational level showed a different pattern. Mother’s education did not relate to the total nor any of the ASQ subscales, with either of the dietary variables when the children were 2 years old. However, higher levels of mother’s education predicted better total, communication, fine motor, and problem-solving scores when the same children were assessed at age 5 years.
Only the highest wealth quintile (compared with the lowest) predicted developmental performance. The same pattern was seen with both dietary indicators. Being in the highest wealth quintile related to better fine motor performance at age 2 years and to better total, fine motor, and problem-solving scores at age 5 years.
The relationship of child diet to developmental performance was more pronounced at age 5 years compared to age 2 years. At age 2 years, for each increase in the number of ASFs consumed, total ASQ score increased by 8.2 points and personal–social score by 2.5 points. At age 5 years, for each increase in the number of ASFs consumed, better total (14.2 points), communication (2.1 points), fine motor (3.3 points), personal–social (2.5 points), and problem-solving (4.5 points) scores were found. DDS related only to personal–social scores at age 2 years. We also tested the association of cumulative measures of these dietary indicators and child developmental performance, but the results were greatly attenuated (data not shown).
Finally, 70% of children attended some form of preschool by age 5 years. School attendance was strongly related to developmental performance at this age. When adjusted for ASF consumption, school attendance was related to total, fine motor, and problem-solving scores. When DDS was used as the dietary variable, school attendance was related to these domains as well as to communication and personal–social performance.
Discussion
Child development is a complex, dynamic process subject to different influences over time. Researchers have called for longitudinal studies to elucidate sensitive periods and the many factors which influence developmental performance. 12,23 The relationship of the timing, severity, duration, and number of child and contextual risk factors is incompletely understood. Even less is known about how various risk factors may influence different developmental domains. Although considerable attention has focused on these issues during the first 1000 days, growing evidence emphasizes the parallel importance of the second 1000 days, the period which leads up to school entry. Early school performance strongly predicts later school achievement, which then relates to economic status in adult life. 17,26,69 -72 Thus, better understanding of factors that influence child developmental performance during the second 1000 days is needed to design and target effective interventions which could have long-lasting and important benefits. 12 Differentiating the factors that influence specific developmental domains is essential to appreciate the dynamic and multifaceted nature of child development.
In this study, a small group of children in a resource-poor area of rural Nepal were studied at age 2 years and again at age 5 years. Their developmental performance was assessed using age-appropriate modules of the same test, the ASQ. After adjustment for several household and child characteristics, different factors were related to developmental performance at these 2 distinct ages. First, at age 2, intervention group assignment was related strongly to developmental performance, but this relationship was not found at age 5 years. At age 5 years, the time commitments for participation in the interventions had markedly decreased. Furthermore, all 3 groups (full package, partial package, and control) had received similar inputs by this time. However, at age 2 years, household membership in the full package group was positively associated with child developmental performance (ASQ total score increased by 15 points), while membership in the partial package group was negatively associated with developmental performance (ASQ total score decreased by 13 points). It is noteworthy that the intervention—either the full package or partial package—did not address child development in any way. Nevertheless, these findings suggest that participation in a household- or community-level intervention may influence this important outcome even if the intervention is unrelated to child development. Moreover, the impact on child development may be either favorable or adverse, depending on the intervention provided. At age 2 years, children in full package households performed significantly better on developmental tests than the control group; in contrast, children in the partial package households fared significantly worse. In addition to training in family nutrition and livestock husbandry, the full package intervention group members also received intense training in community mobilization and opportunities for empowerment. Although we did not evaluate this directly, it is plausible that mothers in the full package intervention group acquired increased empowerment and personal agency, which could have translated to better quality child care and resultant better child developmental performance. Alternatively, the better child performance could have reflected greater involvement of other family members who may have been motivated by the mother’s participation in the full package intervention group activities to spend more time with the children. In contrast, while the time commitment for training for members of the partial package intervention group was considerably less than for members of the full package intervention group, it is also plausible that these mothers did not personally receive the benefits which could have translated into better parenting quality for their children.
In contrast to the pattern seen for intervention group assignment, maternal education and household wealth quintile showed stronger relations to child developmental performance at age 5 years than at age 2 years. These findings suggest that inputs derived from household wealth and maternal education were more important to the children at age 5 years. At age 5 years, it is reasonable to believe that toys, books, and various enriching experiences became more important to supporting developmental progress. Such items were likely more available in wealthier households with more educated mothers. Notably, however, only children in the highest wealth quintile obtained this advantage, suggesting a possible threshold effect in this generally low-resource environment.
The analysis at age 5 years highlighted the importance of preschool attendance at this age. Children who attended any school program had significantly better total scores (increased by 6.9 points), as well as fine motor (increase by 2.4 points) and problem-solving skills (increase by 2.8 points). These domains are of particular interest, as they are linked with executive function and academic success. 70,72 -75 Some research suggests that children from less advantaged households may benefit even more from preschool education than children from more advantaged backgrounds. 22 School quality also plays a role in children’s success. 76 ; however, we did not examine this variable.
The importance of good nutrition to optimal child developmental performance is widely recognized, and the particular benefits of ASF consumption have been emphasized. 36,77 -81 In this small cohort study, a relation between ASF consumption and child developmental performance was found at age 5 years in 4 out of the 5 subdomains, as well as the total score. At age 2, ASF consumption was related to personal–social skills and total score. The difference in the relation of ASF consumption to developmental results between age 2 and age 5 was unexpected, especially as the mean number of ASF consumed at the 2 ages did not differ. However, we did not measure quantity or frequency of ASF consumed, and it is possible that the amount consumed by the younger children was not sufficient to show a strong relationship with developmental performance at that age. It is also possible that at age 5 years the children consumed larger amounts of ASF more frequently, resulting in a statistically stronger relationship to developmental test results. It is also plausible that nutrients derived from ASF are prioritized differently at these 2 ages to meet these changing needs, for example, for physical growth in the early years and for cognitive development as children grow older.
In addition to ASF, specific food groups (especially vitamin A-rich fruit and vegetables) have also been cited as possibly relating to child developmental performance. 39 We did not examine individual food items separately in this analysis. Instead, DDS was used; surprisingly little relationship between this indicator and child development at either age was noted despite the fact that DDS included ASF intake (milk and other dairy products, meat/fish/offal, and eggs). This may have reflected the way these scores were calculated; the ASF score considered each of these 6 food groups separately. We do not wish to discount the potential contributions of a diverse diet to better child cognitive outcomes. Indeed, in unadjusted models, DDS was related to personal–social skills at age 2 years and to problem-solving skills at age 5 years. We have previously reported on the relationship between minimum dietary diversity, consumption of ASFs, fruits and vegetables, cumulative DDS, and ASQ results in young children. 38,39 In the present small sample, however, we found a stronger and more consistent relationship between child developmental performance and ASF consumption than with DDS. We are unaware of other studies that have directly compared the relation of child development to ASF sum and DDS.
Our study had several strengths and possible limitations. We had the opportunity to screen a cohort of children on 2 occasions almost 3 years apart. These assessments bracketed the “second 1000 days,” a period of importance leading to school entry. We used age-appropriate modules of the same developmental test, administered by the same group of enumerators, allowing comparisons at these 2 time points. We also analyzed the relation of 2 dietary indicators to child developmental performance, allowing a direct comparison of these associations. The use of a cohort, where each child’s developmental status was assessed at age 2 and 5 years, was expected to reduce the influence of potential unmeasured variables. For example, some household characteristics, such as parental involvement and caregiving practices, could have been expected to remain relatively consistent over the study period even if these were not measured directly. However, we did not include a measure of parental engagement at both time points and therefore were unable to include this potentially important indicator in the analysis. 23,82 We recognize that our small sample size represents the most important limitation of our study, and indeed, this may have obscured important findings. A larger sample size may possibly have decreased the CIs for some analyses, and more or a different pattern of relationships between child development and household characteristics may have been identified. An additional limitation is the ASQ test, which does not provide age-equivalents of the child’s developmental status but functions as a screening instrument to identify children with possible developmental delays. Yet it has been a useful and practical tool for population-level developmental assessments at the household level as it captures a wide range of adaptive behaviors in Nepal 52 -54 and elsewhere. 83 It has been shown to be reliably administered by nonprofessional field staff after adequate training. Additionally, we recognize that our results were specific to the particular diet measures that we analyzed. Finally, although we attempted to control for multiple social ecological and child factors (including our choice to limit the analysis to a cohort of children assessed on 2 occasions), numerous unmeasured variables (eg, child health, school quality) could have affected the results. 7,41,76 Variables that were significant in unadjusted analyses were attenuated after adjustment for important household (group assignment, wealth, maternal education) and child (diet) factors and were thus omitted from the final model. Alternate measures of these omitted factors may have revealed relationships to developmental performance even after adjustment. Nonetheless, we were able to show that different household and child factors related to child development at age 2 years and at age 5 years and that participation in a community/household-level intervention could positively or negatively impact child development, even if this was not a focus of the intervention.
In conclusion, our findings emphasize the many factors in the child’s milieu which relate to developmental performance differ with child age and also by developmental domain. These results emphasize the complexity of understanding the individual, family, and social ecological factors that influence child development. Comparison of these relationships at different ages permits a more nuanced understanding of the timing and duration of exposure to potential risk factors on these important child outcomes and emphasizes the dynamic nature of child development. Even within the relatively short period from the beginning to the end of the second 1000-day period, the relationship of household and child factors to child developmental performance changes. Better understanding of these factors and the timing and mechanisms of their relation to child developmental performance are needed for effective design of interventions to improve child development in resource-poor settings.
Supplemental Material
Supplemental Material, sj-pdf-1-fnb-10.1177_0379572120987976 - Child Diet and Household Characteristics Relate Differently to Child Development at the Beginning and the End of the Second “1000 Days” in Rural Nepal
Supplemental Material, sj-pdf-1-fnb-10.1177_0379572120987976 for Child Diet and Household Characteristics Relate Differently to Child Development at the Beginning and the End of the Second “1000 Days” in Rural Nepal by Laurie C. Miller, Sumanta Neupane, Neena Joshi, Mahendra Lohani and Andrew Thorne-Lyman in Food and Nutrition Bulletin
Supplemental Material
Supplemental Material, sj-pdf-2-fnb-10.1177_0379572120987976 - Child Diet and Household Characteristics Relate Differently to Child Development at the Beginning and the End of the Second “1000 Days” in Rural Nepal
Supplemental Material, sj-pdf-2-fnb-10.1177_0379572120987976 for Child Diet and Household Characteristics Relate Differently to Child Development at the Beginning and the End of the Second “1000 Days” in Rural Nepal by Laurie C. Miller, Sumanta Neupane, Neena Joshi, Mahendra Lohani and Andrew Thorne-Lyman in Food and Nutrition Bulletin
Footnotes
Authors’ Note
L.C.M. designed the study, supervised data collection, performed initial statistical analysis, and wrote the initial draft of the manuscript. S.N. supervised the statistical analysis and interpretation and critically revised the manuscript. N.J. made substantial contributions to the concept and design of the work and the acquisition of the data. M.L. made substantial contributions to the concept and design of the work and the acquisition of the data. A.T.-L. contributed substantially to the design of the study, data analysis, and critically revised the manuscript.
Acknowledgments
We sincerely thank the participating children and their families. We also gratefully acknowledge the support of Heifer Nepal staff and Valley Research field enumerators. Tor Strand, Mari Hysing, and Ingrid Kvestad provided invaluable assistance. Dr. Merina Shrestha and Dr. Laxman Shrestha (Institute of Medicine, Nepal) also provided essential support.
Declaration of Conflicting Interests
The author(s) declared no potential conflicts of interest with respect to the research, authorship, and/or publication of this article.
Funding
The author(s) disclosed receipt of the following financial support for the research, authorship, and/or publication of this article: Support for this effort was provided by the Feed the Future Food Innovation Lab for Nutrition which is funded by the United States Agency for International Development (USAID).
Supplemental Material
Supplemental material for this article is available online.
References
Supplementary Material
Please find the following supplemental material available below.
For Open Access articles published under a Creative Commons License, all supplemental material carries the same license as the article it is associated with.
For non-Open Access articles published, all supplemental material carries a non-exclusive license, and permission requests for re-use of supplemental material or any part of supplemental material shall be sent directly to the copyright owner as specified in the copyright notice associated with the article.