
Abstract
Background:
Rwanda’s commitment to reducing malnutrition is evident in their multisectoral nutrition policy and wide array of nutrition partners. However, the prevalence of micronutrient deficiencies and the suitability of current strategies to address existing deficiencies is unclear.
Objective:
To review the available evidence related to the prevalence of micronutrient deficiencies across the life cycle and strategies in place to address them.
Methods:
We reviewed scientific and grey literature on nutritional problems in Rwanda, emphasizing micronutrient deficiencies and anemia, and current strategies to address micronutrient malnutrition.
Results:
Overall, there is scant evidence related to the types and prevalence of micronutrient deficiencies among populations across the life cycle in Rwanda. Existing evidence is primarily limited to outdated or small regional surveys focusing on iron or vitamin A among women and young children. Surveys have assessed the prevalence of anemia and indicate that anemia is very high among young children and moderately high among other age-groups. However, there are limited data on the context-specific causes of anemia in Rwanda across population groups. Current nutrition strategies mainly target women and young children and are primarily designed to reduce vitamin A deficiency and/or anemia caused by micronutrient deficiencies.
Conclusions:
Rwanda has many nutrition programs in place that address micronutrient deficiencies in young children and a few for women of reproductive age. However, gaps exist in knowledge of the extent of different types of micronutrient deficiencies among all populations across the life cycle and whether the delivery of nutrients through current programs is meeting actual needs.
Introduction
Undernutrition is responsible for nearly half of child deaths globally. 1 In particular, micronutrient deficiencies such as vitamin A and zinc are associated with increased morbidity and mortality. 2,3 Micronutrient supplementation in young children, specifically with vitamin A and zinc, could save 145 000 lives if scaled up along with other interventions. 1 Other strategies to address micronutrient deficiencies include food-based approaches, such as fortification and diet diversity, as well as disease control. 4 A combination of multiple strategies is often required and should be tailored to the local needs.
Global efforts to commit to reducing all forms of malnutrition, such as the Scaling Up Nutrition (SUN) Movement, are engaging with countries working to scale up nutrition programs. Rwanda joined the SUN Movement in 2011 coinciding with the government’s National Food and Nutrition Policy (NFNP) 5 and Strategic Plan of 2013 to 2018 6 that discussed ending all forms of malnutrition, including micronutrient deficiencies. Programs highlighted in the NFNP include fortification of staple foods, biofortified crops, targeted fortification (commercially prepared foods or food supplements), home fortification (micronutrient powders [MNPs]), iron and folic acid fortification, and diet diversity. 5 The Rwandan government recently commissioned the National Early Childhood Development Program (NECDP) to oversee nutrition, and new national strategies are being finalized. Reducing stunting is a major focus of the government, as it remains high despite the recovery of stability Rwanda has undergone in the past few decades since the genocide and the efforts by the government and partners to tackle nutrition problems. Anemia prevalence is also high among young children (39%) in Rwanda. However, the extent of micronutrient deficiencies, their potential contributions to nutrition-related problems, and the extent of gaps of information and overlaps of strategies are unclear.
This article aims to review and describe: (1) the prevalence of micronutrient deficiencies and anemia in Rwanda; (2) the causes of micronutrient deficiencies and anemia in Rwanda; (3) strategies being used to address micronutrient deficiencies; and (4) gaps and overlaps in knowledge and coverage of policies and programs.
Methods
A desk review was completed in 2017 to 2018 with Internet searches using Pubmed and Google to search for articles pertaining to micronutrient deficiencies and nutrition interventions and programs in Rwanda. Websites of global and national agencies were reviewed for relevant information. All micronutrients were considered for inclusion. Key terms for searches included “Rwanda” and micronutrients or iron or vitamin A or zinc or folate or vitamin B12 or iodine or anemia or programs or interventions. No limit on time period was used. In 2019, interviews were conducted with staff of the NECDP, United Nations Children’s Fund (UNICEF) Rwanda, and Africa Improved Foods (AIF) to corroborate findings and obtain updated information on nutrition problems, policies, and strategies/programs. Informants were sent a list of questions pertaining to the programs they were involved in and the questions were discussed during the interview. New information gleamed from the interviews that was not available in a publication was cited in the text as personal communication with the institution abbreviation.
Publications on micronutrient deficiencies and anemia were included if they reported a prevalence in any population group of Rwanda. Articles were reviewed by 1 author (JA). The prevalence data were rated according to their public health significance primarily based on World Health Organization (WHO) recommendations (Table 1). 7- 11 The quality of the evidence used to establish these ratings was also assessed (Table 1). Evidence quality was rated as high for national studies conducted later than 2010, as recent data are more relevant to the current situation; moderate for national or large (≥ 500) studies conducted in 2010 or earlier, which are more likely to be representative than smaller or regional studies; or low for small (<500)/regional or preliminary studies (eg, published as abstract) or those conducted earlier than 2000.
Prevalence of Nutrition Problems in Rwanda.
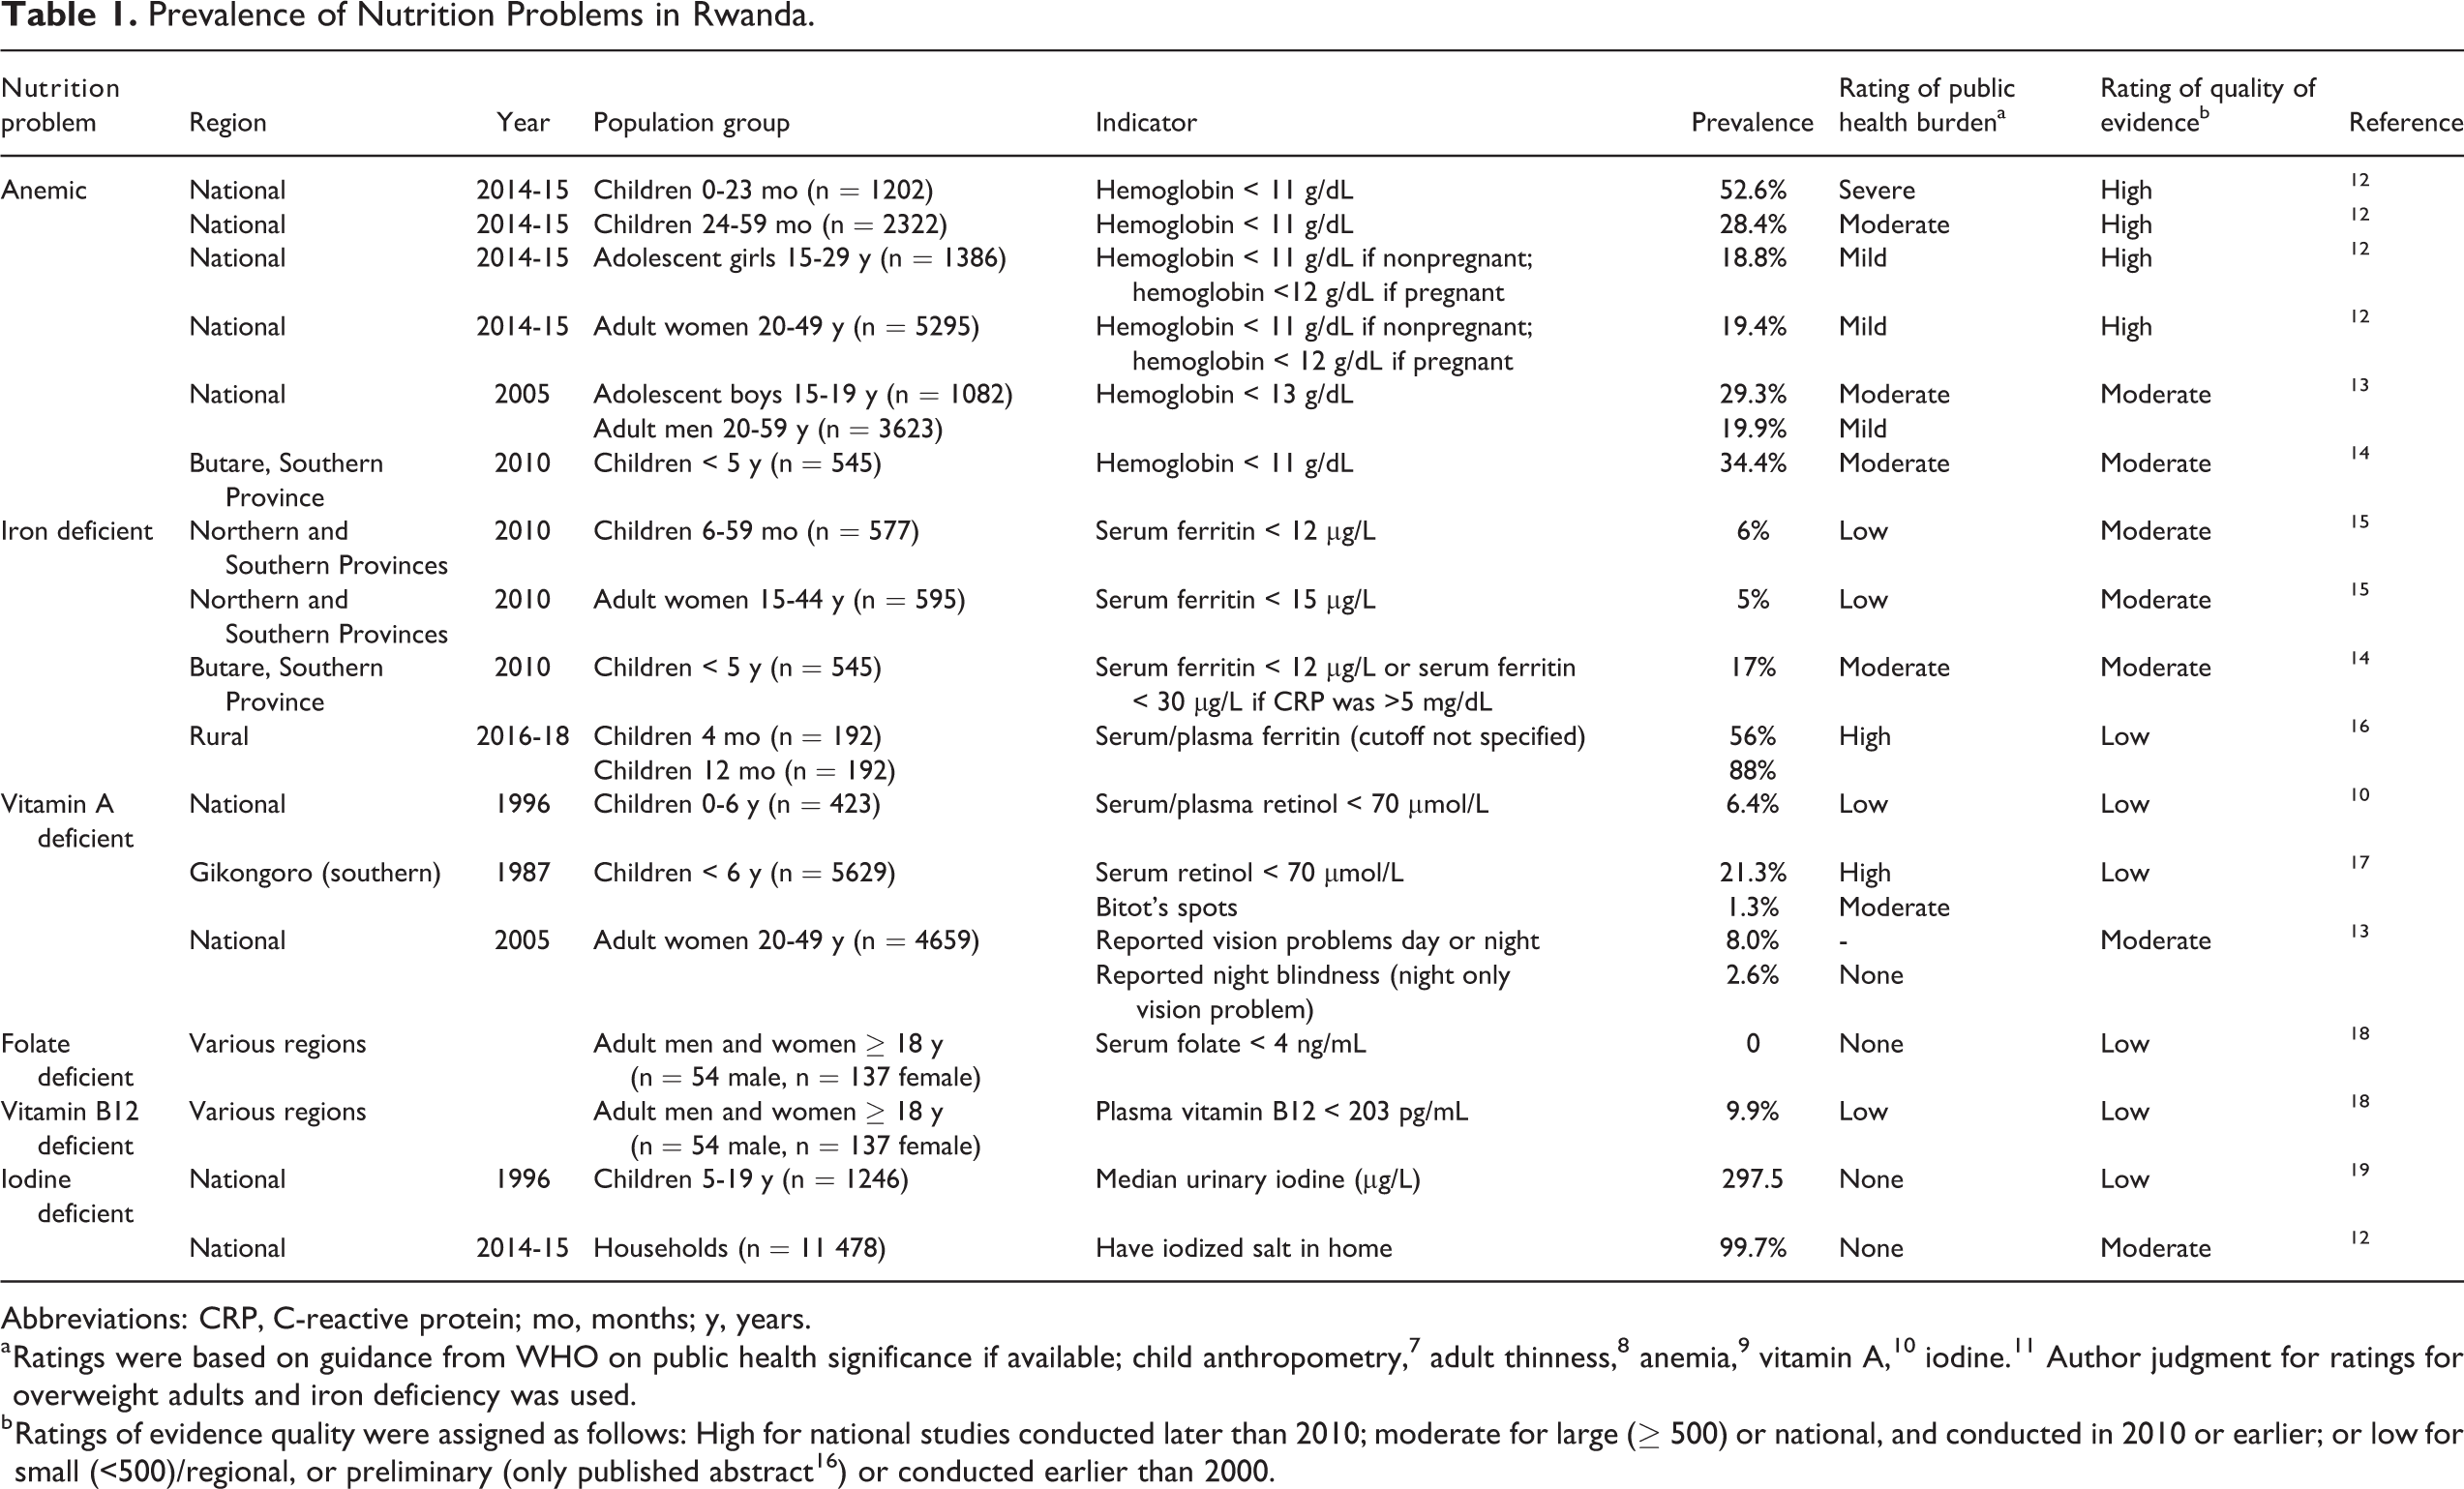
Abbreviations: CRP, C-reactive protein; mo, months; y, years.
a Ratings were based on guidance from WHO on public health significance if available; child anthropometry, 7 adult thinness, 8 anemia, 9 vitamin A, 10 iodine. 11 Author judgment for ratings for overweight adults and iron deficiency was used.
b Ratings of evidence quality were assigned as follows: High for national studies conducted later than 2010; moderate for large (≥ 500) or national, and conducted in 2010 or earlier; or low for small (<500)/regional, or preliminary (only published abstract 16 ) or conducted earlier than 2000.
Findings from the literature review were summarized and discussed in the following main sections: (1) prevalence of micronutrient deficiencies in Rwanda (with subsections by micronutrient); (2) prevalence of anemia in Rwanda; (3) dietary micronutrient intake as a potential cause of micronutrient deficiencies in Rwanda; (4) factors associated with anemia in Rwanda; and (5) strategies to address micronutrient deficiencies in Rwanda (with subsections by strategy). A final section assesses gaps in knowledge and coverage based on available information.
Prevalence of Micronutrient Deficiencies in Rwanda
Iron Deficiency
Evidence of iron deficiency in Rwanda is limited to regional studies in young children and women. The prevalence of iron deficiency has ranged from 5% to 88% among young children 14 -16 and 5% among women in 1 published study. 15 A 2010 survey conducted in the Northern and Southern Provinces, which are 2 of 5 provinces in Rwanda, assessed iron deficiency among 577 children aged 6 to 59 months and 595 adult women. 15 In this study, the prevalence of iron deficiency assessed by inflammation-adjusted serum ferritin was 6% in children (serum ferritin < 12 µg/L) and 5% in women (serum ferritin < 15 µg/L). Another study of 545 children aged <5 years in the Southern Province reported that 17% of the children were iron deficient (plasma ferritin < 12 µg/L) and the prevalence remained the same when an adjusted cutoff (plasma ferritin < 30 µg/L) was used when inflammation was present (C-reactive protein was >5 mg/dL). 14 Lastly, preliminary results from a longitudinal study with 192 children in an unspecified rural Rwandan setting reported that 56% were iron deficient at 4 months of age and the prevalence increased to 88% at 12 months of age. 16 The limited evidence from studies that have been published in peer-reviewed periodicals do not suggest a major problem with iron deficiency, but the high prevalence reported in an abstract format 16 and the lack of recent national data leave uncertainty as to the extent of iron deficiency in Rwanda.
Vitamin A Deficiency
Evidence of vitamin A deficiency in young children and women is available from national surveys conducted 15 to 25 years ago. A 1996 national survey found that 6% of children aged 0 to 6 years had vitamin A deficiency (serum retinol < 0.70 µmol/L) indicating a mild public health problem. 10 Some of the regional prevalence estimates were >20%, but the sample sizes were too small to provide precise and representative prevalence estimates. A 1987 study among children aged <6 years in a region of southern Rwanda reported that 21% of children had low serum retinol and 1.3% had Bitot spots. 17 Among women, vitamin A deficiency is typically manifested by night blindness during pregnancy. According to the 2005 Rwanda Demographic and Health Survey (RDHS), 8% of women who had given birth in the previous 5 years reported having vision difficulties at dawn or dusk while pregnant, but 3% had vision problems at night only. 13 Based on these available data, vitamin A deficiency did not appear to be a significant problem nationally 2 decades ago, but some regional problems were evident. The current situation with regard to vitamin A status of the population is uncertain, as no national surveys have assessed vitamin A status.
Folate Deficiency
Only 1 study was found that presented estimates of folate deficiency in a Rwandan population. A convenience sample of 191 healthy adult men and women who were visiting relatives in a hospital from each of the 4 provinces and Kigali found that none had folate deficiency based on serum folate <4 ng/mL. 18 Seventy-two percent of the sample were women, and 57% of the entire sample were 18 to 35 years of age, 42% were 35 to 65 years, and 1% were >65 years. The results of this 1 study are insufficient to speculate as to the extent of folate deficiency in Rwanda.
Vitamin B12 Deficiency
The prevalence of vitamin B12 deficiency was also reported in the study mentioned in the previous section on folate deficiency. 18 Among the 191 adults, 10% were vitamin B12 deficient based on low plasma vitamin B12 (<203 pg/mL) and 20% had low-normal concentrations (203-300 pg/mL). This indicates that there could be a problem with vitamin B12 deficiency in Rwanda that should be investigated further, preferably with representative samples across the life cycle. Only 1% of the sample was >65 years old, which is the population most likely to suffer from vitamin B12 deficiency due a high prevalence of atrophic gastritis in this age-group causing malabsorption. 20
Iodine Deficiency
Evidence of the prevalence of iodine deficiency in Rwanda is limited to school-age children from a national survey conducted in 1996. 19 The median urinary iodine concentration of children was 298 µg/L, which indicates that iodine intake is more than adequate in this population. 11 According to the 2014 to 2015 RDHS, 99.7% of households had iodized salt in their homes, indicating nearly universal coverage. Based on these data, iodine deficiency is not likely a problem in Rwanda.
Prevalence of Anemia in Rwanda
The prevalence of anemia among children aged 6 to 59 months was 37% in 2014 to 2015. 12 Anemia was highest among children aged <2 years (53%). According to WHO criteria, anemia is a moderate public health problem in Rwanda, 21 although the prevalence of anemia had declined among children aged <5 years by 15% points from 2005 to 2015. 12 Anemia prevalence was 19% among both adolescent girls (15-19 years) and adult (20-49 years) women in 2014 to 2015, 12 which is considered a mild problem. Among women aged 15 to 49 years, anemia decreased 7% points from 2005 to 2015. 12 Two other regional studies in Rwanda have reported similar rates of anemia in children aged <5 years (31%-34%) and adult women (12%). 14,15 No recent data for males were found, although the RDHS 2005 reported that 30% of adolescent boys and 20% of adult men were anemic. 13
Dietary Micronutrient Intake as a Potential Cause of Micronutrient Deficiencies in Rwanda
Insufficient dietary intake is one of the main causes of micronutrient deficiency, besides impaired absorption due to disease. 22 Publications on micronutrient deficiencies discussed in the previous sections did not include analyses of causal factors. This section includes information on dietary micronutrient intakes, which provides information on potential risk of inadequacy. Rwanda does not have a national dietary intake survey that would provide quantitative information on food intake for estimating the prevalence of inadequacy in the population. Some information exists on estimated prevalence of low micronutrient intake based on national food supply data. 23,24 However, this type of information does not represent actual intake or allow for disaggregation at the individual level, but in the absence of dietary intake data, it can serve as a proxy to identify potential dietary risk. An analysis of the national food supply using data from the Food and Agriculture Organization ranked Rwanda 11th highest of 188 countries at risk of zinc deficiency, with an estimated 35% of the population likely to have inadequate zinc intakes based on the available zinc in the food supply. 23 Another analysis of global food supplies estimated that for Rwanda, there was a high likelihood of inadequacy for calcium (75%), vitamin A (60%), vitamin B12 (55%), and riboflavin (33%). 24
The most recent Comprehensive Food Security Vulnerability Analysis (CFSVA) conducted in 2018 collected information on types of foods and frequency of consumption at the household level during a 7-day period. 25 The Food Consumption Score (FCS) is a weighted average frequency of the foods consumed in the past 7 days with a maximum score of 112. Households are categorized into one of 3 groups to indicate food security: poor (FCS ≤ 21, extremely food insecure.), borderline (FCS 21.5-35, moderately food insecure), and acceptable (FCS >35, food secure). In this survey, 24% of households had inadequate food consumption, with 4% consuming a poor diet and 20% consuming a borderline diet. The Western province had the highest inadequacy, with 7% and 32% of households having poor and borderline consumption, respectively. Households with poor or borderline consumption tended to not consume any animal products. The FCS-Nutrition provides further information on 3 nutrients based on specific foods reported—plant-based vitamin A-rich foods, protein-rich foods, and heme-iron rich foods. Most households (95%) consumed a vitamin A rich plant food at least once during the previous week and 56% consumed these types of foods daily. Protein-rich foods were consumed daily by 69% of households. Heme-iron rich foods were consumed at least once per week by 20% of households and daily by only 1% of households. While household-level data provide some valuable information on food and nutrition security, it does not provide any information on how resources are allocated within the household, particularly to vulnerable groups such as women and children.
Some of the dietary information available suggests that intakes of some micronutrients may be inadequate, but the accuracy and extent of the inadequacies for specific subgroups of the populations are not available from household or national food supply estimates. Only a quantitative survey that collects detailed information on foods and amounts consumed by individuals in a 24-hour period and includes repeat assessments for at least some individuals can provide estimation of usual food and nutrient intakes and prevalence of risk of inadequacy in specific subgroups of the population that align with the subgroups (by age, sex, or physiological status) for which different nutrient requirements are set. Individual-level dietary surveys can also be paired with biomarker studies to assess the prevalence of micronutrient deficiencies by subgroups of the population and allow for investigation of risk factors for deficiency.
Factors Associated With Anemia in Rwanda
Anemia has most often been attributed to iron deficiency, but that idea has been challenged 26 and other micronutrient deficiencies may be associated with anemia including folate, vitamins A, B6, B12, and E. 27 In addition, anemia may also result from non-nutritional factors such as malaria, helminth infections, and genetic blood disorders. 28
When both iron deficiency and anemia are present, it may be assumed that the anemia is due to iron deficiency but that may not be true. In a survey in 408 households in the Northern and Southern Provinces, 4% of children and 2% of women had both iron deficiency and anemia, but the prevalence of anemia was much higher (31% of children and 12% of women), suggesting that iron deficiency is not an important contributor to anemia in this setting. 15 Another study conducted with children aged <5 years in the Southern Province found that 25% of anemic children had iron deficiency. 14 However, after accounting for multiple factors, the authors found that iron deficiency was only marginally associated with anemia (odds ratio: 1.67, CI 1.00-2.79), while age and malaria infection were the strongest predictors of anemia in this population. Testing positive for malaria (specifically Plasmodium falciparum) and being younger increased the odds of being anemic. Preliminary results from a longitudinal study of 192 children in rural Rwanda did not find an association between dietary iron intake and anemia at 12 months of age. 16 However, 44% of children had iron deficiency anemia (IDA) at 4 months of age, accounting for 60% of anemia cases, and 45% of children had IDA at 12 months accounting for 94% of anemia cases, suggesting potential causal factors other than diet. These results indicate that infants are more likely to be anemic and possibly iron deficient than older children, but the causes of anemia could vary by population.
One small clinical study suggested a possible link between anemia and vitamin B12 deficiency. 29 In a study of 87 patients who were undergoing follow-up in an outpatient clinic in Kigali for chronic anemia, 34% had low serum vitamin B12. The patients had macrocytosis and reticulocytopenia and after supplementation with vitamin B12, there were improvements in reticulocytes and hemoglobin.
Only one of the aforementioned studies included factors other than micronutrients that may explain anemia. 14 Seven cross-sectional studies have examined the association between anemia and various factors, 30 -34 and a list of factors that were found to be positively associated with anemia are presented in Table 2. While this type of analysis is limited in its interpretation because it is observational, does not follow children over time, and is often missing potentially important variables, these studies can provide some insight into potential contributing factors in the context of Rwanda.
Results of Cross-Sectional Studies Examining Factors Associated With Anemia in Rwandan Populations.
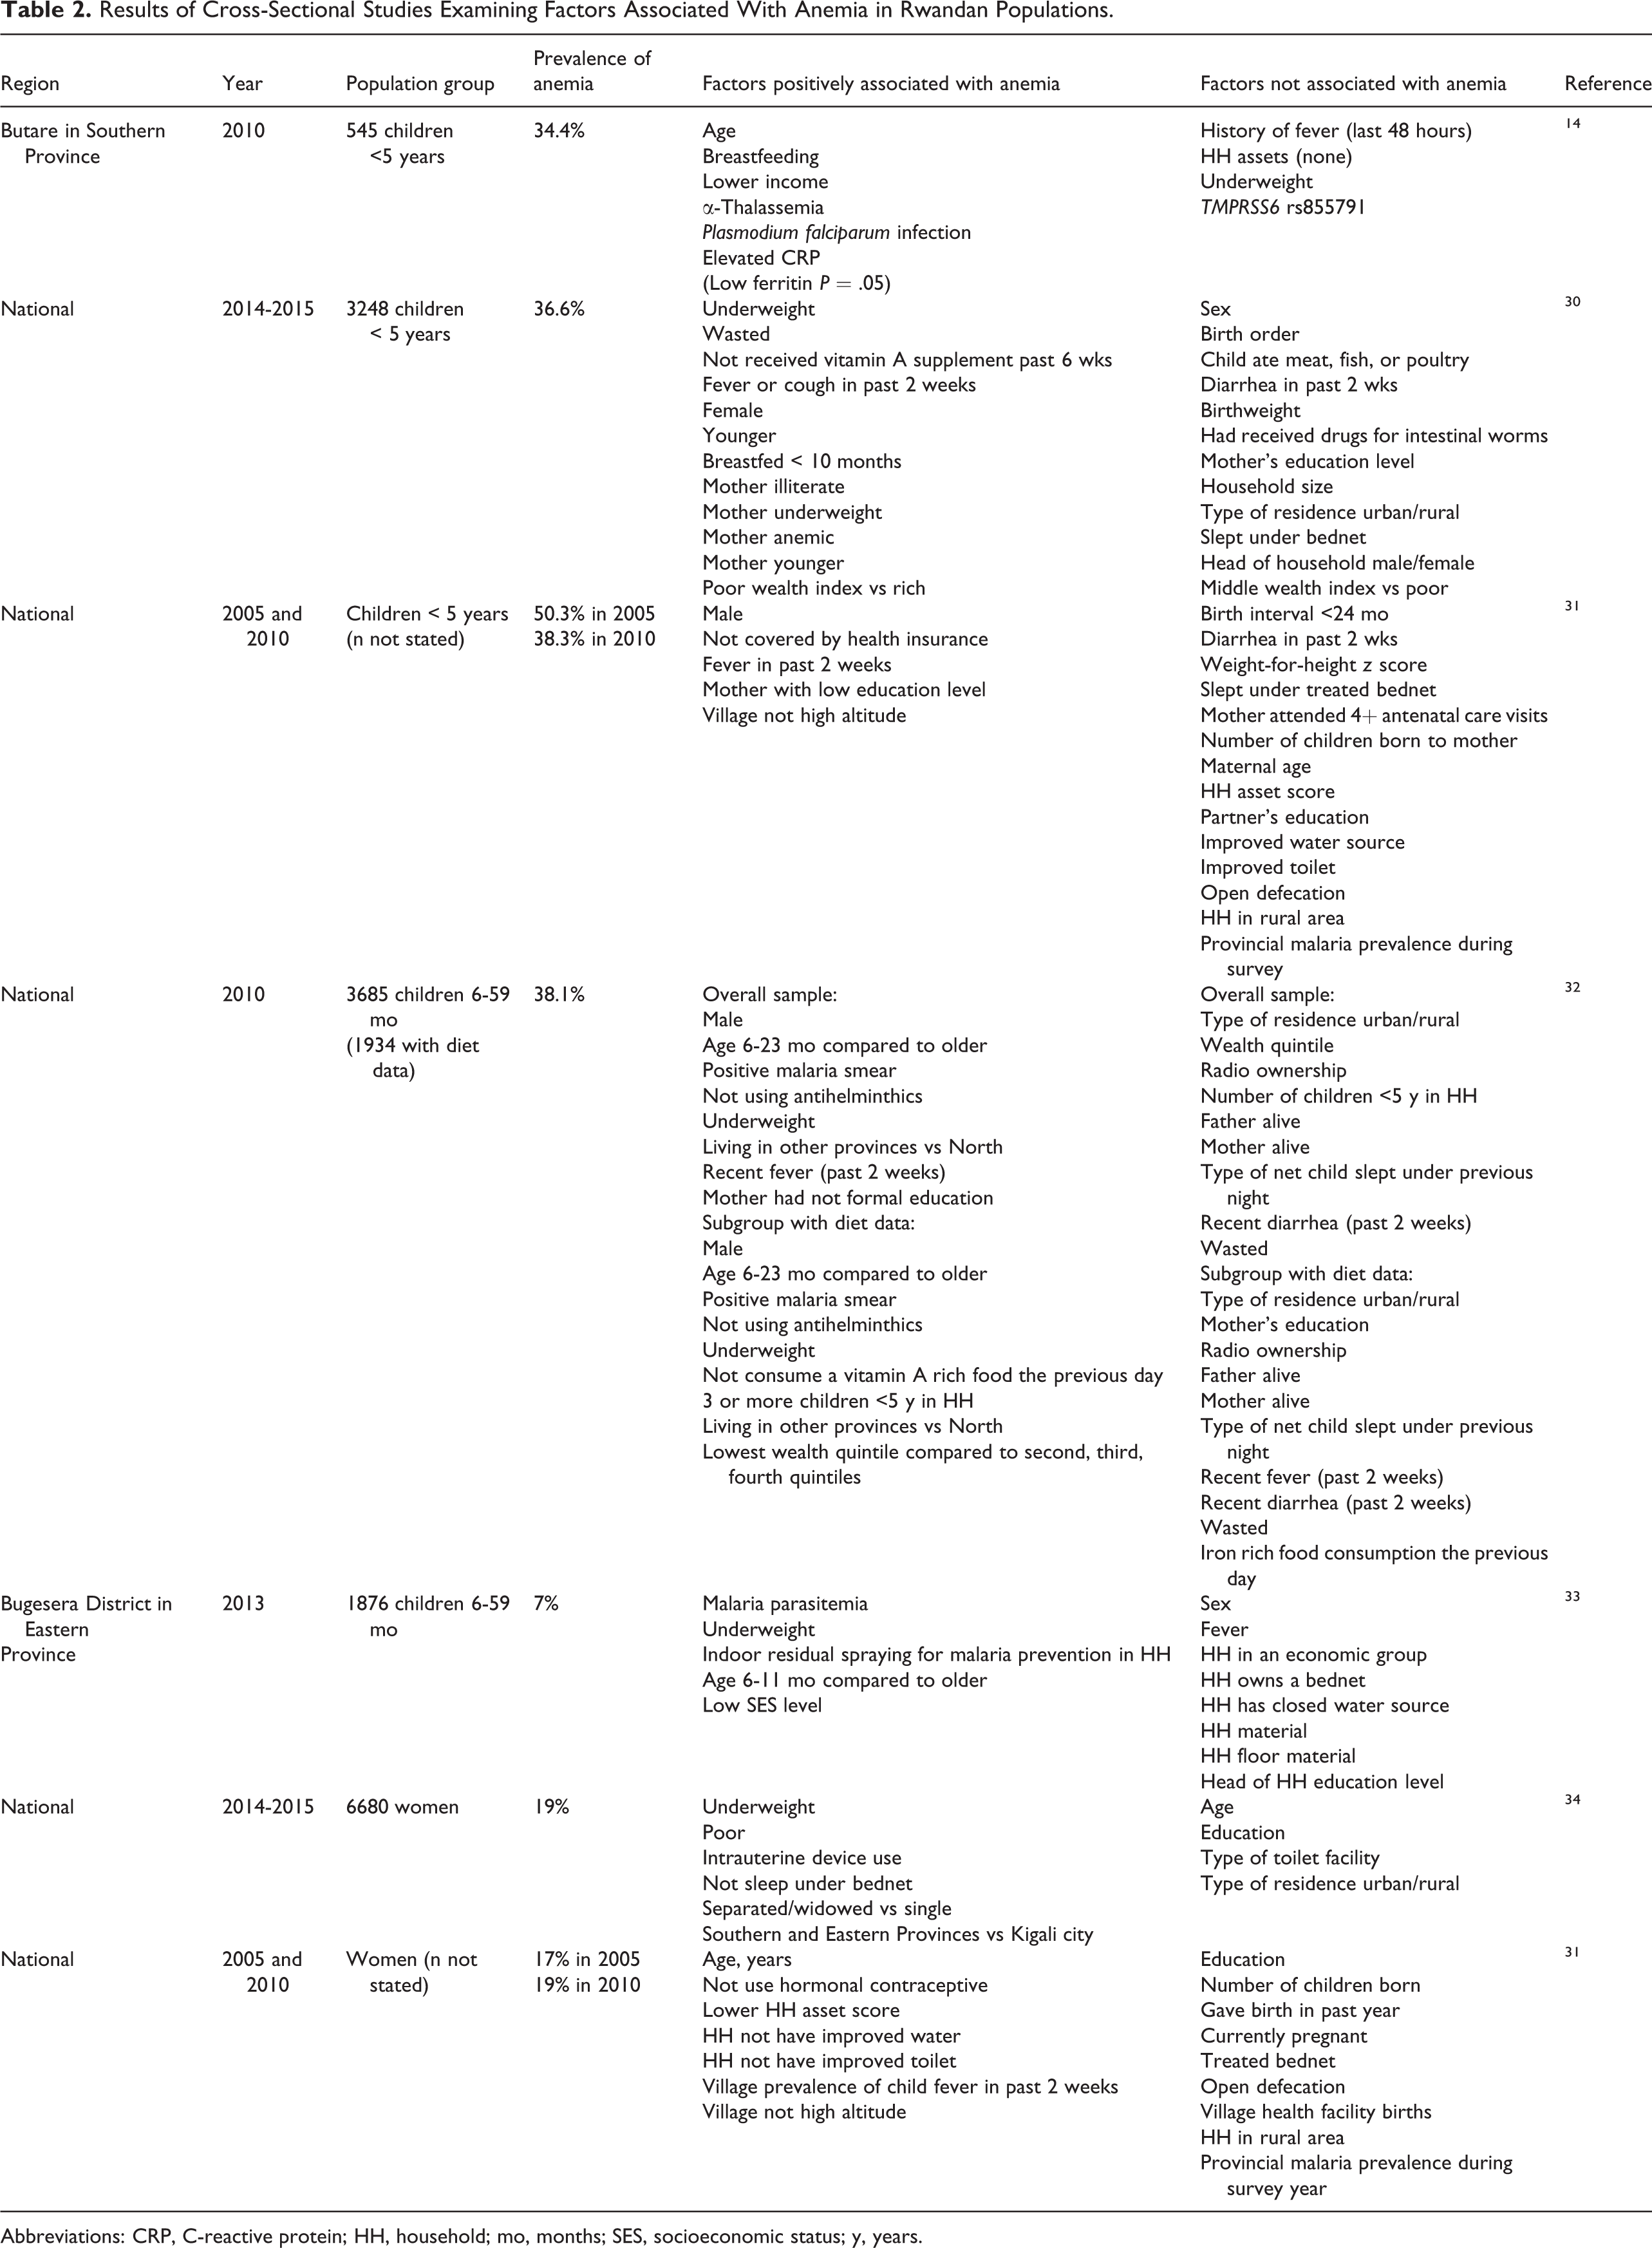
Abbreviations: CRP, C-reactive protein; HH, household; mo, months; SES, socioeconomic status; y, years.
Five of the studies included young children, 3 of which used RDHS data 30- 32 and 2 were regional studies. 14,33 Some studies found positive associations with malaria-related or potentially related variables. Two studies found positive associations between presence of malaria parasites and anemia. 14,32 Fever in the past 2 weeks was positively associated with anemia in all RDHS. 30 -32
The RDHS include a vast number of variables, including child-level health and nutrition, maternal characteristics, and household factors. Other factors positively associated with anemia included child wasting and underweight, 32 younger age, 30,32 maternal anemia, 30 maternal illiterate 30 or low education, 31,32 and low wealth index. 30 However, the multivariable regression model using data 30 from the most recent RDHS (2014-2015) had a low R-square (0.10), suggesting other factors contributed to anemia. The 2014-2015 RDHS did not include malaria diagnostic tests. The analysis using the 2014-2015 RDHS did not consider dietary information, although the RDHS only contains information on whether or not a child consumed a food in specified food groups on the previous day, which limits its usefulness for examining associations between diet and anemia.
The 2 cross-sectional multivariable analyses with women used data from the 2014-2015 RHDS 34 and the 2005 and 2010 RDHS. 31 Malaria diagnostic tests were not available, but not sleeping under a mosquito net and village-level child fever prevalence were associated with anemia in 2005 and 2010 RHDS.
Malaria causes anemia by the rupture of red blood cells by the malarial parasite and by hemolysis of nonparasitized red cells. 35 Malaria exists throughout Rwanda. The national Malaria Indicator Survey 2017 tested malaria by microscopy and rapid diagnostic test (RDT) during the peak malaria season in October to December. 36 Prevalence was reported using microscopy, but RDT was used to facilitate treatment of infected individuals during the survey fieldwork. The prevalence of malaria for all individuals aged 6 months or older was 7%. The prevalence for population groups was 7% for children aged 6 to 59 months, 11% for children aged 5 to 14 years, 5% for women aged 15 to 49 years, and 6% for individuals aged 15 years or older. In the 2014-2015 RDHS, 2% of children aged 6 to 59 months and 0.6% of women aged 15 to 49 years tested positive for malaria by microsopy. 12 The RDHS was conducted between November 2014 and April 2015. As noted, some of the cross-sectional surveys did find associations with malaria-related variables 14,32- 34 or child recent fever 31 and anemia. Malaria may be responsible for some of the anemia in Rwanda, but the higher national prevalence of anemia with some overlap of peak malaria season 12 than malaria during peak season 36 suggests other factors.
These studies do not clearly implicate the micronutrient causes of anemia in Rwanda. Studies are needed that adequately assess the effects of micronutrient interventions, including iron and iron–folic acid (IFA) supplementation and MNPs, on anemia. To better understand how to further decrease anemia in Rwanda, it is essential that the prevalence of other potential causes of anemia is understood for the different regions and population groups affected by anemia, such as deficiencies of other micronutrients known to be associated with anemia, helminth infections and genetic disorders, and whether the factors that are modifiable respond to treatment.
Strategies to Address Micronutrient Deficiencies in Rwanda
Rwanda has had national nutrition policies since 2007, most recently the NFNP 2013 to 2018, 5 and the current 5-year policy is being finalized. The National Food and Nutrition Strategic Plan 2013 to 2018 6 described strategies to address nutrition policies of the NFNP, including specific strategies to impact micronutrient malnutrition. The government recently positioned nutrition in the NECDP. Stunting reduction remains a priority for the government. 37 However, many environmental and societal factors contribute to stunting, and some argue that nutrition programs should have more nutrition-specific goals such as dietary adequacy and nutritional status. 38 This section reviews current strategies in Rwanda that address micronutrient deficiencies. Tables 3 and 4 describe the strategies, target population, and problems they are intended to address.
Nutrition Policies and Programs in Rwanda.
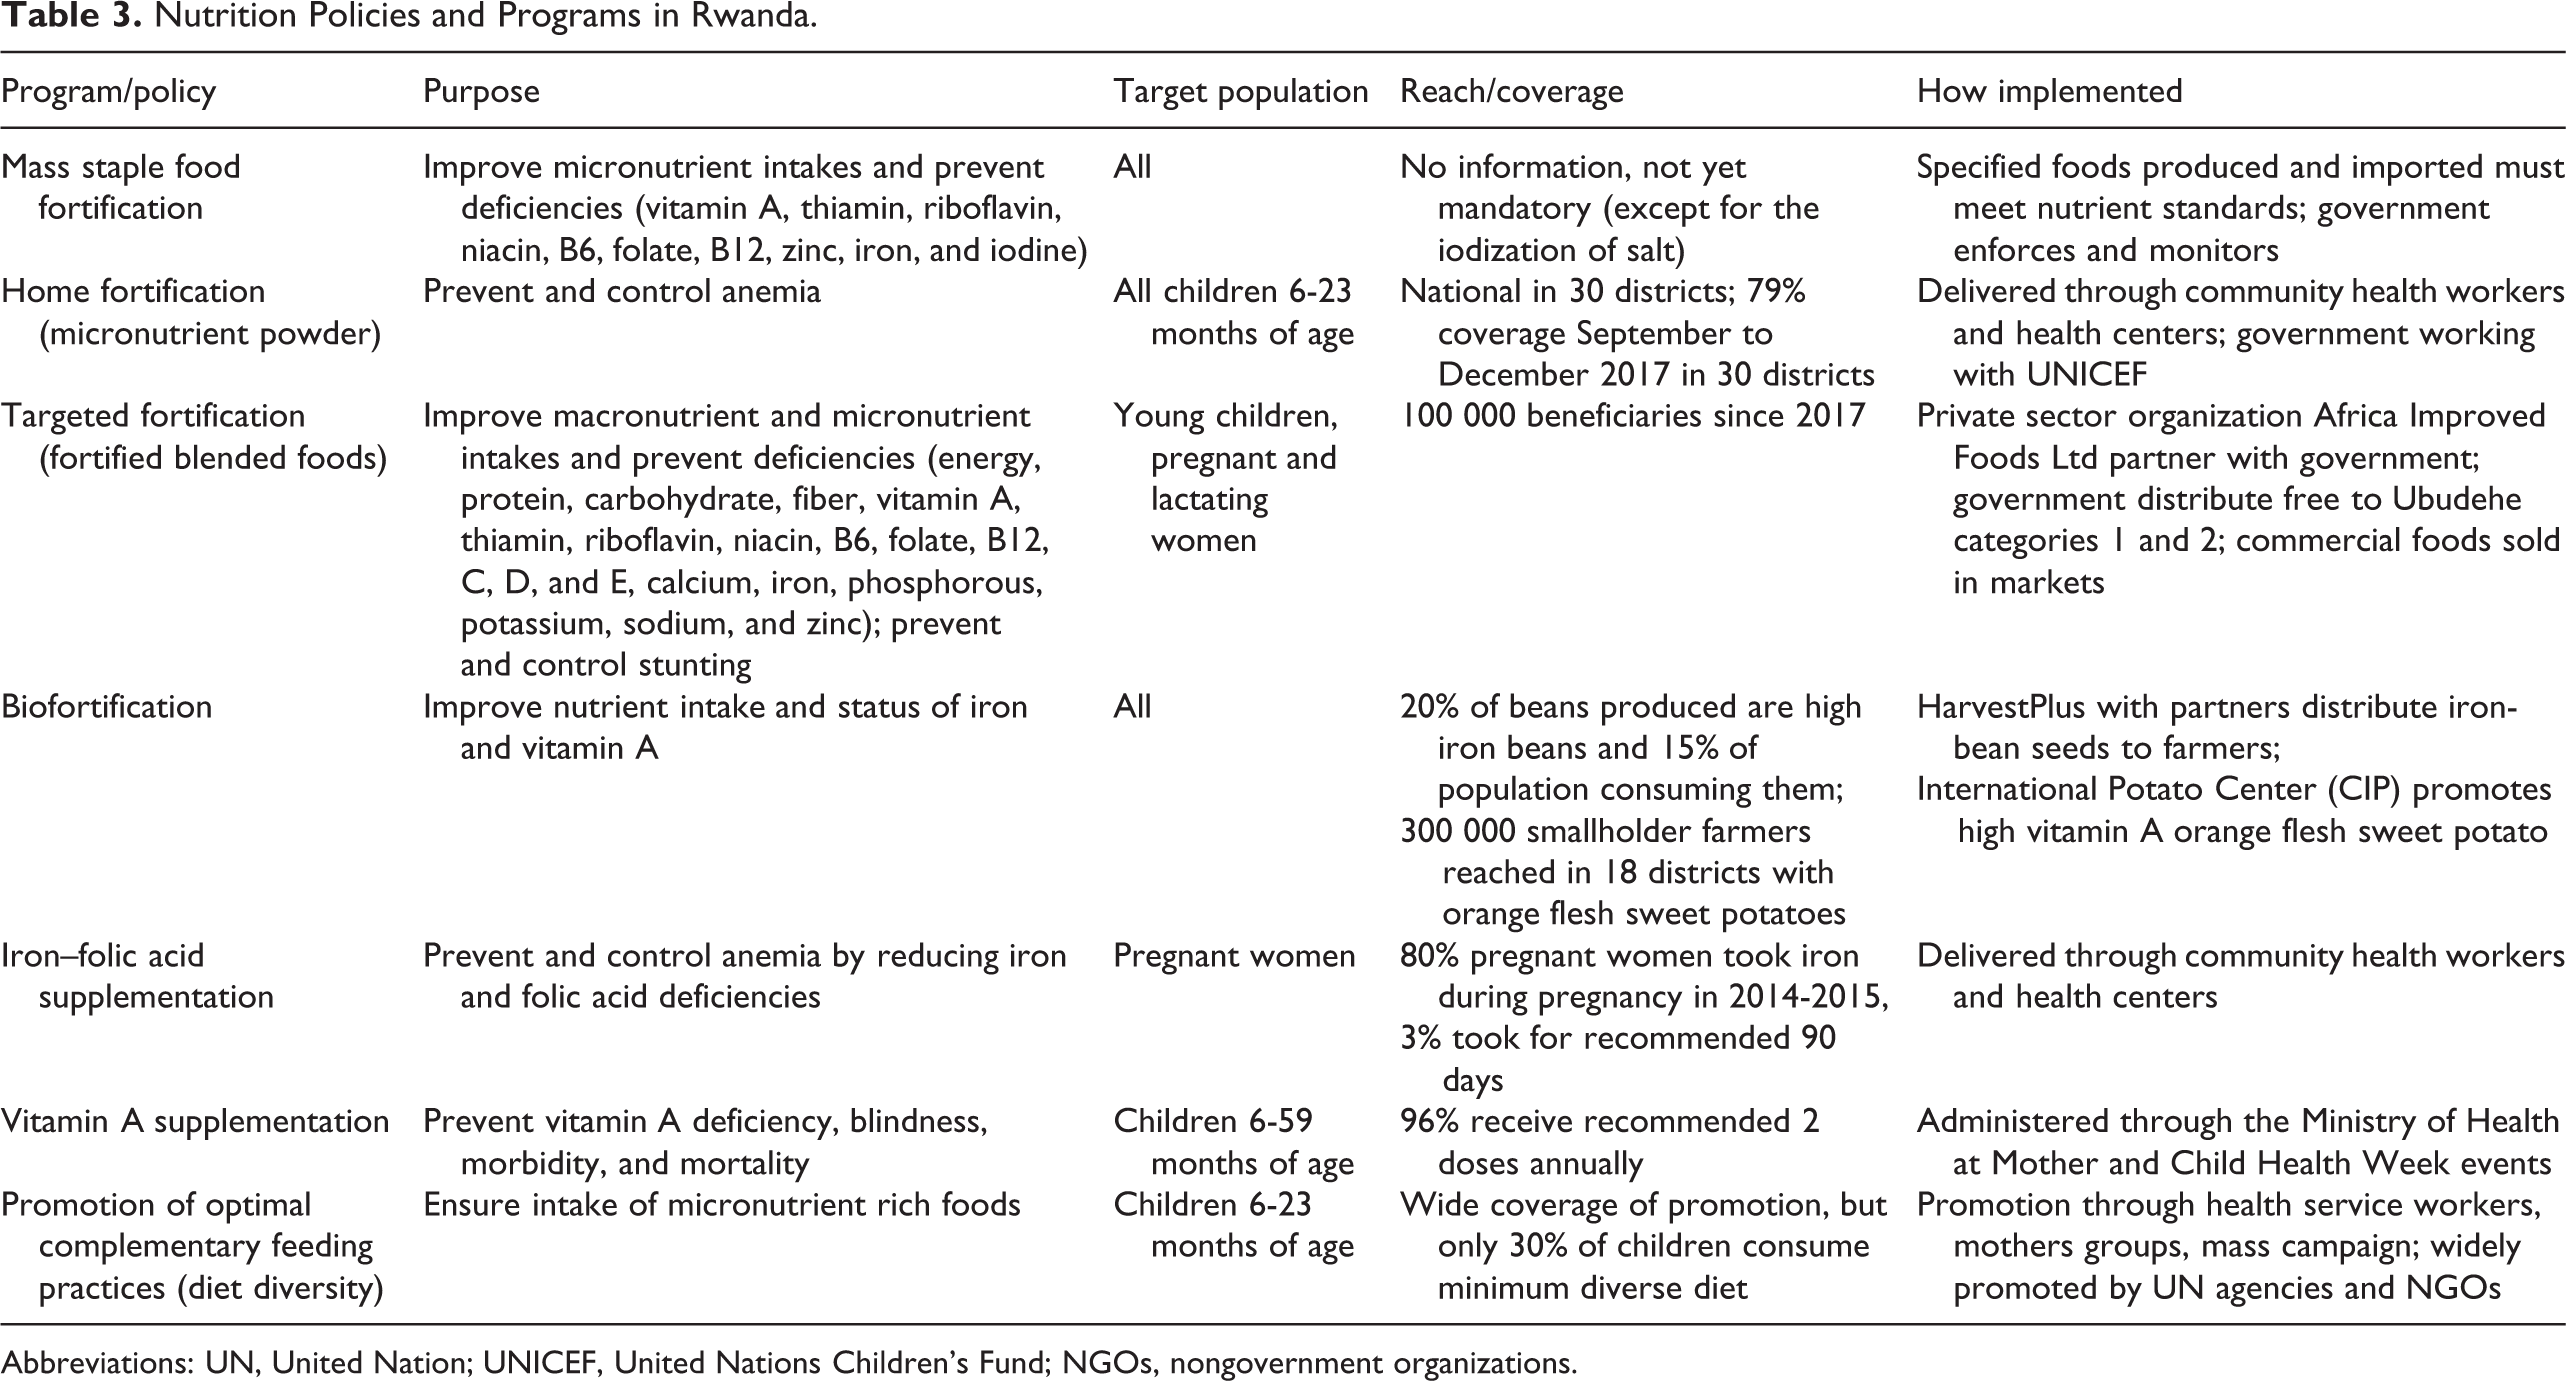
Abbreviations: UN, United Nation; UNICEF, United Nations Children’s Fund; NGOs, nongovernment organizations.
Gaps and Overlaps of Nutritional Strategies that are Currently Implemented in Rwanda for Target Groups, Nutritional Problems, and Micronutrient Delivery.a
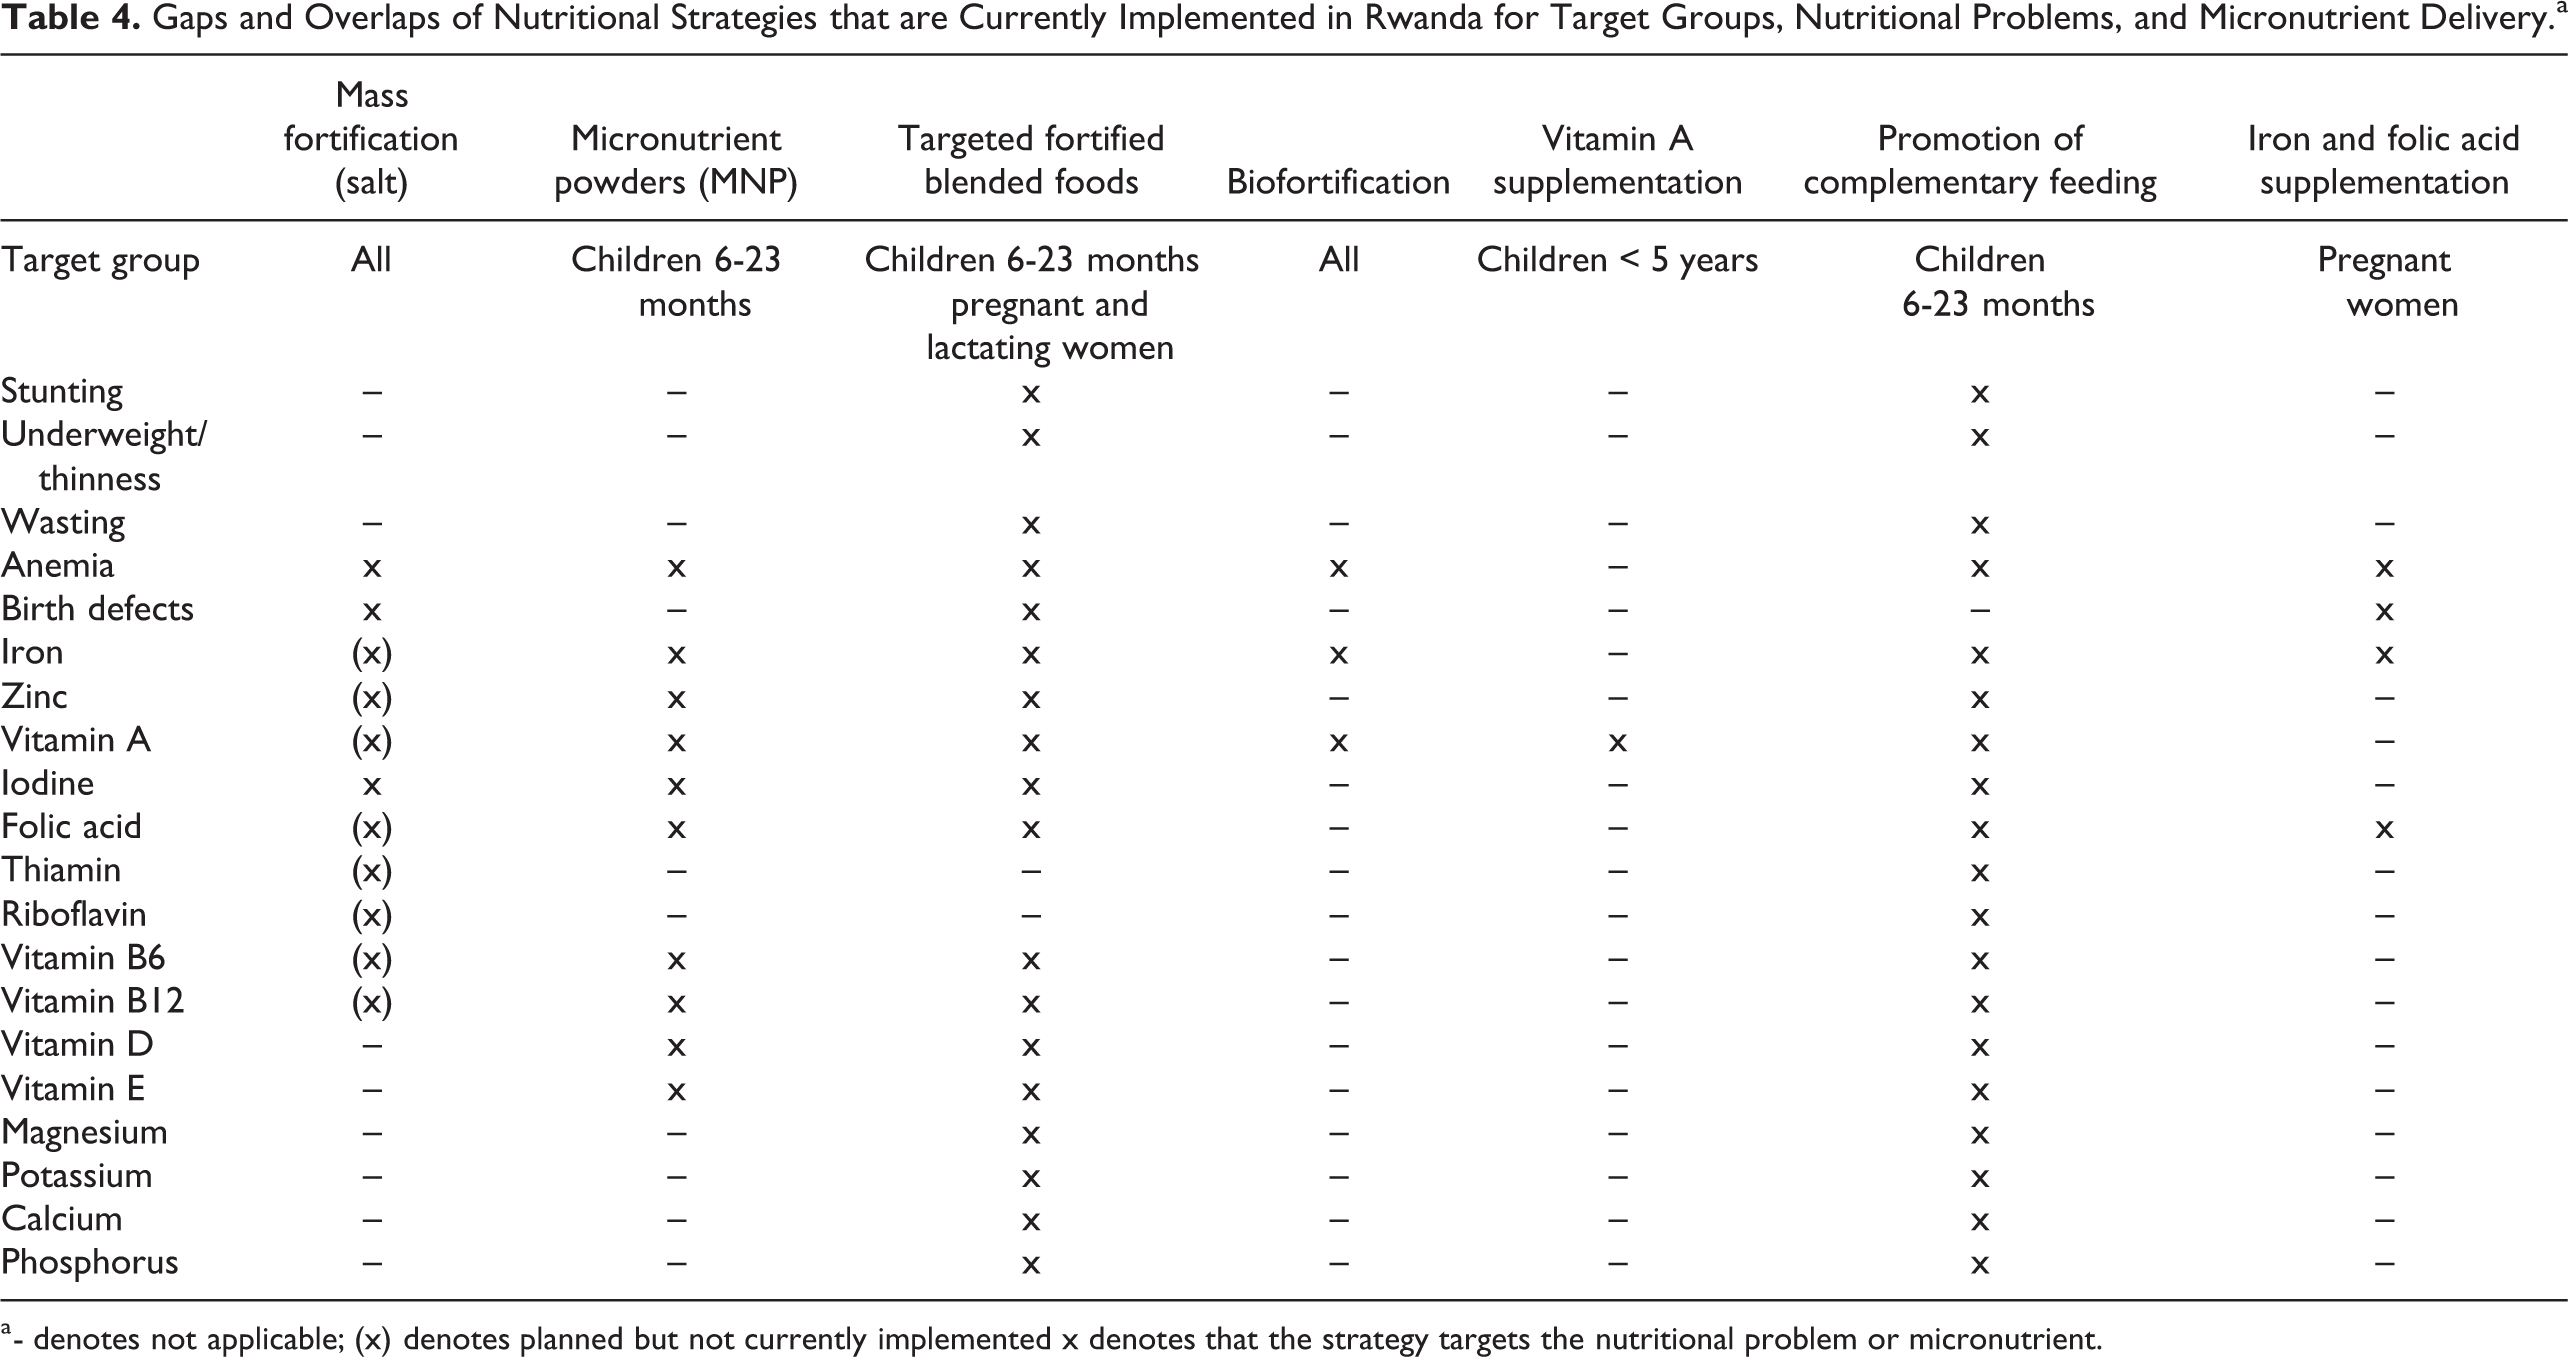
a - denotes not applicable; (x) denotes planned but not currently implemented x denotes that the strategy targets the nutritional problem or micronutrient.
Mass Food Fortification
Mass food fortification refers to the addition of micronutrients to staple foods or other foods commonly consumed by the entire population. Food fortification is one of the most cost-effective strategies to address micronutrient deficiencies. 39 An advantage of fortification is that it can reach the entire population without requiring consumers to change dietary behaviors.
Currently only salt fortification with iodine is mandatory, but voluntary fortification of maize flour, wheat flour, oil, and sugar is in place and legislation is currently in the approval process for mandatory fortification. Additional nutrients included are iron, zinc, thiamin, riboflavin, folic acid, vitamins A, B6, and B12 (Table 4). The nutrient standards align with the Eastern African Standards. 40 -44
Home Fortification
Home fortification, also known as “point-of-use” fortification, refers to fortification of a food by the consumer at home, such as MNPs that can be added to a home-prepared porridge. The MNP in Rwanda includes the addition of 9 nutrients (Table 4). The MNP has been shown to reduce anemia and iron deficiency 45 and is recommended by WHO for children 6 to 23 months where the prevalence of anemia in young children is 20% or higher. 46 The MNP in Rwanda, known as Ongera, is distributed to all children aged 6 to 23 months through health centers and community health workers. Initial work to introduce MNP in Rwanda began in 2011 in partnership with the government and UNICEF, and the program was scaled up to all 30 districts in 2017. 47 The government is set to take full ownership of the program in 2021 (personal communication, NECDP). The University of British Columbia designed and conducted field research, including feasibility and pilot studies. 48 The pilot study demonstrated significant improvement in hemoglobin concentrations among children who were anemic at baseline and received MNP for 6 or 12 months compared to those who were anemic but did not receive MNP. Coverage after scale up in 2017 was about 80%, but some issues with stock-outs have occurred. 47 The CFSVA conducted during March to April 2018 reported that only 6% of children had consumed MNP on the day before the interview, although the proportion of children who had received MNP during that time is unknown. 25 Indicators on use of MNP are integrated in the national information system with data being collected at the community and health facility level on numbers of children provided MNP, 47 which should facilitate monitoring and evaluation.
Targeted Fortification
Targeted fortification typically refers to commercially prepared fortified foods available for purchase in markets that are marked for specific population groups, such as milk for young children. In Rwanda, commercial fortified blended foods (FBFs) are available that are targeted to young children and pregnant and lactating women. Africa Improved Foods Ltd manufactures FBFs that are sold commercially and are distributed free by the government and the World Food Program. The local products are corn-soy blend dry cereals known as Shiska Kibonndo (government product) and Nootri (commercial product). The government distributed the products to children aged 6 to 24 months and women who are “Ubudehe” category 1, which is the poorest of 4 socioeconomic categories and for which social programs are targeted, and has expanded to some households in “Ubudehe” category 2. The government has distributed the foods to 100 000 beneficiaries per year through health centers since 2017 (personal communication, AIF). The government program foods account for more than half of all of the foods AIF produces in Rwanda. A limitation of the commercial products is the cost of about US$2.2 for a 1 kg package.
The impact of these products on nutritional status outcomes has not been evaluated. The 2018 CFSVA reported that children who consumed FBF were more likely to achieve a minimum acceptable diet, and women consuming FBF were more likely to achieve minimum diet diversity than those who did not consume FBF (statistics were not provided). 25 The survey also reported that 40% of 18 to 23-month-old children not consuming FBF were stunted compared to 20% for children who were consuming FBF, but this analysis was limited as it did not control for any other factors. This finding should be further explored with a controlled evaluation of the program. An economic assessment conducted by the University of Chicago estimated that AIF is expected to add nearly 758 million USD in net incremental benefits to the Rwandan economy over the period 2016 to 2031. 49 Of this, 532 million USD will be from cost-savings and productivity increases attributed to benefits of increased labor productivity due to reduced stunting rate from 38% in 2016 to 20% in 2031 partly as a result of children’s consumption of the FBF.
Other fortified food products are sold commercially in the marketplace in Rwanda, including some imported vegetable oils (with vitamin A), milks (eg, Nido brand with multiple micronutrients), and bouillon cube (eg, Maggi brand with iron and iodine). The Maggi brand bouillon cubes with additional iron (66 mg/100 g according to label), which were already fortified with iodine, were introduced in 2015. 50
Biofortification
Biofortification is a type of fortification that entails conventional breeding crops for higher nutrient content. Once biofortified crops are integrated into farming communities and accepted by consumers, this strategy provides additional nutrients in a staple food that is already consumed by the population. The target level of a nutrient in the biofortified crop is based on the usual intake amount in the population. However, this strategy has a long development process and the target nutrient level of the crop may not be achieved in the estimated time frame for release. Current biofortified foods available in Rwanda include high-iron beans (HIB) and high-β-carotene (provitamin A) orange-flesh sweet potatoes (OFSP). Some work has also been done on high-vitamin A maize but it is not yet available in Rwanda. Biofortified crops are included in the government’s NFNP.
Four HIB varieties were officially released in Rwanda in 2010 and 6 more varieties were released in 2012 following several years of collaboration between HarvestPlus, the Rwanda Agriculture Board (RAB), and the International Center for Tropical Agriculture. 51 By the end of 2018, 20% of the beans produced in Rwanda were HIB and 15% of the population (1.8 million of 12.4 million) were consuming them. 52
Rwanda has the highest per capita bean consumption in world. 53 A HarvestPlus survey found that 94% of households consumed beans and on average consumed beans 5 days per week. 54 Given the consumption levels of beans, it was estimated that HIB at the highest target level of iron (94 mg/kg) could provide 80% and 127% of estimated average requirements for women and children, respectively. 53 The benefits of consuming HIB were demonstrated in efficacy trials that found consuming HIB increased hemoglobin 55 and improved cognitive performance 56 in Rwandan, women who had low iron status and consumed beans (86 mg iron per kg beans) twice daily for 18 weeks. The cumulative added value of HIB during 2010 to 2018 was estimated to be just under US$25 million due to higher bean productivity and the approximately 5000 disability-adjusted life years (DALY) saved from reduced risk of iron deficiency as a result of their iron bean consumption. 52 The estimated cost per DALY (a measure of health benefit) saved is $239, which is on the high end of cost effectiveness. 53
The OFSP varieties were introduced as trials in Rwanda in 2006 by the RAB and were introduced to farmers in 2010. 57 The International Potato Center works with RAB and several other international and local nongovernment organization (NGO) partners to promote OFSP. Currently over 300 000 smallholder farmers have been reached in 18 districts with 6 varieties of OFSP.
Information on consumption of OFSP is limited. The 2018 CFSVA reported that previously yellow sweet potatoes were consumed in the North but that consumption of OFSP improved in the Northern Province with the highest consumption in Rulindo and Gicumbia districts (26%-39% of households). 25 Orange-flesh sweet potatoes are bred to contain enough β-carotene so that 100 to 150 g of OFSP provides 100% of the recommended intake of vitamin A. Consumption of OFSP was efficacious in increasing vitamin A intakes 58,59 and vitamin A status of women and children 59 in other Eastern African countries. No research on efficacy of OFSP consumption in Rwanda was found.
Iron and Folic Acid Supplementation
Daily IFA supplementation with 30 to 60 mg of iron and 400 µg folic acid is recommended for pregnant women to reduce anemia and prevent neural tube defects by WHO. 60 In Rwanda, IFA is administered through the health system to pregnant women at antenatal visits.
The most recent data from the health system in 2019 indicated that IFA was distributed to 55% of pregnant women (personal communication, NECDP). In 2014 to 2015 Demographic and Health Survey (DHS), 80% of women reported receiving an iron supplement during pregnancy. 12 However, only 3% took iron for 90 or more days, and 68% took iron for less than 60 days. Although 99% of women in Rwanda have at least one antenatal care visit from a skilled health provider, less than half of pregnant women attend the recommended minimum of 4 antenatal visits during pregnancy. 12 This is likely contributing to the low effective coverage detailed in the RDHS 2014 to 2015.
Vitamin A Supplementation
High-dose vitamin A supplementation is recommended for children aged 6 to 59 months by WHO in countries where vitamin A deficiency is a public health problem, defined as prevalence of night blindness of 1% or higher in children aged 24 to 59 months or prevalence of vitamin A deficiency by serum retinol is 20% or higher in children aged 6 to 59 months. 61 In Rwanda, vitamin A supplementation is administered to children twice yearly at Mother and Child Health Week events.
At the latest distribution event in 2019, 92% of children aged 6to 12 months and 94% of children aged 12 to 59months received vitamin A (personal communication, NECDP). In 2015, 96% of children received 2 doses of vitamin A supplements. 62 The DHS 2014 to 2015 reported that 86% of children received vitamin A in the past 6 months, with the lowest proportion in the East (83%) and highest in the North (90%). 12 The coverage rate is among the highest globally. 63 With such high coverage, it is reasonable to assume that vitamin A deficiency may not be a problem in young children.
Promotion of Diet Diversity as an Optimal Complementary Feeding Practice
Diet diversity is one of a suite of Infant and Young Child Feeding (IYCF) practices recommended for promotion and monitoring by WHO. 64 The NFNP specifically mentions dietary diversity as a strategy to ensure inclusion of micronutrient-rich foods in the diet. The IYCF indicator for minimum diet diversity is the proportion of children aged 6 to 23 months consuming 4 of 7 defined food groups (grains, legumes, dairy, flesh foods, eggs, vitamin A-rich fruits and vegetables, and other fruits and vegetables) the previous day. 64 In Rwanda, promotion of IYCF practices occurs through health centers and community health workers, mothers’ groups, and mass campaigns. Infant and Young Child Feeding is also widely promoted among United Nation agencies and NGOs. Counseling cards are used by health workers as part of The National Community Maternal, Infant and Young Child Nutrition Counseling Package developed by the Ministry of Health Rwanda and several key partners based on the UNICEF Community IYCF Counselling Package. 65
In the 2015 United Nations–Renewed Efforts Against Child Hunger and undernutrition (UN-REACH) Stakeholder Mapping study, promotion of IYCF practices occurred in all districts and covered 51% to 75% of the target group. 66 Despite wide coverage of promotion of IYCF practices, only 30% of young children in Rwanda consume a minimally diverse diet. 12 This strategy has limitations, namely it requires knowledge or optimal practices and associated behavior change by the target group and sufficient resources to provide a diverse diet. In addition, the food system needs to provide nutrient-rich foods at an affordable cost.
Gaps and Overlaps in Knowledge and Coverage of Policies and Programs
The evidence on micronutrient status of the Rwandan population is mostly limited to regional or outdated surveys. The only national-level data currently available are for vitamin A status of young children and women and iodine status of school-age children, but these data are from 1996. Based on these data, vitamin A and iodine were not a problem in Rwanda. Information on iron status is limited to small, regional studies that reported iron deficiency prevalences of 6% to 88%. 14- 16 A small study indicated that vitamin B12 deficiency may be present, but folate deficiency was absent. 18 This information should be confirmed in a national micronutrient survey. Plans are currently in place to collect blood and urine samples in the 2020 RDHS to assess micronutrient status, including vitamin A, folate, vitamin B12, iron, zinc, and iodine (personal communication, NECDP).
There are currently several strategies in place to address nutritional problems, particularly those of young children and women. Programs targeted specifically for young children include promotion of optimal complementary feeding through various channels, provision of MNP and vitamin A supplements to all children (6-23 months and 6-59 months, respectively), and provision of FBF to children in Ubudehe 1 and some in Ubudehe 2. Programs targeted to women are specifically for pregnant women. All pregnant women should receive iron and folic acid supplements. In addition, pregnant and lactating women in Ubudehe 1 and some in Ubudehe 2 should receive FBF. Other programs that target the general population include mass fortification and biofortification. Mandatory mass fortification currently only includes iodized salt, but plans are underway to include mandatory fortification of maize, wheat, oil, and sugar. However, despite the range of programs that could impact micronutrient status, thus far, is very little evidence of the effectiveness of these programs.
The existence of multiple strategies for young children and women of reproductive age is common given that these population groups are particularly vulnerable to nutrition problems and a single strategy may be insufficient to address a nutrition problem. However, the provision of specific nutrients across multiple programs (Table 4) should be carefully evaluated, particularly in the absence of evidence of a nutrition problem. Some nutrients if consumed in excess can have negative health consequences. For example, there has been concern about providing iron to iron-replete children where malaria prevalence is high, although recent evidence suggests that iron supplementation does not adversely affect children when regular malaria surveillance and treatment services are provided. 67 The issue has been raised of multiple programs providing vitamin A putting individuals at risk of excessive intakes, which can be toxic. 68,69 Vitamin A is provided in all of the 6 interventions that are specifically targeted for or could reach young children in Rwanda (Table 4). It is plausible that young children could exceed the recommended tolerable upper limit (UL) for vitamin A, which is 600 μg from retinol per day for children aged <4 years. 70 For example, if a child consumed MNP (400 µg retinol), a FBF (800-1200 µg vitamin A per daily recommended portion), and recently received a high-dose vitamin A supplement (equivalent to estimated intake of 167 mcg/d based on kinetic modeling 71 ), their intake could be double the UL. However, the UL has a large safety factor and negative health effects of high vitamin A intakes in children are not documented. 70 There has been no national survey documenting vitamin A status after some of these programs were implemented, but this should be confirmed with the 2020 RDHS.
There appears to be a lack of targeted programming for other population groups such as adolescents and older adults, who could suffer from anemia, thinness, and micronutrient deficiencies. For example, the 30% anemia prevalence among adolescent boys is as high as or higher than other vulnerable subpopulations, 12 yet no information was found on nutrition programs for adolescent boys. No information was found about programs for older adults in Rwanda, who may be at risk for nutritional problems, particularly vitamin B12 deficiency. In addition, other nutrients of importance to women of reproductive age, such as calcium and vitamin D, are not widely distributed across the various programs available to them (Table 4).
A stakeholder activity mapping exercise conducted by the UN-REACH in 2015 collected information on the stakeholders who were working in each district and what interventions they were providing and mapped the coverage of interventions and stunting prevalence. 66 The micronutrient interventions included home fortification (MNP for young children), vitamin A supplementation for children aged <5 years and postpartum women, and IFA distributed at antenatal care visits for pregnant women. Among the least supported of 21 interventions identified in the report was elimination of micronutrient deficiencies, which was due to the status of the MNP rollout at the time of the study, not to vitamin A and IFA supplementation which had high coverage. 72 There were some districts with generally low coverage of interventions and high stunting prevalence (eg, Nyamasheke, Kirehe), indicating that more attention to delivery of appropriate interventions in those areas is needed. 72 This type of cross-mapping analysis could be extended to examine gaps and overlaps of programs with micronutrient deficiencies when national micronutrient survey data are available.
Wide coverage of IYCF promotion was reported by the UN-REACH activity, but poor dietary practices (low diet diversity) were reported in 2014 to 2015 RDHS. 12 Previous work has shown that children who consumed a minimally diverse diet (4 or more food groups on a given day) have a more micronutrient dense diet and consume more animal source foods that are micronutrient dense. 73 Dietary behaviors may be difficult to change by education alone, because cultural or economic factors may prevent changes such as purchasing or consuming animal foods or due to economic constraints. Programs such as the “One Cow per Poor Family” (Girinka program) and other livestock programs could potentially increase micronutrient intakes of young children by the direct consumption of milk or by purchases of other nutrient-rich dense food from income generated by the household. An evaluation is currently underway of the Girinka program and preliminary results at baseline show that young children from households who had benefited from Girinka and received a cow in the previous 1 to 2 years were less likely to be stunted and more likely to consume cow milk over a 7-day period than children from Girinka eligible households who had not yet received a cow. 74 An end line assessment will assess whether a third group of Girinka beneficiaries who also received behavior-change communication (BCC) had additional benefits than Girinka beneficiaries without BCC.
There is a need for additional evidence on the causal factors of stunting and anemia in Rwanda and the effectiveness of strategies in place to reduce these nutritional problems. Despite the many nutrition-related programs addressing anemia (MNP, FBF, biofortification of beans, OFSP, complementary feeding promotion, and iron-folate supplementation) as well as infection control programs (bednets to reduce malaria, deworming to reduce helminths), rates of anemia are still high. Analyses that have examined causal factors of anemia were limited by their cross-sectional design and the available factors in the existing data sets, which did not contain information on micronutrient status and dietary intakes. 30,31 Coverage and effective coverage information for anemia control programs is also needed to determine whether the programs are being received by the population groups in need and utilized adequately to affect biological change. Regarding anemia among women, only 3% of pregnant women reported taking IFA for a minimum of 90 days. Evidence is needed to determine whether increased compliance with recommended nutrition interventions such as IFA in Rwanda would decrease anemia. A comprehensive assessment of the micronutrient and anemia status of the Rwandan population would provide valuable insight into the micronutrient causes of anemia, and evaluation of programs with careful appraisal of the processes of delivery is needed to understand why programs are or are not effective.
Conclusions
The nutrition situation in Rwanda is promising as there is a great deal of interest by the government and numerous local and global partners working on nutrition problems in the country. 31 However, rates of stunting and anemia among young children are high. Micronutrient interventions alone are unlikely to impact stunting, which requires multifactorial interventions. Micronutrient interventions could potentially reduce anemia, although it is unclear which micronutrient deficiencies may be associated with anemia in Rwanda. Coverage of some interventions such as vitamin A supplementation for young children is very good, while coverage of important interventions for women such as IFA during pregnancy could improve. The overlap of interventions delivering micronutrients for which there is not a problem with deficiency should be considered as new micronutrient interventions are added, as toxicities from excess of some micronutrients are possible although unlikely. Although the evidence on micronutrient status is currently lacking, data are forthcoming from the 2020 RDHS. Food intake data are also lacking. A national dietary intake survey would provide information on the prevalence of micronutrient intake inadequacies and indications of diet as a causal factor for micronutrient deficiencies and other health outcomes. Dietary data could also be informative for assessing how interventions such as fortification could fill the nutrient intake gap. 75 Information on micronutrient intake and status at the national level could help target interventions where they are needed the most and at the least cost. 76 There is a need for assessment of the coverage, utilization, and effectiveness of interventions that are in place or being implemented, and how these vary by contextual factors.
Footnotes
Acknowledgments
We thank Emmanuel Niyongira, Country Project Manager for the Voice 4 Change Partnership at SNV Netherlands Development Organization in Rwanda for coordination on this project.
Declaration of Conflicting Interests
The author(s) declared no potential conflicts of interest with respect to the research, authorship, and/or publication of this article.
Funding
The author(s) disclosed receipt of the following financial support for the research, authorship, and/or publication of this article: Funding was from SNV-Netherlands Voices for Change Partnership to the International Food Policy Research Institute (IFPRI). JEA was funded through a subaward from IFPRI to the University of California, Davis where she was employed when this work was performed.