
Abstract
Background:
Data on infant human milk intakes in low- and middle-income countries are limited, although the deuterium oxide dose-to-mother method (DTM) is an accurate tool for its estimation.
Objective:
We assessed human milk intakes of Thai infants during the first 6 months comparing exclusive breastfeeding (EBF), predominant breastfeeding (PBF), and partial breastfeeding (PartBF).
Methods:
One hundred and ten healthy Thai lactating mother–infant pairs were followed from birth. Human milk intakes were determined at 6 weeks, 3 months, and 6 months using the DTM method. Daily energy and protein intakes were assessed using 3-day nonconsecutive 24-hour recalls. Sociodemographic characteristics were collected using a questionnaire. To compare breastfeeding practices, one-way analysis of variance with Tukey post hoc test assessed normally distributed data, while the Kruskal-Wallis test with Mann-Whitney U test was used for not normally distributed data.
Results:
No difference existed in human milk intakes during the first 6 months between EBF (743-776 g/d) and PBF (748-862 g/d). Human milk intakes of PartBF infants were significantly lower compared to other infants. Human milk intake was sufficient to meet infant energy and protein requirements during the first 3 months for EBF and PBF groups. Infant formula largely replaced human milk during the first 3 months; other solid foods were also introduced among the PartBF infants.
Conclusions:
Human milk intakes were comparable between EBF and PBF infants during the first 6 months and provided adequate energy and protein to meet requirements. Infant formula largely replaced breast milk among PartBF infants, although other foods were also given early. This study was registered at clinicaltrials.gov as NCT04020640.
Introduction
The World Health Organization (WHO) recommends exclusive breastfeeding (EBF) for the first 6 months of an infant’s life, continued breastfeeding until 2 years, and appropriate complementary feeding beginning from 6 months onward. 1 Rapid economic and social development in many low- and middle-income countries (LMIC), including Thailand, has resulted in changing diets and lifestyles as well as infant feeding practices. In Thailand, 23.1% and 42.1% of infants were reported to be exclusively and predominantly breastfed (PBF) for 6 months, respectively, while only 33.3% and 15.6% were breastfed until 1 and 2 years, respectively. 2
Compliance with WHO recommendations on infant and young child feeding poses several challenges. For example, EBF for 6 months may cease when mothers perceive that their milk is inadequate or when they return to work. In Southeast Asia, traditional beliefs regarding the inadequacy of human milk often lead to the early introduction of solid foods. 3 Infant formula has also been used to replace human milk for similar reasons. 4- 6 Consequently, evidence-based data on the daily intake of human milk for common breastfeeding practices, especially exclusive and PBF, are needed to counter this belief and to promote breastfeeding. Moreover, partial breastfeeding (PartBF) is widely practiced, for example, among working mothers in Thailand. However, the contribution of human milk to infant feeding and what replaces breast milk during the recommended period of EBF is not known.
Assessments of human milk intake by infants in LMICs are very limited and generally have relied on the test weighing method. 7 However, this method is tedious and requires observers to be present for 48 or 72 hours, which may inconvenience mothers and their families. 8 The deuteriurm oxide dose-to-mother method (DTM) has been developed to measure human milk intake. By dosing the mother with deuterated water, saliva samples can be collected from a mother and infant pair over a period of 14 days and analyzed for deuterium enrichments. Using statistical modeling, the amount of daily human milk intake can be calculated. 9 In the present study, DTM was used to assess human milk intake among Thai breastfed infants. The primary objective was to compare human milk intakes among infants who were EBF, PBF, or PartBF during the first 6 months. The secondary objectives were to compare the contribution of human milk to the total energy and protein intakes as well as to assess the duration of breastfeeding among the 3 breastfeeding practices.
Methods
Study Design
This prospective observational study followed infants from birth to age 12 months. The data presented in this article focuses on human milk intake of infants during the first 6 months, according to mother’s report of infant feeding. Exclusive breastfeeding is defined as giving human milk only, with allowances only being made for oral rehydration salts (ORS), drops and syrups (vitamins, minerals, medicines). Predominant breastfeeding is defined as giving human milk plus other liquids (eg, water and water-based drinks and fruit juice), ORS, drops and syrups (vitamins, minerals, and medicines). Partial breastfeeding is defined as giving human milk plus infant formula, cow’s milk, or complementary foods. 10 The study was approved by the Human Ethics Committee of Mahidol University and Ratchaburi hospital.
Setting
This study was conducted in an urban area of Ratchaburi province, central Thailand, from July 2013 to November 2016. The study’s participants were recruited from Ratchaburi Hospital and a Health Promotion Hospital, both of which are located in Ratchaburi province.
Sample
Participants in this study were apparently healthy pregnant women aged 18 to 35 years who planned to breastfeed their infants for at least 6 months. Inclusion criteria were infants born full-term (gestational age 37-42 weeks), singleton, and normal birth weight (2500-4000 g). Eligible participants also planned to live in Ratchaburi province for at least 1 year postpartum. They were approached during late pregnancy and confirmed for study participation by written informed consent after giving birth and prior to data collection.
The overall study was to compare the body composition of infants with respect to breastfeeding practices. Sample size was determined based on differences in fat-free mass (FFM) among the 3 breastfeeding practices of 0.279 kg, with 0.302 kg within-group standard deviation of FFM, 11 power 90%, and allowing for 40% possible dropout. The necessary sample size was 34 per group. To verify if this sample size would be adequate for meeting this article’s primary objective, sample size estimation was based on differences in human milk intake 12 and variance taken from International Atomic Energy Agency (IAEA), 9 power 90%. Under these criteria, the total sample size would be 30 mother–infant pairs, with a minimum required sample size per group of 10 mother–infant pairs. While a total of 148 mother–infant pairs were recruited, only 110 pairs had complete data on human milk intake until 6 months.
Data Collection
At the first visit (2 weeks postpartum), maternal breastfeeding practices were confirmed using a detailed questionnaire covering 2 weeks prior to the human milk assessment. Human milk intake was then measured using the DTM. 9 Briefly, an oral dose of 0.1 g/kg body weight deuterium oxide (2H2O) was used. 13 The deuterium dose was prepared in the laboratory prior to the field visit, using weights derived from average height of the recruited mothers and a maximum body mass index (BMI) of 25 kg/m2. Consequently, the dose given to each woman was 7 g of deuterium. For sample collection and processing, baseline 2 to 4 mL of saliva samples from mothers and infants were taken (day 0). Both mothers and infants fasted at least 15 minutes to make sure that there was no residual milk or other foods in their mouths. Saliva samples were collected using cotton wool swabs for infants and cotton wool balls for mothers. A disposable syringe was used for squeezing saliva from each cotton wool ball into a 2-mL sample storage vial, which was then labeled with the participant’s identification number as well as date and time of sample collection. Thereafter, each mother breastfed her infant as usual, and the infant ingested deuterated water (2H2O) via the mother’s milk. Saliva samples (postdose) were collected from both mothers and infants on days 1, 2, 3, 4, 13, and 14 after dosing. Tightly capped containers were used for storing the saliva samples. These containers were firmly closed to prevent evaporation or cross-contamination between samples. To prevent cross-contamination, for each mother–infant pair, the sample vials for predose and postdose were stored in separate ziplock bags and then all samples for the pair in large ziplock bags. Each participant’s identification number was written on both the sample vials and all ziplock bags. To minimize bacterial growth, saliva samples were stored in a cool box until they were transferred to a freezer at −20 °C for storage until analysis. Maternal weight, height, study date, dose number, time of dose consumption, date and time of saliva samples at predose and postdose, and infant weight, length, study date, date and time of saliva samples at baseline, and postdose were recorded. Mothers in the EBF and PBF groups were also asked to estimate the amount of water (g/d; if any) given to their infants during the 14 days of sample collection.
Enrichment of 2H in the saliva samples was determined by isotope ratio mass spectrometry. Human milk intake, non-milk oral intake (NMOI), and maternal body composition were calculated based on fitting the deuterium enrichment model, a 2-compartment steady state model connected by the flow of milk from mother to infant. The deuterium disappearance in the maternal body water and deuterium enrichment in infant’s body water was calculated by fitting the deuterium enrichment data to a model for water turnover in the mother and in the infant. 9 The curve fitting was performed using the “Solver” function in Microsoft Excel, which uses nonlinear regression to determine the line of best fit through the data. 9 The spreadsheet template for the calculations was provided by IAEA.
Infant anthropometry
We asked each mother to remove all of her infant’s clothes and diaper. All measurements of infant anthropometry were made in duplicate on nude infants by the same trained research assistant to eliminate interexaminer errors. Standardized anthropometric techniques and calibrated equipment were used. Infants were weighed to the nearest 0.1 kg using a digital infant scale (Seca digital scale model 383, Seca Corporation). Length was measured using a UNICEF wooden length board to the nearest 0.1 cm.
Mother’s anthropometry
Height and weight of mothers were measured using standardized techniques. Weight was measured to the nearest 0.1 kg using a digital scale (Seca digital scale model 813; Seca Corporation). Maternal height was measured at first visit (2 weeks postpartum) using a stadiometer to the nearest 0.1 cm. Prepregnancy weight, gestational weight gain, gestational age, and infant birth date were collected by recall and verified using hospital records. Prepregnancy BMI was calculated by dividing weight (kg) with square of height (m2).
Dietary intake and feeding practices were collected using nonconsecutive 3-day 24-hour recalls at each visit (6 weeks, 3 months, and 6 months) for which human milk intake was measured. The multiple pass method was used to elicit infant intakes. 14 Briefly, mothers were first asked to recall all food/milk items given to their infants during the previous 24-hour period. Interviewers then read back the food/milk items that mothers recalled one by one and allowed time for mothers to respond if any foods/milk items were omitted. Next, mothers were asked to recall the time when each food/milk item was fed. Thereafter, mothers provided descriptions of each food/milk item (eg, ingredients, preparation method, brand name). Lastly, the interviewer asked mothers to estimate the quantity or size of food/milk items consumed using dietary recall aids (photo book, measuring cups, or spoons).
Breastfeeding duration and age at introduction of complementary foods were also obtained. Energy and protein from human milk were calculated using WHO’s human milk composition (energy = 0.67 kcal/1 g of milk and protein = 9 g/L at age 3 and 6 months). 15 Energy (kcal/d) and protein intakes (g/d) from complementary foods and infant formula were calculated using dietary calculation software (INMUCAL-Nutrients V3 database NB1). Duration of breastfeeding was assessed using a questionnaire, which asked each mother to recall the age of her infant when breastfeeding stopped as well as any reasons for stopping breastfeeding. This questionnaire was implemented at every scheduled visit (2 and 6 weeks, 3 months, and 6 months).
Data Analysis
All variables were tested for normality using the Kolmogorov-Smirnov Test. One-way analysis of variance (ANOVA) with Tukey post hoc test was used for normally distributed data or the Kruskal-Wallis test with Mann-Whitney U test for not normally distributed data for comparisons among the three breastfeeding practices. χ2 test was used to test differences among groups for categorical variables of the baseline characteristics (education, parity, infant sex, household income, and mode of delivery). Descriptive data were expressed as mean ± SD, percentage, or median and interquartile range. Significant difference was considered at α = 0.05. All analyses were performed with IBM SPSS Statistics for Windows, Version 19.0 (IBM Corp).
Results
Characteristics of the Study Participants
Of the 148 mother–infant pairs, 29 stopped breastfeeding and 9 moved away before 6 weeks. Hence, 110 mother–infant pairs completed the study consisting of 29 pairs for EBF, 39 pairs for PBF, and 42 pairs for PartBF at 6 weeks and 3 months, according to maternal reports of infant feeding. Breastfeeding practices changed to PartBF after 3 months among some participants in the EBF (45%) and PBF (69%) groups. Twenty mother–infant pairs (1 in the PBF and 19 in the PartBF group) stopped breastfeeding between 3 and 6 months. Figure 1 shows the flow of samples.
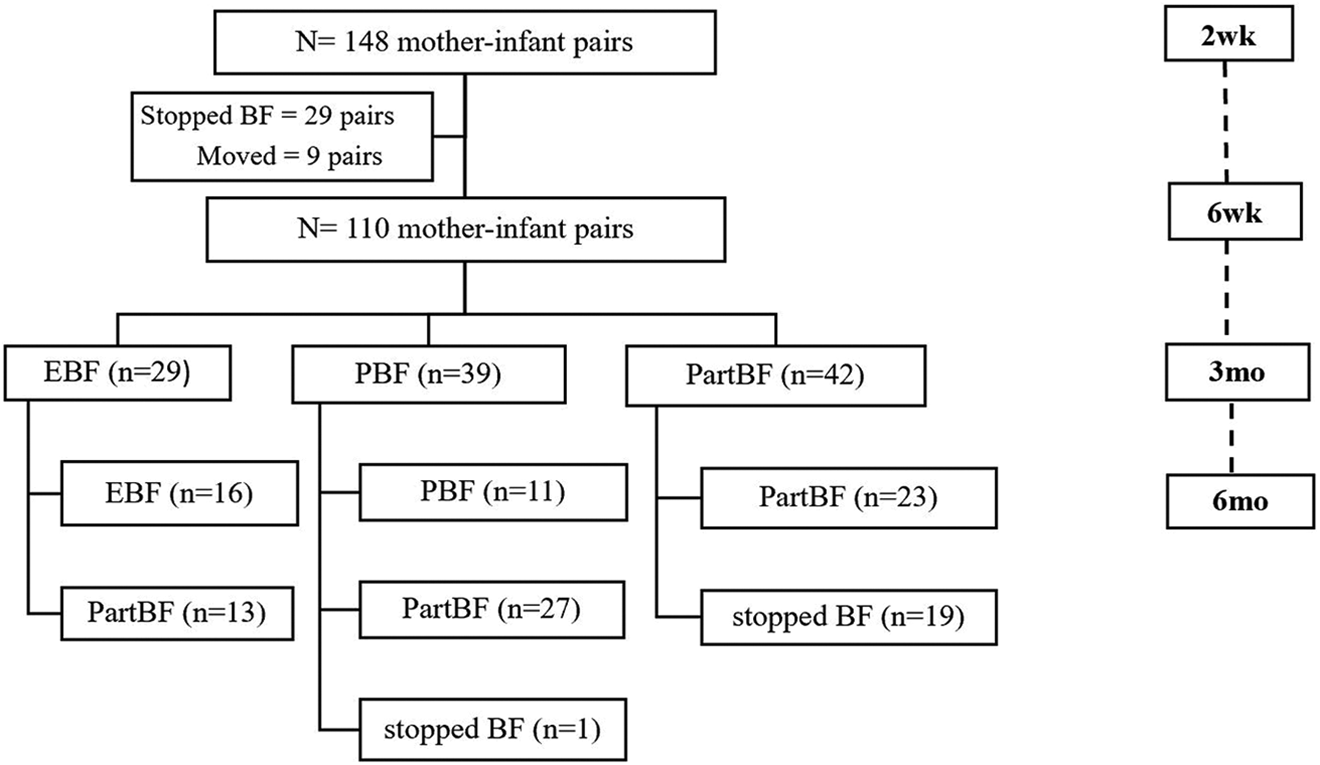
Flow of samples by breastfeeding practices during 6 months.
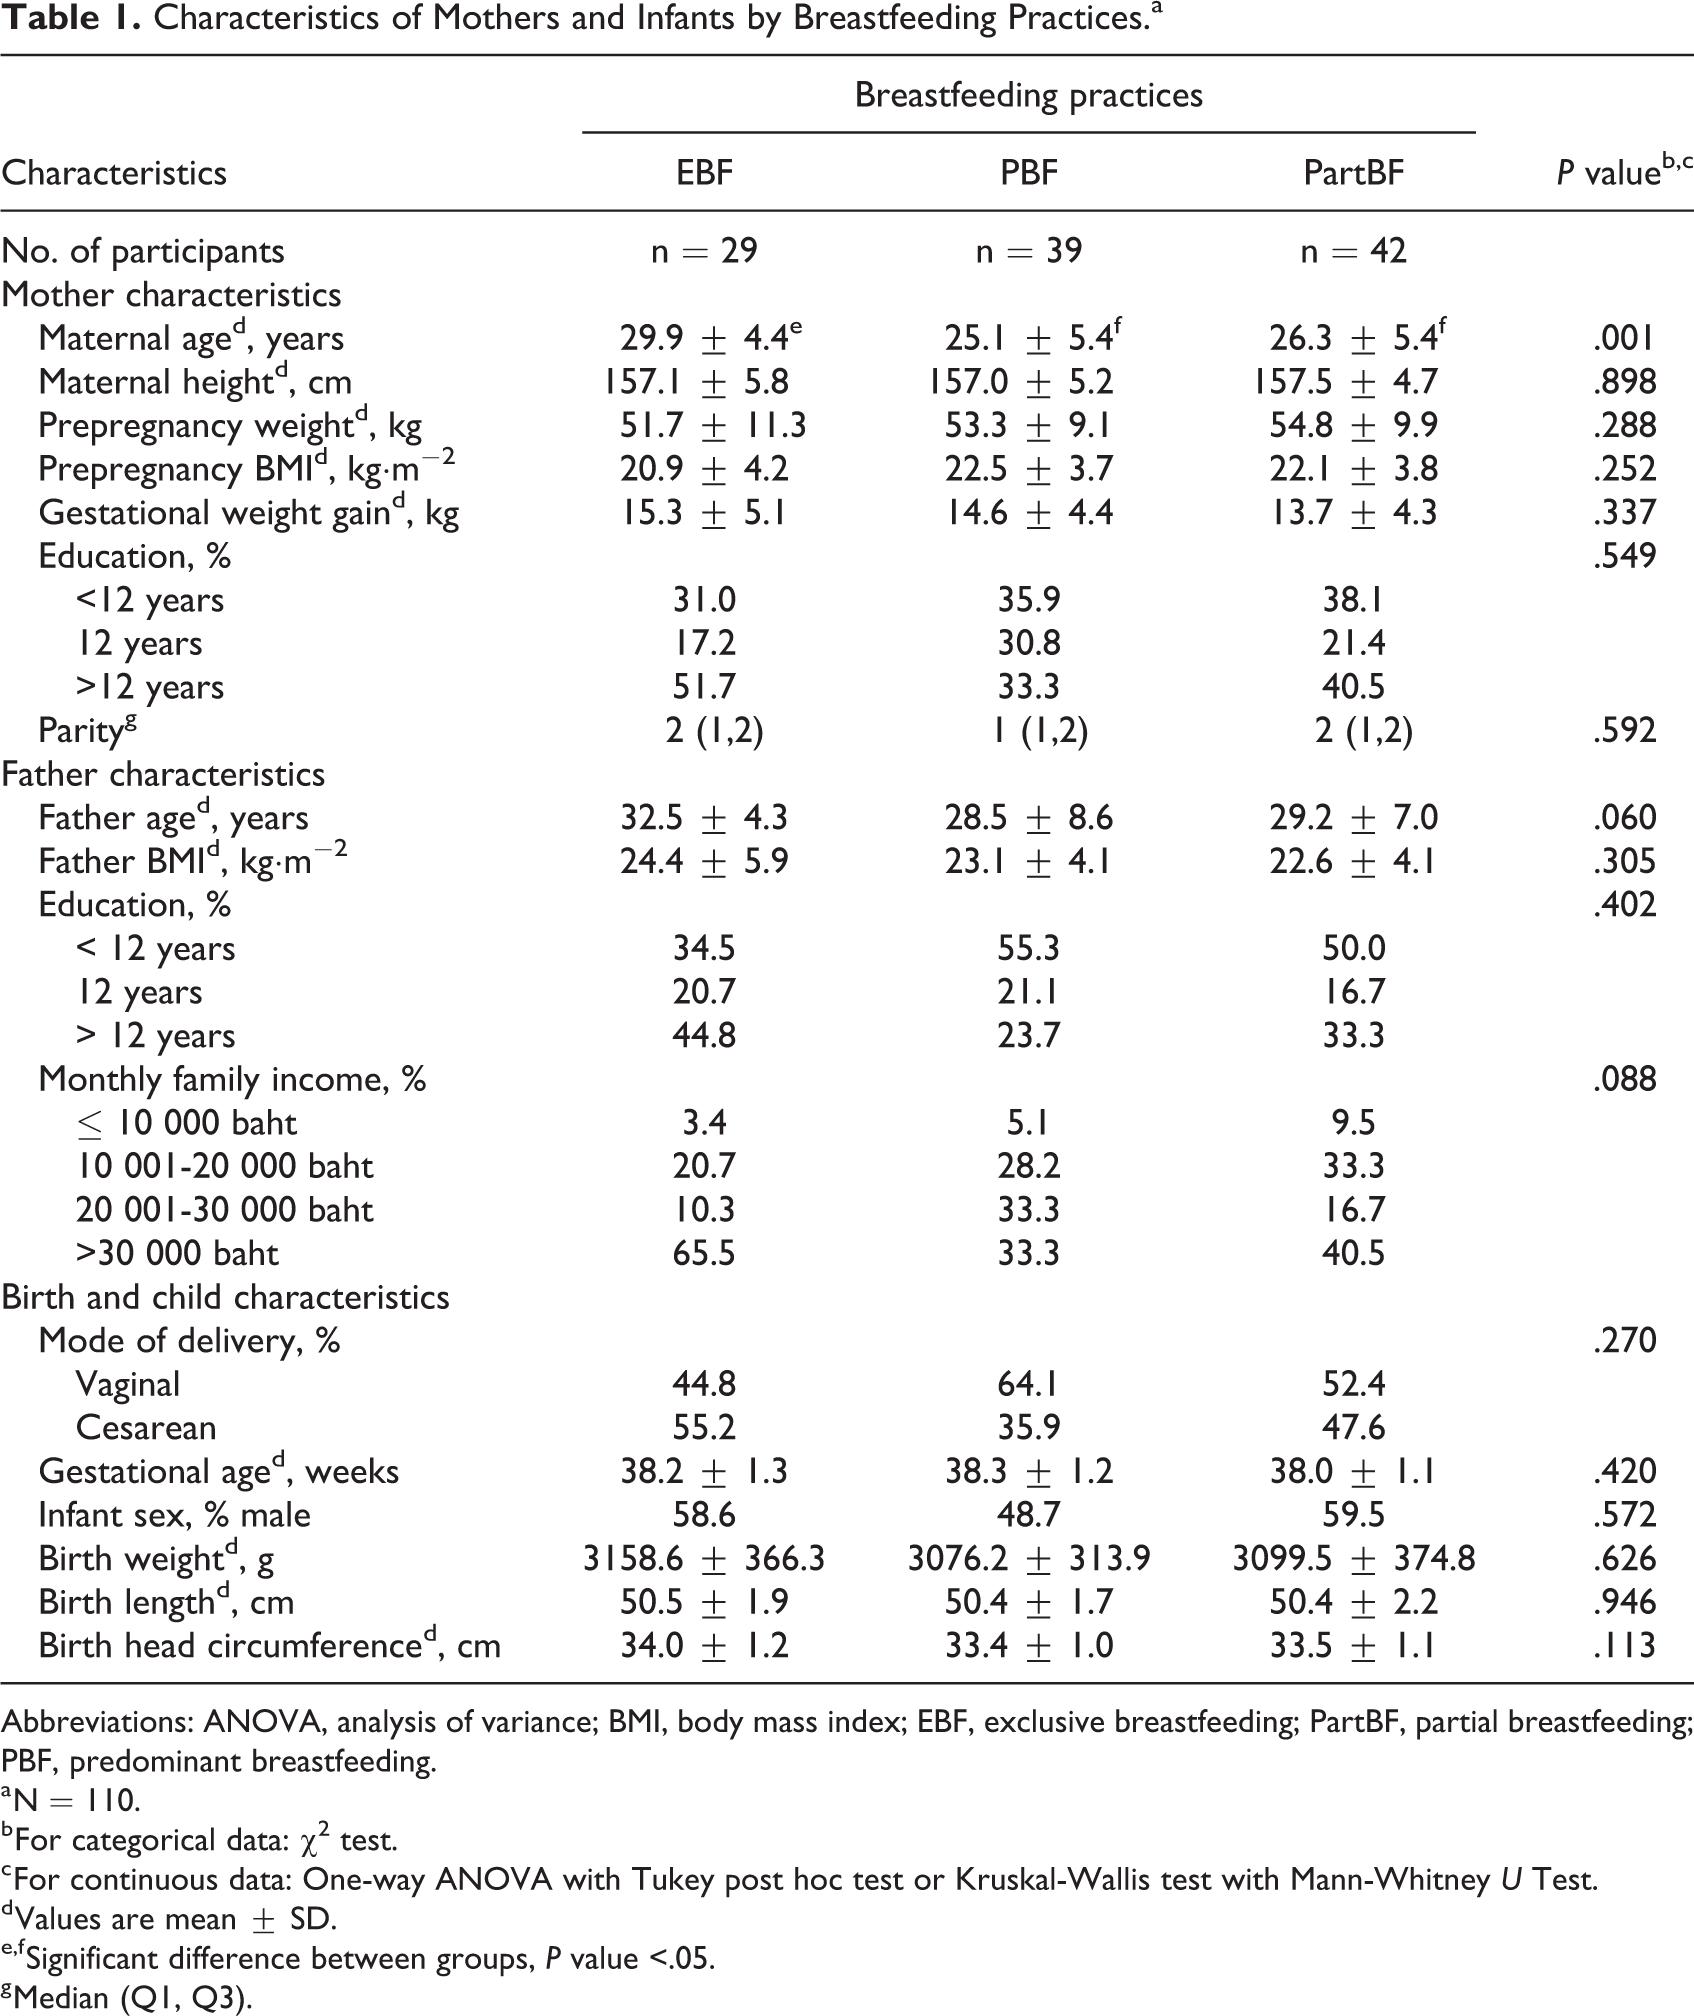
Table 1 presents demographic and socioeconomic characteristics of the study participants by breastfeeding practices at recruitment. Maternal ages in the EBF group were significantly higher than those of the PBF and PartBF groups (P = .001). Maternal and paternal education and household income were similarly higher but not statistically significant in the EBF group than for the other groups. All infants were born full-term and had a mean birth weight of slightly over 3000 g and a mean birth length of 50 cm. No infants had low birth weight or were short stature. Over half (55.2%) of the infants in the EBF group were born by cesarean section.
Characteristics of Mothers and Infants by Breastfeeding Practices.a
Abbreviations: ANOVA, analysis of variance; BMI, body mass index; EBF, exclusive breastfeeding; PartBF, partial breastfeeding; PBF, predominant breastfeeding.
a N = 110.
b For categorical data: χ2 test.
c For continuous data: One-way ANOVA with Tukey post hoc test or Kruskal-Wallis test with Mann-Whitney U Test.
d Values are mean ± SD.
e,f Significant difference between groups, P value <.05.
g Median (Q1, Q3).
Human Milk Intakes by Breastfeeding Practices
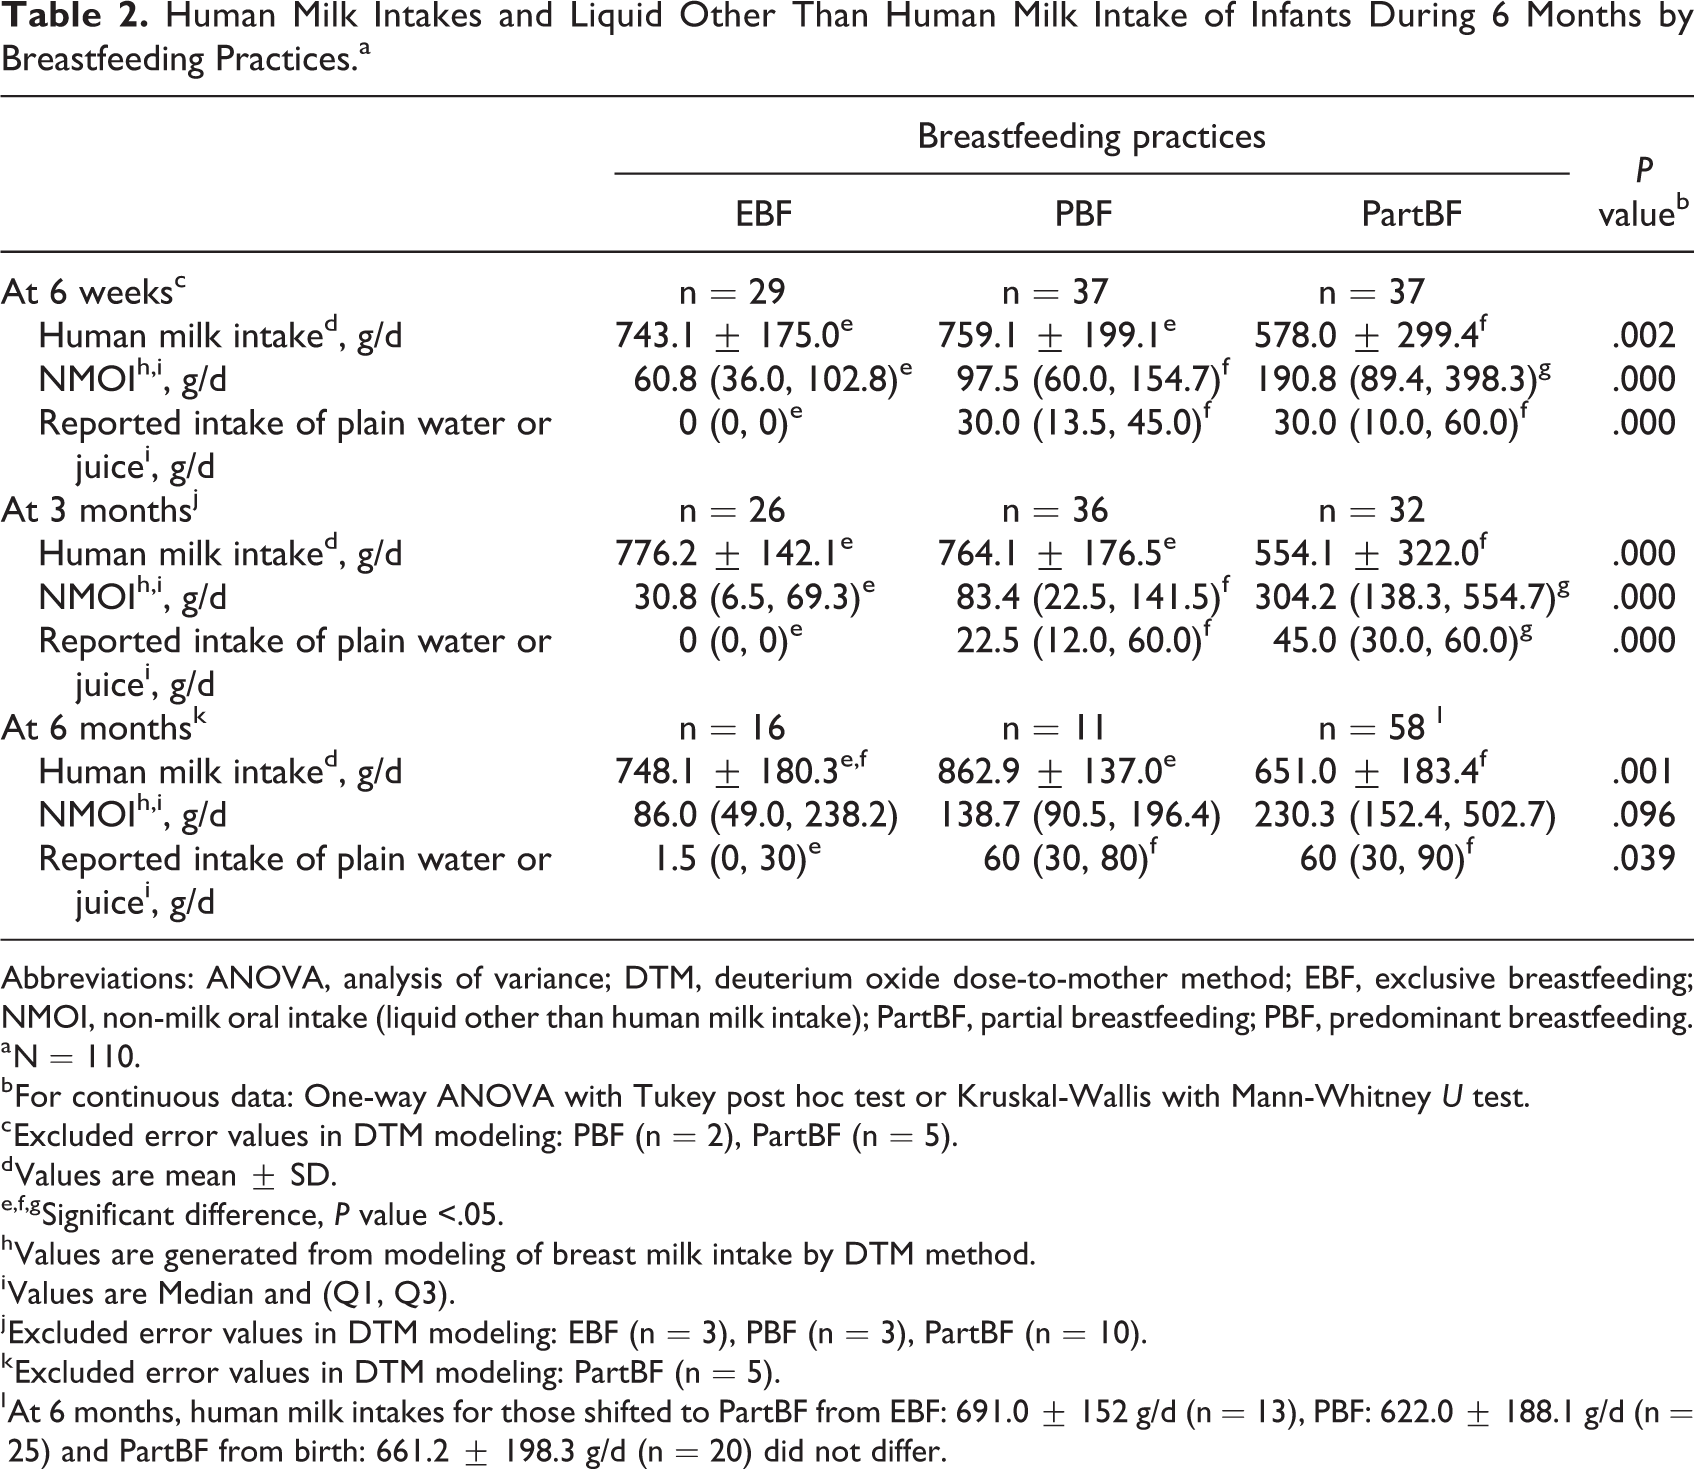
Human milk intakes of the EBF and PBF groups were significantly higher than for the PartBF group at 6 weeks and 3 months (Table 2). On average, the quantity of human milk intake in both the EBF and PBF groups was over 740 g/d compared to <580 g/d in the PartBF group and was more variable in the latter group. The mean NMOI among the EBF group was the least and significantly lower than that of the PBF and PartBF groups at 6 weeks and 3 months (P < .001). At 6 months, only the human milk intake in the PBF group (862.9 ± 137 g/d) was significantly higher than that of the PartBF group (651 ± 183.4 g/d), while it was 748.1 ± 180.3 g/d in the EBF group. During all measurements, mothers in the EBF group reported giving none or a very small amount of water. Both the PBF and the PartBF mothers gave significantly higher amounts of water, juice, or liquids from other food sources than mothers in the EBF group at 6 weeks and 3 months (P < .001).
Human Milk Intakes and Liquid Other Than Human Milk Intake of Infants During 6 Months by Breastfeeding Practices.a
Abbreviations: ANOVA, analysis of variance; DTM, deuterium oxide dose-to-mother method; EBF, exclusive breastfeeding; NMOI, non-milk oral intake (liquid other than human milk intake); PartBF, partial breastfeeding; PBF, predominant breastfeeding.
a N = 110.
b For continuous data: One-way ANOVA with Tukey post hoc test or Kruskal-Wallis with Mann-Whitney U test.
c Excluded error values in DTM modeling: PBF (n = 2), PartBF (n = 5).
d Values are mean ± SD.
e,f,g Significant difference, P value <.05.
h Values are generated from modeling of breast milk intake by DTM method.
i Values are Median and (Q1, Q3).
j Excluded error values in DTM modeling: EBF (n = 3), PBF (n = 3), PartBF (n = 10).
k Excluded error values in DTM modeling: PartBF (n = 5).
l At 6 months, human milk intakes for those shifted to PartBF from EBF: 691.0 ± 152 g/d (n = 13), PBF: 622.0 ± 188.1 g/d (n = 25) and PartBF from birth: 661.2 ± 198.3 g/d (n = 20) did not differ.
Contributions of Human Milk to Total Energy and Protein Intakes
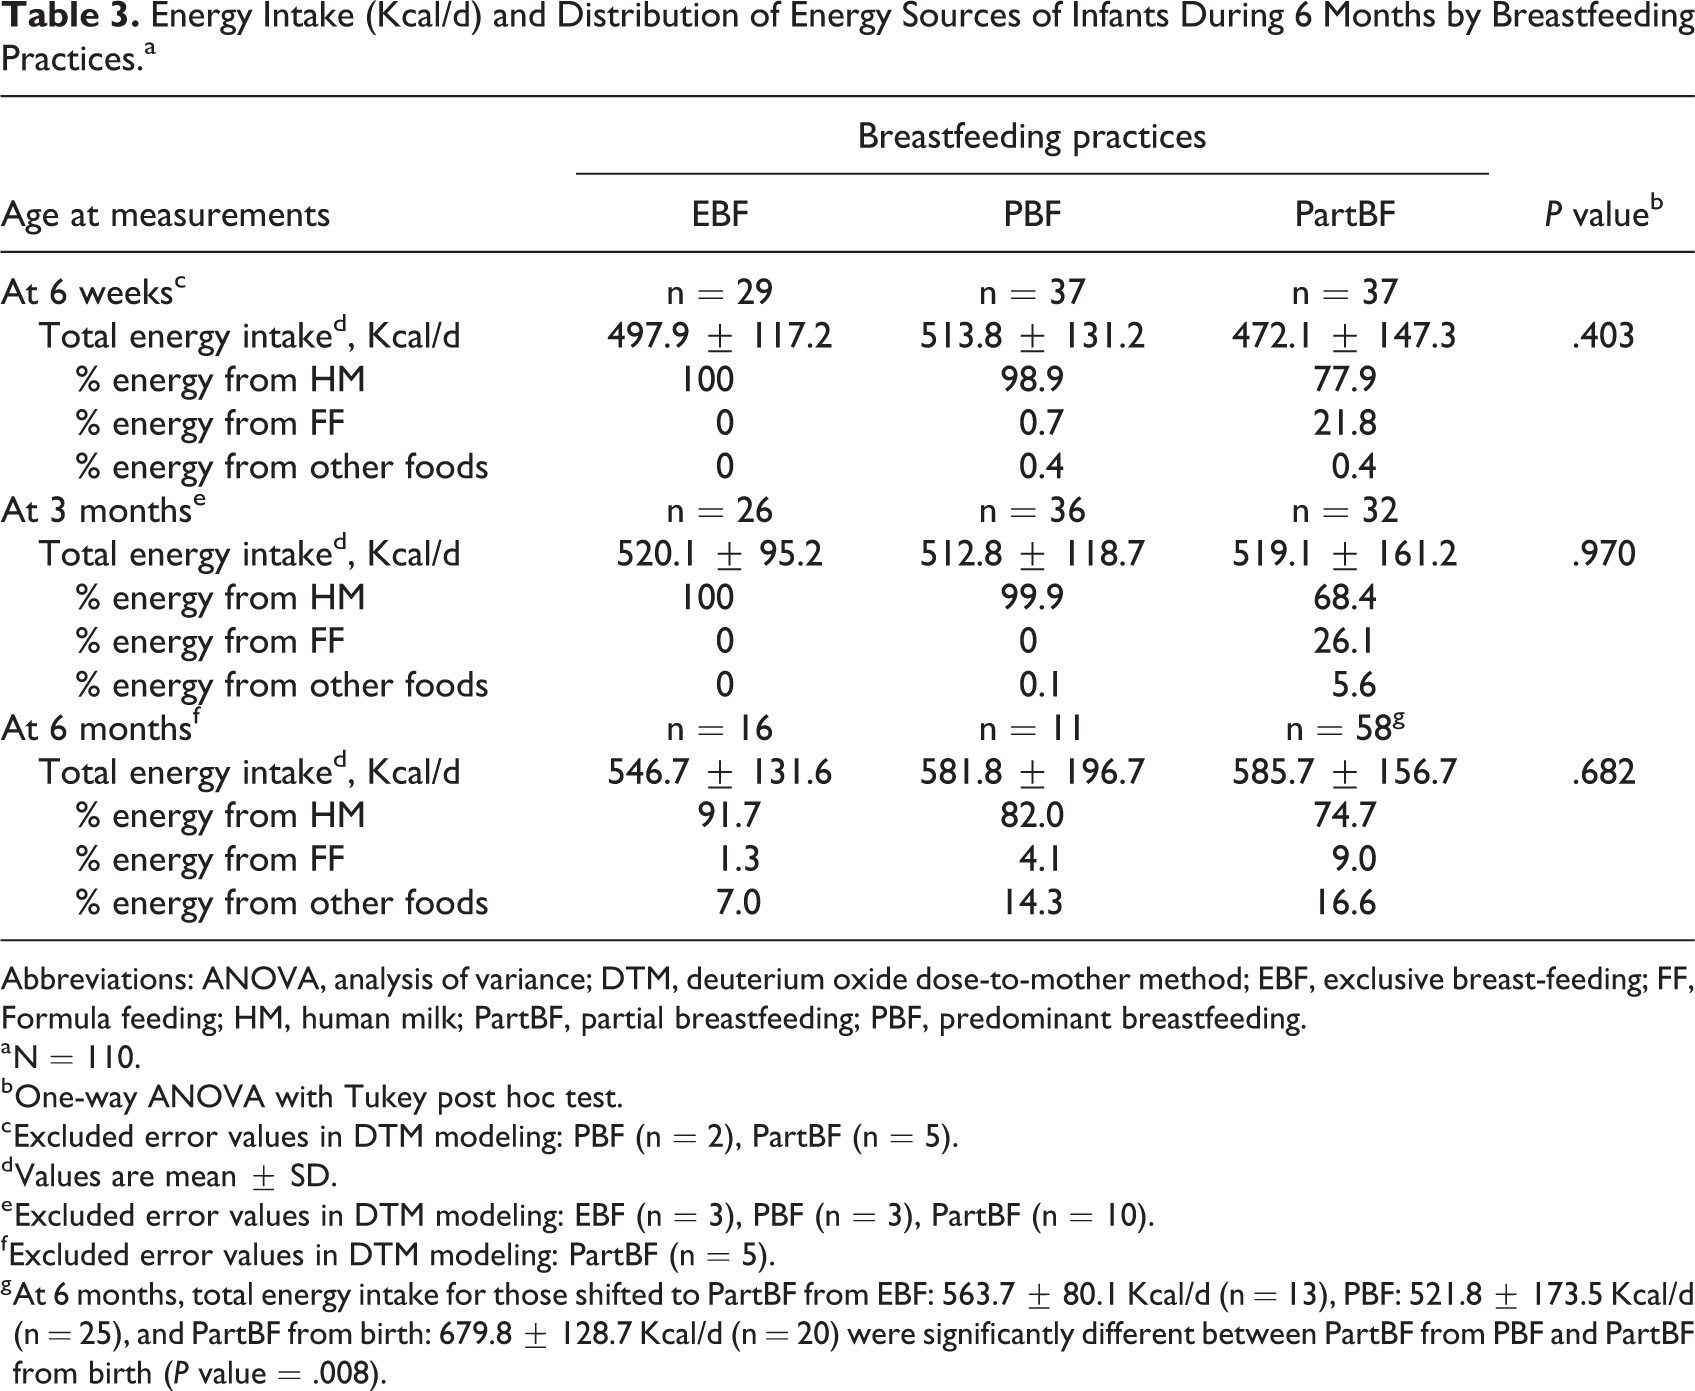
No significant differences existed in total energy intakes of infants by breastfeeding pattern and at time of measurement during the first 6 months (Table 3). At 6 weeks and 3 months, energy intakes of infants in the EBF and PBF groups came entirely from human milk, whereas it constituted almost 80% of total energy intake in the PartBF group at 6 weeks and only about 68% at 3 months. At 6 months, among all groups, mothers began to introduce infant formula and/or complementary foods. Nonetheless, the energy contribution from human milk among those who continued EBF and PBF remained high (above 80%), while those who shifted to PartBF after 3 months was comparable to that of the PartBF group from birth (see also footnote of Table 3). Infants who were weaned from breastfeeding after 3 months (n = 20) had a higher total energy intake than all 3 breastfeeding patterns (632.3 ± 131.7 Kcal/d) but not significantly. The main energy contribution was from infant formula at about 85% (data not shown).
Energy Intake (Kcal/d) and Distribution of Energy Sources of Infants During 6 Months by Breastfeeding Practices.a
Abbreviations: ANOVA, analysis of variance; DTM, deuterium oxide dose-to-mother method; EBF, exclusive breast-feeding; FF, Formula feeding; HM, human milk; PartBF, partial breastfeeding; PBF, predominant breastfeeding.
a N = 110.
b One-way ANOVA with Tukey post hoc test.
c Excluded error values in DTM modeling: PBF (n = 2), PartBF (n = 5).
d Values are mean ± SD.
e Excluded error values in DTM modeling: EBF (n = 3), PBF (n = 3), PartBF (n = 10).
f Excluded error values in DTM modeling: PartBF (n = 5).
g At 6 months, total energy intake for those shifted to PartBF from EBF: 563.7 ± 80.1 Kcal/d (n = 13), PBF: 521.8 ± 173.5 Kcal/d (n = 25), and PartBF from birth: 679.8 ± 128.7 Kcal/d (n = 20) were significantly different between PartBF from PBF and PartBF from birth (P value = .008).
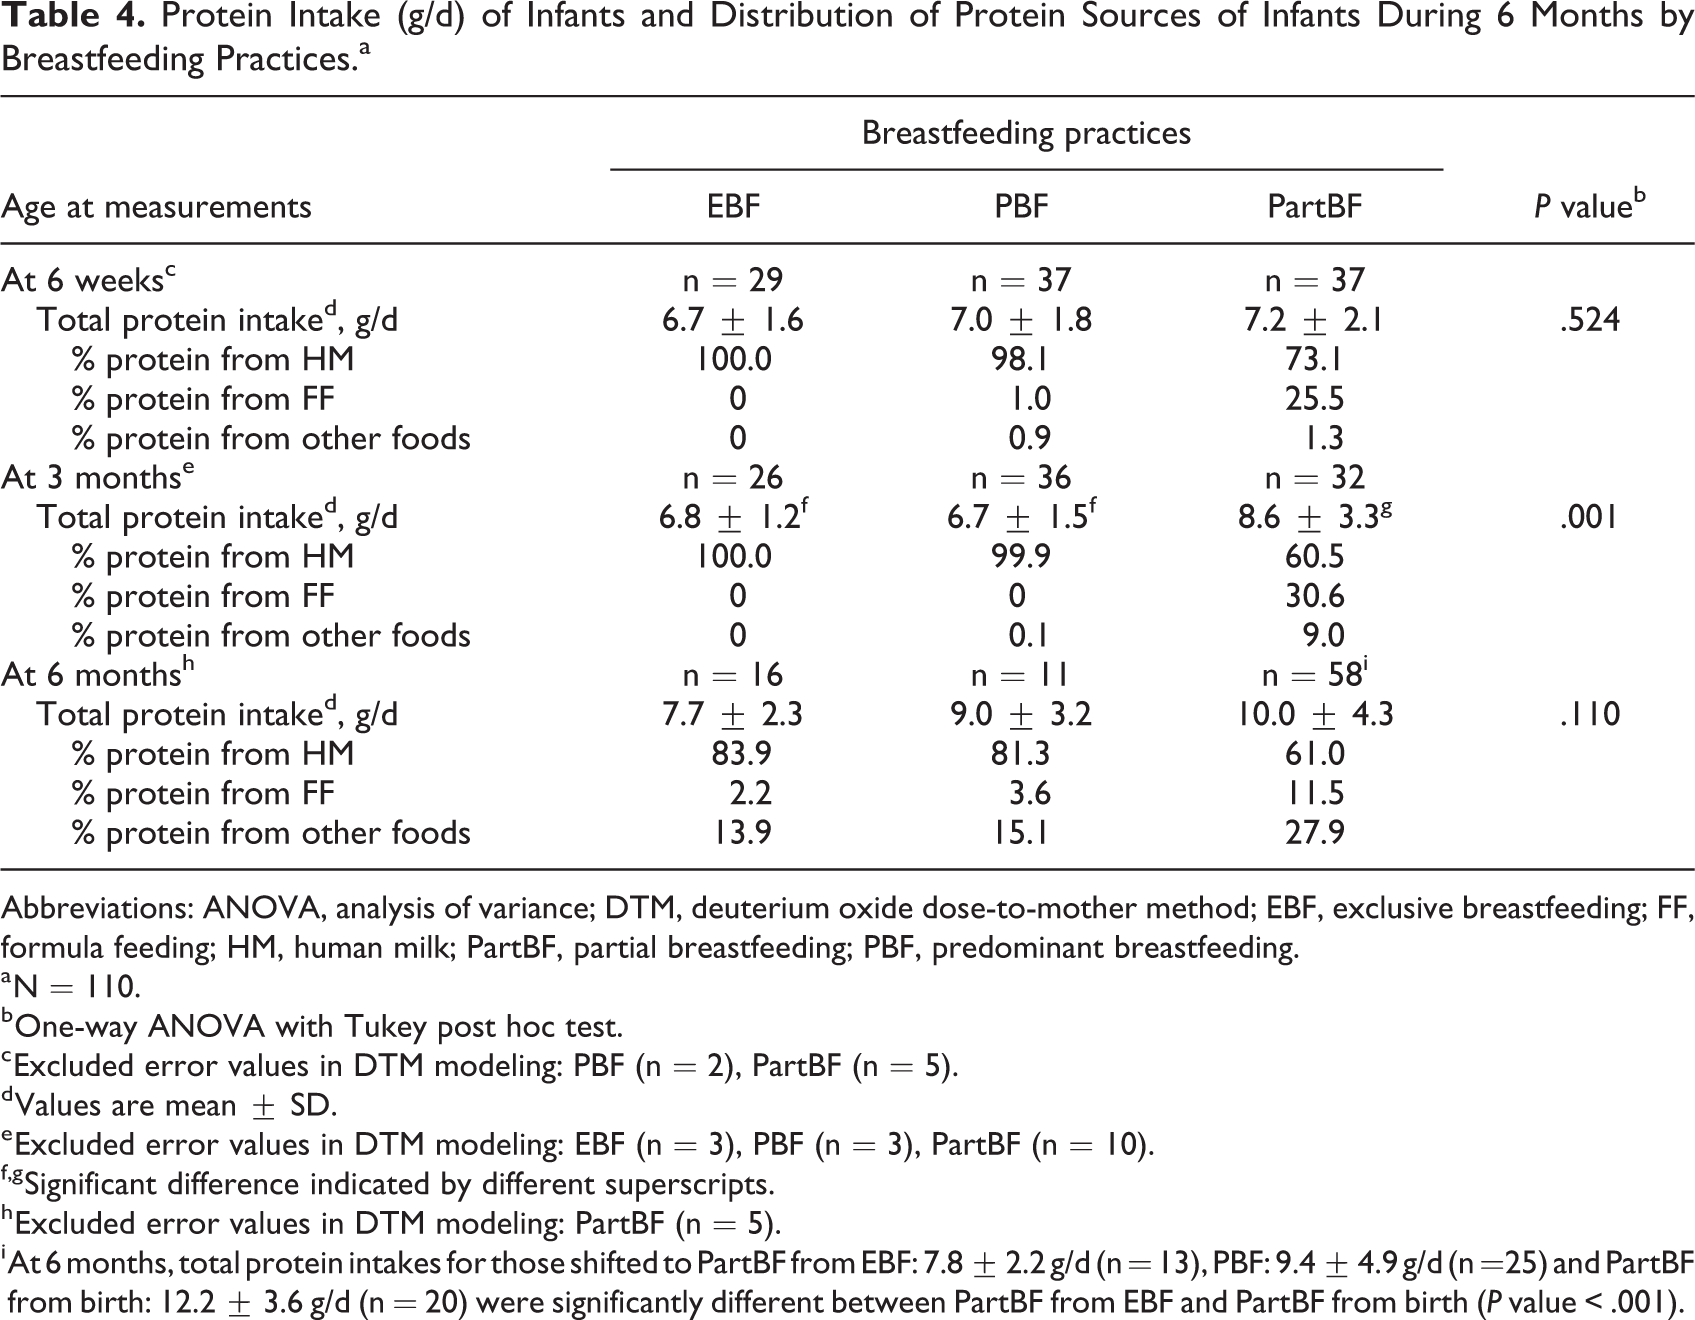
Similar to total energy intakes, total protein intakes were almost solely contributed by breast milk during the first 3 months in the EBF and PBF groups. The PartBF group had significantly higher total protein intake than the other 2 groups at 3 months (P < .001) but not different at 6 weeks or 6 months (Table 4). At 6 weeks, protein intake of the PartBF group from human milk was substantial (73%), and only 25% came from infant formula. On the contrary, the contribution of infant formula to protein intakes in this group increased to 30.6% at 3 months when other foods were also provided. At 6 months, among infants who continued with EBF and PBF, human milk still contributed over 80% of total protein intake, compared with only 61% in the PartBF group. Contribution of protein from other foods was almost double in the PartBF group (27.9%) compared to the other 2 groups (14%-15%). Infants who stopped breastfeeding after 3 months had a much higher protein intake (16.8 g/d) than infants who received human milk until 6 months (data not shown).
Protein Intake (g/d) of Infants and Distribution of Protein Sources of Infants During 6 Months by Breastfeeding Practices.a
Abbreviations: ANOVA, analysis of variance; DTM, deuterium oxide dose-to-mother method; EBF, exclusive breastfeeding; FF, formula feeding; HM, human milk; PartBF, partial breastfeeding; PBF, predominant breastfeeding.
a N = 110.
b One-way ANOVA with Tukey post hoc test.
c Excluded error values in DTM modeling: PBF (n = 2), PartBF (n = 5).
d Values are mean ± SD.
e Excluded error values in DTM modeling: EBF (n = 3), PBF (n = 3), PartBF (n = 10).
f,g Significant difference indicated by different superscripts.
h Excluded error values in DTM modeling: PartBF (n = 5).
i At 6 months, total protein intakes for those shifted to PartBF from EBF: 7.8 ± 2.2 g/d (n = 13), PBF: 9.4 ± 4.9 g/d (n =25) and PartBF from birth: 12.2 ± 3.6 g/d (n = 20) were significantly different between PartBF from EBF and PartBF from birth (P value < .001).
Weaning and Breastfeeding Duration
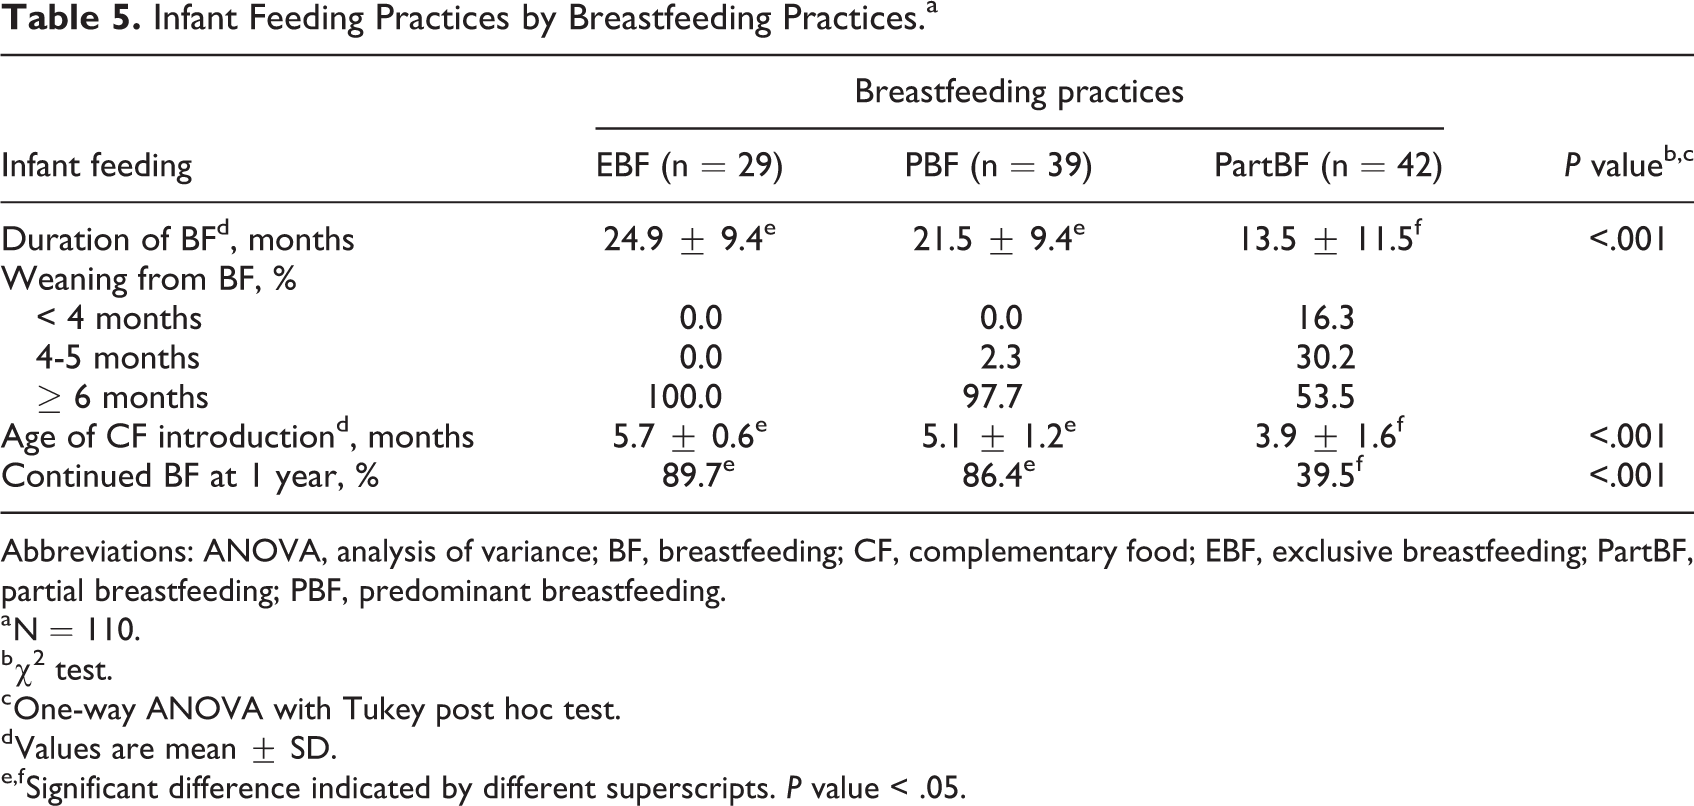
It is interesting to note that the duration of breastfeeding, on average, was much longer in the EBF and PBF groups (>20 months) than in the PartBF group (13.5 months; Table 5). In the PartBF group, 46.5% of infants were weaned from breastfeeding prior to 6 months. The rates of continued breastfeeding until 1 year were also much higher in the EBF and PBF groups (>85%) compared to the PartBF group (39.5%). The introduction of complementary food was also close to 6 months in the EBF group, compared to 3.9 months with larger variation in the PartBF group.
Infant Feeding Practices by Breastfeeding Practices.a
Abbreviations: ANOVA, analysis of variance; BF, breastfeeding; CF, complementary food; EBF, exclusive breastfeeding; PartBF, partial breastfeeding; PBF, predominant breastfeeding.
a N = 110.
b χ2 test.
c One-way ANOVA with Tukey post hoc test.
d Values are mean ± SD.
e,f Significant difference indicated by different superscripts. P value < .05.
Discussion
This study is a prospective follow-up on human milk intakes of infants who were breastfed exclusively, predominantly, or partially for 6 months using the stable isotope dose-to-mother technique. Human milk intakes at 6 weeks, 3 months, and 6 months by infants receiving EBF and PBF were significantly higher than for the PartBF group. Human milk was almost the sole source of energy and protein for the EBF and PBF groups through the first 3 months and continued to be the major source for those who continued until 6 months in these 2 groups. The duration of breastfeeding in both the EBF and the PBF groups was much longer (>20 months) than among those who practiced mixed feeding (PartBF) from birth (13.5 months).
Mean human milk intakes of infants in the EBF and PBF groups at 3 and 6 months in the present study were comparable to those reported for healthy mothers who EBF infants in developed countries (751 g/d at 3 months and 730 g/d at 6 months) 16 and higher than those reported for developing countries (574 g/d at 3 months and 611 g/d at 6 months). 15 It is recognized that human milk was still the sole food until 3 months and was a major source at 6 months for both the EBF and PBF groups, which may be a result of close supervision provided to the mothers who participated in this study.
While our study groups were defined by reported feeding (human milk, water, and other foods) at study entry, the mean NMOI at 6 weeks and 3 months in the EBF was higher than anticipated. International Atomic Energy Agency 9 recommended to use the NMOI cutoff of < 25 g/d to define EBF, which has been debated as to whether it is too restrictive. A recent carefully conducted study in Indonesia, where home observation was conducted along with the DTM method showed that a cutoff of 86.6 g/d would be more appropriate. 17 Based on this new criterion, 69% and 79% of mother–infants who reported EBF were verified to actually practice EBF at 6 weeks and 3 months. It is interesting, however, to find that 38.5% and 48.7% (at 6 weeks and 3 months, respectively) of those in the PBF group could be defined as being EBF based on the same criteria.
Traditionally, giving water to infants from birth is commonly practiced since it is perceived to clean an infant’s mouth and tongue after feeding, and additional water helps in a hot climate. 18,19 Mothers in the present study also reported the same beliefs, but the amount of water given in the EBF was nil or minimal (Table 2). In this study, giving water did not appear to interfere with the amount of human milk intake, even in the PBF group.
In the PartBF group, breastfeeding was largely replaced by infant formula until 3 months, when other foods were also introduced. Nevertheless, it is interesting that only a small proportion of mothers introduced other solid foods earlier than 3 months. No significant differences in total energy and protein intakes existed among the 3 breastfeeding patterns, except a higher protein intake in the PartBF group at 3 months. Among infants who had mixed feeding from birth, infant formula provided an almost equal amount of protein to human milk at 3 months. Among infants who shifted from EBF or PBF groups after 3 months, human milk was still the main source of energy (about 83 and 77%, respectively) and protein (75 and 65%, respectively; data not shown). Total energy intakes were adequate according to recommended intakes by Food and Agriculture Organization/WHO 20 and Thailand’s feeding guidelines. 21 Total protein intake during 6 months of the 3 breastfeeding groups was adequate (1.12 g/kg/d during 0-6 months of age), but protein intake in the PartBF group (about 1.5 g/kg/d at 3 months and 1.4 g/kg/d at 6 months) was higher than the WHO/FAO recommended intake. 22 Compared to human milk, higher protein intake from infant formula in the first 6 months was shown to be related to higher weight gain and risk of overweight later in life. 23,24
The majority of mothers reported the reason for stopping breastfeeding was low/no human milk secretion. In the present study, the quantity of human milk intake until 6 months in the EBF and PBF groups remained high, and reasons other than inadequate breast milk secretion may have caused mothers to stop breastfeeding. Previous studies have reported other factors, such as mothers returning to work, breast problems, and infant sucking problems, as reasons for stopping breastfeeding early. 25 -27
The strength of the present study is the use of the DTM method for assessing human milk intake. We found the method to be less invasive and not burdensome for mothers in terms of having an observer in their home. While the DTM method is feasible for a field setting, the logistics of several home visits or asking mothers to go to a clinic need to be considered. We also found some errors in the DTM modeling which resulted in rejection of the data from the analysis. In the PartBF group, some mothers fed small amounts of human milk while providing more of other foods and drinks. As a result, the amount of NMOI was unrealistically large and resulted in a negative value for the volume of human milk intake. For the other 2 groups (EBF and PBF), some mothers expressed milk and stored it for feeding their infants at a later point in time. Hence, human milk might not be given to the infant in the order in which it was expressed, and this will interfere with DTM modeling. Consequently, the DTM method should not be used if mothers express breast milk for later consumption by their infants. Finally, as part of the effort to maintain participation in this relatively intense measurement protocol, mothers who completed the study might be more motivated to fully breastfeed than mothers in the general population.
Conclusion
Human milk intakes when infants were breastfed exclusively or predominantly were comparable to those reported in developed countries, both at 3 and 6 months. Water or juice given to PBF infants did not appear to limit the intake of human milk. Human milk provided adequate energy and protein at 3 and 6 months to meet requirements for infants in both the EBF and PBF groups. Infants who were partially breastfed from birth, however, stopped being breastfed much earlier than infants who were either exclusively or PEB during the first 6 months.
Footnotes
Authors’ Note
This study was registered at ![]() as NCT04020640. Pattanee Winichagoon, Tippawan Pongcharoen, and Wanabhorn Tongchom designed the study and data collection protocols, performed statistical data analysis, and drafted the manuscript. Tippawan Pongcharoen and Wanabhorn Tongchom supervised and collected samples. Kunchit Judprasong analyzed saliva samples. All other authors provided inputs throughout the study and in writing the manuscript.
as NCT04020640. Pattanee Winichagoon, Tippawan Pongcharoen, and Wanabhorn Tongchom designed the study and data collection protocols, performed statistical data analysis, and drafted the manuscript. Tippawan Pongcharoen and Wanabhorn Tongchom supervised and collected samples. Kunchit Judprasong analyzed saliva samples. All other authors provided inputs throughout the study and in writing the manuscript.
Acknowledgments
The authors thank all of the families who participated in this study, and research assistants for field data and sample collection. The authors also extend their thanks to Christine Slater, Anura V. Kurpad, and Nancy F. Butte for providing technical advice on the study protocol and George A. Attig for editing the final manuscript. Wanabhorn Tongchom is a Graduate Student in Doctor of Philosophy Program in Nutrition, Faculty of Medicine Ramathibodi Hospital and Institute of Nutrition, Mahidol University, Bangkok.
Declaration of Conflicting Interests
The author(s) declared no potential conflicts of interest with respect to the research, authorship, and/or publication of this article.
Funding
The author(s) disclosed receipt of the following financial support for the research, authorship, and/or publication of this article: This study was supported by grants from the International Atomic Energy Agency (IAEA), Mahidol University Research and the office of the Higher Education Commission and Mahidol University under the National Research Universities Initiative.