
Abstract
This article describes nearly 50 years of social and economic development and changes that have occurred in the 4 villages of the Institute of Nutrition of Central America and Panama (INCAP) Longitudinal Study (1969-1977). In doing so, it contextualizes the changes in health and nutrition for the study population over that period. Since the start of the INCAP Longitudinal Study, the original 4 villages, like their home country, have undergone tremendous demographic, social, and economic change. Originally rather isolated, road and transportation access for the villages has improved steadily and substantially. The population in the villages has more than doubled. Schooling access and outcomes have also improved substantially, with average grades of schooling tripling and literacy doubling, reaching levels currently on par with national averages. Occupations have also changed over the course of a generation. Early on, subsistence farming and agriculture in general were dominant but are now much less common. Much of this change is associated with declining agricultural markets alongside increased access to nonagricultural jobs near the villages and in the capital. With all these changes have come improvements in living standards. It is within this dynamic context that study participants for the INCAP Longitudinal Study were born and raised and where most now live as adults.
Introduction
From 1969 to 1977, Institute of Nutrition of Central America and Panama (INCAP) carried out a longitudinal nutritional intervention in 4 villages in the Department of El Progreso, Guatemala, known as the “INCAP Longitudinal Study” which included 2392 children aged 0 to 7 years. 1
The study villages were selected to have similar characteristics (Table 1) and to facilitate the logistics of the intervention. 2 The 4 villages are located in the Department of El Progreso, east of and all within about 100 km from Guatemala City. Inhabitants are of Ladino (Spanish-Mayan nonindigenous) heritage. 3 By design, the INCAP Longitudinal Study villages were broadly similar at the outset of the study in 1967. For example, the primary source of income for most households in each of the villages was subsistence agriculture, and almost all were tenant farmers or small landowners. The most important crops were maize and beans. Most residents owned their homes, but ownership of other assets was rare. 2 Fewer than 10% of the homes in each village had running water, with nearly everyone collecting water from wells or unprotected open water sources such as springs and rivers. No homes had latrines nor were there any sewage drainage systems. There was no electricity. Houses (ranch style) were constructed of modest materials readily available in the village.
Criteria for Village Selection.a
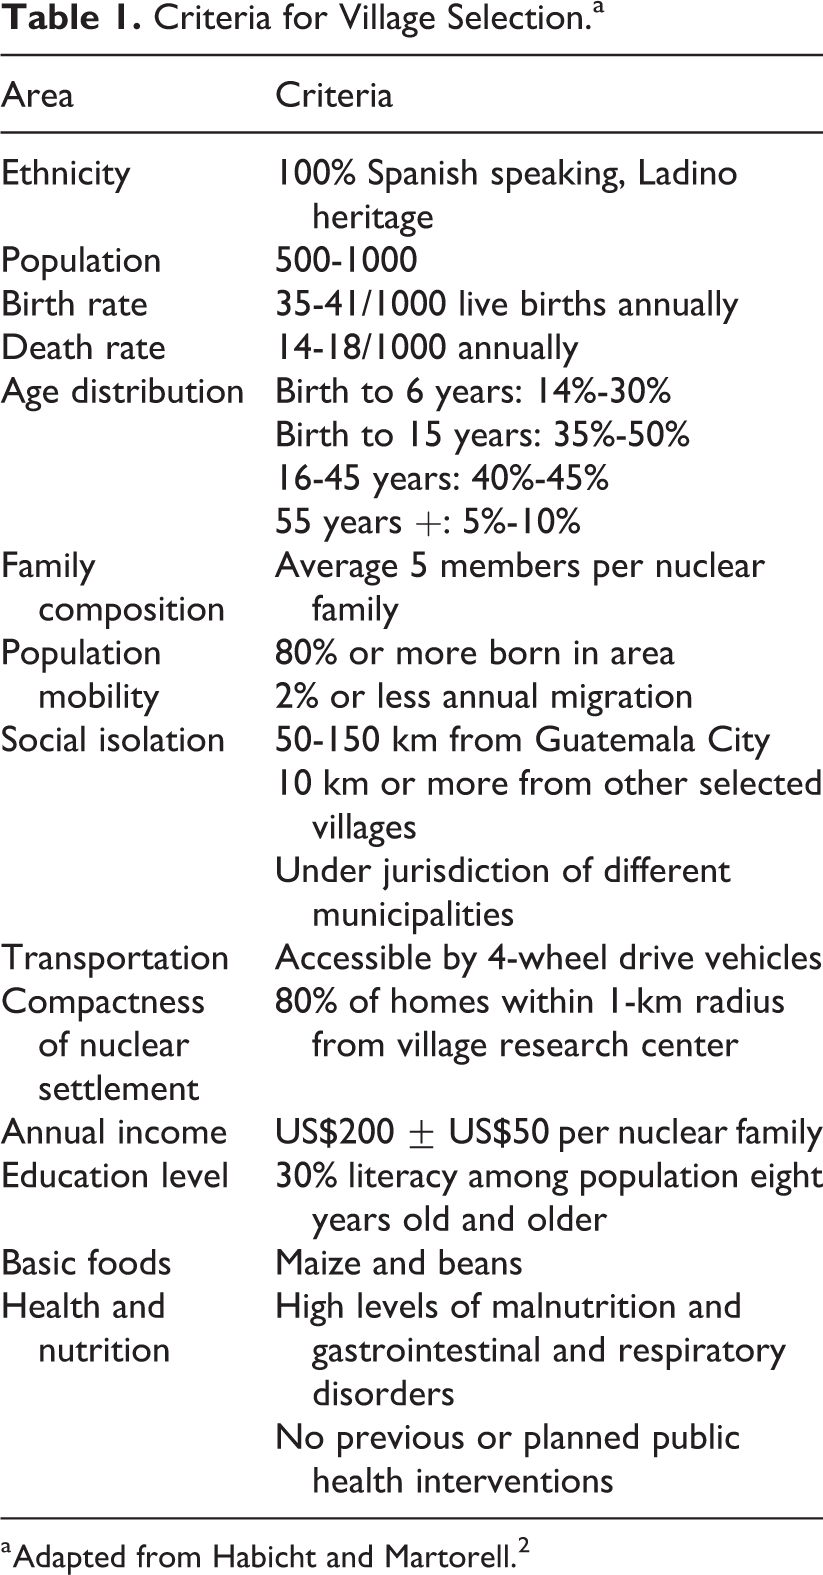
a Adapted from Habicht and Martorell. 2
These villages have been the locus of several subsequent studies after the initial intervention. 4 -7 Since the late 1960s, both Guatemala as a whole and the 4 study villages themselves have undergone tremendous change. For example, the population of Guatemala has grown from 5.1 million in 1967 to over 17.6 million in 2019 (according to 2002 census projection). Alongside this population growth, Guatemalan gross domestic product per capita measured in 2010 constant US dollars has nearly doubled from $1692 in 1967 to $3160 in 2018. 8
This article describes the development and change in these small rural localities over half a century, including how outcomes have changed from one generation to the other. We characterize infrastructure development, health and educational services, and the livelihood opportunities available to residents, which can provide context for, and inputs into, other analyses of the participants.
The 4 Study Villages
Despite their similarities after initial selection, there were also some small (but statistically significant) differences in socioeconomic indicators across the villages, including fertility rates, literacy rates, and occupational patterns. 9 We describe here 2 important initial conditions that differed across villages and are associated with livelihoods: agricultural potential and location.
One difference was, and remains, the agroecological environments across the villages. El Progreso is one of the hottest and driest departments in Guatemala. The rainy season is from May to October, and this governs the agricultural production cycle in the region. 3 The department can be divided into 2 ecological areas that differ in temperature, rainfall patterns, and quality of soil: the highlands of the Motagua Valley and the lowlands along the Motagua River. 10 Three of the study villages (Conacaste, San Juan, and Santo Domingo) are located in the cooler, wetter highlands. Historically, lands there have been used for subsistence production. 10 The fourth, Espíritu Santo, is in the warmer, drier lowlands, where the soils are deep and rich and the land is flat and amenable to mechanization and irrigation and thus commercial agriculture. This separation between subsistence and commercial production is emblematic of the dual nature of agriculture elsewhere in Guatemala. 10
A second important difference among villages is the location, in particular their respective distances to their municipal capital and the Atlantic coast highway leading to Guatemala City. The 3 highland villages are 4 to 8 km from their municipal capitals, whereas Espíritu Santo is only 1 km away from its municipal seat, El Jícaro. Proximity to the municipal capital has tended to provide residents of Espíritu Santo with better access to municipal-level health and educational services. All 4 villages are along, but not on, the Atlantic coast highway. In addition to being closest to the highway, Santo Domingo also is closest to Guatemala City (36 km); Espíritu Santo is the farthest away (102 km) with the others approximately 60 km away
3,10
(see Figure 1
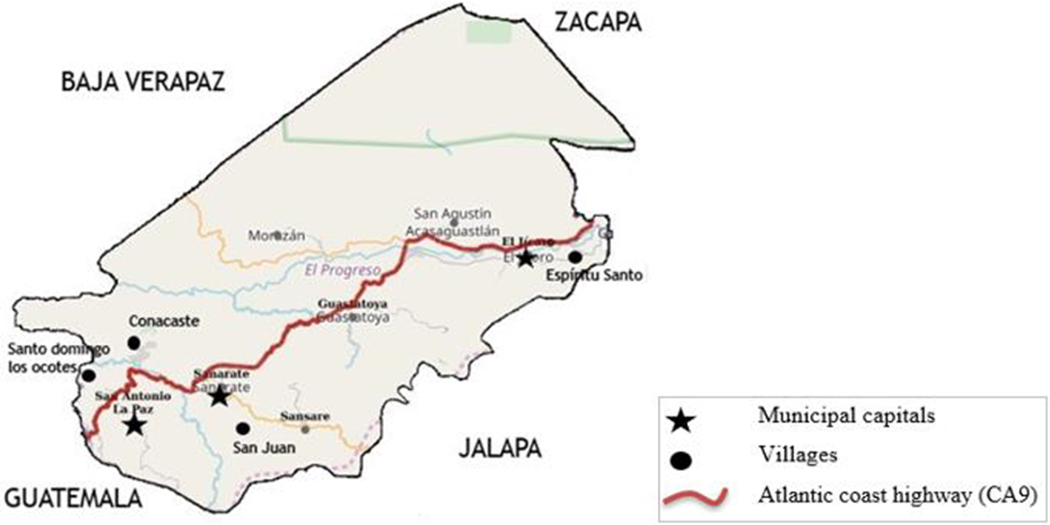
Location of Institute of Nutrition of Central America and Panama (INCAP) Longitudinal Study Communities in Department of El Progreso, Guatemala.
These initial differences in agricultural potential and location have been associated with different quality and timing of village infrastructure development, for example, roads, transportation, and services. These, in turn, have been associated with mobility and access to health and schooling services, livelihood opportunities, and trends in employment and migration.
Methods
The principal sources of information for this article include the 5 village censuses done between 1967 and 2002, two additional surveys targeting the 2392 original study participants starting in 2006 and 2015, and several village histories employing both quantitative and qualitative methods of data collection to differing degrees. 3,10 -12 In particular, this article updates and extends the analysis first reported by Maluccio et al 13 based primarily on the repeated censuses through 2002. These data include all village residents in specified age groups; importantly, village boundaries did not change over time. In 2006 to 2007 and 2015 to 2018, surveys tracking original participants and their families were carried out as described by Melgar et al 14 and Ford et al. 15 For these surveys, we examined all original participants living in or near the study villages (delineating each survey with the year it began because the vast majority of respondents were interviewed in that year). For those interviewed in 2015 to 2018, 75% lived in or near the study villages. Nevertheless, the sample frame differs for statistics characterizing 1967 to 2002 and those for 2006 and 2015. We report average outcomes for adult men and women in each year. In addition to the quantitative field surveys and descriptive studies, the analysis was complemented by direct observations during the field data collection by the coordinator of the field team (P.M.M.).
Social and Economic Changes Over 50 Years
Demographics
From the time of the original intervention in 1969 until present, the population in each of the villages has more than doubled in size, as did the population of the country. 9 According to the Ministry of Health (MoH), population growth in the department of El Progreso was approximately 4.5%. According to the National Statistics Institute (INE), growth in the municipality of Sanarate was approximately 3.5% but lower than in El Jícaro (2.2%). 16,17 Santo Domingo, the village closest to the capital, tripled in size. For comparison, national population growth over the period averaged 2.0% per annum. 8 From 1975 to 2002, the population growth rate by village was 3.3% in Santo Domingo, 2.6% in Conacaste, 2.5% in Espíritu Santo, and 2.5% in San Juan. 13
Roads and Transportation Infrastructure
In the late 1960s, all the villages were connected to the nearest highway or town by dirt access roads of varying quality. Over time, these were replaced with all-weather roads, and hence, easier access to the Atlantic coast highway and to Guatemala City eventually benefited all the villages. In the 1990s, direct bus service from the villages to Guatemala City began. Additionally, residents could catch increasingly frequent buses traveling up and down the Atlantic Coast highway to and from Guatemala City. By 2002, all the villages also had paved at least their main village streets and installed roadside sewage systems. Road improvements led to improved access to market towns, regional centers, and Guatemala City. Indeed, many residents of Santo Domingo now even run their errands in Guatemala City rather than any of the closer large towns, often taking advantage of lower prices. Both the development of roads and advances in transportation and mobility came later to the relatively small and remote San Juan than to the other 3 villages. 12
Health Services
The INCAP project founded the first local health clinics in the 4 villages. Prior to that, villagers treated ailments with home remedies, visited healers, or walked to the nearest health post in their municipal capital. 3 With the exception of Espíritu Santo, where residents had access to (low-quality) governmental health services in nearby El Jícaro, the level of infant mortality was high, especially from vaccine-preventable diseases such as tetanus. 12 With the new clinics, both the supply and demand for health-care services increased dramatically in the 4 villages. 12
When the project closed in 1997, the INCAP-run health clinics were handed over to the government, with the MoH sending nurse aids. The level of the care provided, however, was inferior. Nurse aids were not as skilled as the INCAP physicians and nurses, no transportation to hospitals was provided, and medicines were either unavailable or expensive. In the early 1980s, MoH built rural health posts in 3 of the 4 villages, although in all villages they encountered similar problems: lack of maintenance, old equipment, and inadequate medication. 12
Currently, all health posts provide birth control, prenatal checkups and supplements, and immunizations. They do not, however, provide other primary care services; for those, residents turn to other providers such as local traditional birth attendants and healers, or they go to more distant health clinics. Villagers also occasionally use private physicians and clinics. In this way, proximity to municipal and departmental capitals, and to Guatemala City, combined with the mobility provided by transportation services, influences the type of health care available to villagers. 12
Education
Schooling availability
Public primary schools have been available in all 4 of the villages since the 1960s, although at that time none had running water or electricity. Secondary schools, however, were available only in the municipal and departmental capitals, and Guatemala City, and not in rural areas. School availability and correspondingly educational outcomes have grown substantially in Guatemala over the last 50 years, a trend mirrored in the villages as well. 18
For example, there were a variety of improvements and expansions to the primary schools made throughout the decades, both by governmental and by nongovernmental entities. 12,13 Moreover, basic secondary education became available within or very near the 4 villages. In 1997, San Juan was the first of the villages to establish its own basic secondary school. Conacaste, Santo Domingo, and Espíritu Santo have telesecondary schools (which consist of at least one teacher with equipment and material support including a television set, video player, and videotapes on different subjects) that offer basic secondary education and were established in the late 1990s. Espíritu Santo has had a nearby secondary school in El Jícaro since the time of the original intervention. 12 Currently, educational services and their quality are similar in the 4 study communities. All have access to primary education, adequate school infrastructure, and adequate staff. All can access the 3 basic secondary grades within or very close to their village. Nevertheless, access to the more formal academic diversified studies is still limited, which is why some parents choose to send their children to study outside the community because they consider the local options inferior. 12
Grades attained and literacy
Tables 2 and 3 present average grade attainment and literacy rates over time for adult men and women. For Guatemala as a whole, schooling availability and education have increased tremendously over the last 50 years. For example, in 1970, 31% of children completed primary school; in 2017, nearly 80% did. 8 Consistent with those national increases, average number of grades passed in the villages has increased substantially in this period. Starting with most people completing fewer than 2 grades of schooling, by 2015, years of schooling had more than tripled for both men and women. Despite these overall increases, women still have about 1 less year completed than men. Average schooling remains higher in Espíritu Santo, which has maintained its primacy on this measure over the years. The fact that Espíritu Santo is close to its respective municipality has made secondary education a viable option since the 1960s, partly explaining the difference. 13
Average Schooling (Number of Grades Passed) by Census and by Village.a
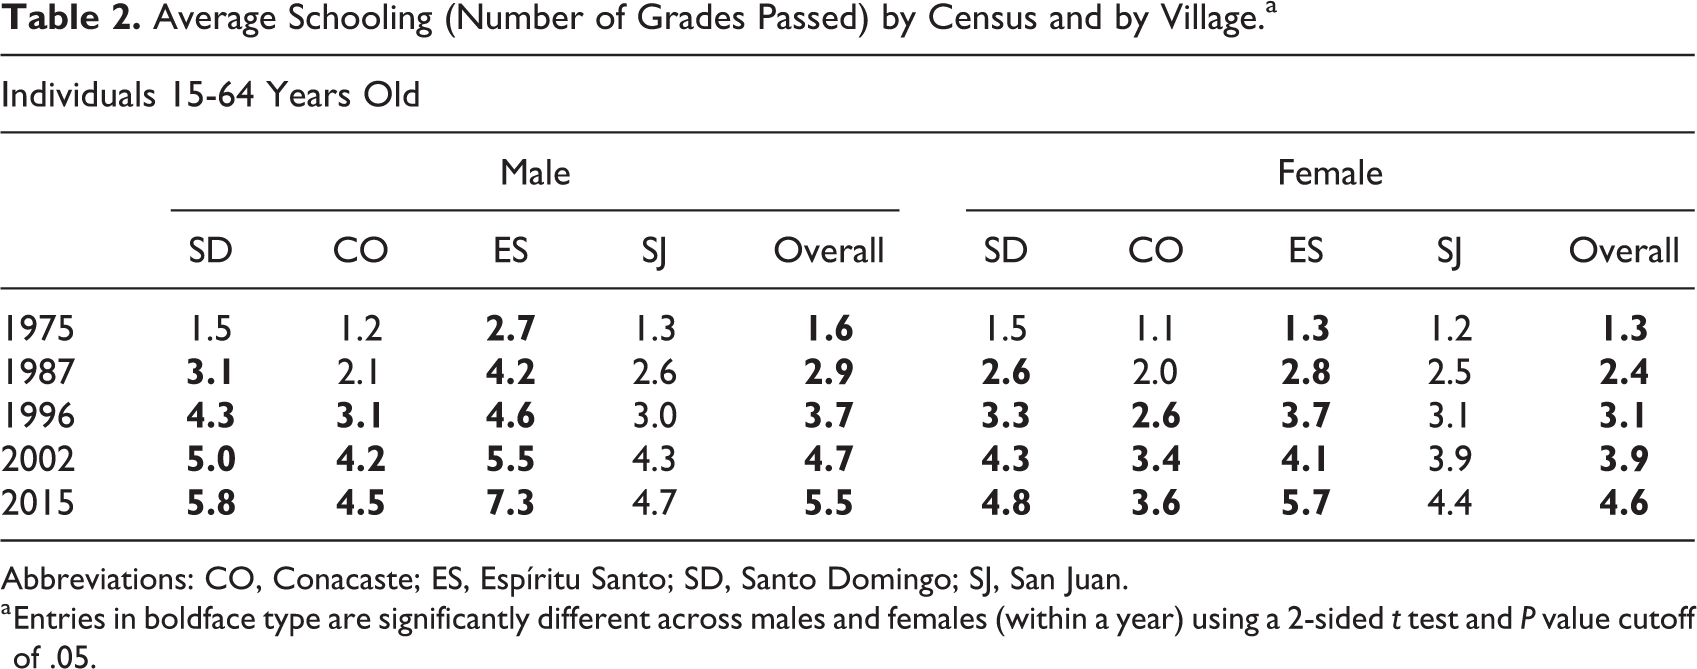
Abbreviations: CO, Conacaste; ES, Espíritu Santo; SD, Santo Domingo; SJ, San Juan.
a Entries in boldface type are significantly different across males and females (within a year) using a 2-sided t test and P value cutoff of .05.
Literacy Rates for Participants Aged 15 Years and Older by Sex (%).a
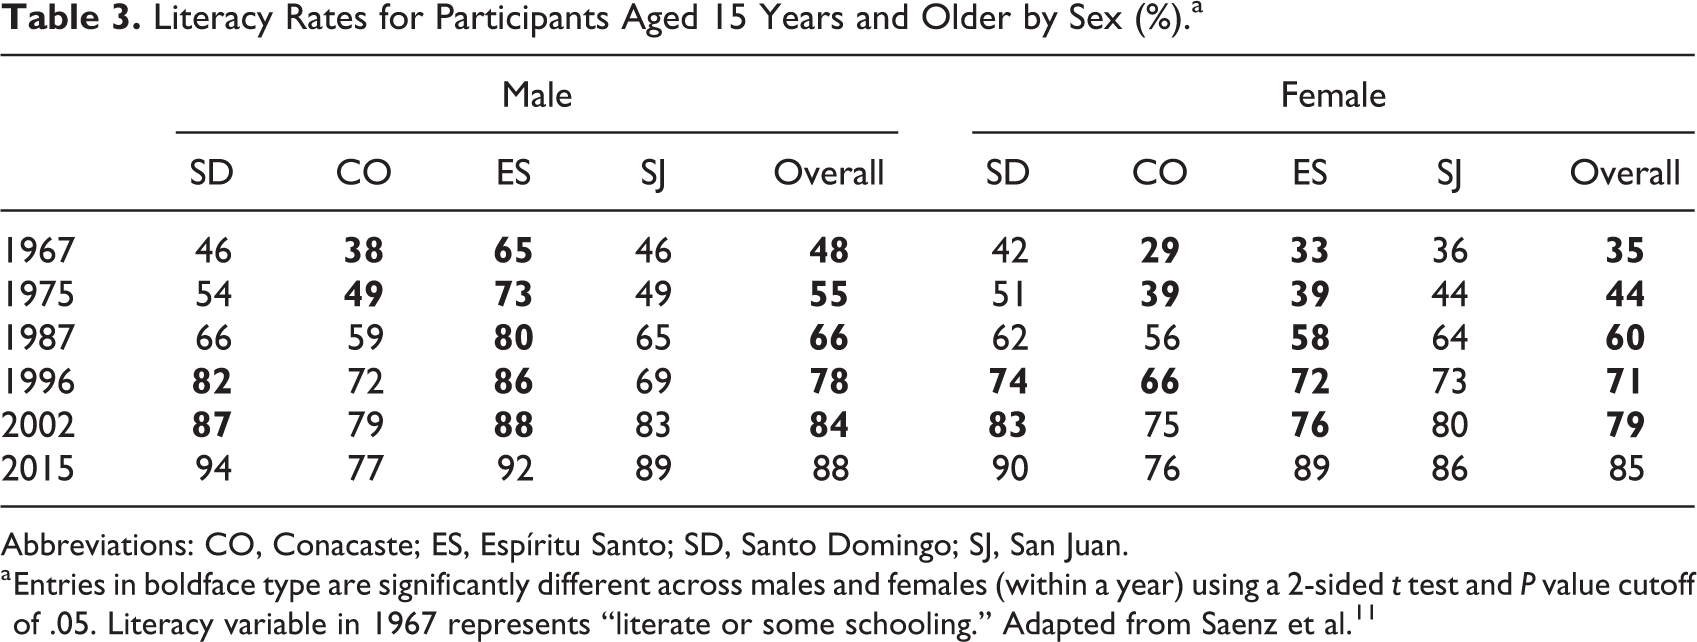
Abbreviations: CO, Conacaste; ES, Espíritu Santo; SD, Santo Domingo; SJ, San Juan.
a Entries in boldface type are significantly different across males and females (within a year) using a 2-sided t test and P value cutoff of .05. Literacy variable in 1967 represents “literate or some schooling.” Adapted from Saenz et al. 11
From 1960 to 1985, virtually every national government had promoted literacy campaigns and literacy programs for adults through the founding of the National Committee for Literacy (CONALFA) that trains local residents to teach literacy to the local population and gain primary school accreditation. These efforts, alongside the general increases in schooling described earlier, have contributed to substantial improvements in literacy rates. Table 3 shows self-reported literacy rates over time across all the 4 villages. With increased schooling availability and completed years of schooling has come increased literacy. In 1967, average literacy in the villages was fairly similar, except for men in Espíritu Santo who were the most literate. Between then and 2015, literacy rates for individuals aged 15 years and older improved tremendously, although the rate of increase has declined over time. Men’s literacy increased from 48% in 1967 to 88% in 2015, and women’s rates more than doubled over the period, reaching 85% and near parity with men. The increases over time also led to far more equal rates across the villages in 2015, although they are still modestly different. For the more recent cohorts aged 10 to 19 years, however, literacy rates for men and women in all villages are above 90%, indicating nearly universal literacy for the youngest generation (not shown). These figures are on par with national averages. 8
Occupations and livelihoods
The last 50 years have also seen massive changes in the occupations of village residents, and nonagricultural employment largely has displaced agricultural employment. As in other parts of El Progreso, until the 1980s, subsistence agriculture was the most important component of livelihood strategies in these villages, 2 although this was often combined with small-scale commodity production or wage labor in the agricultural or nonagricultural sectors. 10 In the late 1980s, all 4 villages started using improved seeds, mechanical tillage, and agrochemicals. The rising population, however, led to an increasing fragmentation of land holdings and increased land degradation, limiting prospects for subsistence production. Exacerbating these trends were increased costs for agrochemicals and lower availability of “unpaid” family labor (due to higher schooling and increased commuting or migration for salaried work). During the 1990s, tourism, service, and maquila (foreign-owned factories in which imported parts are assembled into products for export, in particular textiles) sectors all grew, creating new opportunities for employment in the nonagricultural sector. 19 As a result of these trends, the importance of agriculture has diminished over time. Unsurprisingly, patterns were different for men and women so that in what follows, we use information from the various surveys to characterize occupational change over the period in each sex separately.
Males
In 1967, 97% of men aged 15 to 64 reported a primary occupation working in agriculture, with most (86%) as tenant or (small) land-owning farmers, except in Espíritu Santo where 72% were own account farmers. Agricultural wage employment was also evident to varying degrees in each village. It was highest (around 23% of those working) in Espíritu Santo, where laborers worked on the large cash crop farms on the riverbanks and in the piedmont, an area of land near the riverbanks that had rich soil both for cultivation and for pasture, though not suitable for mechanized farming. In contrast, agricultural wage employment was only 5% to 14% in the other villages. 12,13 By 2002, the dominance of agriculture had waned, and less than half of those reporting a primary occupation were in agriculture. The percentage of those working as agricultural wage laborers remained about the same, and the bulk of the exit was due to decline in tenant and landowner farming, engaging only about one-third of the active labor force in 2002. Although agriculture remains important and still comprises over half the primary employment in Conacaste and Espíritu Santo to the present, both nonagricultural wage labor and nonagricultural self-employment increased in its place. 13
Examining these trends by village reveals that Santo Domingo was the first to make the transition to nonagricultural wage labor, between 1975 and 1987. Santo Domingo was a leader in access to Guatemala City and also benefited from the opening of a major regional employer, Cementos Progreso in 1974. Cementos Progreso was considered a good employer with higher than average wages that provided legal and insurance benefits, savings accounts, school bonuses and scholarships, and medical coverage. Conacaste made this transition between 1987 and 1996, as once important vegetable markets declined and more vegetable cooperative members left farming; they either migrated or increasingly became employed at Cementos Progreso. San Juan made its main transition to nonagricultural wage work by 2002, in parallel with the increased access to the village.
Espíritu Santo was last to transition due to its more isolated location and the feature that it was the only village with a distinctive form of self-employment for which it is well known, the elaboration of artisan palm products. Palm weaving has been an important source of income since the 1960s, when approximately two-thirds of households in Espíritu Santo participated. 13
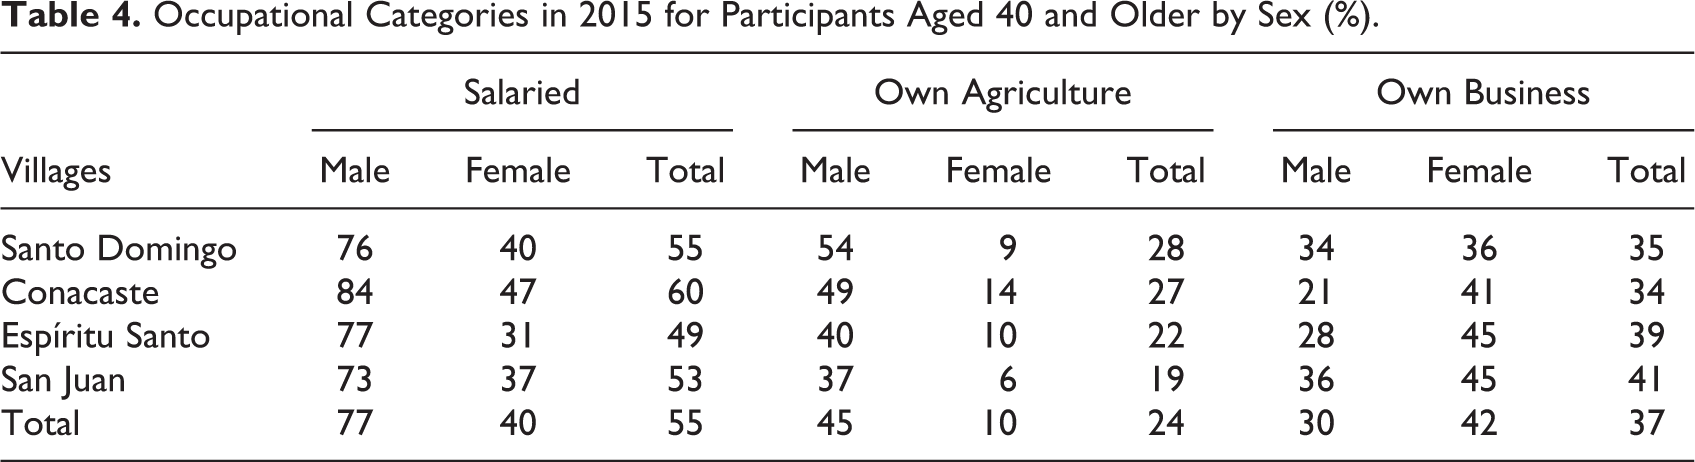
Table 4 presents the most recent updates of occupational categories in 2015 for the sample of original participants living in or near the study villages. (Data for the previous years are presented by Maluccio et al 13 and not reproduced here due to space limitations.) By that point, the large majority (between 73% and 84%) of men were in wage work. At the same time, own agricultural production remained important for men, with between 45% overall working in that sector (indicating substantial overlap). Additionally, about a third participated in nonagricultural nonwage occupations. These patterns (which sum to more than 100%) make clear that many men combine different activities in putting together their livelihoods.
Females
In 1967, only 13% of women aged 15 to 64 years reported a primary occupation other than domestic duties, usually in nonagriculture. 13 By 1975, women’s participation in the labor market was substantially higher in all villages, averaging 32%. From 1975 to 2002, women aged 15 to 64 years living in all villages except Espíritu Santo increased labor market participation, especially in the nonagricultural sector, both wage and nonwage. Women in Espíritu Santo, who predominantly worked in the elaboration of artisan palm products, experienced the opposite trend, however, with 75% reporting a primary occupation in 1975 but only 43% doing so in 2002. 13 The most recent updates in 2015 (Table 4) show that nonagricultural wage activities for women reached 40%, while agricultural activities were 10% and own business 42%, indicating that women have continued to become more involved in labor market activities; for many, this is in addition to their domestic activities.
Occupational Categories in 2015 for Participants Aged 40 and Older by Sex (%).
Housing characteristics
While home ownership was already high in the 1960s, since then substantial improvements have occurred in the quality of housing and provision of services to the villages. For example, in 1967, more than half of the homes were informal ranch-style structures made of local materials. In 1967, over 40% of families cooked in the same room where they slept, and over half of families cooked in make-shift kitchens away from their home; in 2002, only 6% of families continued to share their bedroom with the kitchen. Rooms per resident also increased, from about 0.5 in the 1960s to nearly 1.0 in 2002; however, this number declined slightly to 0.8 in 2015.
When services such as electricity or in-house piped water were introduced to the villages, not all within a village were able to access them immediately, since access often required some corresponding household-level investment. For example, the only community where electricity had been introduced by 1975 was Espíritu Santo. By 1987, electricity was available in all 4 villages, although the percentage of families with service continued to rise through 2002. 13 Virtually nonexistent in the villages when the INCAP Longitudinal Study began in 1967, electricity service was universal by 2005 (Table 5). The same evolution occurred for in-house piped water. Conacaste and Espíritu Santo were the only 2 villages with piped water in homes in 1987, but the percentage of families with water increased since then, plateauing in 2002 and beyond at approximately 90%.
Tenure and Housing Characteristics in the 4 Villages.a
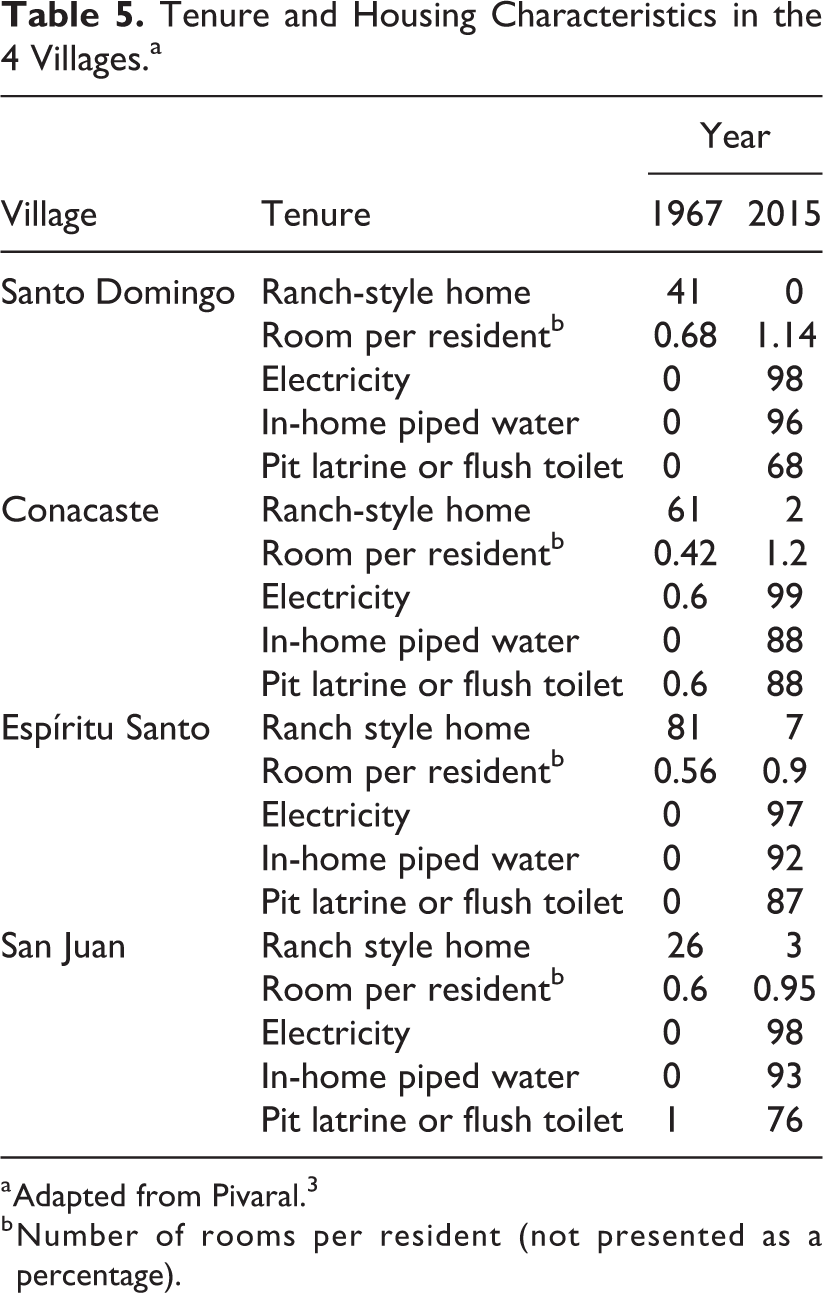
a Adapted from Pivaral. 3
b Number of rooms per resident (not presented as a percentage).
A final important service includes the prevalence of pit latrines or flush toilets. There was little variation across villages or over the years through 1975, with the large majority of families having no access. Availability dramatically increased after that in all villages, particularly in Conacaste which rose to 91% by 2002. Coverage continued to increase after that in Espíritu Santo but remained broadly constant in the other villages through 2015. Selected data are summarized in Table 5. 13
In addition to improvements in housing characteristics, asset ownership in the villages has increased dramatically over time, with only relatively small differences in timing across the villages. Television ownership went from 61% in 1996 to over 90% in 2015, a trend following the increased availability of electricity. An even more dramatic increase is observed in refrigerator ownership, from 14% to 72% over the same period. Finally, from a mere 3% in 1996, now nearly one-third own a motorcycle or car across all 4 villages.
Conclusions
Since the start of the INCAP Longitudinal Study (1969-1977), the 4 original study villages, like their home country, have undergone massive demographic, social, and economic change. Many of these changes have been conditioned by initial differences, particularly those associated with agricultural potential and location. Originally rather isolated, road and transportation access for the villages has improved steadily and substantially. The populations in the villages have more than doubled and aged. Schooling access and outcomes have also improved substantially, with average grades of schooling tripling and literacy doubling to levels currently on par with national averages. However, a substantial schooling gap between men and women persists.
Occupations also have changed over the course of a generation. Early on, subsistence farming and agriculture in general were dominant. While these activities remain important components of individual livelihood strategies, they are now much less common. Much of this change is associated with declining agricultural markets and increased access to nonagricultural jobs near the villages and in Guatemala City. A related phenomenon not explicitly covered in this article has been outmigration (both domestically and internationally), which for a subset of resident households has meant remittance flows used for making home improvements or starting small businesses. With all these changes have come improvements in living standards as measured by indicators of household living conditions. It is within this dynamic context that study participants for the INCAP Longitudinal Study were born and raised and where most now live as adults.
Footnotes
Declaration of Conflicting Interests
The author(s) declared no potential conflicts of interest with respect to the research, authorship, and/or publication of this article.
Funding
The author(s) disclosed receipt of the following financial support for the research, authorship, and/or publication of this article: The Institute of Nutrition of Central America and Panama (INCAP) and Emory University provided funds for the publication of this supplement.