
Abstract
Background:
Increasing obesity rates are related to energy intake with carbohydrate and fat ratio. Using Korean National Health and Nutrition Examination Survey 2007-2017 data, we examined the hypothesis that the fat intake and food sources of dietary fats had changed over the last 10 years according to gender and obesity status in adult population ≥19 years.
Methods:
The food intake of each participant was collected by the 24-hour recall method, and nutrient intake including different fatty acids was calculated. The fatty acid intakes from 7 food groups were determined according to gender and obesity status.
Results:
Body mass index increased in both genders of the obese group over the decade, but it decreased in the normal-weight group. In men, energy intake was higher in the obese group than in the lean group, but the opposite trend was shown in women. Total fat intake including various fatty acids continuously and sharply increased in both men and women until 2016, then slightly declined only in men. The source of saturated fatty acid (SFA) intake was mainly from the animal food group in men and women regardless of obese status, and SFA and monounsaturated fatty acid from the animal food group gradually increased over time in both genders. N-3 fatty acid intake markedly decreased from fish and crabs and increased from sauces and nuts regardless of genders and the obese status from 2008 to 2017. Polyunsaturated fatty acid and N-6 fatty acid intake increased from bread, cookies, sauces, and nuts regardless of genders and obesity status.
Conclusion:
Fat intake was higher in obese men, but this was opposite in women. The N-3 fatty acid intake from seafood should increase, and the fat composition in sauce needs to be modulated to increase N-3 fatty acids.
Introduction
Obesity is a worldwide epidemic. Obesity has a positive association with mortality, and it is an important factor for various metabolic diseases. 1 It is caused by the long-term imbalance of energy intake and energy expenditure, which is influenced by a complex relationship involving genes, diet, and exercise. High-fat intake, particularly of saturated fatty acids (SFAs), has been shown to increase the prevalence of obesity; 2 however, this remains controversial. A 10% reduction in dietary fat leads to a weight loss of 4 to 5kg in persons with 30 kg/m2 of body mass index (BMI) who have consumed a high-fat diet. 2 By contrast, Asians, including Koreans, have higher BMI and waist circumferences with very high carbohydrate intake of about 70 energy percent and a very low fat intake with less than 15 energy percent, according to the Korean National Health and Nutrition Examination Survey (KNHANES). 3,4 Very low fat intake induces metabolic syndrome despite the daily energy intake being lower by 500 kcal. 4 In addition, the results of a randomized controlled study showed that low-carbohydrate diets lead to more weight loss in participants with insulin resistance, whereas high-carbohydrate diets lead to higher weight loss in participants with insulin sensitivity. 5 Meanwhile, low-carbohydrate diets have shown similar weight loss as high-carbohydrate diets with a low glycemic index. 6 Therefore, weight loss may involve not only the amount of fat but also the types of dietary fat in daily intake.
After adjusting for gender and age, the prevalence of metabolic syndrome has been decreasing in Koreans, specifically by 4.4%, 2.1%, and 1.1% from 1998 to 2001, from 2001 to 2007, and from 2008 to 2012, respectively, from KNHANES. 7 This might be associated with nutrient intake, especially fat intake. Fat intake in the Korean population has gradually increased, remaining at about 20.5% of total energy intake at 2012, reported from previous KNHANES study. 8 The ratio of saturated, monounsaturated, and polyunsaturated fatty acids (PUFAs) may be also changed, but the changes in the ratio and food sources of fat intake have yet to be studied.
Longitudinal observations show changes in fat intake and foods of fat sources, 9 and these results may provide insight into recommended dietary fat amount and fat types. However, the fatty acid composition of foods has yet to be assessed, along with the number of fatty acids and food sources of fatty acids. Recently, the fatty acid composition of foods in Korea was assessed, and the coverage of fatty acid composition was found to be sufficiently high (about 93%) to retrospectively study the food sources of fatty acid in the Korean population. 3,4 Food sources of dietary fat differ according to the socioeconomic parameters such as gender and age. Ericson et al demonstrated that the specific food sources of fat can help clarify the inconsistent role of dietary fat intake for type 2 diabetes risk. 10 However, no studies have been conducted to determine the changes in food sources of total fat or of saturated, monounsaturated, and polyunsaturated fat and food sources of fatty acids in Korea. In particular, age and gender are important factors of food sources. Since fat amount itself may not be a crucial factor, the food source of dietary fat may influence obesity. Thus, food sources of fat intake should be investigated according to varying age, gender, and obesity. The present study hypothesized that the fat intake and food sources of dietary fat have changed over the last 10 years according to gender and obesity in adults ≥19 years. We examined the hypothesis using data from the KNHANES IV to VII (2007-2016), a large South Korean population study with a stratified, multistage, probability sampling design.
Methods
Design and Data Collection
This study used data from the KNHANES IV-VII of 2007 to 2017. These surveys were conducted annually using a rolling sample design that employs a complex, stratified, multistage probability cluster analysis of a representative sample of the noninstitutionalized civilian population in South Korea. Thus, the KNHANES is considered to be a large representative population study with rigorous quality controls. The 2007 to 2017 surveys were conducted across all 4 seasons, and seasons were considered in sample weights. These surveys were performed by the Korean Centers for Disease Control and Prevention as well as by the Korean Ministry of Health and Welfare, and they have 3 components: a health interview, a health examination, and a nutrition survey. This survey was approved by the institutional review board of the Korean Centers for Disease Control and Prevention (approval numbers: 2007-02CON-04-P, 2008-04EXP-01-C, 2010-02CON-21-C, 2011-02CON-06-C, 2013-07CON-03-4C, 2009-01CON-03-2C, 2012-01EXP-01-2C, 2013-12EXP-03-5C).
The sample weights were developed by the Korean Centers for Disease Control and Prevention, and they were used to compensate for selection methods, sampling frames, and nonresponse rates. Since the data were analyzed with weights, the results can estimate the representative nature of the noninstitutionalized civilian Korean population. 4
Detailed information on the design of the survey was provided in a previous study. 3 The survey had 3 parts: a health interview survey, a health examination survey, and a nutrition survey. The data analysis of the KNHANES was restricted to participants ≥20 years who completed the nutrition survey and the health examination survey. Table 1 shows the number of participants in each obesity group each year. The total number of participants was 57 149, and the numbers of participants in the low body weight, normal body weight, and obesity groups were 2 530 36 069 and 18 550, respectively.
Mean of Body Mass Index According to Sex, Obesity, and Year in Representative Adult Population (KNHANES 2007-2017).a
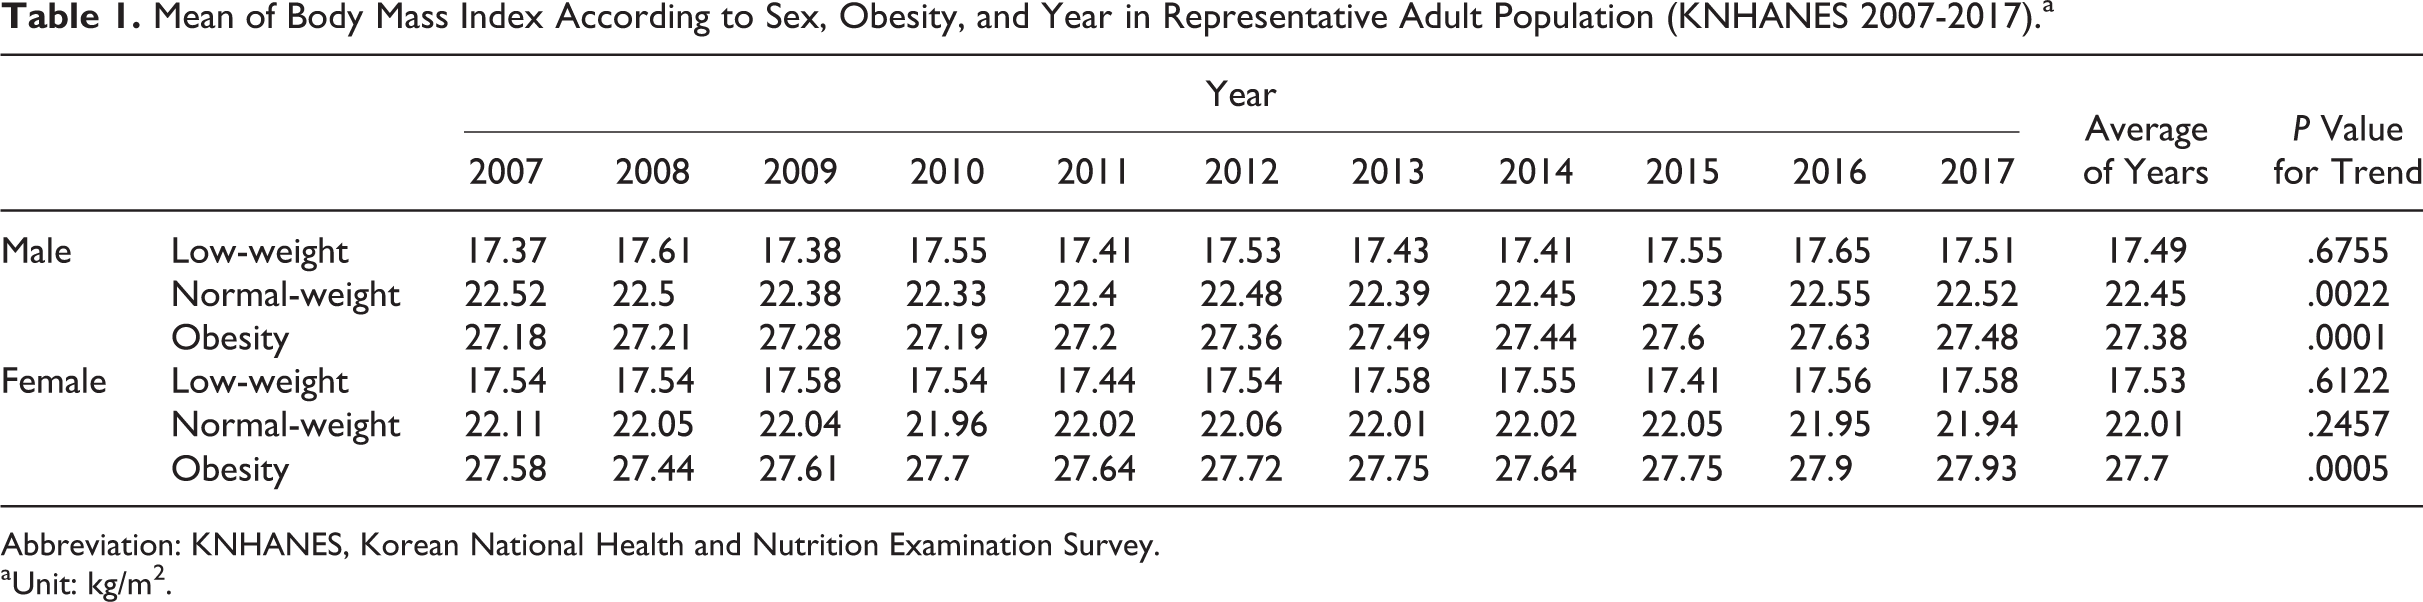
Abbreviation: KNHANES, Korean National Health and Nutrition Examination Survey.
a Unit: kg/m2.
Height and weight were measured in the participants while they were wearing light clothing and no shoes. Body mass index was calculated as body weight in kilograms divided by the square of height in meters (kg/m2). Obesity status was divided into 3 groups according to the Asian obesity definition recommended by the International Obesity Task Force and the World Health Organization (WHO) Regional Office for the Western Pacific Region 11 : lean (BMI < 18.5), normal (18.5 ≤ BMI < 25), or obese (BMI ≥ 25).
Assessment of Nutrient Intake and Food Groups
Daily nutrient intake was estimated using the 24-hour recall method that was conducted through in-person interviews by trained dietary staff in mobile examination centers with asking participants to recall the food kinds and amounts that they had consumed from midnight to midnight (the past 24 hours). Daily intakes of calories and nutrients were calculated from the food intake information acquired from the interviews using the Can-Pro 2.0 nutrient intake assessment software developed by the Korean Nutrition Society. The daily consumptions of saturated, monounsaturated, and PUFAs were additionally estimated from the 24-hour recall data by adding the data from the fatty acid composition of food tables into the nutrient data. 3
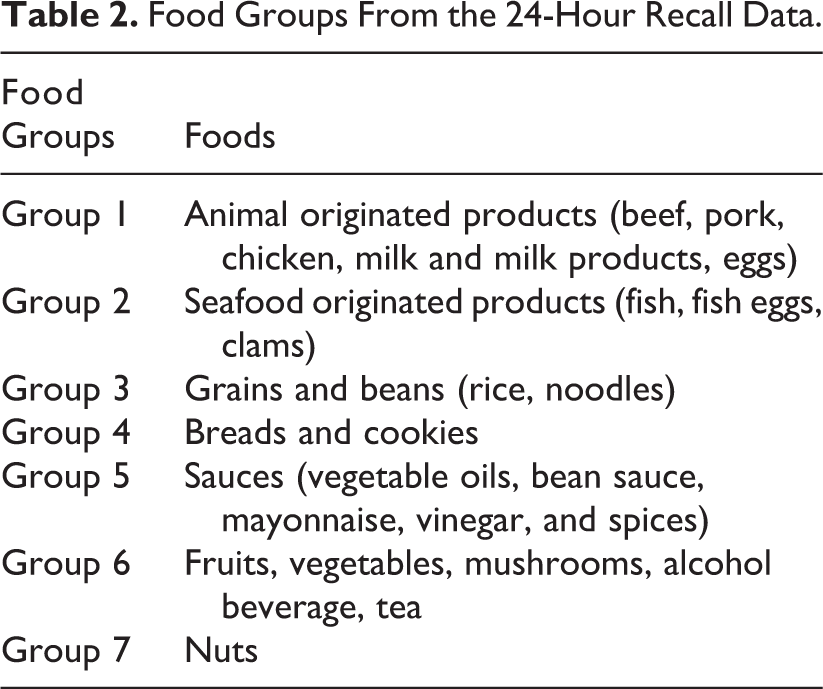
The food groups were categorized from 24-hour recall data and they were divided into 7 groups based on the major components of fatty acids in the foods, as follows: group 1 contained mainly SFAs from animal foods. Group 2 included seafood and food rich in N-3 fatty acid. Groups 3 and 4 included grains and beans and bread and cookies, respectively. Group 5 included sauces such as vegetable oils, bean sauce, mayonnaise, vinegar, and spices and they included mainly monounsaturated and PUFAs (Table 2). Group 6 contained fruits, vegetables, alcohol, and beverages, and group 7 included nuts. Since alcohol is made of grain or fruits and alcohol beverage does not contain fatty acids, alcohol beverage is included in the fruits and vegetable group (group 6).
Food Groups From the 24-Hour Recall Data.
Statistical Analysis
Statistical analyses were performed using SAS software (version 9.4; SAS Institute, Cary, North Carolina) and SUDAAN (Release 11.0; Research Triangle Institute, Research Triangle Park, North Carolina), a software package that incorporates sample weights and adjusts analyses for surveys with complex sample designs. The summary table of the study population was prepared using descriptive analysis of SUDAAN software, and crosstab was used for making the distribution of the obesity categories. The graphical data analysis was performed using Proc SGPANEL command of SAS software (SAS 9.4) according to gender, year, and obesity classification.
Results
Changes in BMI
The average percentages of low-weight, normal-weight, and obesity groups were about 2.8%, 56.6%, and 40.6% in men, respectively, and 5.7%, 67.1%, and 27.2% in women, respectively (Figure 1). The obesity prevalence was higher in men than in women. The percentage of the obesity group slightly increased from 2013 in men, but it did not differ in women from 2007 to 2017 with some fluctuation (Figure 1). Average BMI was not changed in the low-weight group from 2007 to 2017 in men and women but average BMI slightly but significantly increased in the obesity group in both men (P < .0001) and women (P = .0005; Table 1). Average BMI of the normal-weight group also increased only in men from 2007 to 2017 (P = .002). The significant trend of BMI changes was shown in the obesity group in both genders and the normal-weight group only in men as time passed (Table 1).
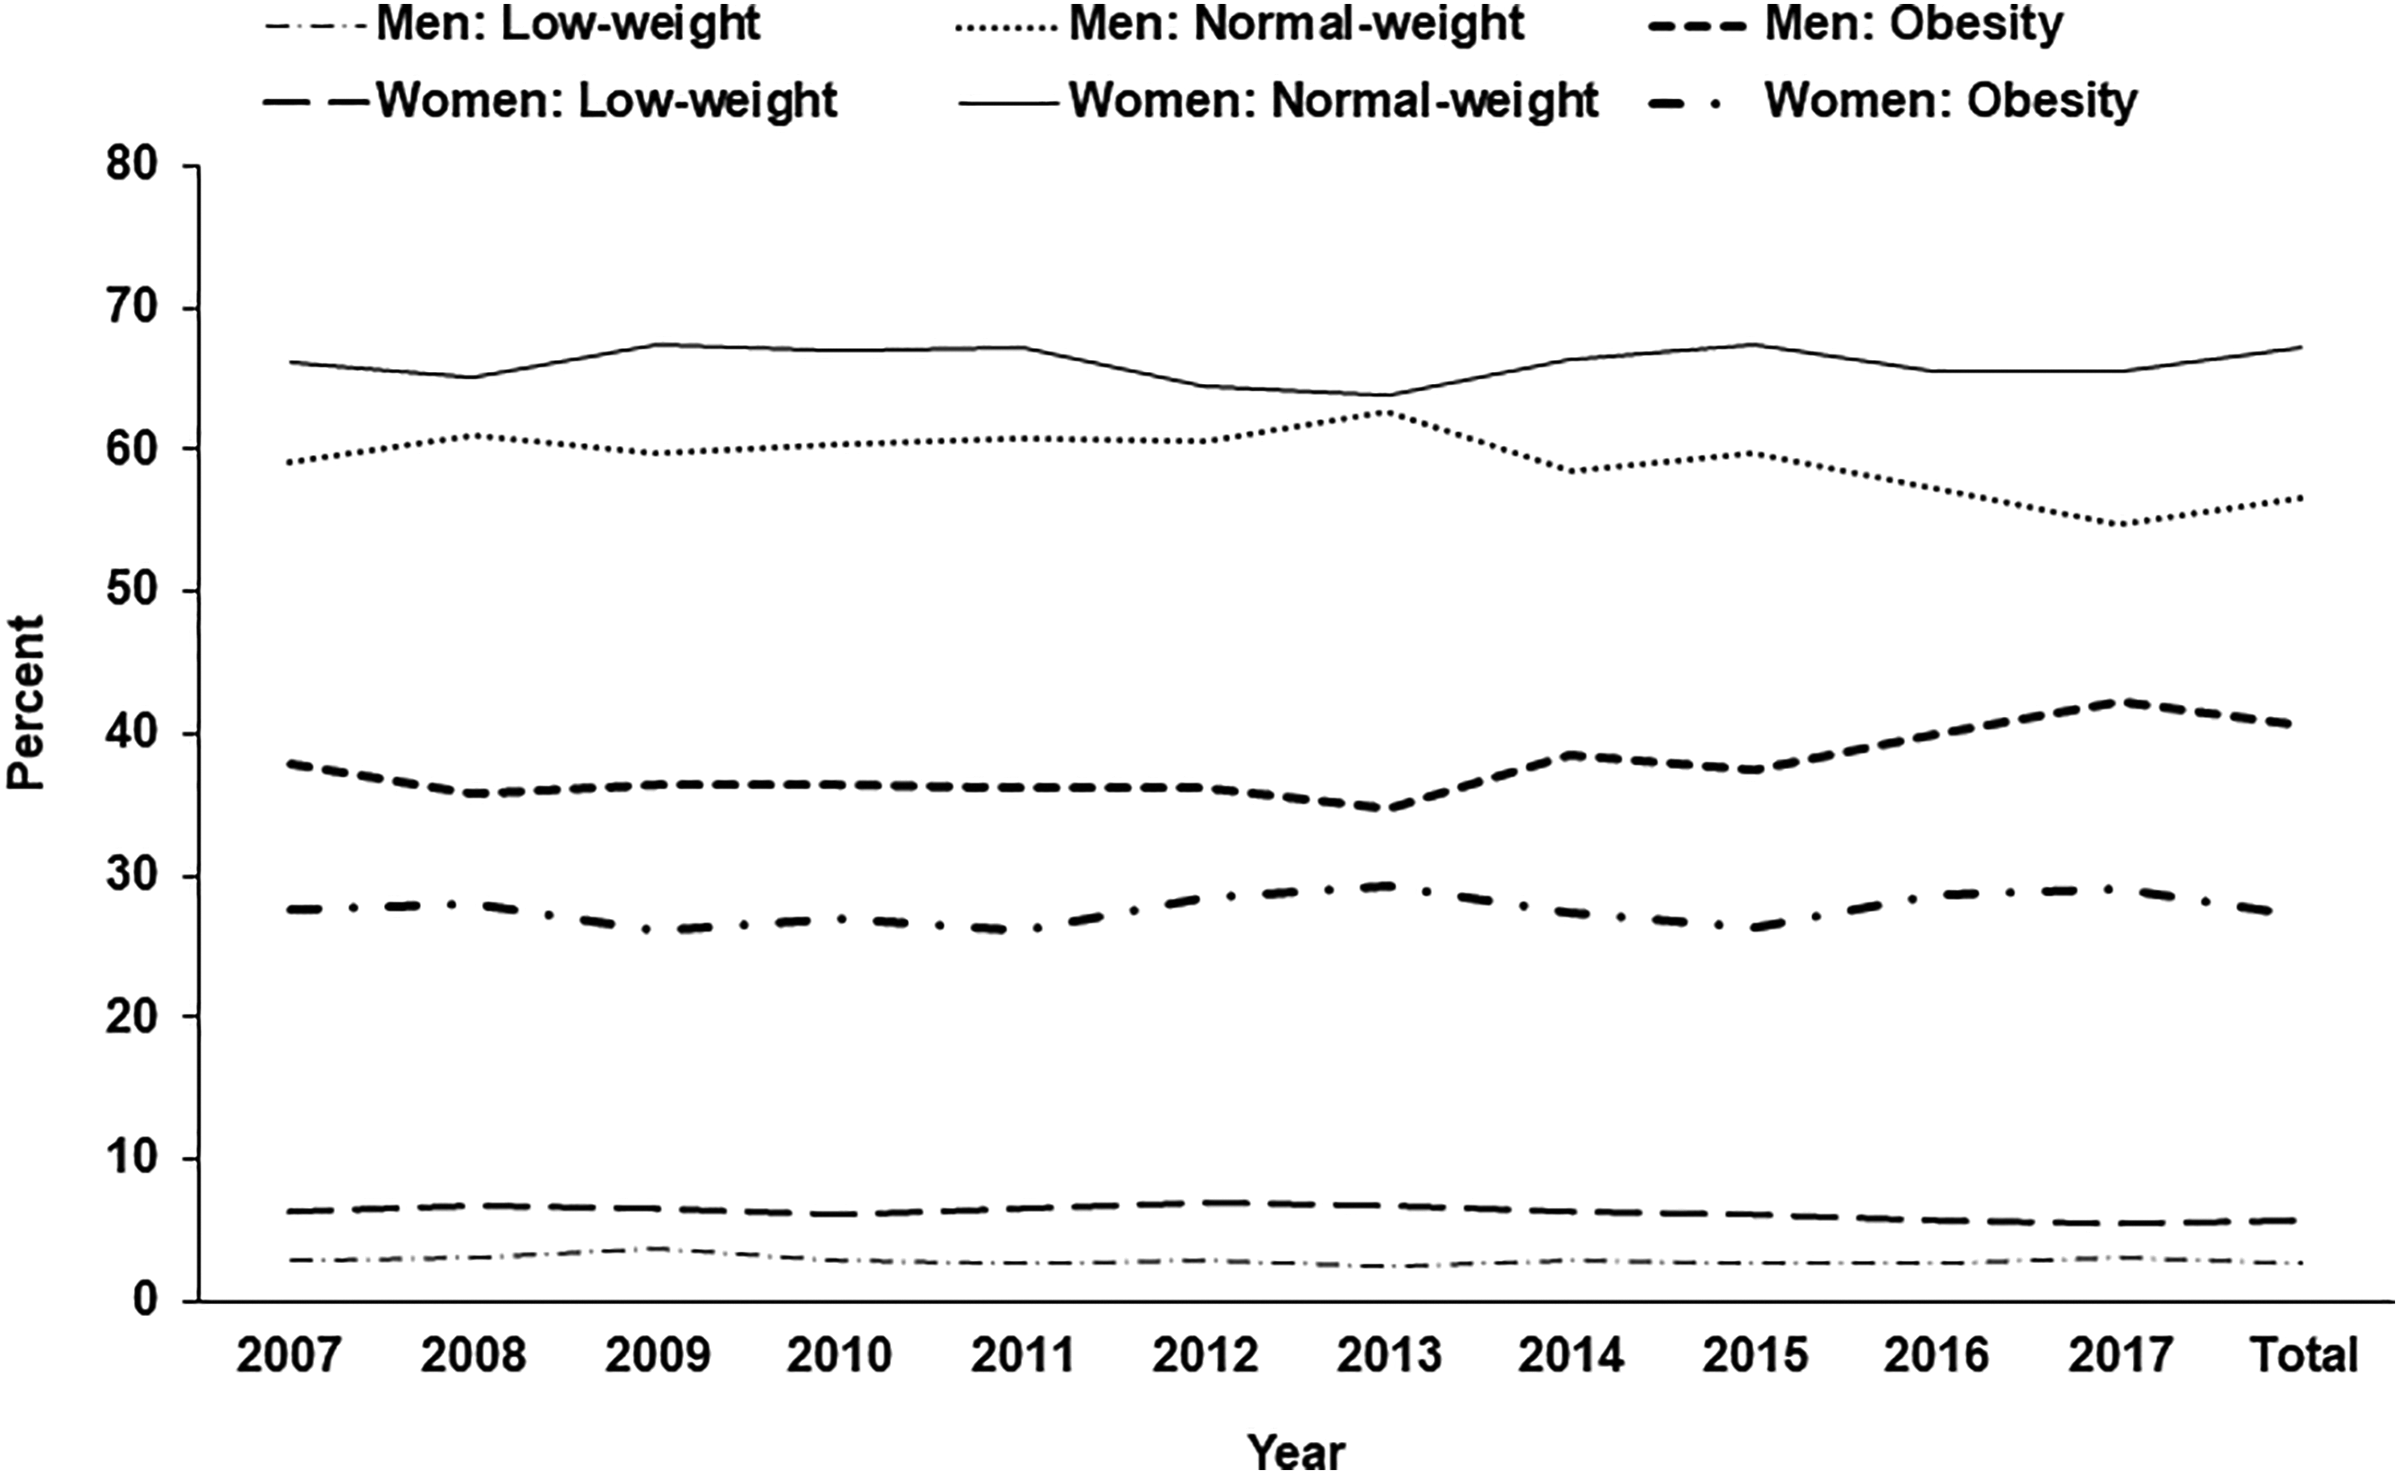
Changes in the percentage of low-weight, normal-weight, and obese adults among all participants according to genders from 2007 to 2017.
Daily Energy Intake
Daily energy intake in the low-weight group was not significantly changed from 2007 to 2017 in men, but it exhibited the increasing trend in women. Daily energy intake was significantly changed in the normal-weight and obesity groups in both men and women (Figure 2A). In men, daily energy intake was higher in the ascending order of low-weight, normal-weight, and obesity. However, the trend of daily energy intake in women was the opposite of that in men; in women, daily energy intake was rather higher in the low-weight group than in the obesity group (Figure 2A).
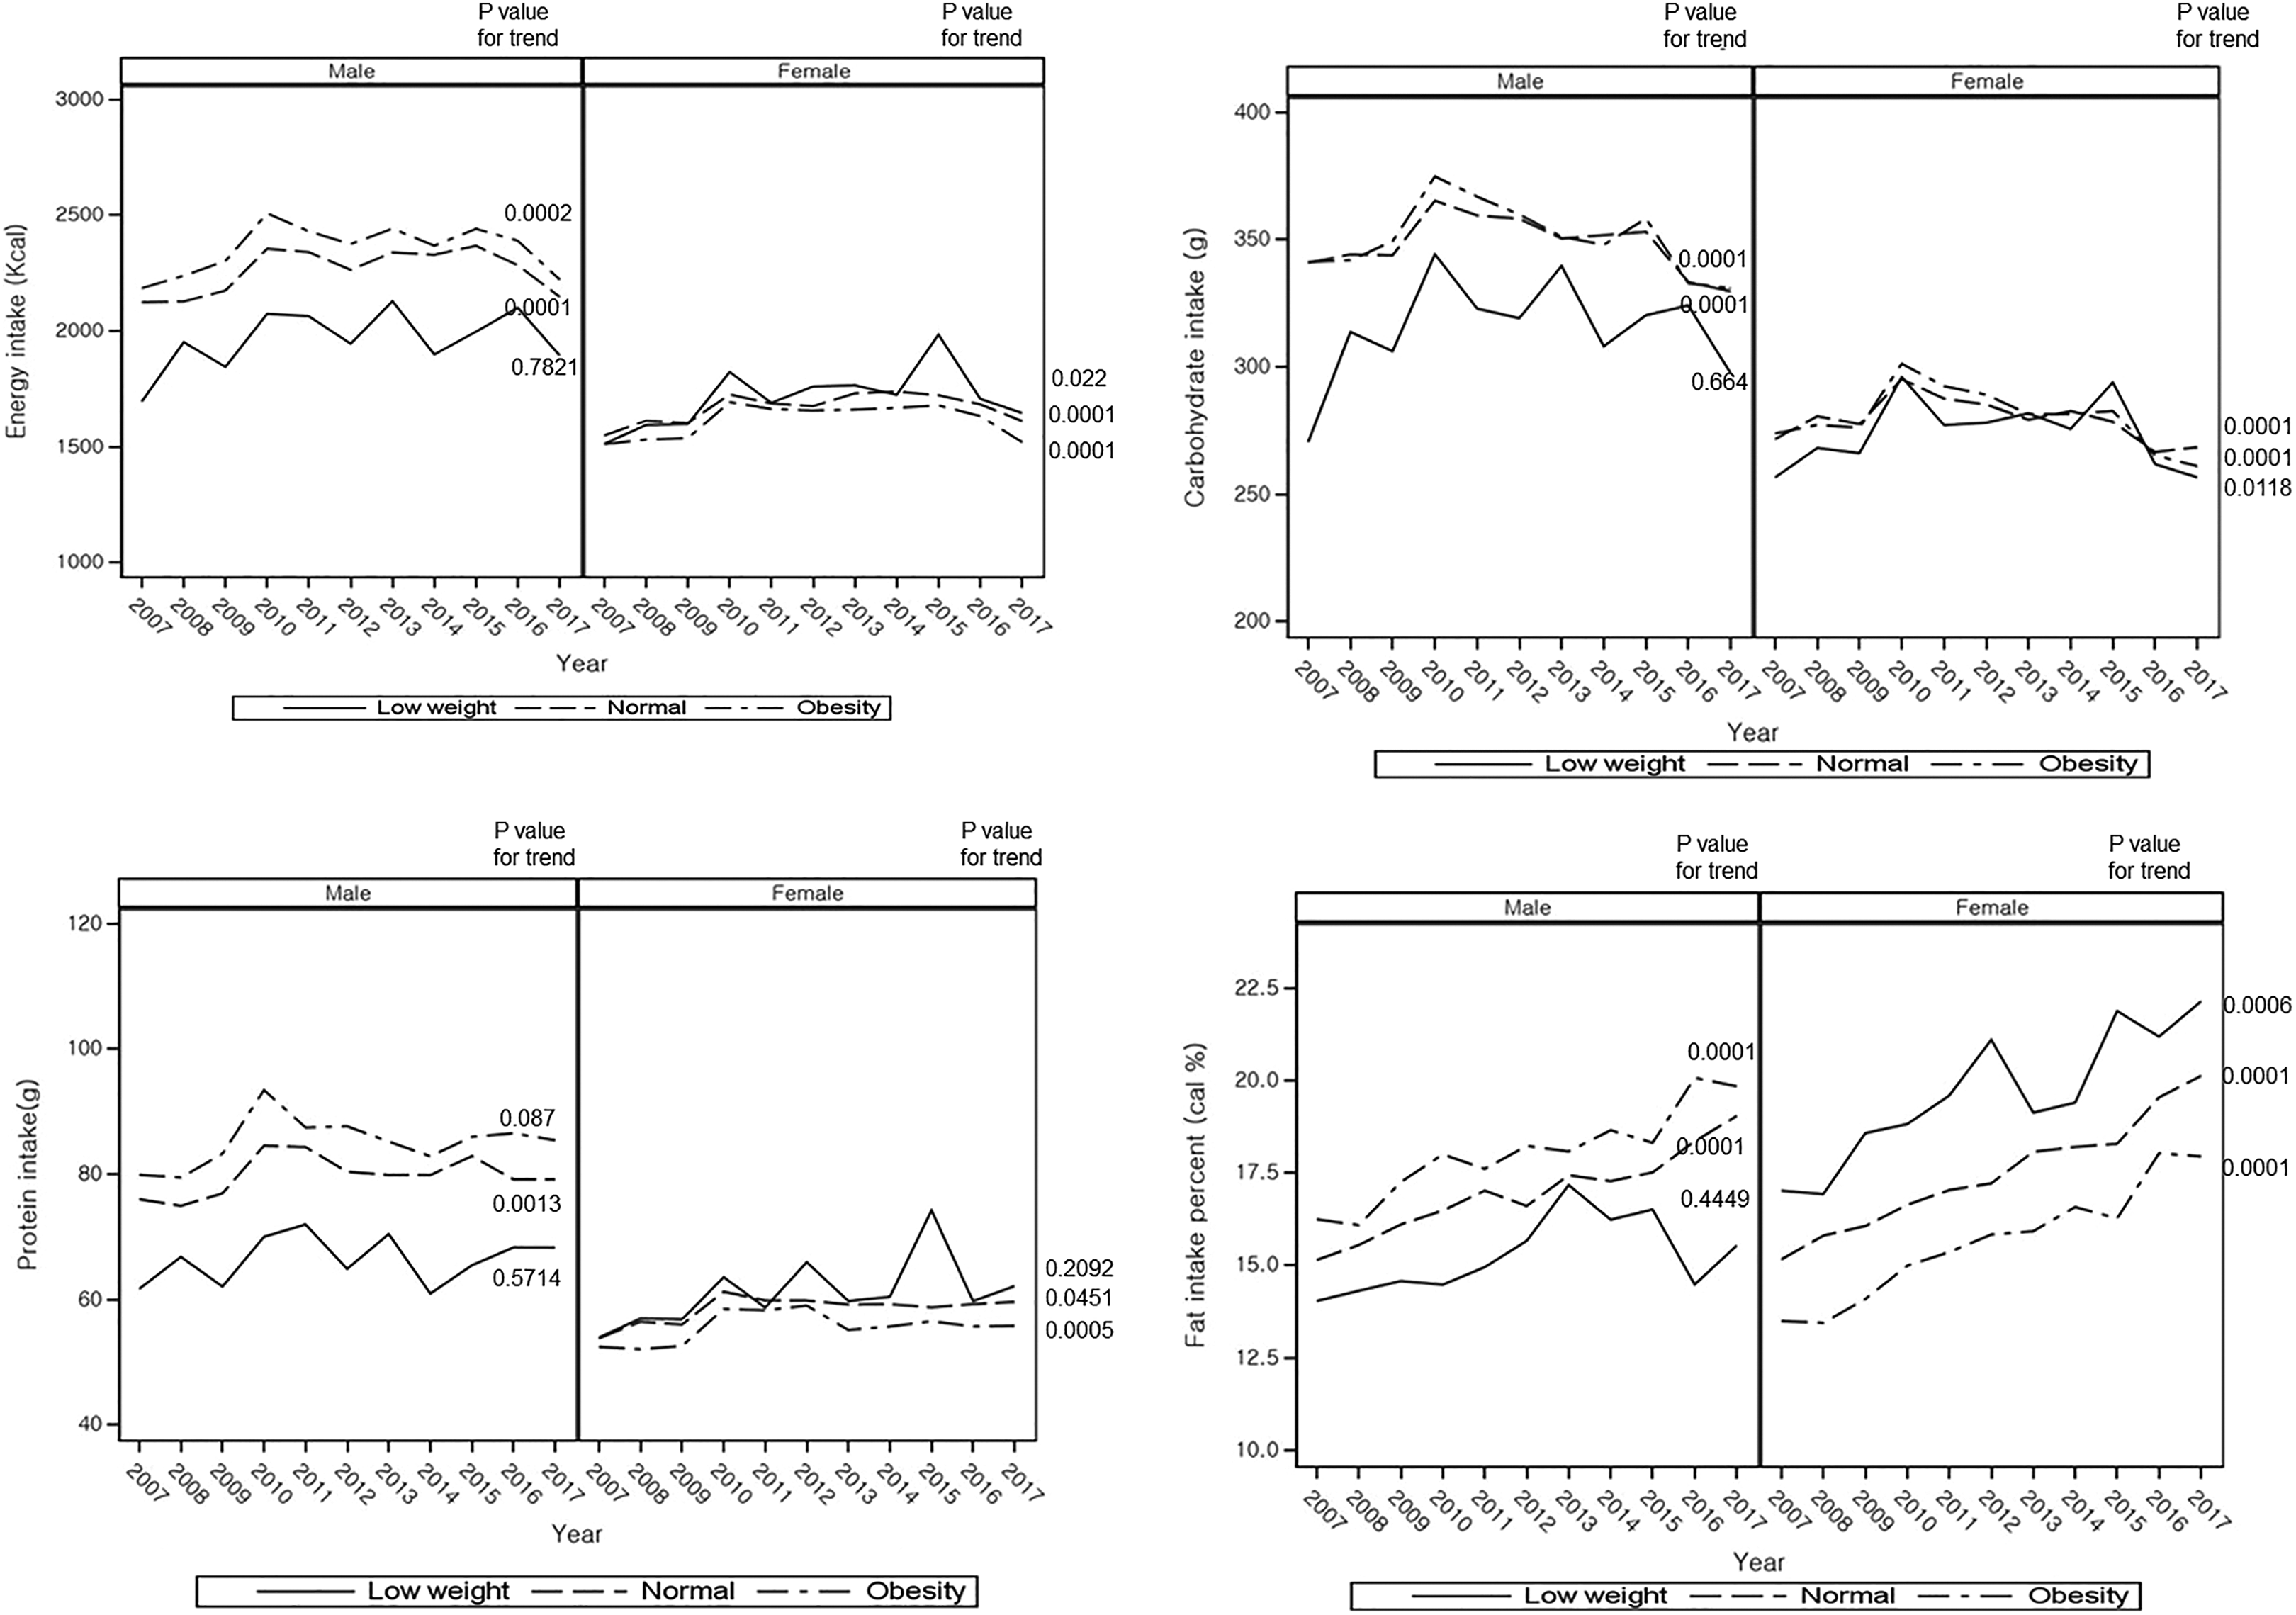
Changes in daily energy and macronutrient intake in low-weight, normal-weight, and obese groups according to genders from 2007 to 2017. Energy intake (kcal/d), carbohydrate intake (g/d), protein intake (g/d), and fat intake (energy %). P value for trend indicated the statistical significance of each parameter from 2007 to 2017.
Carbohydrate and Fat Intake
Carbohydrate intake was much lower in the low-weight group than in the normal-weight and obesity groups in men from 2007 to 2017, but it was not different in women according to the obesity status. Carbohydrate intake was not significantly changed over time in the low-weight group in men (P = .664) but it had decreased in women with big fluctuation (P = .012; Figure 2B). However, the carbohydrate intake decreased in the normal-weight and obese groups of men and women from 2007 to 2017 (P = .0001; Figure 2B). The protein intake exhibited fluctuation in all groups, but it showed a significant increasing trend in the normal-weight and obese groups, but not in the low-weight groups, of men and women (Figure 2C). In women only, protein intake was higher in the low-weight group than the obesity group over the last decade (Figure 2C).
Fat intake was shown to increase over time in both men and women regardless of obesity status (Figure 2D). Fat intake was not significantly different in the low-weight group of men last decade (P =0.449) but it significantly increased in women (P = .0006). Fat intake was higher in the obese group than in the low-weight and normal-weight groups in men, but interestingly, it showed the opposite trend in women, as fat intake was higher in the low-weight group than the high-weight group (Figure 2D).
Fatty Acid Intake from Each Food Group
Total fatty acid intake continuously increased in both men and women over the last 10 years in Korea (Table 3). The increased intake of SFA, monounsaturated fatty acid (MUFA), and PUFA had increased in both genders last decade. Among the fatty acid intake, the highest increase was MUFA in men (about 45.9%) and women (about 55.1%) for the last 10 years (Table 3); N-3 and N-6 fatty acid intake had increased last decade but the percentage of N-3 fatty acid intake was rather decreased in both genders (Table 3).
Means of Fatty Acid Intake of Study Population According to Sex and Year.a
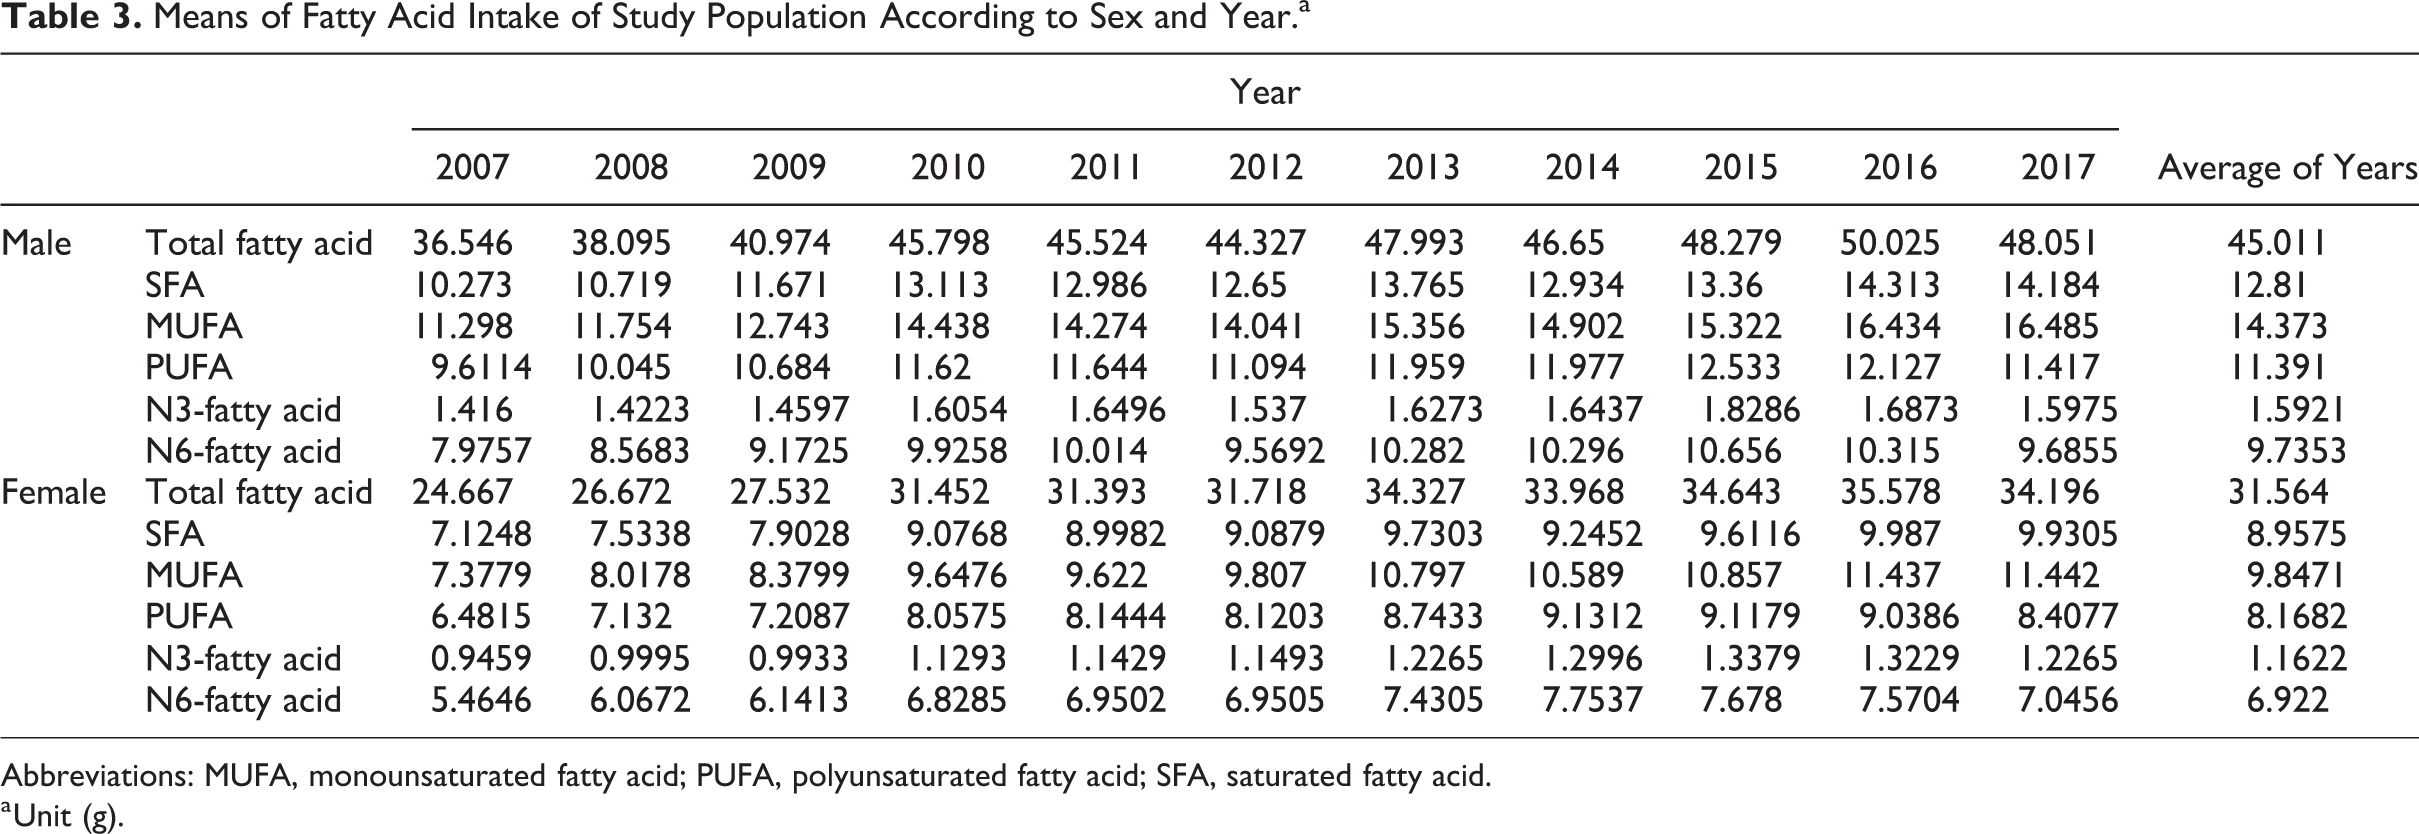
Abbreviations: MUFA, monounsaturated fatty acid; PUFA, polyunsaturated fatty acid; SFA, saturated fatty acid.
a Unit (g).
In both genders, SFA and MUFA consumed mainly from food group 1 (animal originated foods) regardless of obesity categories. Saturated fatty acid and MUFA intake increased from food group 1 from 2007 to 2017 in both genders and obesity categories. Saturated fatty acid and MUFA intake from food group 1 greatly increased in normal and obesity females (Figure 3A). Interestingly, N-3 fatty acid intake continuously and sharply decreased from seafood from 2007 to 2017 (Figure 3B). The intake of other fatty acids also decreased from food group 2 but it was slightly reduced regardless of genders and obesity categories last 10 years. However, its decrease was least in females with low-weight group (Figure 3B). Various fatty acid intake from food group 3 (grains and beans) also decreased in both genders and obesity categories except men with the low-weight group (Figure 3C). Monounsaturated fatty acid and PUFA intake came from food group 3 in all groups and it sharply decreased especially from the obese female group (Figure 3C). The fatty acid intake, especially, SFA and MUFA, from food group 4 was continuously elevated in both genders and obesity categories (Figure 3D). The fatty acid intake from food groups exhibited a high variation in the low-weight group regardless of genders. It may be due to small sample size and eating patterns of low-weight adults may be quite different. Interestingly, N-3 fatty acid intake was mainly from food group 5, sauces and seasonings, in both genders and obesity categories last 4 years (Figure 3E). The N-3 intake from food group 5 was markedly increased especially in normal-weight and obesity groups in both genders (Figure 3E). Fatty acid intake from food group 6 (fruits and vegetables) continuously decreased in both genders and obesity categories last 10 years (Figure 3F). The variation was very big in men with low-weight group but other groups of gender and obesity categories showed similar patterns. Since food group 6 is not a good source of fatty acids, the decrease of fatty acid intake from food group 6 suggested the increase of other fatty food intakes. Intake of fatty acids, especially, MUFA, PUFA, and N-6 fatty acids, from food group 7 (nuts) was continuously increasing. Among fatty acids, N-3 fatty acid intake was remarkably elevated from food group 7 in all groups. Since nuts did not contain SFA, SAT intake from food group 6 was not changed last 10 years (Figure 3G).
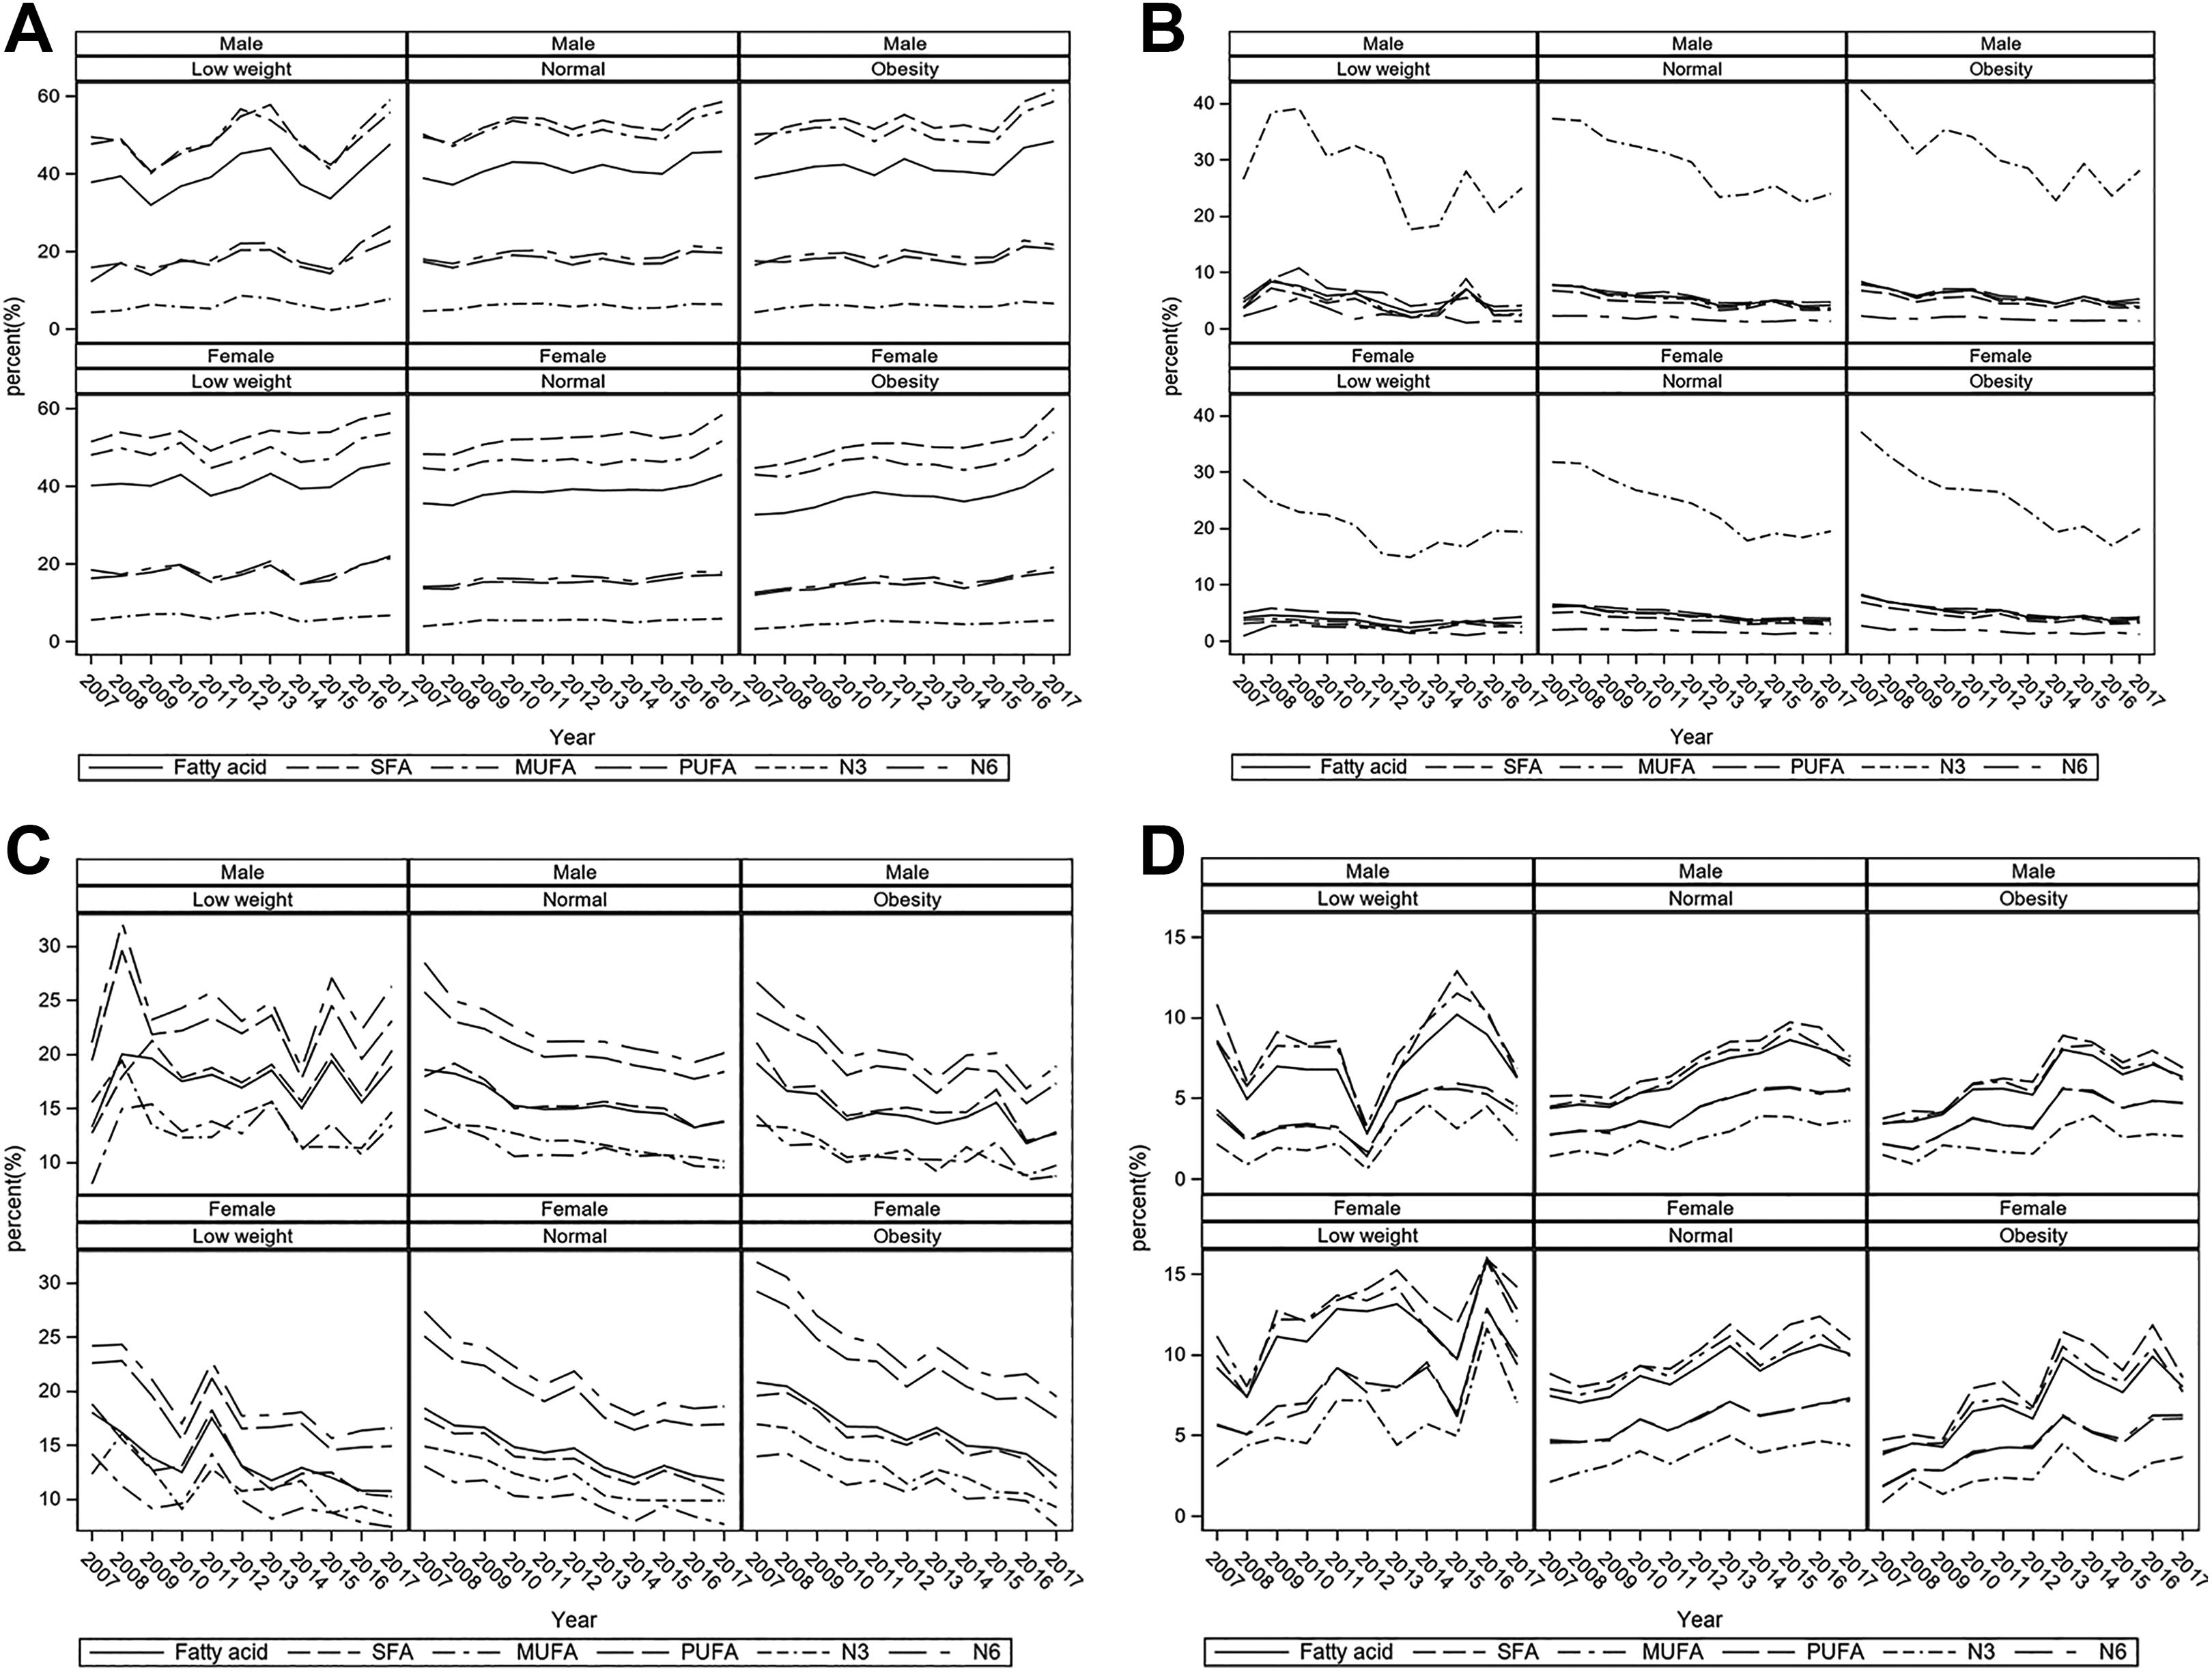
Changes in fatty acid intake from 7 food groups in low-weight, normal-weight, and obese groups according to genders from 2007 to 2017 According to gender and body weight categories, the percentage intake of total fatty acid (fatty acid), saturated fatty acid (SFA), monounsaturated fatty acid (MUFA), polyunsaturated fatty acid (PUFA), N3-fatty acid, and N-6-fatty acid from food group 1 (A), food group 2 (B), food group 3 (C), food group 4 (D), food group 5 (E), food group 6 (F), and food group 7 (G). Food groups: 1, animal originated products (beef, pork, chicken, milk and milk products, eggs); 2, seafood originated products (fish, fish eggs, clams); 3, grains and beans (rice, noodles); 4, bread and cookies; 5, sauces (vegetable oils, bean sauce, mayonnaise, vinegar, and spices); 6, fruits, vegetables, mushrooms, alcohol beverage, tea; and 7, nuts.
Discussion
Obesity is increasing worldwide, including in Korea. Obesity is developed by the balance of energy intake and energy expenditure, and the intake of macronutrient amounts and types influences obesity development. 12 Asians including Koreans have a highly elevated risk of metabolic diseases as body weight increases by triggering insulin resistance, although metabolic diseases are commonly developed in nonobese Asians. 13 The International Obesity Task Force and the WHO Regional Office for the Western Pacific Region define obesity as BMI ≥25, which is much lower than the Western obesity criteria (BMI ≥30). 11 Thus, the present study determined changes in obesity prevalence, macronutrient intake, and the major foods to consume fatty acid intake using the KNHNES data from 2007 to 2017. We showed that obesity prevalence did not change from 2007 to 2014 and was then elevated from 2015 in both genders. However, the present study showed gender differences in obesity prevalence: Women had less prevalent obesity than men. The obesity prevalence is generally higher in women than in men in the most population. 14 However, there are some discrepancies between obesity prevalence and genders by different countries. In Asian countries, obesity prevalence is greater in men than in women. 15 Gender inequality may explain the disparities. 14
Obesity is a net of energy intake and energy expenditure and a slight increase in obesity prevalence may be associated with the intake of energy and macronutrients. Energy intake was slightly elevated from 2007 to 2015 with fluctuation and it decreased from 2015. Daily carbohydrate and protein intake fluctuated until 2015 before suddenly decreasing from 2016. However, daily fat intake was continuously elevated until 2015 and then did not much thereafter. Thus, increased energy intake was mainly from fat intake in the present study. These results suggest that fat and fatty acid intake exhibited big changes last decade in Koreans. The major food sources of fat intake were in the ascending order of nuts, fruits and vegetables, grains, bread and cookies, seafood, sauces, and animal food for last 10 years, regardless of gender and obesity status. Among the food groups, fat intake was elevated from animal foods as well as bread and cookies, but interestingly, fat intake from seafood was markedly decreased, even though the importance of fish and fish oil (N-3 fatty acids) has been promoted. Therefore, N-3 fatty acid intake should increase from seafood and fats in the sauce can be modulated to increase N-3 fatty acids.
Although obesity involves the balance of energy intake and energy expenditure, energy intake and obesity status were not parallel in women in the KNHANES, as energy intake of obese women was lower than that of low-weight women. This might be associated with underestimation in the obese group and overestimation in the low-weight group in the present study. Energy intake from fat was higher in the low-weight group than in the obese group in women. Voss et al reported that energy intake with macronutrient intake is underestimated in obese participants in an East German (Potsdam) cohort of the European Prospective Investigation into Cancer and Nutrition Study. 16 Lower fat intake and higher carbohydrate and protein intake in low energy have been reported. 16 In addition, energy intake was underestimated by 21.8% in men and 27.3% in women while protein intake was underestimated by 14.7% in men and 20.7% in women in Hispanic Community Health Study/Study of Latinos. 17 Higher BMI and Hispanic/Latino background were associated with the underestimation of energy by consuming high-energy density foods (P < .05). Thus, women showed underestimation more than men, and obese women might show underestimation as well. Other potential factors such as higher salt intake and less exercise may be involved in obese women with lower energy intake. 18 Thus, further study is needed regarding the relationship between energy intake and obesity in women.
The present study demonstrated that fat intake has remarkably increased and that the sources of fat have also changed over the last decades. Foods from 24-hour recall were categorized into 7 food groups based on the fatty acid composition. The total fatty acid intake from animal foods (group 1) was the highest among the 7 food groups, and it was also slightly and continuously elevated. About 50% intake of not only saturated fatty acids but also MUFAs was from animal foods. The second most common food source (about 20%) of MUFAs was the sauce, and it may be originated from plant oils. Koreans consumed MUFA from animal food. Guasch-Ferré et al 19 demonstrated that the intakes of total MUFAs and MUFAs from plant foods have an inverse association with total mortality after adjusting for potential confounders, but MUFAs from animal foods are associated with higher mortality from the Nurses’ Health Study and Health Professionals Follow-Up Study from 1990 to 2012. Meat consumption is related to an increased prevalence of chronic diseases and mortality. However, meat intake in Koreans is substantially lower than that in Westerners. 20 In 2015, Koreans consume 10.3% meats for men and 8.8% for women from energy intake, which remain low. 21 In the present study, the N-3 fatty acid intake from the sauce was rising and markedly decreasing from seafood regardless of gender and obesity status. Fish intake is continuously decreasing although health education has been promoted. 22 This may be involved in residence patterns. Therefore, semicooked seafood products need to be developed for easy cooking at home, and monounsaturated fat and N-3 fatty acids-containing oils need to be used to develop new sauces.
The strength of the present study was that it demonstrated the food sources of different types of fatty acids according to gender and obesity status. This was accomplished using 24-hour recall data regarding various foods consumed by Koreans. The measurement of food intake by 24 hour-recall had less systematic underestimation than semiquantitative food frequency test although obese women may have a chance to remove or add what they are eating. 23 This study suggests that sauces are important resources of different fatty acids, and the mixture of various oils for sauces needs to be considered to be beneficial for consumers’ health. The limitations of the study were as follows: (1) nutrient intake can be under- or overestimated since it was based on 24-hour recall. Energy and macronutrient intake was lower in the obese group than in the low-weight group. Nutrient intake from 24-hour recall might not represent the typical intake, although the 24-hour recall method is a commonly used method for assessing the intake of a population. (2) Food intake by 24-hour recall was categorized into 7 groups according to fatty acids. Although the seasonings were separately included as bean paste, oil-based paste, mayonnaise, vinegar, and others, the sauces might be underestimated.
In conclusion, energy intake was increasing in the ascending order of the low-weight, normal-weight, and obese groups only in men, and energy intake fluctuated from 2007 to 2017. Fat intake increased over the last decade in both genders, regardless of obesity. Fat intake was higher in obese men than in the low-weight men, but the opposite fat intake pattern was shown in women. Total, saturated, and MUFA intake increased in both genders last 10 years. Saturated fatty acid and MUFA intake were mainly originated from animal foods, bread, and cookies. Polyunsaturated fatty acids including N-3 and N-6 fatty acid intake came from sauce and nuts. Although the importance of fish has been publicly promoted, N-3 fatty acid intake from seafood decreased from 2007 to 2017 although N-3 fatty acid intake increased over time. Therefore, seafood intake needs to be promoted to consume N-3 fatty acids and the fat composition of the sauces needs to be also modulated to increase N-3 fatty acids.
Footnotes
Authors’ Note
Jaeouk Ahn and Nam Soo Kim equally contributed to this work. SP and JA designed the research. NSK and BKL analyzed the data. SP and JA wrote the paper and had the final responsibility of the manuscript. All authors have read, provided input, and approved the final manuscript.
Declaration of Conflicting Interests
The author(s) declared no potential conflicts of interest with respect to the research, authorship, and/or publication of this article.
Funding
The author(s) disclosed receipt of the following financial support for the research, authorship, and/or publication of this article: This work was financially supported by the Soonchunhyang University Research Fund in 2019.