
Abstract
Background:
Solomon Islands (SI) mandated wheat flour fortification in 2010. Rice is a key staple food in SI, and its fortification may provide an opportunity to deliver additional micronutrients to the population.
Objective:
To determine whether fortified rice (proposed) and fortified wheat flour potentially benefit women of reproductive age (WRA).
Methods:
We analyzed data from the 2012-2013 Household Income and Expenditure Survey to quantify food purchases, which served as a proxy for food consumption. We accounted for varied household composition by using adult male equivalent (AME) adjustments.
Results:
Among 4478 households, 95.6% purchased rice and 86.6% purchased at least 1 food containing fortified wheat flour in the previous 14 days. Median apparent intake of rice among WRA was 205 g/d/AME. If fortified according to proposed standards, this apparent intake could result in the consumption of 12.3 mg iron/d, fulfilling 44% of the estimated average requirement (EAR), and 226 µg folic acid/d, satisfying 57% of World Health Organization’s recommended intake of 400 µg/d. Overall, apparent rice consumption could fulfill 113%, 114%, and 131% of the EAR for WRA for zinc, thiamin, and niacin, respectively. Fortified wheat flour was consumed in much lower quantities, with an estimated apparent median intake of 22 g/d/AME among WRA and 78 g/d/AME among women in urban populations.
Conclusions:
The potential benefit of fortified wheat flour in SI is likely limited to urban populations. Apparent consumption of fortified rice in SI could contribute considerably to daily intake of iron, B vitamins including folic acid, and zinc among WRA.
Keywords
Introduction
Malnutrition is an important public health concern in the Solomon Islands (SI), where 41%, 54%, and 39% of women aged 15 to 49 years, pregnant women, and children under 5 years, respectively, are anemic. 1 According to the World Health Organization (WHO), a prevalence of anemia of 40% or higher indicates a severe public health problem. 2 Although non-nutritional factors such as infection (eg, malaria or helminth infections) and genetic abnormalities of the red blood cell can contribute to the burden of anemia, approximately half of all anemia cases are caused by iron deficiency. 3 Chronic micronutrient malnutrition due to limited resources and low-quality diets leads to impaired cognitive development and growth in children, loss of work productivity in adults, and increased susceptibility to infection. 4,5 Iron-deficiency anemia, especially severe anemia, increases a woman’s risk of poor pregnancy outcomes (eg, prematurity, low birth weight) and mortality. 6 Inadequate consumption of folic acid in the periconceptional period increases a woman’s risk for a pregnancy affected by a neural tube defect, a severe and often fatal birth defect of the brain or spine. 7
Staple food fortification is widely used as a tool to help ease the burden of micronutrient deficiencies, particularly deficiencies of iron, iodine, and the B vitamins, including folic acid. 8 Well-planned and properly implemented and monitored staple food fortification programs can improve nutritional status and health outcomes such as neural tube defects. 9 -13 Fortification of staple foods is complementary to dietary diversity and seeks to provide specific nutrients to nutritionally vulnerable populations including women of reproductive age (WRA) and young children, whose diets may be low in micronutrient-rich foods such as animal-based foods, fruits, and vegetables. Because staple food fortification is a cost-effective means to mitigate micronutrient malnutrition in vulnerable groups, 86 countries have implemented legislation requiring the fortification of wheat flour, maize flour, and/or rice. 14 -16
Mandatory wheat flour fortification legislation was passed in 2010 in the SI (the “Pure Food Regulations”) and stipulates the addition of iron, zinc, thiamin, riboflavin, niacin, and folic acid. 17 Because of a dearth of reliable dietary data at the time, SI adopted a regional standard for wheat flour fortification based on Fiji’s wheat flour standards. Many countries in the Pacific region do not have the resources to develop standards specific to their context and therefore adopt regional standards. 18 Delite Industries, the only flour mill in the country, began fortifying wheat flour in 2015. According to Delite, since 2015, an estimated 95% of the wheat flour in the SI has been fortified according to the mandatory standards. 19 As there are no import monitoring data available, it is not known whether imported wheat flour is fortified to the SI’s fortification standards. Although the Pure Food Regulations do not require fortification of rice, this food is an important staple for most of the population. Cassava and potato are also widely consumed staple foods in the SI; however, they are not industrially processed and thus are not candidates for food fortification. Biofortification of these crops may be a viable future alternative. 20 In recognition that rice is a key staple food in the SI that could realistically be fortified, the Food Fortification National Committee (FFNC), an interagency public–private partnership, is actively planning to introduce amended rice regulations to include fortification requirements with iron, folic acid, zinc, thiamin, and niacin, so that the benefits of fortification can be extended across the country. 21
Household Income and Expenditure Surveys (HIESs) are conducted throughout the world to determine, in part, household expenditure and income patterns and are a valuable source of information about household food acquisition. 22,23 These population-based national surveys typically collect expenditure information from thousands of households and are usually conducted continuously for 1 year. Although HIESs are not designed to quantify individual food consumption, they have proven in multiple countries to provide food expenditure data that serve as a proxy for “apparent” food consumption data. 24 -26 Because HIESs are already routinely funded and conducted in many countries, secondary analysis of these data can serve as an inexpensive means to begin to understand food consumption patterns in countries where nationally representative dietary intake surveys may be cost prohibitive and/or do not already exist. 27
We analyzed the 2012-2013 SI HIES to understand both the potential coverage of fortification and the individual contributions of rice and wheat flour fortification to micronutrient intake. We strove to understand whether these foods, if fortified, are consumed in high enough quantity by WRA, a typically nutritionally vulnerable population, to improve micronutrient intake.
Methods
The 2012-2013 SI HIES was conducted using a 2-stage sampling technique, where enumeration areas served as the primary sampling units. 28 The nationally representative sample was constructed based on 2009 SI census data. Data were collected for 12 continuous months, from October 2012 through October 2013, and the response rate was 97.2%. 28 Household food expenditure information was captured using a single 14-day food diary in which households recorded information daily about all purchased or acquired food items including the specific foods, the amount of food purchased or acquired (recorded in metric units or household measures), the cost of the food (if purchased), how the food was obtained (purchased, gift, home garden), and whether the food was intended for consumption in the home. Because most households purchased the foods of interest rather than acquired the foods in other ways, we refer to all purchased or gifted foods as “purchased foods” for ease of presentation. Data were weighted at the household level so that population estimates could be made. All analyses accounted for the sample weights generated by the Solomon Island National Statistics Office. Household income, based on household monetary earnings (eg, employment income, property income, etc) and/or receipt of in-kind goods and services, is expressed in quintiles (1 = lowest quintile, 5 = highest quintile) constructed by the Solomon Island National Statistics Office. 28
We estimated the potential coverage of fortified rice and wheat flour by determining the percentage of households that purchased each food. For the analysis of coverage, we included all households that indicated (yes or no) whether they purchased the food of interest (rice, wheat flour, or wheat flour-containing foods such as bread, biscuits, bread buns, and cakes). We included in our analysis only foods that were intended to be consumed by the household members and are (or would be, in the case of rice) required to be fortified under national standards and refer to them as fortified rice and fortified wheat flour. We therefore categorized acquisition of home-grown rice and wheat and imported wheat flour-based foods as “did not purchase the fortified food.” Imported wheat flour-containing foods such as noodles and pasta were not included in the fortified foods category because they are not required to be made with fortified flour according to the SI regulations (although they may be fortified/made with fortified flour according to the exporting country’s standard). Although rice is not currently fortified in the SI, we refer to it as rice or fortified rice for ease of presentation.
Estimating Apparent Per Capita Consumption of Rice and Wheat Flour
We estimated apparent per capita consumption, in grams, of rice and wheat flour-containing foods. We use the term “apparent” to indicate that the survey did not measure actual food intake but rather food purchases, which served as a proxy for consumption. 23 For the per capita consumption analysis, we included only households (1) that contained at least 1 woman aged 15 to 44 years, (2) for which the purchased food was intended for consumption by household members (ie, food purchased for a business or to feed animals was excluded), (3) that were not missing information about household composition (number of inhabitants and age and sex of each household member), and (4) that completed at least 12 days of the one-time 14-day food diary. We constructed the analytical sample for per capita wheat flour consumption as follows, beginning with a sample of 4478 households: 412 were excluded due to failing to complete >11 diary days, 8 were excluded due to missing household information, 455 households had no WRA, 60 outliers were deleted, and 421 did not purchase wheat flour, resulting in a sample of 3122. Similarly, for per capita rice, 412 were excluded due to failing to complete >11 diary days, 8 were excluded due to missing household information, 503 households had no WRA, 43 outliers were deleted, and 158 did not purchase rice, resulting in a sample of 3354. We determined daily household rice and wheat flour consumption, in grams, by dividing the total grams of food (rice or wheat flour-containing foods) by the number of food diary days reported (12-14 days). We used adult male equivalent (AME) adjustment factors to account for household composition. Adult male equivalents are based on expected energy expenditures in age- and sex-specific groups and serve as a more accurate estimate of food intake than simply dividing grams of food by the number of people in the household. 29 We assigned each household member an AME-based weight, or adjustment factor, and individual weights were summed to create a household AME estimate. We expressed apparent consumption in “grams per day per AME” and estimated food consumption in WRA by multiplying grams per day per AME by 0.79, the AME for an 18- to 30-year-old woman. 30 A more detailed description of the methods used to estimate apparent food consumption using HIES data was previously published. 23
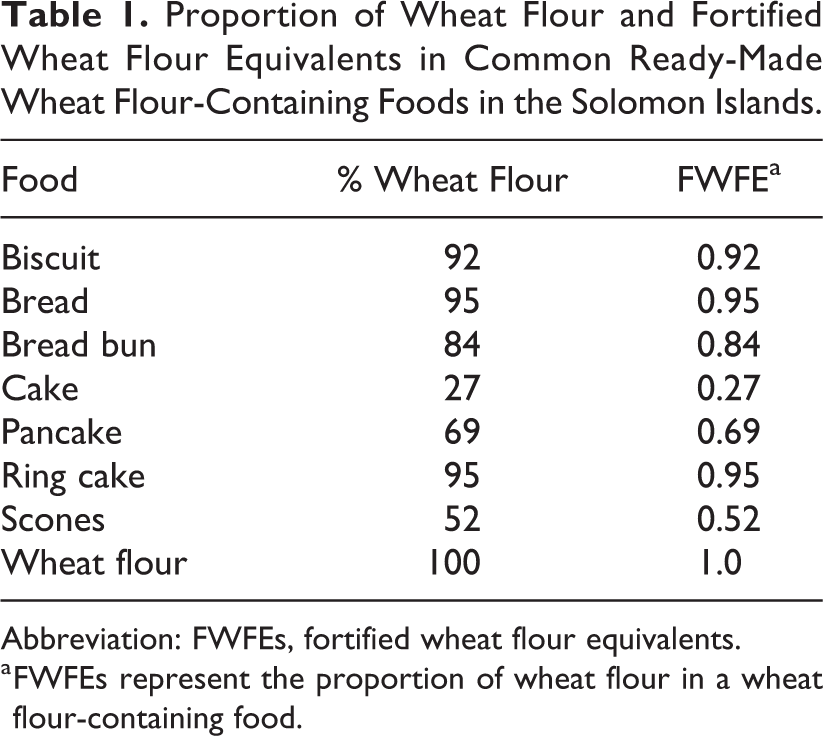
Many ready-made foods such as breads and cakes are made with wheat flour, but also contain other ingredients. We therefore converted grams of a food product such as bread to grams of wheat flour to quantify grams of wheat flour purchased. We constructed a fortified wheat flour equivalents (FWFEs) variable based on the amount of wheat flour in different foods (Table 1). For example, because bread in the SI typically contains 95% wheat flour, we multiplied the grams of bread purchased by 0.95 to determine grams of fortified wheat flour. We obtained percentage of wheat flour estimates for ready-made wheat flour-containing foods using local recipes from Delite Industries, a Honiara bakery, and the Ministry of Health and Human Services’ Nutrition Unit (Becky Tsang, MPH, personal communication, June 2018). Rice purchases were almost exclusively reported in grams of uncooked rice. For the few households that reported rice as “cooked rice,” we used a ratio of 3:1 to convert cooked rice to uncooked rice.
Proportion of Wheat Flour and Fortified Wheat Flour Equivalents in Common Ready-Made Wheat Flour-Containing Foods in the Solomon Islands.
Abbreviation: FWFEs, fortified wheat flour equivalents.
a FWFEs represent the proportion of wheat flour in a wheat flour-containing food.
Estimating Apparent Nutrient Intakes Through Fortified Rice and Wheat Flour
We used the rice fortification levels proposed by FFNC and wheat flour fortification standards from the 2010 Pure Food Control Regulations (Table 2) to determine milligrams or micrograms of nutrients delivered by fortified rice and wheat flour, respectively. After determining grams of rice or wheat flour apparently consumed per women’s AME per day, we used the estimated average requirements (EARs) for thiamin, riboflavin, niacin, and zinc to determine the percentage of the EAR fulfilled through apparent consumption of rice or wheat flour. 8 We assume that many households in SI have diets lower in bioavailable iron and zinc. This assumption is based on (1) the high prevalence of anemia and (2) the widespread consumption of cassava. As noted above, 54% of pregnant women in SI are anemic. We assume that a proportion of the anemia is due to non-nutritional factors such as infections; however, a large proportion of anemia cases are likely due to iron deficiency. Nevertheless, we did not find national estimates of iron-deficiency anemia in SI, so we cannot be certain of the proportion of anemia attributed to iron deficiency. Cassava, which has a high phytate and tannin content, is an important staple food in SI and is commonly grown in home gardens. Both phytates and tannins bind minerals such as iron and zinc and can interfere with their absorption. 18 Because of the high prevalence of anemia and a diet rich in phytates and tannins, we assume dietary iron bioavailability is generally not 18%, the bioavailability estimate used by the Institute of Medicine (IOM) for calculating EARs. Instead, we use 2 dietary bioavailability scenarios commonly used for populations assumed to consume diets high in cereals and tubers, 5% and 10% bioavailability, respectively. For iron, we calculated 2 EARs assuming 5% and 10% dietary bioavailability from the 50th percentile of absorbed iron needs (1.41 mg/d). 31 Based on this calculation, we used the following EARs for iron: 28.2 mg/d assuming 5% dietary bioavailability (1.41/0.05) and 14.1 mg/d assuming 10% dietary bioavailability (1.41/0.1; Table 2). Of note, based on our above outlined assumption of a diet lower in bioavailable iron, we calculated iron EARs based on lower bioavailability estimates than those used by the IOM in the United States. The IOM constructs EARs based on the assumption of 18% bioavailability of iron. Accounting for a different population, with different dietary habits and resources, we constructed iron EARs based on the assumption of 5% and 10% bioavailability. This assumption of lower dietary bioavailability of certain minerals in some low-income settings has been followed by WHO/Food and Agriculture Organization (FAO) (for zinc). 8 We also present 2 EARs for zinc, published in WHO/FAO’s food fortification guidelines, considering moderate bioavailability (diets rich in legumes or pulses) and low bioavailability (diets poor in animal protein). 8 We compared apparent folic acid intakes with the 400 µg folic acid/d recommendation for WRA to reduce the risk of having a neural tube defect–affected pregnancy. 32,34
EARs or Recommended Intake for Women of Reproductive Age and Fortification Levels in Rice and Wheat Flour in the Solomon Islands.
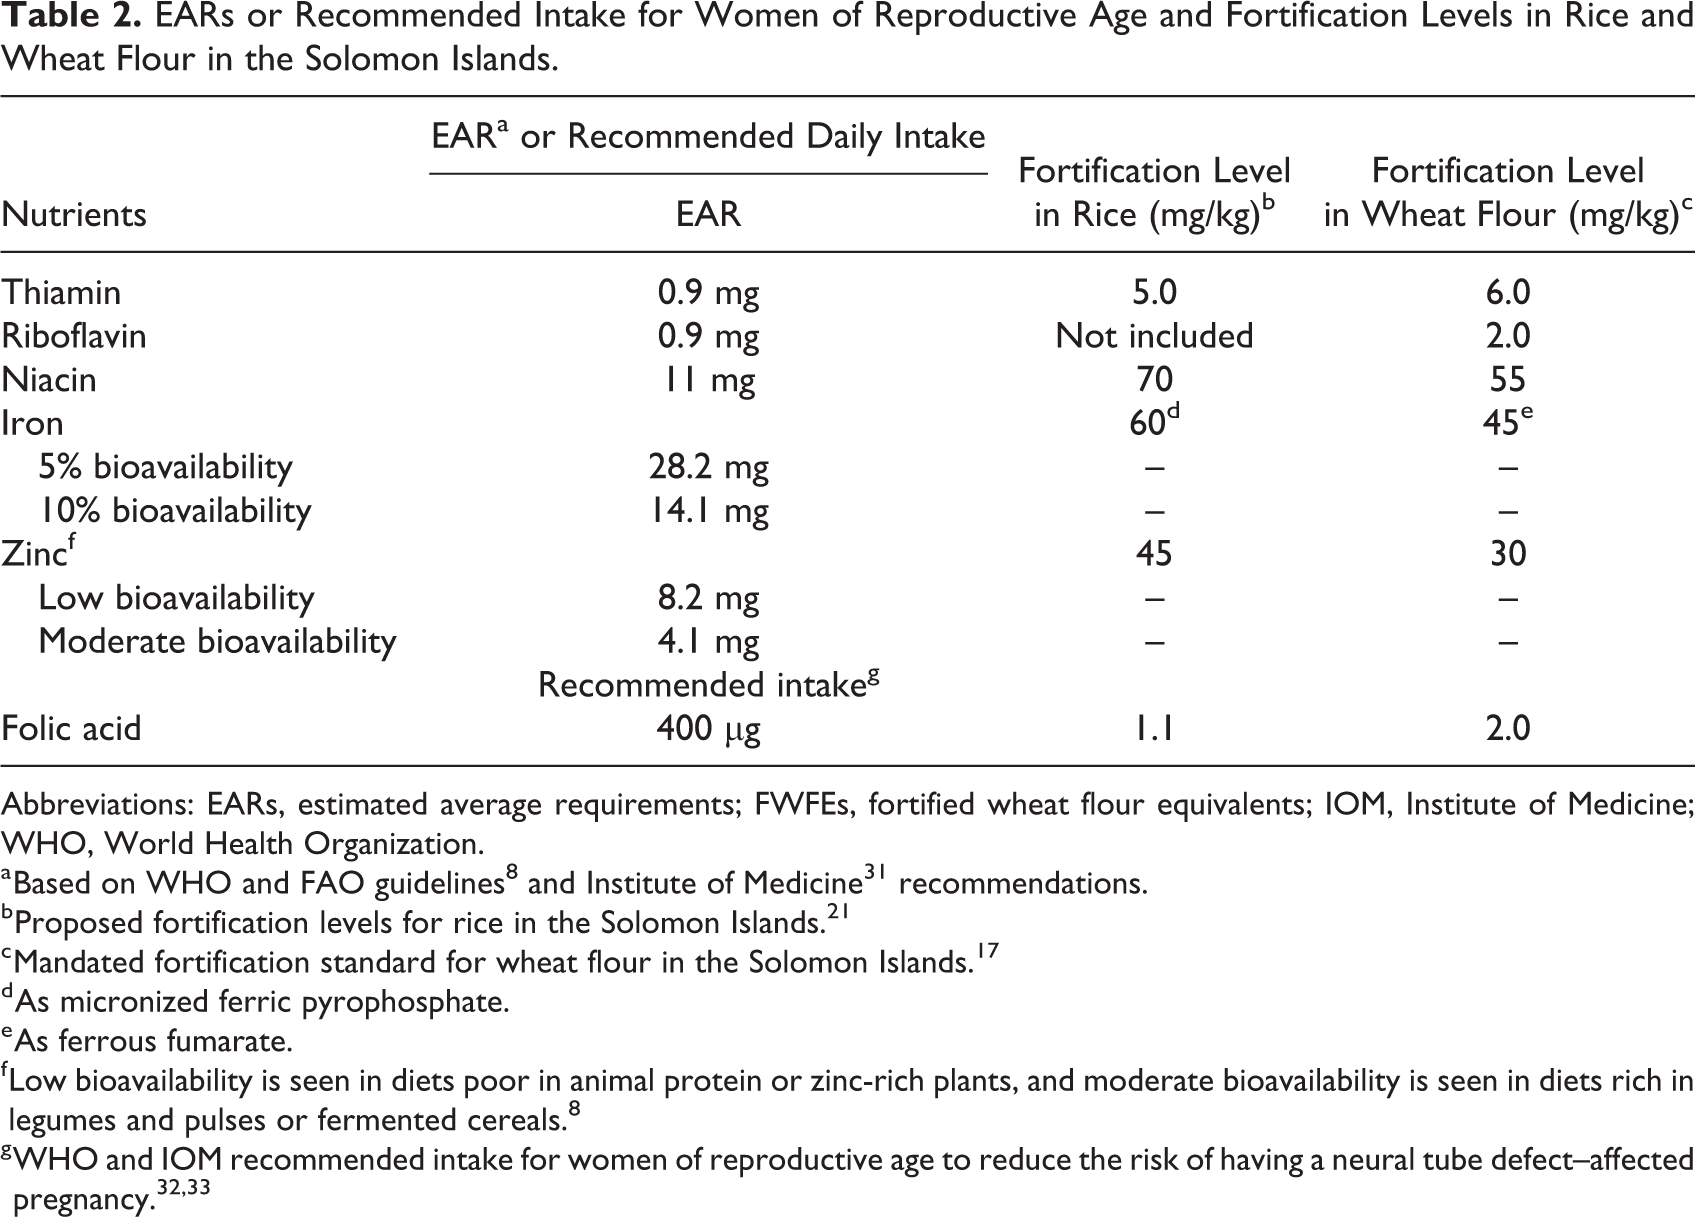
Abbreviations: EARs, estimated average requirements; FWFEs, fortified wheat flour equivalents; IOM, Institute of Medicine; WHO, World Health Organization.
b Proposed fortification levels for rice in the Solomon Islands. 21
c Mandated fortification standard for wheat flour in the Solomon Islands. 17
d As micronized ferric pyrophosphate.
e As ferrous fumarate.
f Low bioavailability is seen in diets poor in animal protein or zinc-rich plants, and moderate bioavailability is seen in diets rich in legumes and pulses or fermented cereals. 8
In addition to determining the percentage of the EAR fulfilled through apparent consumption of rice or wheat flour, we estimated the percentage of households that fulfilled 100% of the EAR through rice or wheat flour consumption. Similar to the previous calculation, we included only households that contained at least 1 woman. For each household, we used the median intake, adjusted for women, of rice or wheat flour to determine whether 100% of the EAR was met for the nutrient of interest. We then determined the percentage of households that fulfilled 100% (or more) of the EAR for the nutrients of interest.
We excluded extreme outliers from the grams of rice per day per AME calculations using Tukey method for identifying extreme outliers: Quartile 3 + (3 × interquartile range). Because wheat flour intake estimates were very low, we did not use the extreme outlier calculation but instead used a cutoff of 500 g/d/AME. For this analysis, we present conditional medians, in which the grams of food per AME per day estimations included only households that purchased the food of interest.
Ethics
Because the HIES data were de-identified, we did not request a review by an ethics board. Informed consent by the head of household for participation in the HIES was obtained at the time of original data collection.
Results
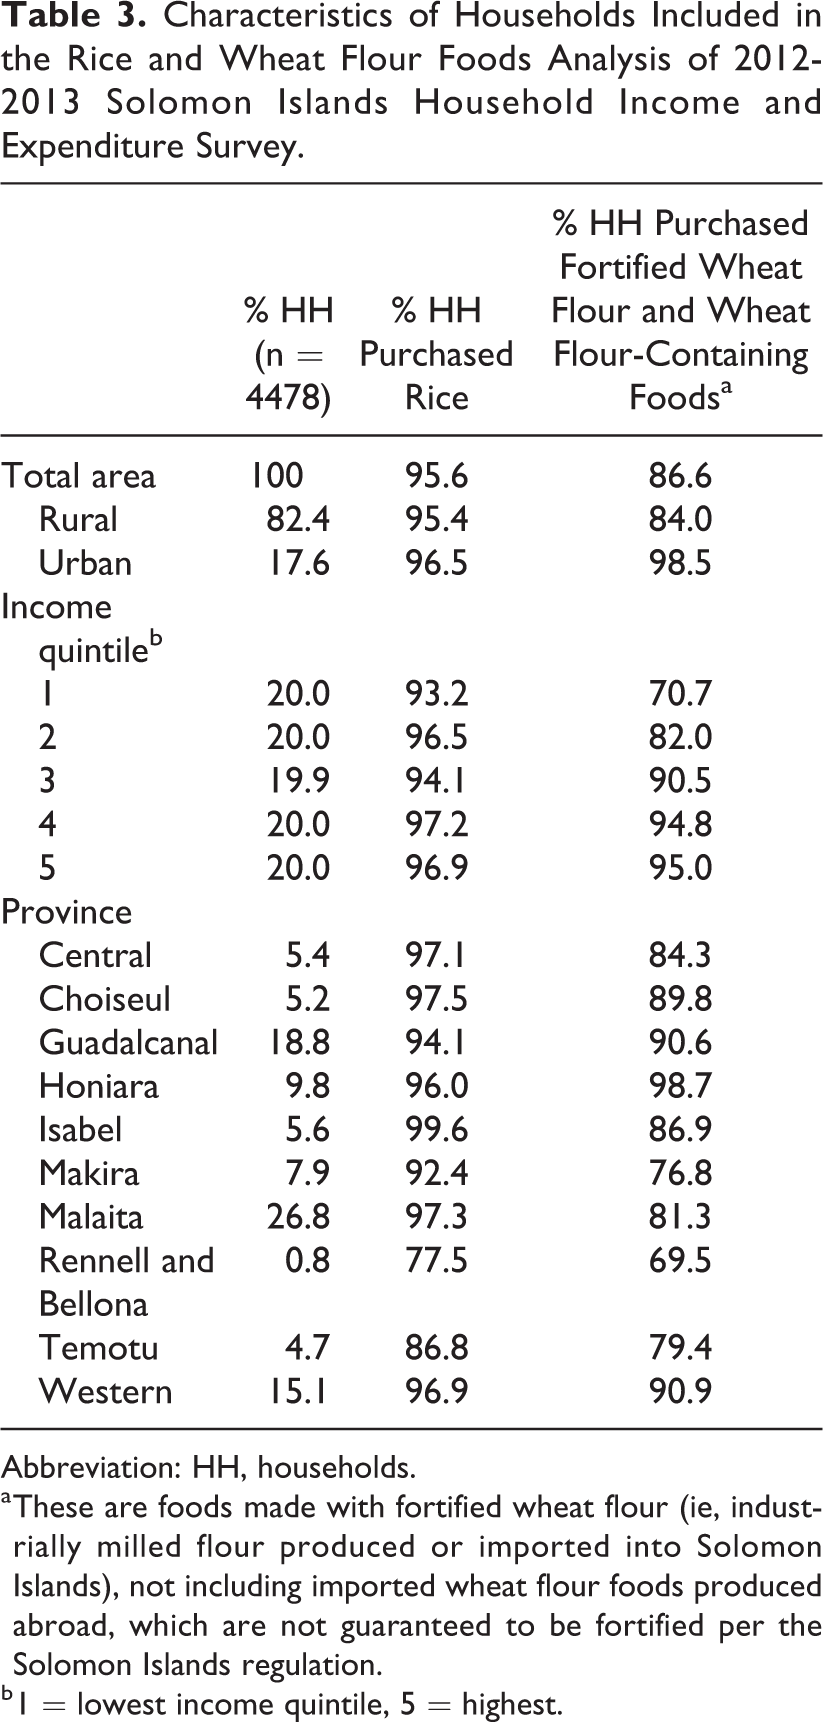
Rural households comprised 82.4% of the 4478 households included in our analysis of the HIES (Table 3). The province of Malaita represented the largest proportion of the sample (26.8%), followed by Guadalcanal (18.8%), which contains the capital of Honiara. Among all households, 95.6% purchased rice and 86.6% purchased at least 1 food containing fortified wheat flour in the previous 14 days. Approximately 71% of households in the lowest income quintile (Q1) purchased wheat flour-containing foods compared with 95% of households in the 2 highest quintiles (Q4 and Q5). The percentage of households that purchased rice in the previous 14 days did not seem to vary substantially among income groups; for example, 93.2% and 96.9% of households in the lowest and highest income quintiles, respectively, purchased rice.
Characteristics of Households Included in the Rice and Wheat Flour Foods Analysis of 2012-2013 Solomon Islands Household Income and Expenditure Survey.
Abbreviation: HH, households.
a These are foods made with fortified wheat flour (ie, industrially milled flour produced or imported into Solomon Islands), not including imported wheat flour foods produced abroad, which are not guaranteed to be fortified per the Solomon Islands regulation.
b 1 = lowest income quintile, 5 = highest.
Figure 1 shows the percentage of households that purchased common wheat flour-containing foods. Noodles and pasta were the most commonly purchased wheat flour-containing foods; however, as previously mentioned, they were excluded from our analysis because they are imported. Biscuits were the most commonly purchased fortified wheat flour-containing food and, like the other wheat flour-containing foods, were purchased more commonly by urban households.
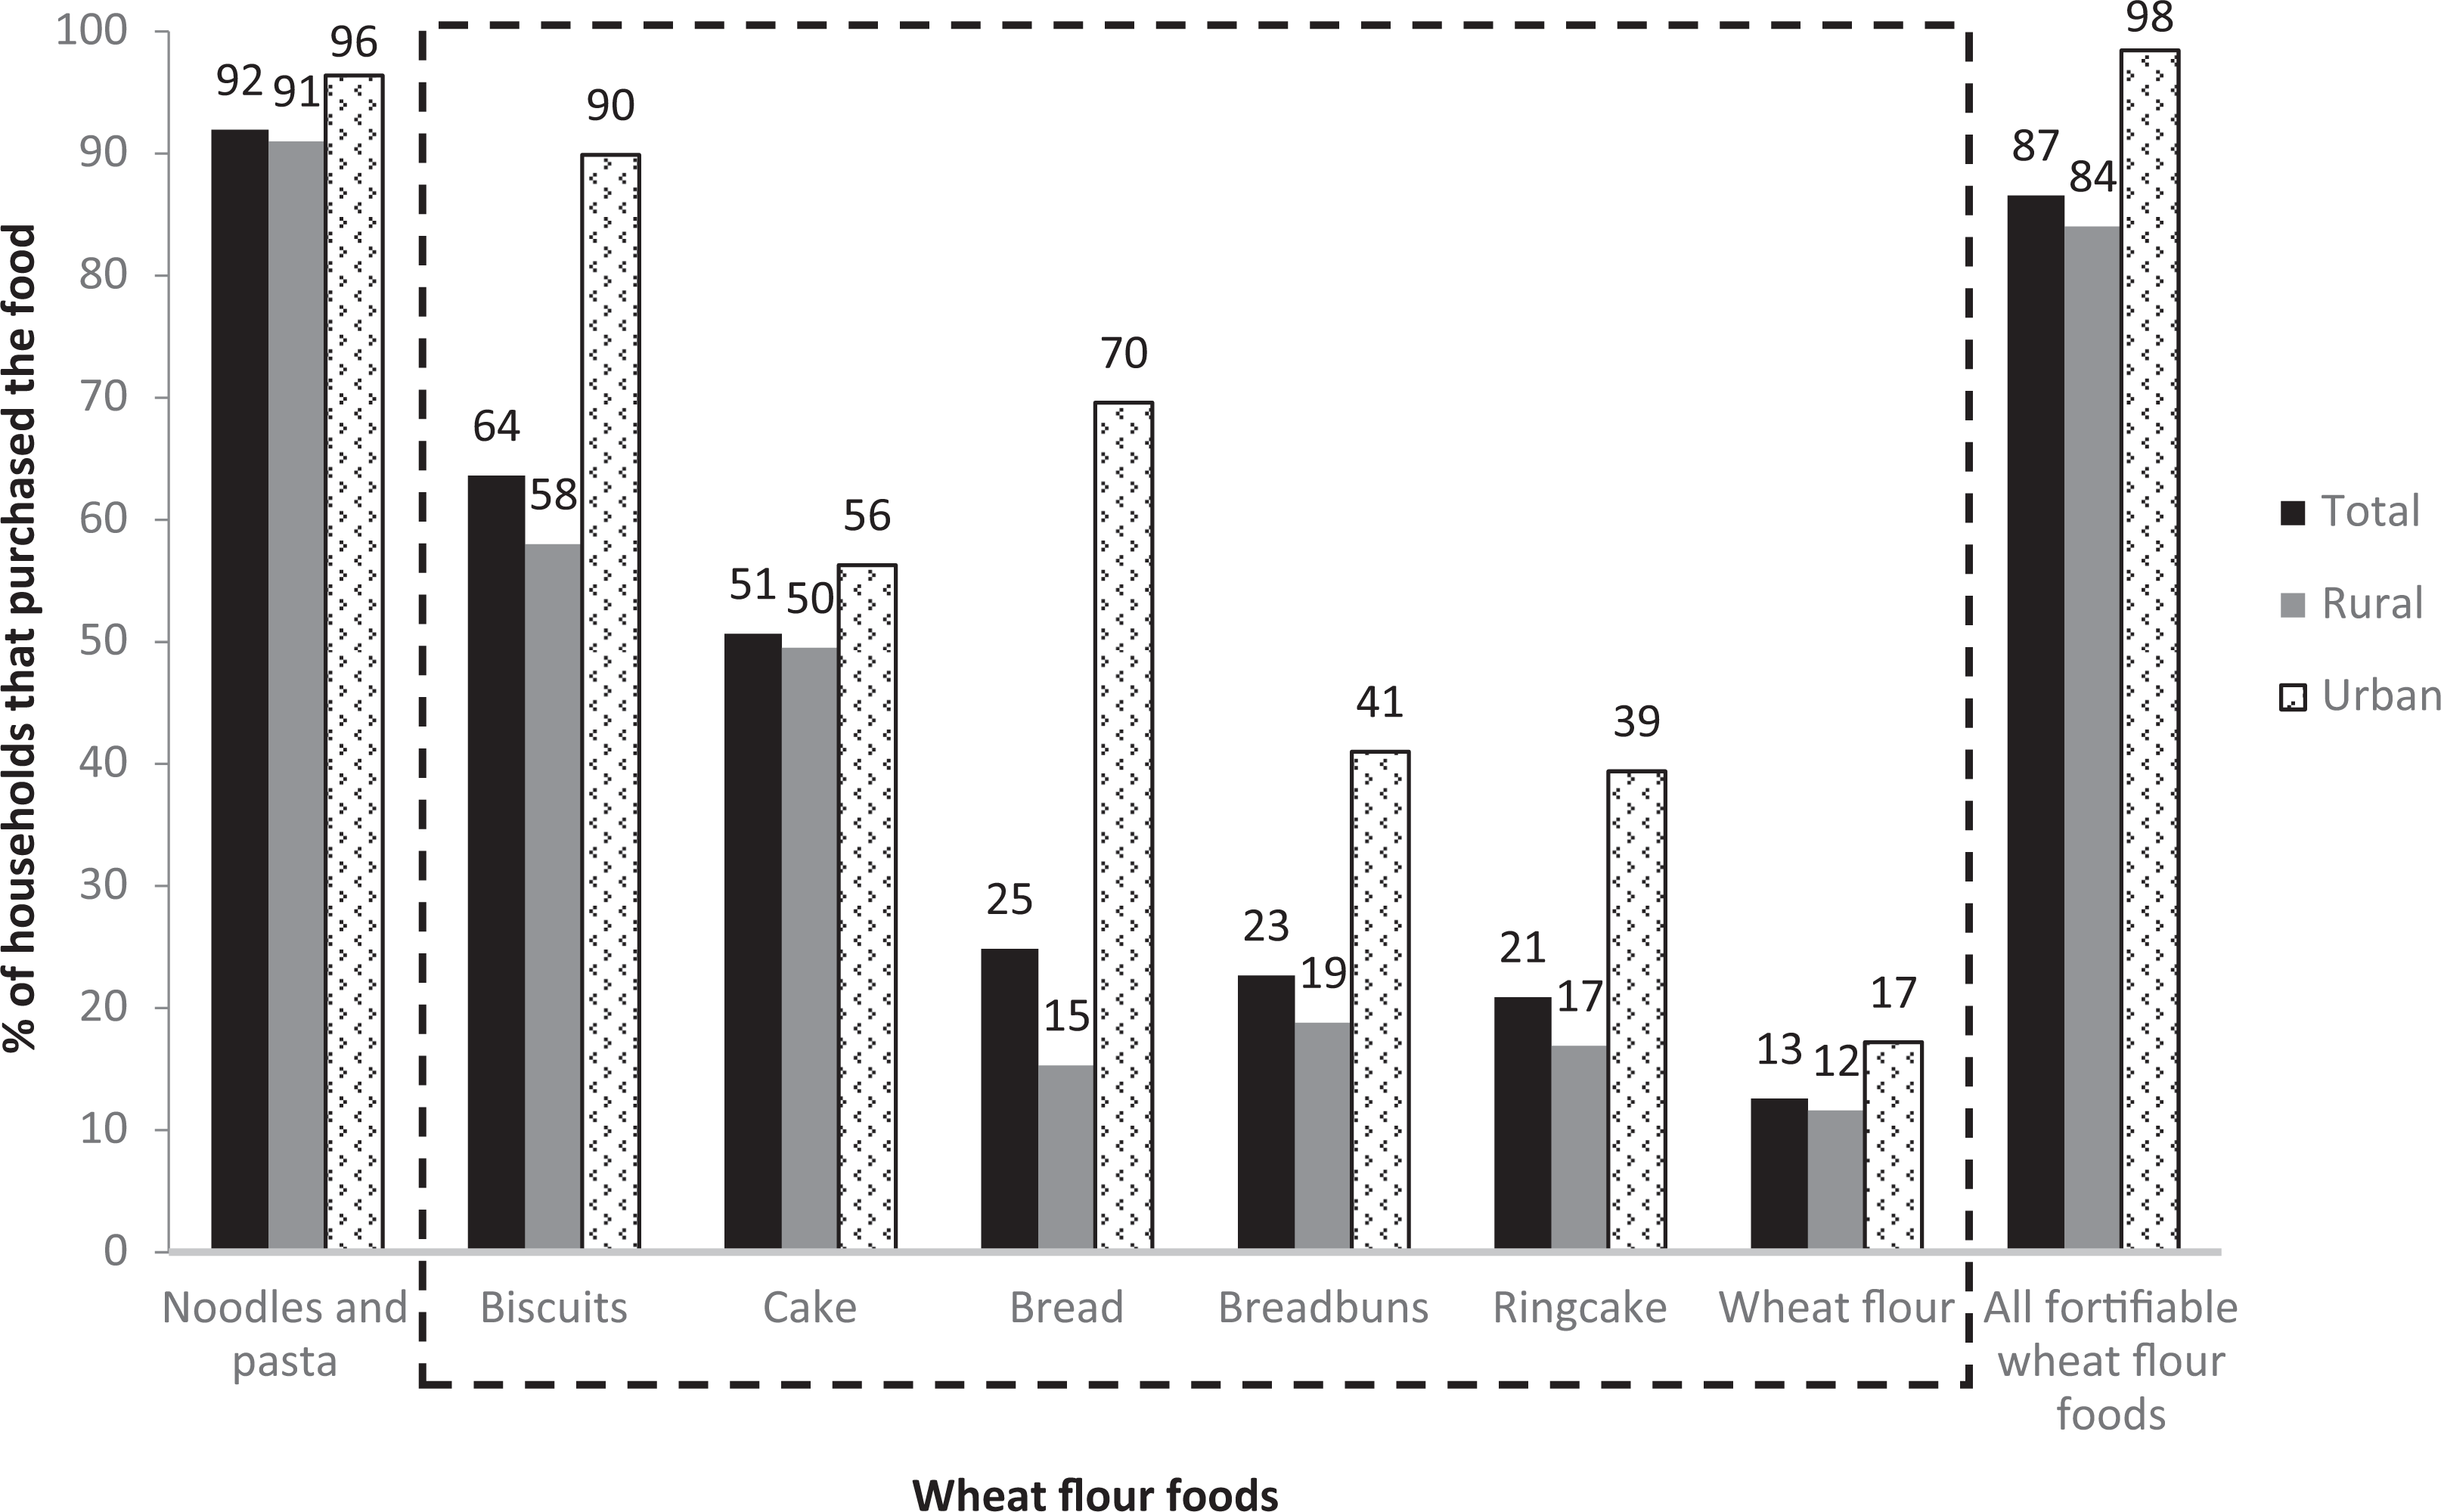
Percentage of households purchasing the most common wheat flour-containing foods in the Solomon Islands. Foods within the dashed box are considered fortified to Solomon Islands’ standards and were included in the analysis. aNoodles and pasta are largely imported and may not be made with fortified wheat flour. For this analysis, these are not considered “fortified wheat flour-containing foods.”
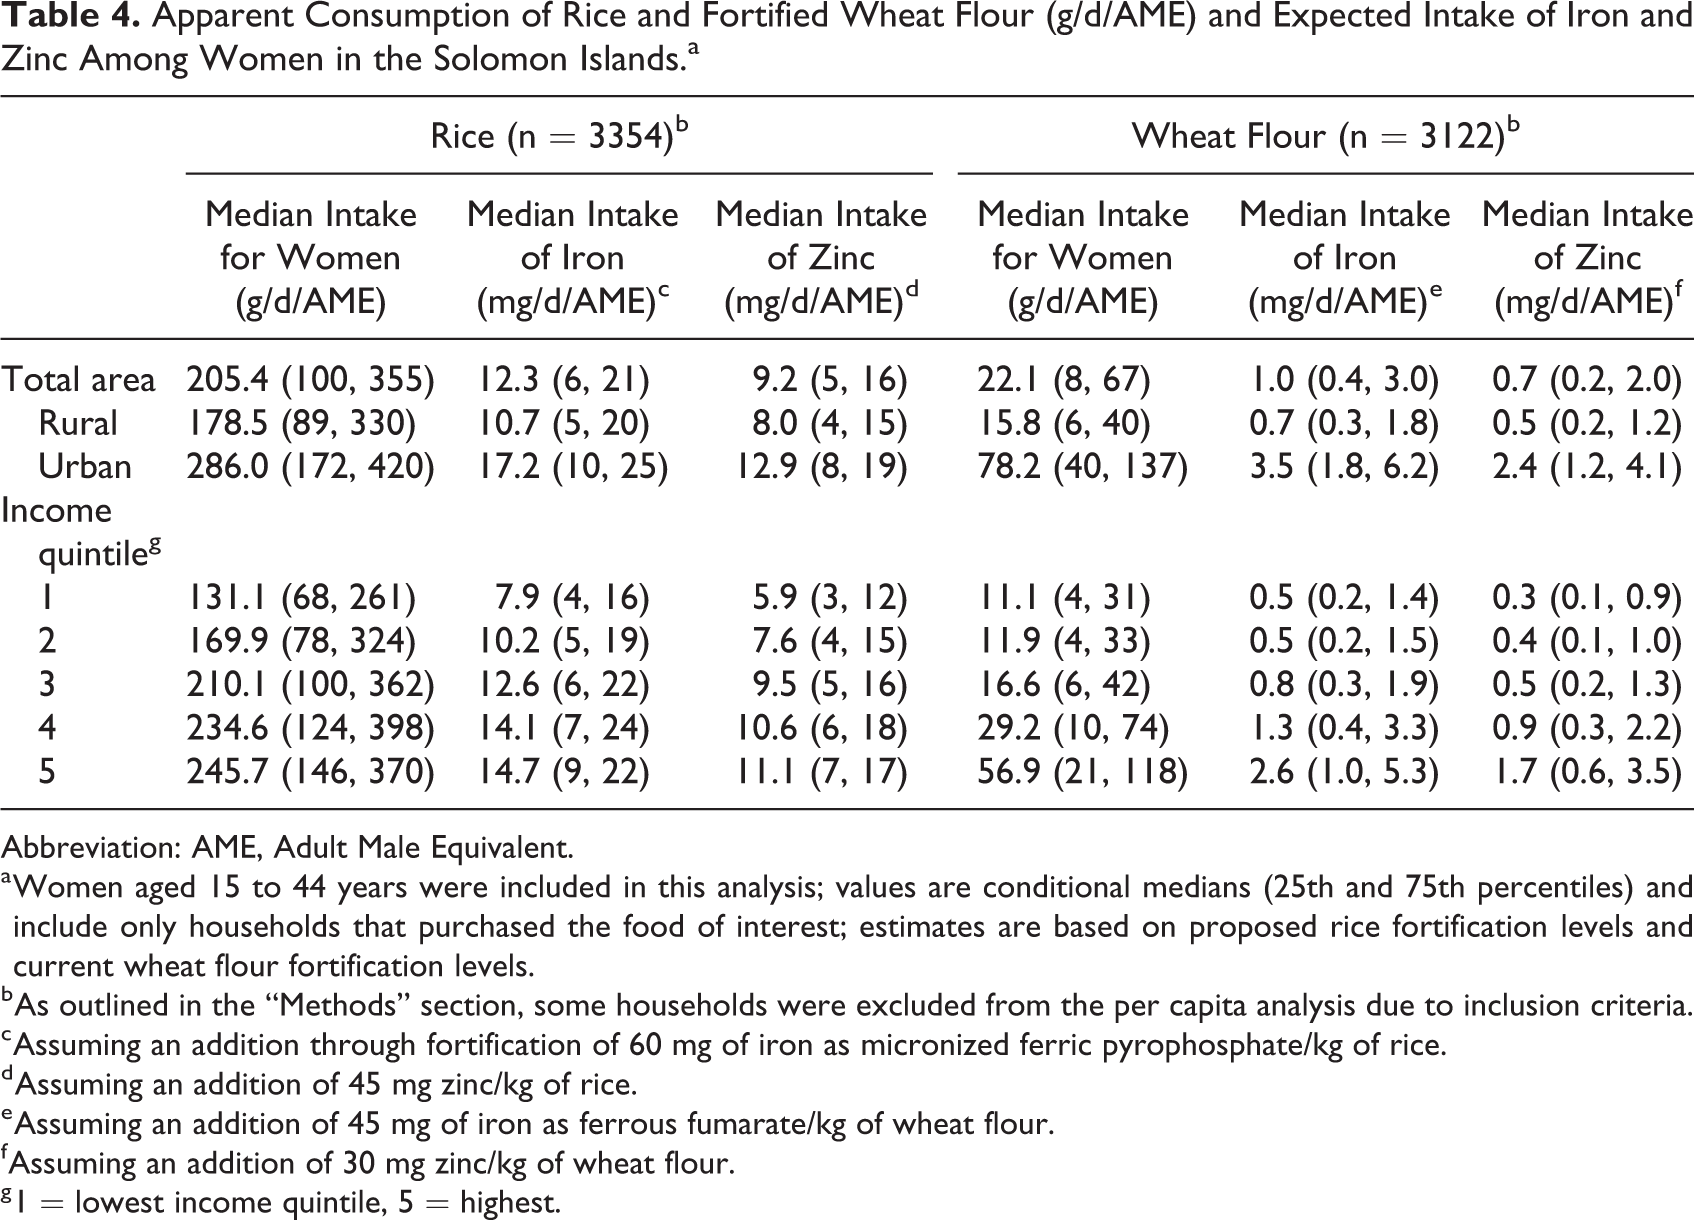
Apparent consumption of rice and wheat flour by WRA varied by income quintile and by area. As noted in the “Methods” section, the sample sizes for the rice and wheat flour per capita consumption were 3354 and 3122, respectively. All median values described below are among households that indeed purchased the food of interest. Median apparent consumption of rice by women in rural and urban households was 178.5 and 286 g/d/AME, respectively (Table 4). The overall median apparent rice intake for women was 205.4 g/d/AME and was greatest in households in the highest income quintile (245.7 g/d/AME). Similar to rice, apparent consumption of fortified wheat flour by women was higher in urban households (78.2 g/d/AME) compared with rural households (15.8 g/d/AME), with a total median apparent intake of 22.1 g/d/AME. Apparent consumption of fortified wheat flour among women was highest in the highest income quintile (Q5), with a median of 56.9 g/d/AME, and lowest in the lowest income quintile (Q1), at 11.1 g/d/AME. Households in Honiara apparently consumed higher amounts of wheat flour (96.4 g/d/AME) than those in the other provinces.
Apparent Consumption of Rice and Fortified Wheat Flour (g/d/AME) and Expected Intake of Iron and Zinc Among Women in the Solomon Islands.a
Abbreviation: AME, Adult Male Equivalent.
a Women aged 15 to 44 years were included in this analysis; values are conditional medians (25th and 75th percentiles) and include only households that purchased the food of interest; estimates are based on proposed rice fortification levels and current wheat flour fortification levels.
b As outlined in the “Methods” section, some households were excluded from the per capita analysis due to inclusion criteria.
c Assuming an addition through fortification of 60 mg of iron as micronized ferric pyrophosphate/kg of rice.
d Assuming an addition of 45 mg zinc/kg of rice.
e Assuming an addition of 45 mg of iron as ferrous fumarate/kg of wheat flour.
f Assuming an addition of 30 mg zinc/kg of wheat flour.
g 1 = lowest income quintile, 5 = highest.
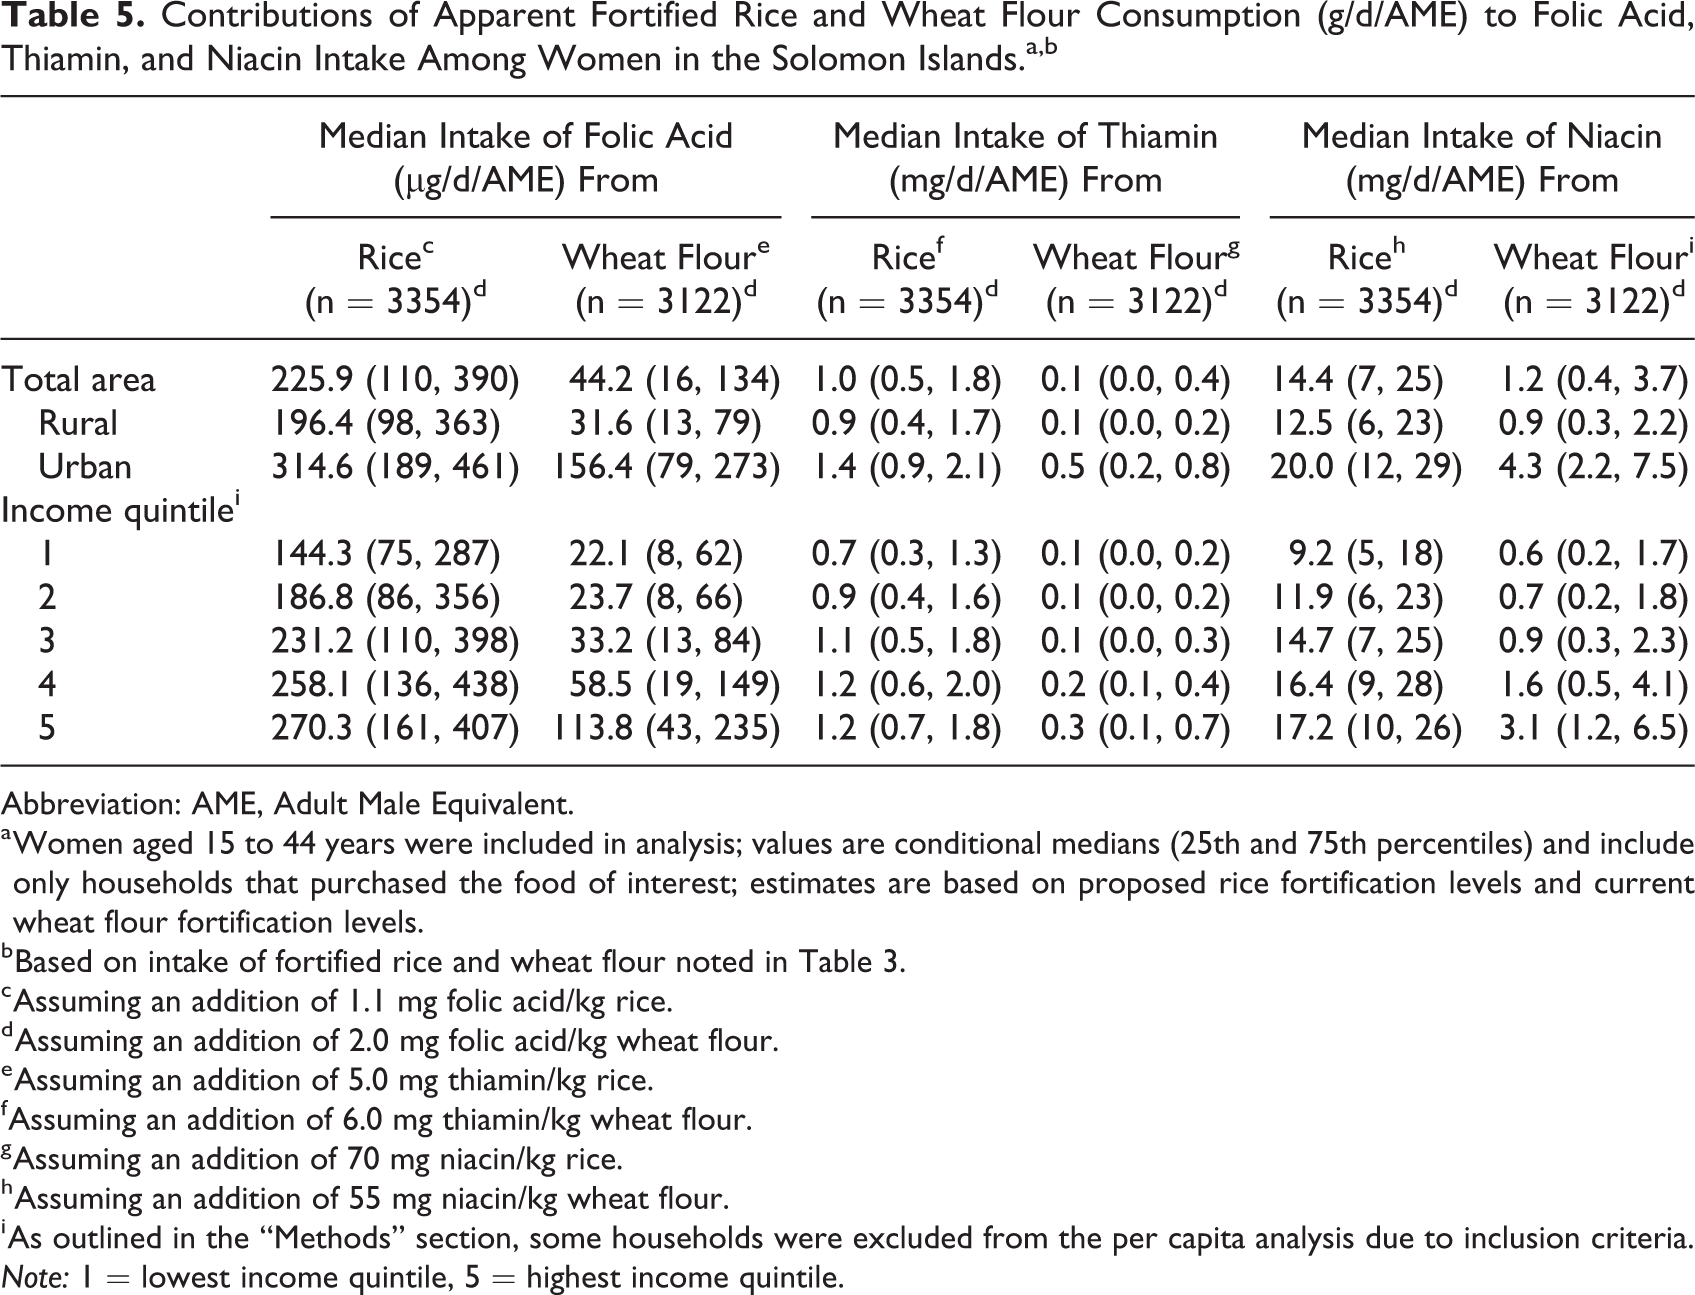
Based on the total median apparent intake of rice, women could consume 12.3 mg iron/d and 9.2 mg zinc/d if rice were fortified to levels being proposed by the FFNC (Table 4). On average, women could consume 1.0 mg iron/d and 0.7 mg zinc/d through apparent consumption of wheat flour fortified according to the country’s standard. The apparent median intake of rice (205.4 g) could provide women 225.9 µg folic acid/d, 1.0 mg thiamin/d, and 14.4 mg niacin/d (Table 5). The apparent median consumption of wheat flour (22 g) by women could provide 44 µg folic acid/d, 0.1 mg thiamin/d, and 1.2 mg niacin/d.
Contributions of Apparent Fortified Rice and Wheat Flour Consumption (g/d/AME) to Folic Acid, Thiamin, and Niacin Intake Among Women in the Solomon Islands.a,b
Abbreviation: AME, Adult Male Equivalent.
a Women aged 15 to 44 years were included in analysis; values are conditional medians (25th and 75th percentiles) and include only households that purchased the food of interest; estimates are based on proposed rice fortification levels and current wheat flour fortification levels.
b Based on intake of fortified rice and wheat flour noted in Table 3.
c Assuming an addition of 1.1 mg folic acid/kg rice.
d Assuming an addition of 2.0 mg folic acid/kg wheat flour.
e Assuming an addition of 5.0 mg thiamin/kg rice.
f Assuming an addition of 6.0 mg thiamin/kg wheat flour.
g Assuming an addition of 70 mg niacin/kg rice.
h Assuming an addition of 55 mg niacin/kg wheat flour.
i As outlined in the “Methods” section, some households were excluded from the per capita analysis due to inclusion criteria.
Note: 1 = lowest income quintile, 5 = highest income quintile.
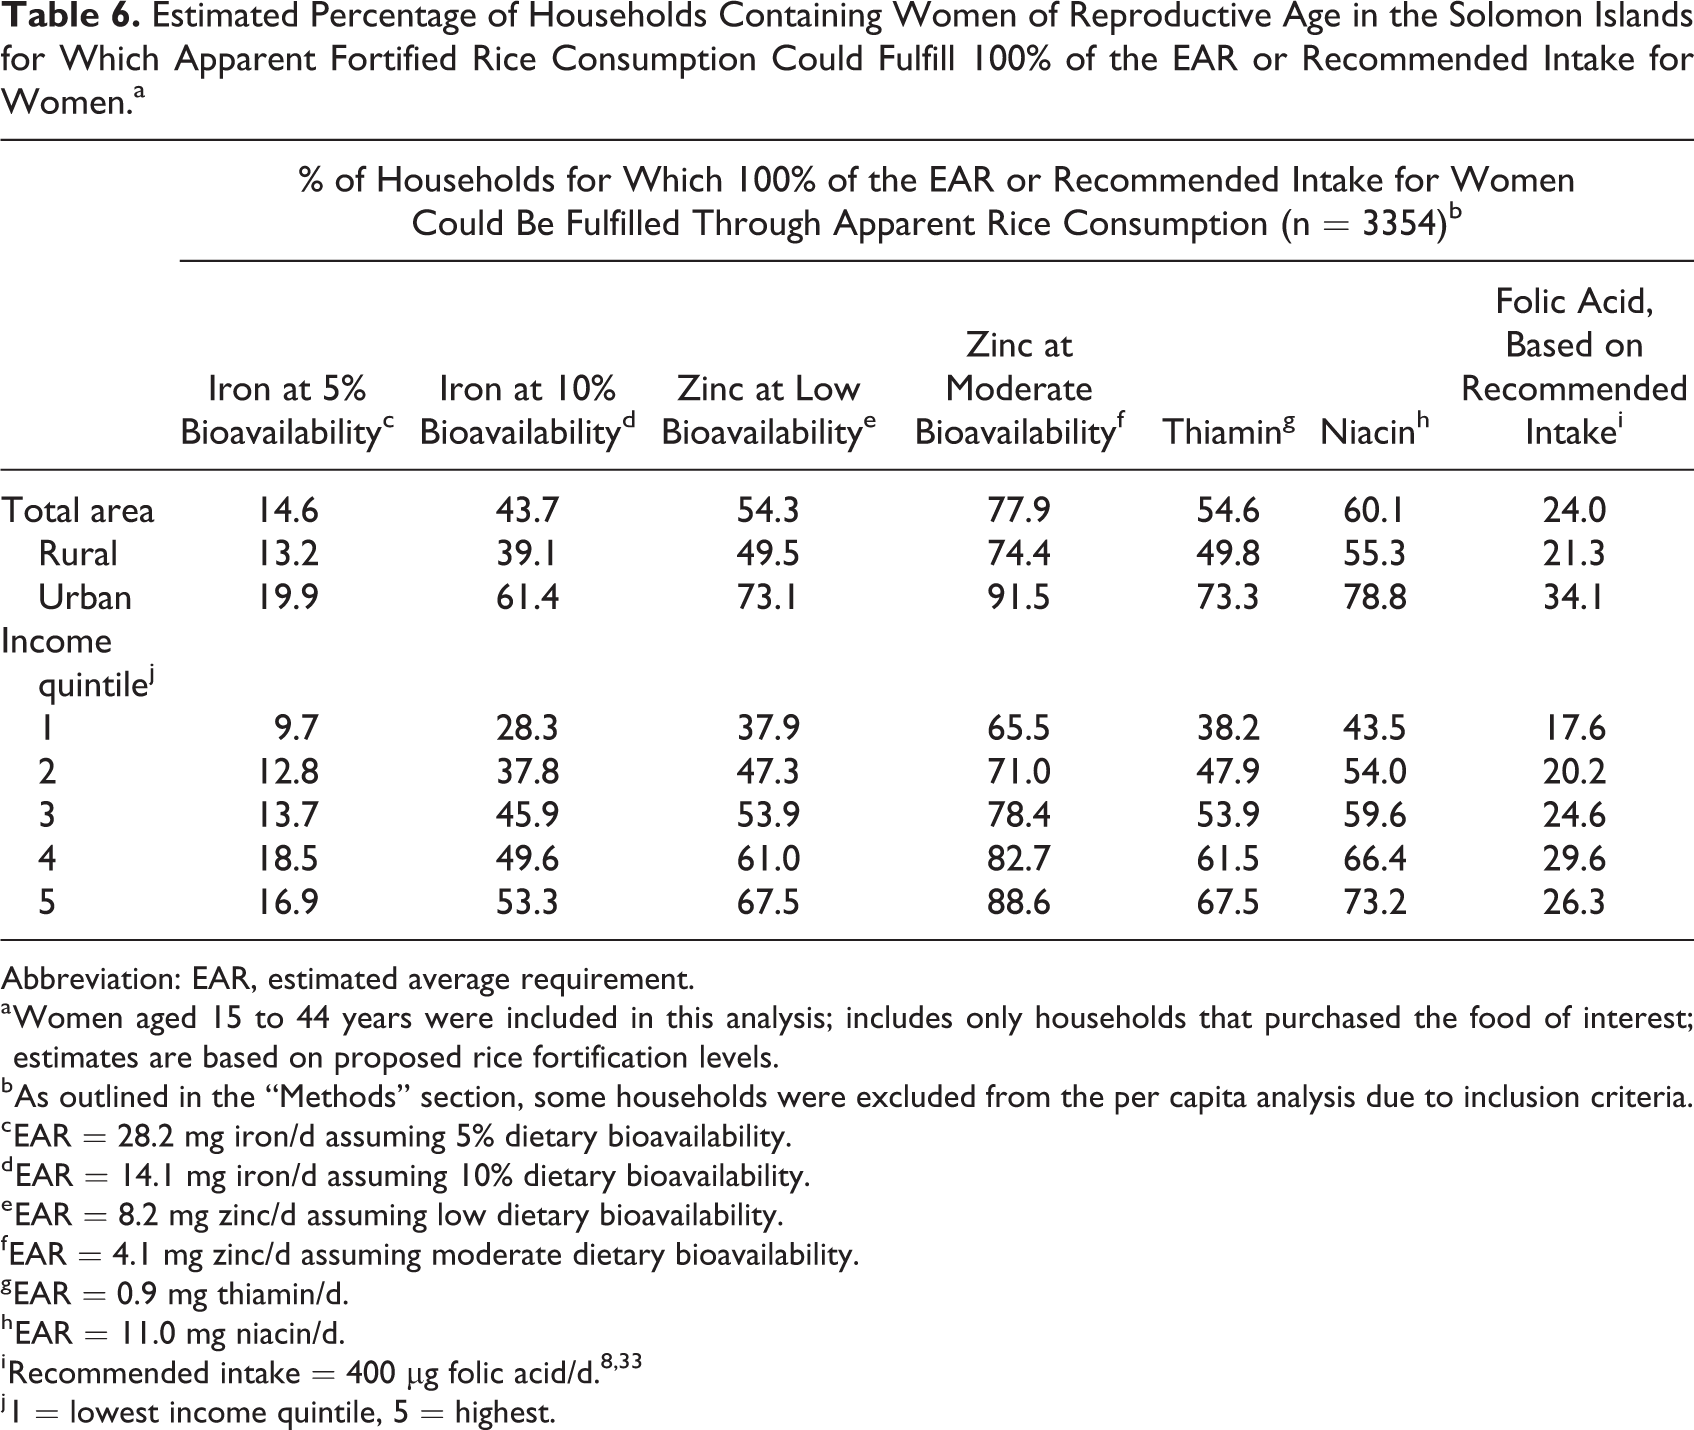
We estimated the percentage of households containing women for which 100% of the EAR could be fulfilled through apparent consumption of fortified rice or wheat flour. Table 6 shows that, with total median apparent consumption of 205.4 g, apparent rice consumption could fulfill 100% of the EAR for iron and zinc in 15% and 54% of households, respectively, assuming low dietary bioavailability. Fifty-five percent, 60%, and 24% of households could fulfill 100% of the EAR for thiamin, niacin, and WHO’s recommended intake of folic acid, respectively. Apparent wheat flour consumption was low, resulting in 0% of households achieving the EAR for iron (at 5% and 10% bioavailability), zinc (at low and medium bioavailability), thiamin, niacin, and folic acid through consumption of fortified wheat flour; 0% was also calculated for all nutrients for data disaggregated by area and income quartile (data not shown).
Estimated Percentage of Households Containing Women of Reproductive Age in the Solomon Islands for Which Apparent Fortified Rice Consumption Could Fulfill 100% of the EAR or Recommended Intake for Women.a
Abbreviation: EAR, estimated average requirement.
a Women aged 15 to 44 years were included in this analysis; includes only households that purchased the food of interest; estimates are based on proposed rice fortification levels.
b As outlined in the “Methods” section, some households were excluded from the per capita analysis due to inclusion criteria.
c EAR = 28.2 mg iron/d assuming 5% dietary bioavailability.
d EAR = 14.1 mg iron/d assuming 10% dietary bioavailability.
e EAR = 8.2 mg zinc/d assuming low dietary bioavailability.
f EAR = 4.1 mg zinc/d assuming moderate dietary bioavailability.
g EAR = 0.9 mg thiamin/d.
h EAR = 11.0 mg niacin/d.
j 1 = lowest income quintile, 5 = highest.
If rice were fortified at levels currently being proposed, it could potentially provide 44% and 113% of daily EAR for iron and zinc, respectively, in women (assuming low dietary bioavailability; Figure 2A). Additionally, based on apparent intake, rice could supply 57% of the recommended daily intake of 400 µg/d for folic acid, 114% of the EAR for thiamin, and 131% of the EAR for niacin in women. Assuming wheat flour is fortified to current SI standards, apparent wheat flour consumption could fulfill approximately 4% and 8% of the daily EAR for iron and zinc, respectively, and 11% of the recommended intake of folic acid (Figure 2B). In urban areas (18% of the total population), apparent fortified wheat flour consumption could provide 13% and 29% of the daily EAR for iron and zinc, respectively, assuming low dietary availability, and 39% of the recommended daily intake for folic acid (data not shown).
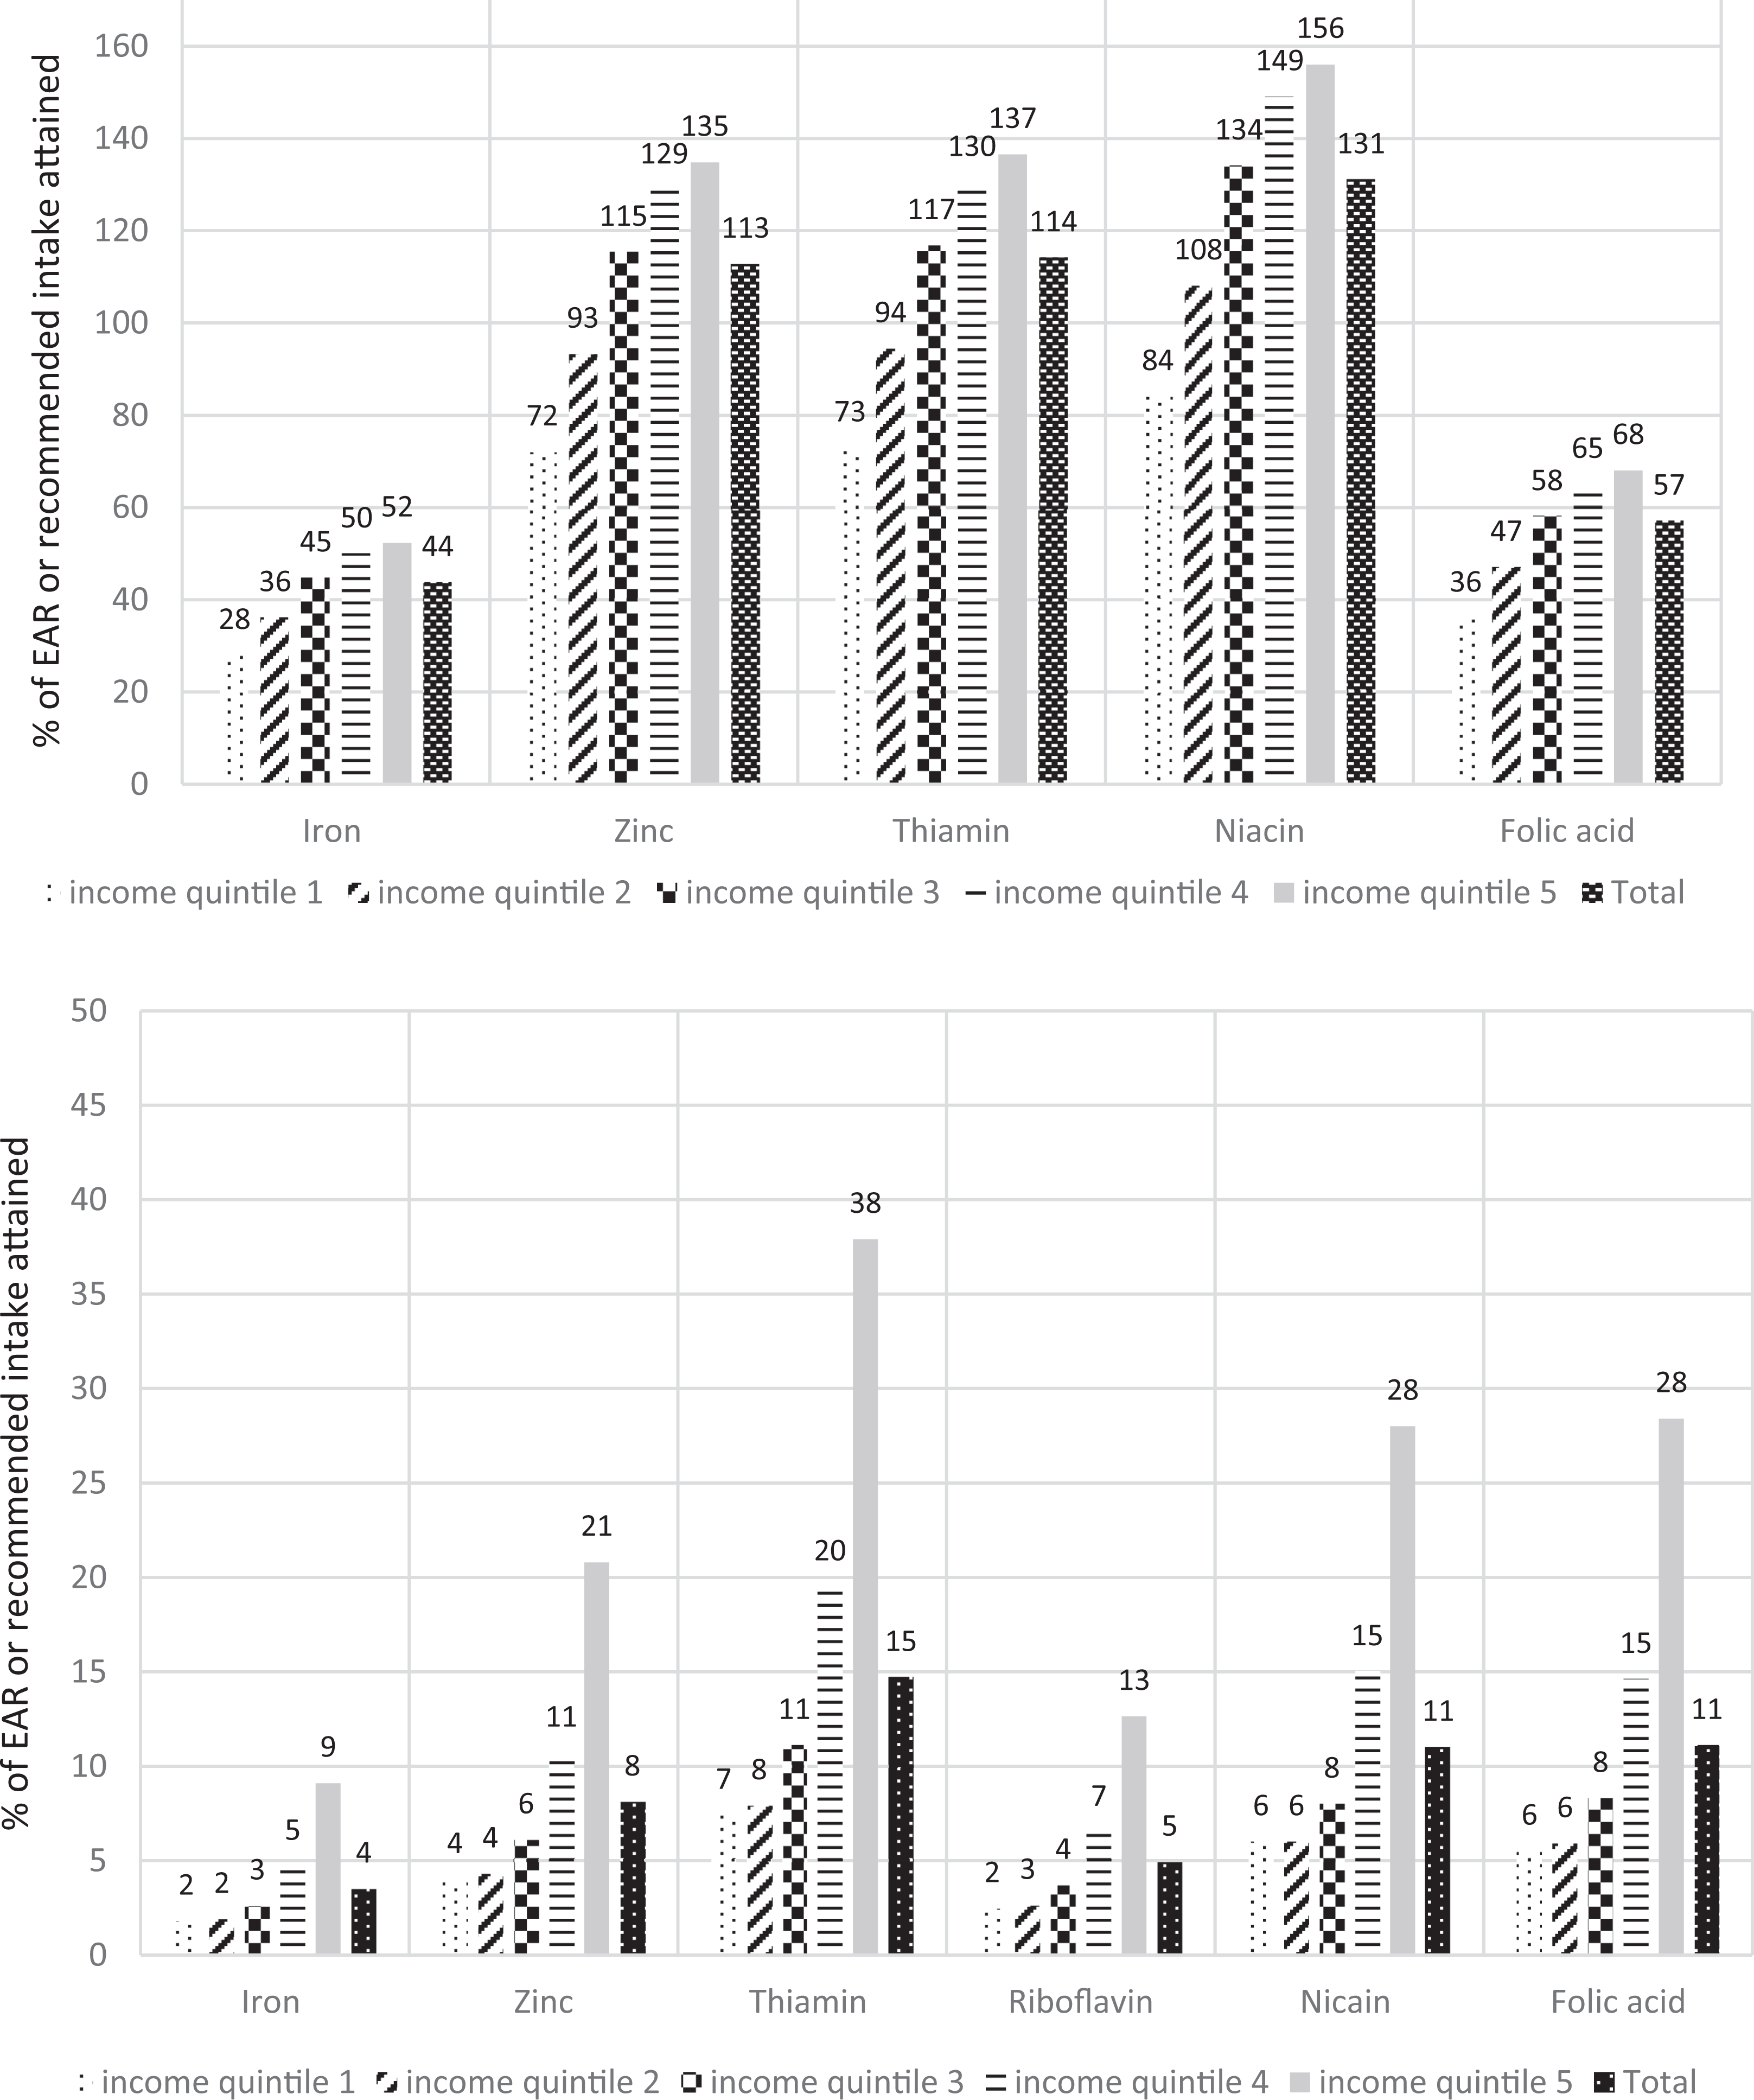
A, Percentage of the estimated average requirement (EAR) for iron, zinc, thiamin, and niacin and recommended daily intake of folic acid fulfilled through apparent consumption of rice by women of reproductive age in the Solomon Islands, by income quintile (n = 3354). Women age 15 to 44 years were included in this analysis; includes only households that purchased the food of interest; estimates are based on proposed rice fortification levels; 1 = lowest income quintile, 5 = highest; EAR: iron = 28.2 mg/d (assuming 5% bioavailability), zinc = 8.2 mg/d (assuming low bioavailability), thiamin = 0.9 mg/d, niacin = 11 mg/d; WHO’s recommended folic acid intake = 400 µg/d. 8,32,33 As outlined in the “Methods” section, some households were excluded from the per capita analysis due to inclusion criteria. B, Percentage of the estimated average requirement (EAR) for iron, zinc, thiamin, riboflavin, and niacin and recommended daily intake of folic acid fulfilled through apparent consumption of fortified wheat flour by women of reproductive age in the Solomon Islands, by income quintile (n = 3122). These are foods made with fortified wheat flour (ie, industrially milled flour produced or imported to Solomon Islands), not including imported wheat flour foods produced abroad, which are not guaranteed to be fortified per the Solomon Islands standard; women aged 15 to 44 years were included in this analysis; includes only households that purchased the food of interest; 1 = lowest income quintile, 5 = highest; EAR: iron = 28.2 mg/d, zinc = 8.2 mg/d, thiamin = 0.9 mg/d, riboflavin = 0.9 mg/d, niacin = 11 mg/d; WHO’s recommended folic acid intake = 400 µg/d. 8,32,33 WHO indicates World Health Organization.
Discussion
Using population-based 2012-2013 HIES data from the SI, we quantified apparent rice and wheat flour consumption among WRA and estimated the potential contribution to micronutrient intake recommendations. Overall, rice is apparently consumed more widely and in much higher quantities than wheat flour. We found that 96% of households purchased rice in the previous 14 days, and among those households, median apparent intake in women was 205.4 g/d/AME, which, under proposed fortification guidelines, could fulfill approximately 44% of the EAR for iron. Fortified rice could also contribute appreciably to apparent folic acid intake in women, supplying 225.9 µg/d. Additionally, apparent fortified rice intake could fulfill 113%, 114%, and 131% of the EAR for WRA for zinc, thiamin, and niacin, respectively. Although fortified wheat flour-containing foods were purchased by 87% of households, these foods were apparently consumed in much lower quantities than rice (22 g/d/AME among women). Median total apparent consumption of fortified wheat flour-containing foods could fulfill 4% and 8% of the EAR for iron and zinc, respectively, and 11%, 15%, 5%, and 11% of the recommended daily folic acid, thiamin, riboflavin, and niacin intake.
We sought to address the key public health question of whether nutritionally vulnerable populations in the SI, especially women, could potentially benefit from rice and wheat flour fortification. Our results indicate that although apparent rice consumption was indeed greater in higher income and urban households, consumption may be high enough in poorer and/or rural households to fulfill at least 25% of the EAR for iron, B vitamins including folic acid, and zinc intake. Women in the poorest households (income quintiles 1 or 2) apparently consumed 131 to 170 g rice/d/AME, providing 28% to 36% of the EAR for iron and 36 to 47% of the recommended intake of folic acid. In contrast, apparent fortified wheat flour consumption was quite low in the poorest households (<12 g/d/AME in income quintiles 1 and 2) and fulfilled <10% of the EAR for all nutrients analyzed.
The WHO’s 2009 recommendations for fortifying wheat and maize flour suggest that with average consumption levels of one staple food below 75 g/d/person, another staple food vehicle should be fortified to increase micronutrient intake among WRA. 34 Women living in urban households in the SI met this cutoff, consuming an apparent median of 78 g of fortified wheat flour/d/AME; however, the urban population (most of them living in the capital of Honiara) comprises only approximately 18% of the SI’s total population. Women living in the other 82% of households (the rural population) consumed an apparent median of 16 g of fortified wheat flour/day/AME. These findings suggest that the addition of another fortified staple food, such as rice, could especially benefit populations living in rural areas.
We did not identify any reliable population-based individual or household rice or wheat flour consumption estimates from the SI to compare our findings; however, FAO Food Balance Sheet data are available. 35 Based on FAO 2013 Food Balance Sheet data, median availability estimates for wheat flour and rice were 52 and 175 g/d/person, respectively. Private sector wheat flour and rice import data are also available from food producers such as Delite, Punjas, and Solrice, and these estimates indicate sales of 70 g wheat flour/d/person and 224 g rice/d/person. 19 Our estimate of wheat flour consumption (22 g/d/AME) was lower than both FAO and industry estimates, and our estimate of rice consumption fell between the 2 estimates (205 g/d/AME). Differences in estimates might be attributed to the following factors: (1) we adjusted apparent intake using AME units, rather than just dividing the amount of food purchased/imported by the total population, (2) we did not include imported noodles/pasta in our wheat flour estimates, and/or (3) we do not know if the other estimates were based on the same conversion factors as our estimates (when converting wheat flour-containing foods to FWFEs). The FAO data provide important information about the food supply; however, these data do not include information about household consumption patterns such as distribution of food.
There have been many success stories showcasing the benefits of staple food fortification. 9 Within the Western Pacific Region, for example, a pre–post survey in Fiji showed an increase in serum ferritin (by 25 µg/L) and a decreased prevalence of anemia (prevalence in WRA decreased from 40% to 28%), iron deficiency anemia, zinc deficiency, and folate deficiency in Fijian women after the introduction of mandatory wheat flour fortification. 36 This evidence of a public health impact of fortification, within the context of the same Western Pacific region, supports the potential for fortification in the SI to impact health in nutritionally vulnerable groups.
Tolerable Upper Intake Levels
Tolerable upper intake levels (ULs) are defined by the IOM as “the highest level of daily nutrient intake that is likely to pose no risk of adverse health effects.” 31 Estimated zinc intake in the highest apparent rice consumers (urban, at 12.9 mg/d) was far below the UL of 40 mg/d. 31 If rice were fortified to the levels proposed by the FFNC, estimated iron intake among the highest consumers (women living in urban areas, where median apparent intake of iron was 17.2 mg/d) would be less than half of the UL of 45 mg/d. Intake of folic acid through apparent consumption of fortified rice in urban women (315 µg/d) is much lower than the UL of 1000 µg/d. 33 Higher than recommended intakes of the water-soluble B vitamins including thiamin, riboflavin, and niacin are unlikely to cause any adverse health outcomes, and therefore, no UL has been established. 33 We also examined households containing WRA who purchased fortified wheat flour-containing foods and rice and found that even among the highest consumers, intake did not exceed the UL for zinc, iron, or folic acid. Women in the highest income quintile would consume approximately 17 mg iron/d, 384 µg folic acid/d, and 12.8 mg zinc/d. Women living in urban areas, those who consume the largest amount of wheat flour + rice, would consume 21 mg iron/d, 471 µg folic acid/d, and 21 mg zinc/d, which is below the UL for iron, folic acid, and zinc, respectively. Based on our analysis, women would not exceed the UL for iron, zinc, or folic acid if rice were fortified to levels proposed by the FFNC and if it were consumed in quantities similar to apparent consumption levels in 2012 to 2013. Given the low consumption of wheat flour, no populations were estimated to exceed ULs for any nutrients through fortified wheat flour intake. Furthermore, women who consumed both rice and fortified wheat flour-containing foods would consume less than half of the UL for iron, zinc, and folic acid.
Strengths and Limitations
Household Income and Expenditure Surveys are designed to collect information about household expenditures and income; therefore, household purchases served as a proxy for consumption in our analysis. Although this measure of food consumption is not ideal, one study comparing HIES food purchasing data with a 24-hour dietary recall found a close correlation between the 2 estimates for most nutrients. 37 Additionally, this method for measuring apparent food intake has been used in multiple analyses. 22,24 -26,37 We assumed that food was distributed within the household according to energy needs, and we based intrahousehold consumption estimates on that assumption by using AME adjustments. We acknowledge that food is not always distributed equitably in households; however, information on intra-household distribution of food was not available in this data set. We did not account for food wastage or spoilage and assumed that all purchased food was consumed. Although we assume minimal food wastage, especially in poor households, we acknowledge that food is inevitably wasted and that wastage patterns may vary by individual, household, culture, and/or socioeconomic status. Our estimates should be interpreted with the knowledge that many factors may influence household consumption of purchased food including but not limited to food wastage, food allocation within households, and individual consumption patterns/food preferences. We did not include imported wheat flour-containing foods in our fortified wheat flour estimates and therefore likely underestimated nutrient intake from imported foods, such as pasta/noodles, made with fortified wheat flour (eg, neighboring countries with mandatory wheat flour fortification such as Fiji, Australia, and Indonesia export food to the SI). We also do not account for food eaten outside the home, which might result in an underestimation of rice and/or wheat flour intake in some populations. We analyzed the most recent available SI HIES data, from 2012 to 2013, and assume that food consumption patterns have not changed appreciably since that time. Our analysis has several strengths, including the use of data from a large, national, population-based survey that included household information such as income quintile, area of residence, and province. These data were weighted, allowing for population estimates. Seasonal differences were accounted for, as the survey was conducted over 12 continuous months. Information about household food purchases was collected over 14 continuous days, significantly more days than many dietary intake surveys conducted at national level. Finally, there are no consumption surveys available in SI. Since HIES surveys are already routinely conducted for other purposes in the SI and their data are readily available, they provide a cost-effective means to estimate food consumption.
Conclusions
Results from the 2012-2013 SI HIES indicate that rice, which is not currently fortified in the SI, could be an excellent future fortification vehicle for improving micronutrient intake and achieving broad population coverage. Rice was purchased by 96% of households, indicating that potential coverage is nearly universal. Additionally, the nutritionally vulnerable population of WRA apparently consumed high enough quantities of rice (205 g/d/AME) to increase intake of iron, zinc, folic acid, thiamin, and niacin (the nutrients currently proposed for rice fortification). There is precedence for fortification in the SI through its mandatory wheat flour fortification regulations, and the FFNC is committed to building the institutional infrastructure and knowledge needed for monitoring and evaluating the national fortification program. The potential public health impact of a food fortification program relies, in part, on the appropriate selection of a food vehicle and adequate consumption of that fortifiable food among nutritionally vulnerable groups and successful private–public partnerships that sustain fortification and monitoring efforts. 38,39 The combination of high coverage and apparent high consumption of rice among all socioeconomic groups and regions and the existence of a successful wheat flour fortification program with established public–private partnerships could potentially result in a rice fortification program that delivers meaningful quantities of key micronutrients to WRA in the SI. Fortified wheat flour-containing foods are not apparently consumed in high enough quantities to contribute appreciably to micronutrient intakes in rural or poor populations, which constitute the majority of the SI’s population. However, apparent wheat flour intake is higher in urban households and its fortification likely benefits the urban population. In the SI, complementing the preexisting mandatory wheat flour fortification program with mandatory rice fortification may broaden the reach of increased nutrient intake in rural and poorer households.
Footnotes
Acknowledgments
The authors would like to thank Huimin (Mia) Zhong for her assistance with the final statistical revision.
Authors’ Note
Helena Pachón's time was supported by an agreement between the United States Centers for Disease Control and Prevention (CDC), McKing Consulting Corporation, and Emory University.
Declaration of Conflicting Interests
The author(s) declared no potential conflicts of interest with respect to the research, authorship, and/or publication of this article.
Funding
The author(s) disclosed receipt of the following financial support for the research, authorship, and/or publication of this article. This analysis was funded by the Department of Foreign Affairs and Trade under the Government of Australia.