
Abstract
Background:
Polyunsaturated fatty acid (PUFA) intake is low throughout Latin America. Improving PUFA status could be an effective intervention against chronic disease, but information on sociodemographic and dietary patterning of PUFA status in the region is limited.
Objective:
To characterize sociodemographic, anthropometric, and dietary predictors of PUFA status biomarkers in adipose tissue among children and their parents from Mesoamerica.
Methods:
This was a cross-sectional study of 220 children aged 7 to 12 years and 471 parents from capital cities of Guatemala, El Salvador, the Dominican Republic, Honduras, Nicaragua, Panama, Costa Rica, and Belize, as well as Tuxtla Gutiérrez in Mexico. The PUFA from gluteal adipose tissue was quantified using gas chromatography. Participants reported sociodemographic information and the type of vegetable oil used for cooking. We estimated percent mean differences in linoleic acid (LA), total long-chain n-6 PUFA (n-6 LCPUFA), α-linolenic acid (ALA), and total long-chain n-3 PUFA (n-3 LCPUFA) between levels of predictors using multivariable-adjusted linear regression models.
Results:
Country was the strongest predictor of any PUFA, whereas body mass index was positively associated with n-6 LCPUFA in children and adults. Cooking primarily with soybean oil was positively associated with LA in children and adults and ALA in adults. Cooking with canola oil was positively related to n-6 LCPUFA in adults and n-3 LCPUFA in children and adults. Cooking with palm oil was associated with low adipose tissue levels of all n-6 and n-3 PUFA.
Conclusions:
Adipose tissue PUFA status in Mesoamerica is associated with country of origin and the type of oil used for cooking.
Highlight
Adipose tissue polyunsaturated fatty acids in Mesoamerican children and their parents are associated with country of origin and the type of vegetable oil used for cooking.
Introduction
Polyunsaturated fatty acids (PUFAs) are nutrients required for a wide range of physiologic functions that exert important health effects. The n-6 PUFA linoleic acid (18:2 n-6; LA) and the n-3 PUFA α-linolenic acid (18:3 n-3; ALA) are essential because they cannot be synthesized by humans and must be obtained through diet, primarily from plant oils. Long-chain n-6 and n-3 PUFAs (n-6 and n-3 LCPUFA) are produced through endogenous metabolism of LA and ALA 1 and can also be obtained preformed in the diet from meat or eggs (n-6 LCPUFA) and fatty fish (n-3 LCPUFA). The LCPUFAs serve as precursors for eicosanoids, a class of signaling molecules that regulate immune and cardiovascular function. Many of the eicosanoids derived from n-6 LCPUFA are proinflammatory, whereas those derived from n-3 LCPUFA are generally anti-inflammatory. 1 In adults, n-3 LCPUFA intake is associated with reduced risk of cardiovascular disease, some cancers, and mood or cognitive disorders. 2 The ALA may also be cardioprotective. 3 Evidence for the effects of LA and n-6 LCPUFA on cardiovascular disease and its risk factors is less conclusive. 4 The PUFA intake has also been related to cardiometabolic risk factors in children. 5,6
The PUFA intake in Latin American adults and children may be inadequate. 7 -9 Fish and vegetable oils high in ALA are scarce in many countries. 10 Low PUFA intake in this region is of particular concern because the rates of cardiovascular disease, 11 childhood obesity, 12 and childhood metabolic dysregulation 13 are high. Improving PUFA status through dietary interventions might be a useful public health measure against chronic disease. 14 One potential target for intervention is the choice of vegetable oil used for cooking in the home, since vegetable oil is an important predictor of PUFA intake and status. 7,14 However, current and detailed information about PUFA status in Latin American populations is lacking. It is unclear whether PUFA status varies according to demographic, socioeconomic, or anthropometric characteristics, which makes it difficult to identify specific populations that might benefit most from interventions. Studies of PUFA and cooking oil are limited and their results may not be generalizable to other countries and populations. Many previous studies relied on dietary methods to estimate PUFA intake, which may be subject to errors due to recall or inaccurate estimation of the fatty acid content of foods. Moreover, these measures may not accurately reflect physiological PUFA status especially with respect to LCPUFA, which can be endogenously metabolized. Adipose tissue fatty acids are the gold-standard biomarkers of fatty acid status because they have a half-life of 6 to 9 months 15,16 and thus reflect long-term intake; nevertheless, they are seldom ascertained in population studies.
We conducted a cross-sectional study to examine sociodemographic, anthropometric, and dietary correlates of adipose tissue PUFA biomarkers among school-aged children and their parents in Mesoamerica and the Dominican Republic.
Methods
Study Design and Population
We conducted a cross-sectional investigation of school children and their parents in the context of the Nine Mesoamerican Countries Metabolic Syndrome Study. Details of the study design have been described previously. 17 In brief, between July 2011 and November 2013, we identified families from the capital cities of Guatemala, El Salvador, the Dominican Republic, Honduras, Nicaragua, Panama, Costa Rica, and Belize, and the city of Tuxtla Gutiérrez in Chiapas, Mexico, with use of public primary school enrollment lists in each city. From these lists, study teams randomly selected potentially eligible students who were 7 to 12 years of age. Additional eligibility criteria were assessed at school visits; these included that the child lived with both biological parents, that neither the child nor their mother was pregnant, and that the child did not have any siblings already invited to participate. Parents of children who met all inclusion criteria were offered enrollment. The final sample comprised 267 families (Guatemala, 31; El Salvador, 30; the Dominican Republic, 30; Honduras, 30; Nicaragua, 31; Panama, 26; Costa Rica, 27; Belize, 31; and Mexico, 31).
This study was conducted according to the guidelines laid down in the Declaration of Helsinki. All procedures involving human participants/patients were approved by the institutional review boards (IRB) of collaborating institutions in each of the 9 countries and by the University of Michigan Health and Behavioral Sciences IRB. All parents provided written informed consent to participate for themselves and their children. Assent to participate was confirmed from the children before enrollment.
Data Collection
All data collection procedures took place at home or at a family visit to a health center. Participants were asked to fast for at least 6 hours before the appointment. At this visit, mothers completed a background questionnaire that included questions on each participant’s age, education level, and smoking status, as well as socioeconomic status (SES) indicators. Food security was assessed with the Latin American and Caribbean Food Security Scale, an instrument that has been validated for use in this region. 18 The scale consists of 16 yes/no questions about experiences of food insecurity over the previous 3 months. Trained research assistants also administered a questionnaire that asked about the use of vegetable oil, butter, margarine, and lard/shortening for cooking. In the case of vegetable oil, participants were also asked about the type of oil they used most commonly, from a list that included soybean, canola, corn, sunflower, palm, vegetable blends, olive, or other. If participants indicated that they used a particular type of cooking fat, they were asked to report the brand they typically used.
Anthropometric measures were obtained from each participant with use of standardized procedures and calibrated instruments. Height was measured without shoes to the nearest millimeter with the use of portable Seca stadiometers (Seca, Hamburg, Germany). Weight was measured in light clothing to the nearest 100 g with use of Tanita scales (Tanita, Tokyo, Japan). All measures were obtained in triplicate.
At the end of the visit, researchers obtained samples of subcutaneous adipose tissue from each family member. Participants were asked to lie facing downward on a stretcher or bed. After numbing the upper external area of the left gluteus with an ice pack and a local anesthetic spray, a 16-gauge, 1.5 inch long needle was inserted at a 45° angle and adipose tissue was aspirated into the syringe. 19 Samples were transported on ice to laboratories in each country where they were stored in a 3:2 hexane:isopropanol solution in amber vials at −70°C. The samples were transported frozen from their respective countries to the Institute of Nutrition of Central America and Panama in Guatemala City, and from there to the University of Michigan for fatty acid analysis.
Laboratory Methods
Analysis of adipose tissue fatty acids was completed at the University of Michigan Regional Comprehensive Metabolomics Resource Core. Total lipids were extracted from 20 to 25 mg of adipose tissue according to the method described by Bligh and Dyer, 20 with 10 μL of 4 mM nonadecanoic acid (C19:0) added as an internal standard. The fatty acid components of the total lipids were then derivatized into their methyl esters using boron trifluoride-methanol. 21 The methyl esters were extracted with a 2:1 hexane–water mixture and centrifugation. The hexane layer was removed and dried and the methyl esters were redissolved in 100 to 200 μL of hexane, depending on the volume of the original sample. Fatty acids were analyzed by gas chromatography (GC). One to 2 μL of sample was injected via an auto-sampler onto an Agilent 6890N gas chromatograph (Agilent, Santa Clara, California) equipped with a flame ionization detector, a 100 m × 0.25 mm × 0.2 μm SP-2560 column (Sigma-Aldrich, Bellefonte, Pennsylvania), and Chemstation software version B.04 for data analysis. Fatty acids were quantified using a calibration curve prepared from known amounts of C19:0 (the internal standard) and other authentic methyl esters. The authentic methyl esters were also used to identify the fatty acids in samples by comparing retention times. The coefficient of variation for GC analyses was between 2.5% and 3.6%.
Data Analyses
Adipose tissue samples were available in 220 children and 471 parents; these constituted the analytic sample. The primary outcomes were 4 adipose tissue biomarkers of PUFAs, expressed as weight percentages of the total fatty acids measured in a sample (FA%): (1) LA; (2) n-6 LCPUFA (sum of eicosadienoic acid, dihomo-γ-linolenic acid, arachidonic acid, and adrenic acid); (3) ALA; and (4) n-3 LCPUFA (sum of eicosapentaenoic acid, docosapentaenoic acid, and docosahexaenoic acid).
Sociodemographic exposures included sex, age, education level, smoking status, number of household assets, food security, and country of origin. Parental education was categorized according to the number of completed school years (incomplete elementary, 1-5; complete elementary, 6; incomplete secondary, 7-11; complete secondary, 12; or postsecondary, ≥13). Adults were classified as never, past, or current smokers. We determined the number of assets each family had from a list, including a car, bicycle, refrigerator/freezer, gas stove, electric stove, blender, microwave, washing machine, color TV, sound set, computer, and Internet. We created a household food insecurity score as the sum of all affirmative answers to the survey and categorized it as none (0), mild (1-5), moderate (6-10), or severe (11-16). 22 Anthropometric exposures included height and body mass index (BMI, calculated as kg/m2). We estimated the median of the 3 replicate measures obtained. 23 In the adults, height was categorized into sex-specific quartiles and BMI was categorized as <25, 25 to <30, or ≥30. 24 For children, we considered sex, age, height, BMI, the mother’s age at the child’s birth, maternal height, maternal BMI, maternal education level, parental smoking history (the number of parents who ever smoked: none, 1, or 2), number of household assets, food security, and country of origin. Children’s height and BMI were converted into age- and sex-specific Z scores using the World Health Organization Growth Reference for children aged 5 to 19 years. 25
The dietary exposure of interest was the household’s primary cooking oil type (soybean, canola, corn, sunflower, palm, vegetable blends, or other). Oil type was derived from manufacturers’ information about the reported brand of oil in 40% of participants and from directly reported oil type in the rest.
We conducted analyses separately among children and adults. In bivariate analyses, we compared the distribution of each outcome between categories of sociodemographic, anthropometric, and cooking oil type variables with the use of means (standard deviation [SD]). For ordinal predictors, we performed tests for linear trend by introducing a variable representing categories of the predictor as a continuous covariate in a linear regression model. For nominal predictors, we conducted χ2 score tests.
In multivariable analyses, we first log-transformed the PUFA outcomes because their distributions were skewed. We then obtained adjusted percent differences in mean PUFA FA% with 95% confidence intervals using linear regression models with log-transformed PUFA biomarkers as outcomes. All models included sex, age, and country of origin, plus additional predictors that were relevant to each outcome per bivariate analyses. Next, we estimated percent mean differences in each outcome by cooking oil type adjusted for sex, age, education level (adults) or maternal education level (children), and other sociodemographic characteristics that were relevant for the outcome. In the main analyses, country was excluded from these models because it is likely a substantial source of true variability in the exposures; nevertheless, in supplemental analyses, we also fit models in which country was included. The BMI was also excluded because it could be on the causal path between cooking oil and PUFA in adipose tissue. All regression models were fitted using generalized estimating equations and empirical standard errors, which are robust to heteroskedasticity and non-normality. 26 An exchangeable correlation structure was specified in all models for adults to account for clustering by family membership.
We conducted all analyses using Statistical Analysis Software version 9.4 (SAS Institute, Cary North Carolina).
Results
Children
The mean (SD) age of participating children was 10.0 (1.2) years and 52.3% were girls. Unadjusted means (SD) of adipose tissue PUFA in children varied by sociodemographic and anthropometric characteristics (Table 1) and cooking oil type (Supplemental Table 1). The proportion of households using each type of cooking oil differed by country (Supplemental Figure 1).
Mean (SD) of Adipose Tissue n-6 and n-3 Polyunsaturated Fatty Acid Weight Percentages by Sociodemographic Characteristics Among Children From Mesoamerica.
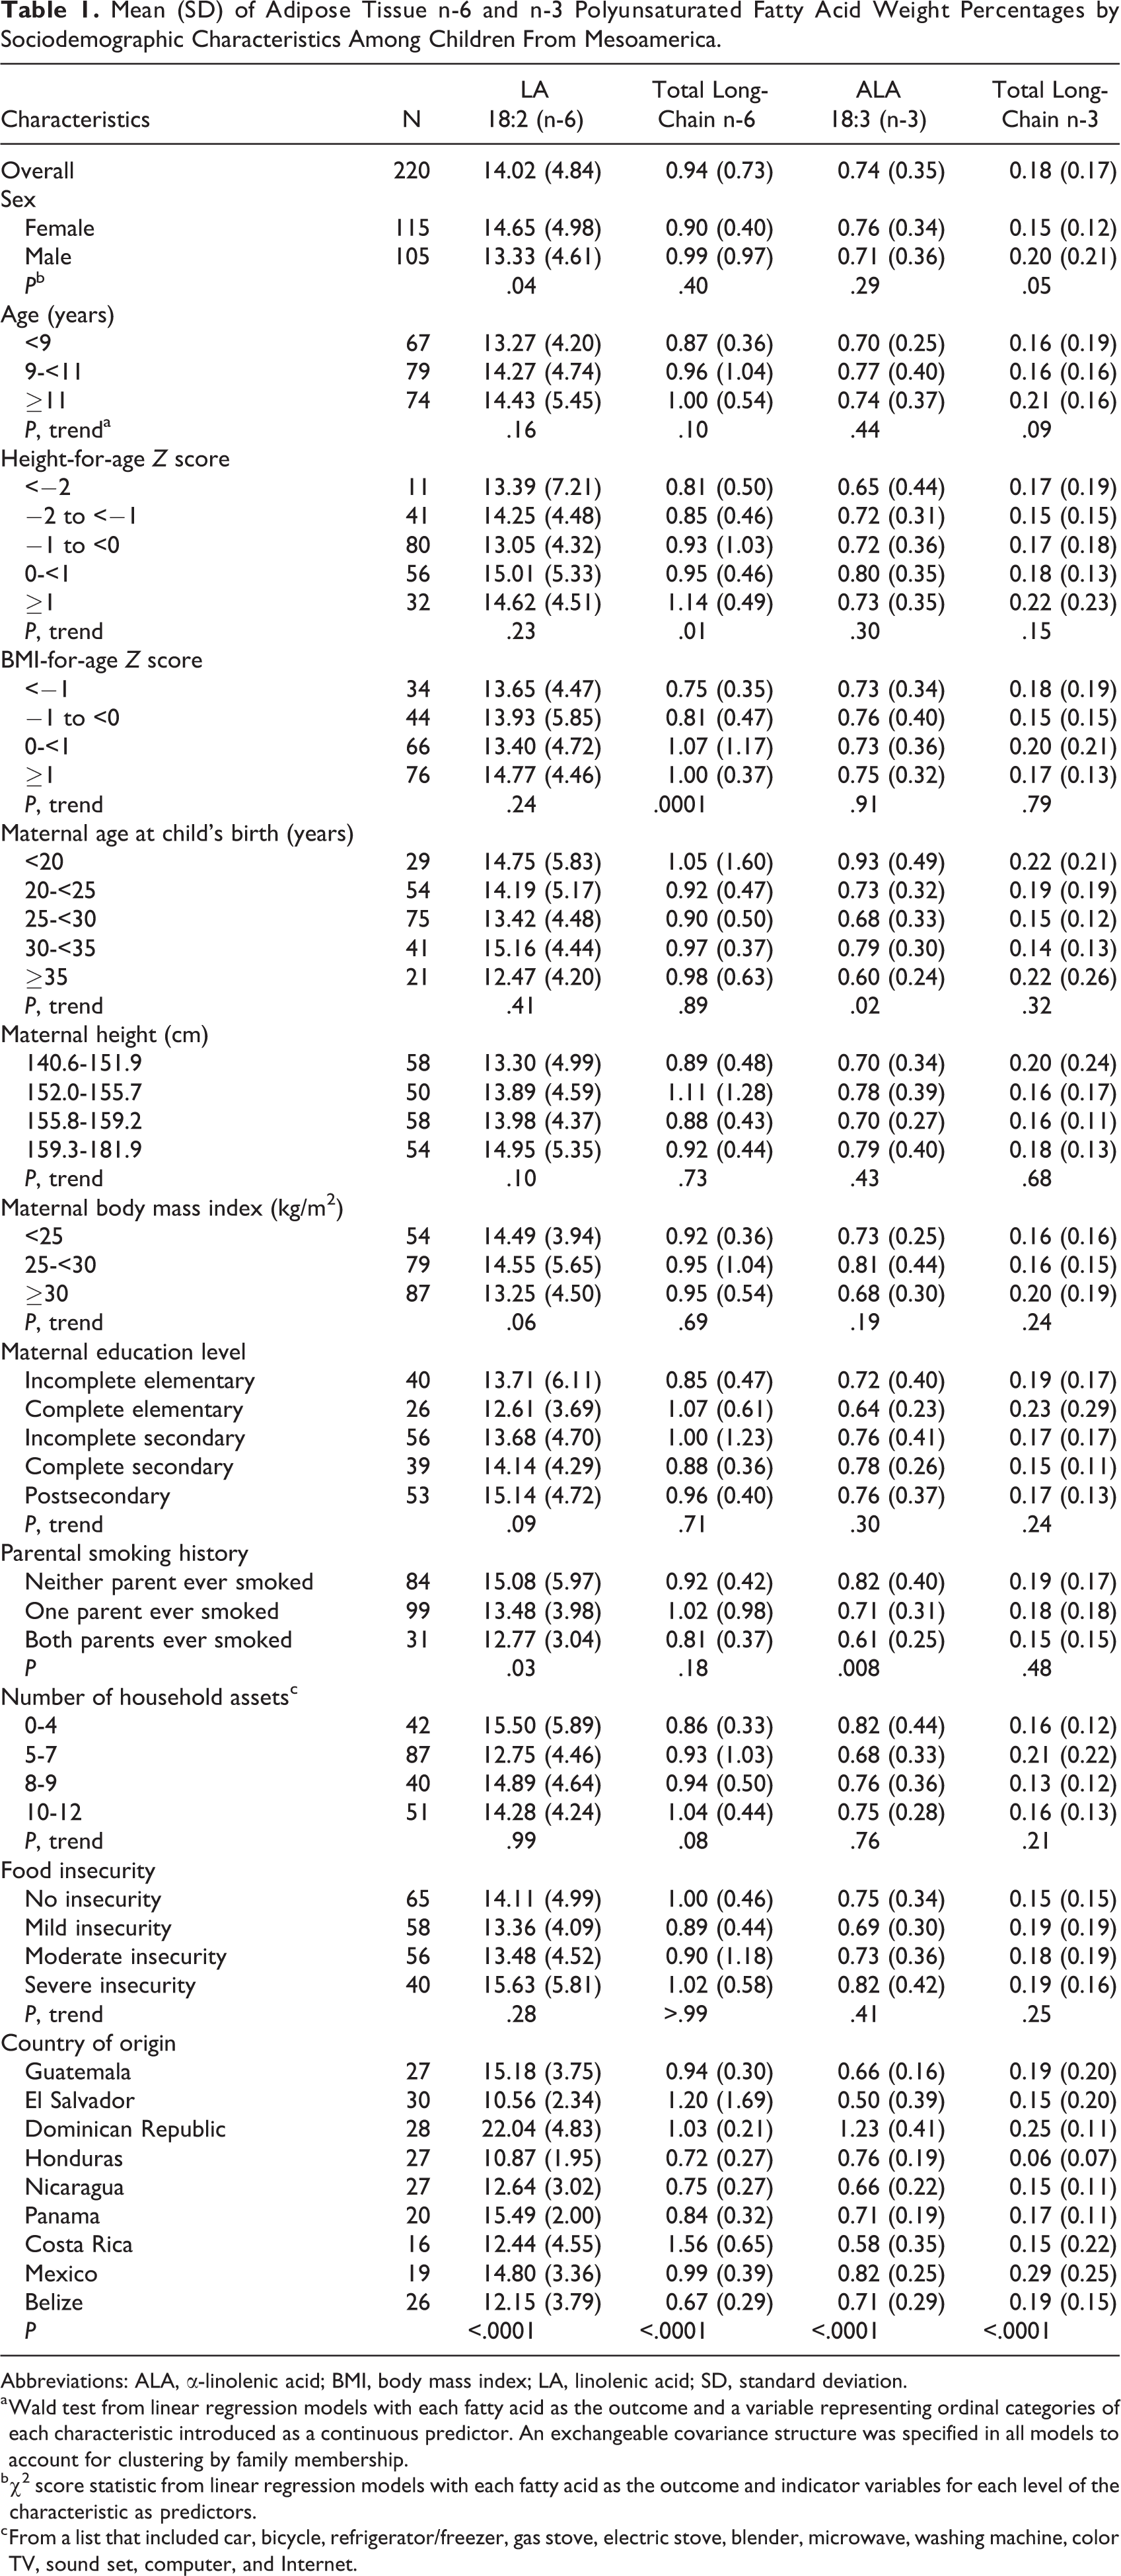
Abbreviations: ALA, α-linolenic acid; BMI, body mass index; LA, linolenic acid; SD, standard deviation.
a Wald test from linear regression models with each fatty acid as the outcome and a variable representing ordinal categories of each characteristic introduced as a continuous predictor. An exchangeable covariance structure was specified in all models to account for clustering by family membership.
b χ2 score statistic from linear regression models with each fatty acid as the outcome and indicator variables for each level of the characteristic as predictors.
c From a list that included car, bicycle, refrigerator/freezer, gas stove, electric stove, blender, microwave, washing machine, color TV, sound set, computer, and Internet.
Linoleic acid
Mean (SD) LA weight percentage was 14.02 (4.84). In adjusted analysis, LA was positively associated with female sex and age (Table 2). Children from the Dominican Republic and Panama had the highest LA FA% whereas children from El Salvador and Honduras had the lowest (P < .0001). The LA was highest among children whose families used soybean oil and lowest among those whose families used palm oil (P = .001; Figure 1A). Simultaneous adjustment for country and cooking oil type attenuated the associations with cooking oil, whereas the associations with country remained similar.
Adjusted Percent Differences (95% CI)a in Means of Adipose Tissue n-6 and n-3 Polyunsaturated Fatty Acids by Sociodemographic Characteristics Among Children From Mesoamerica.
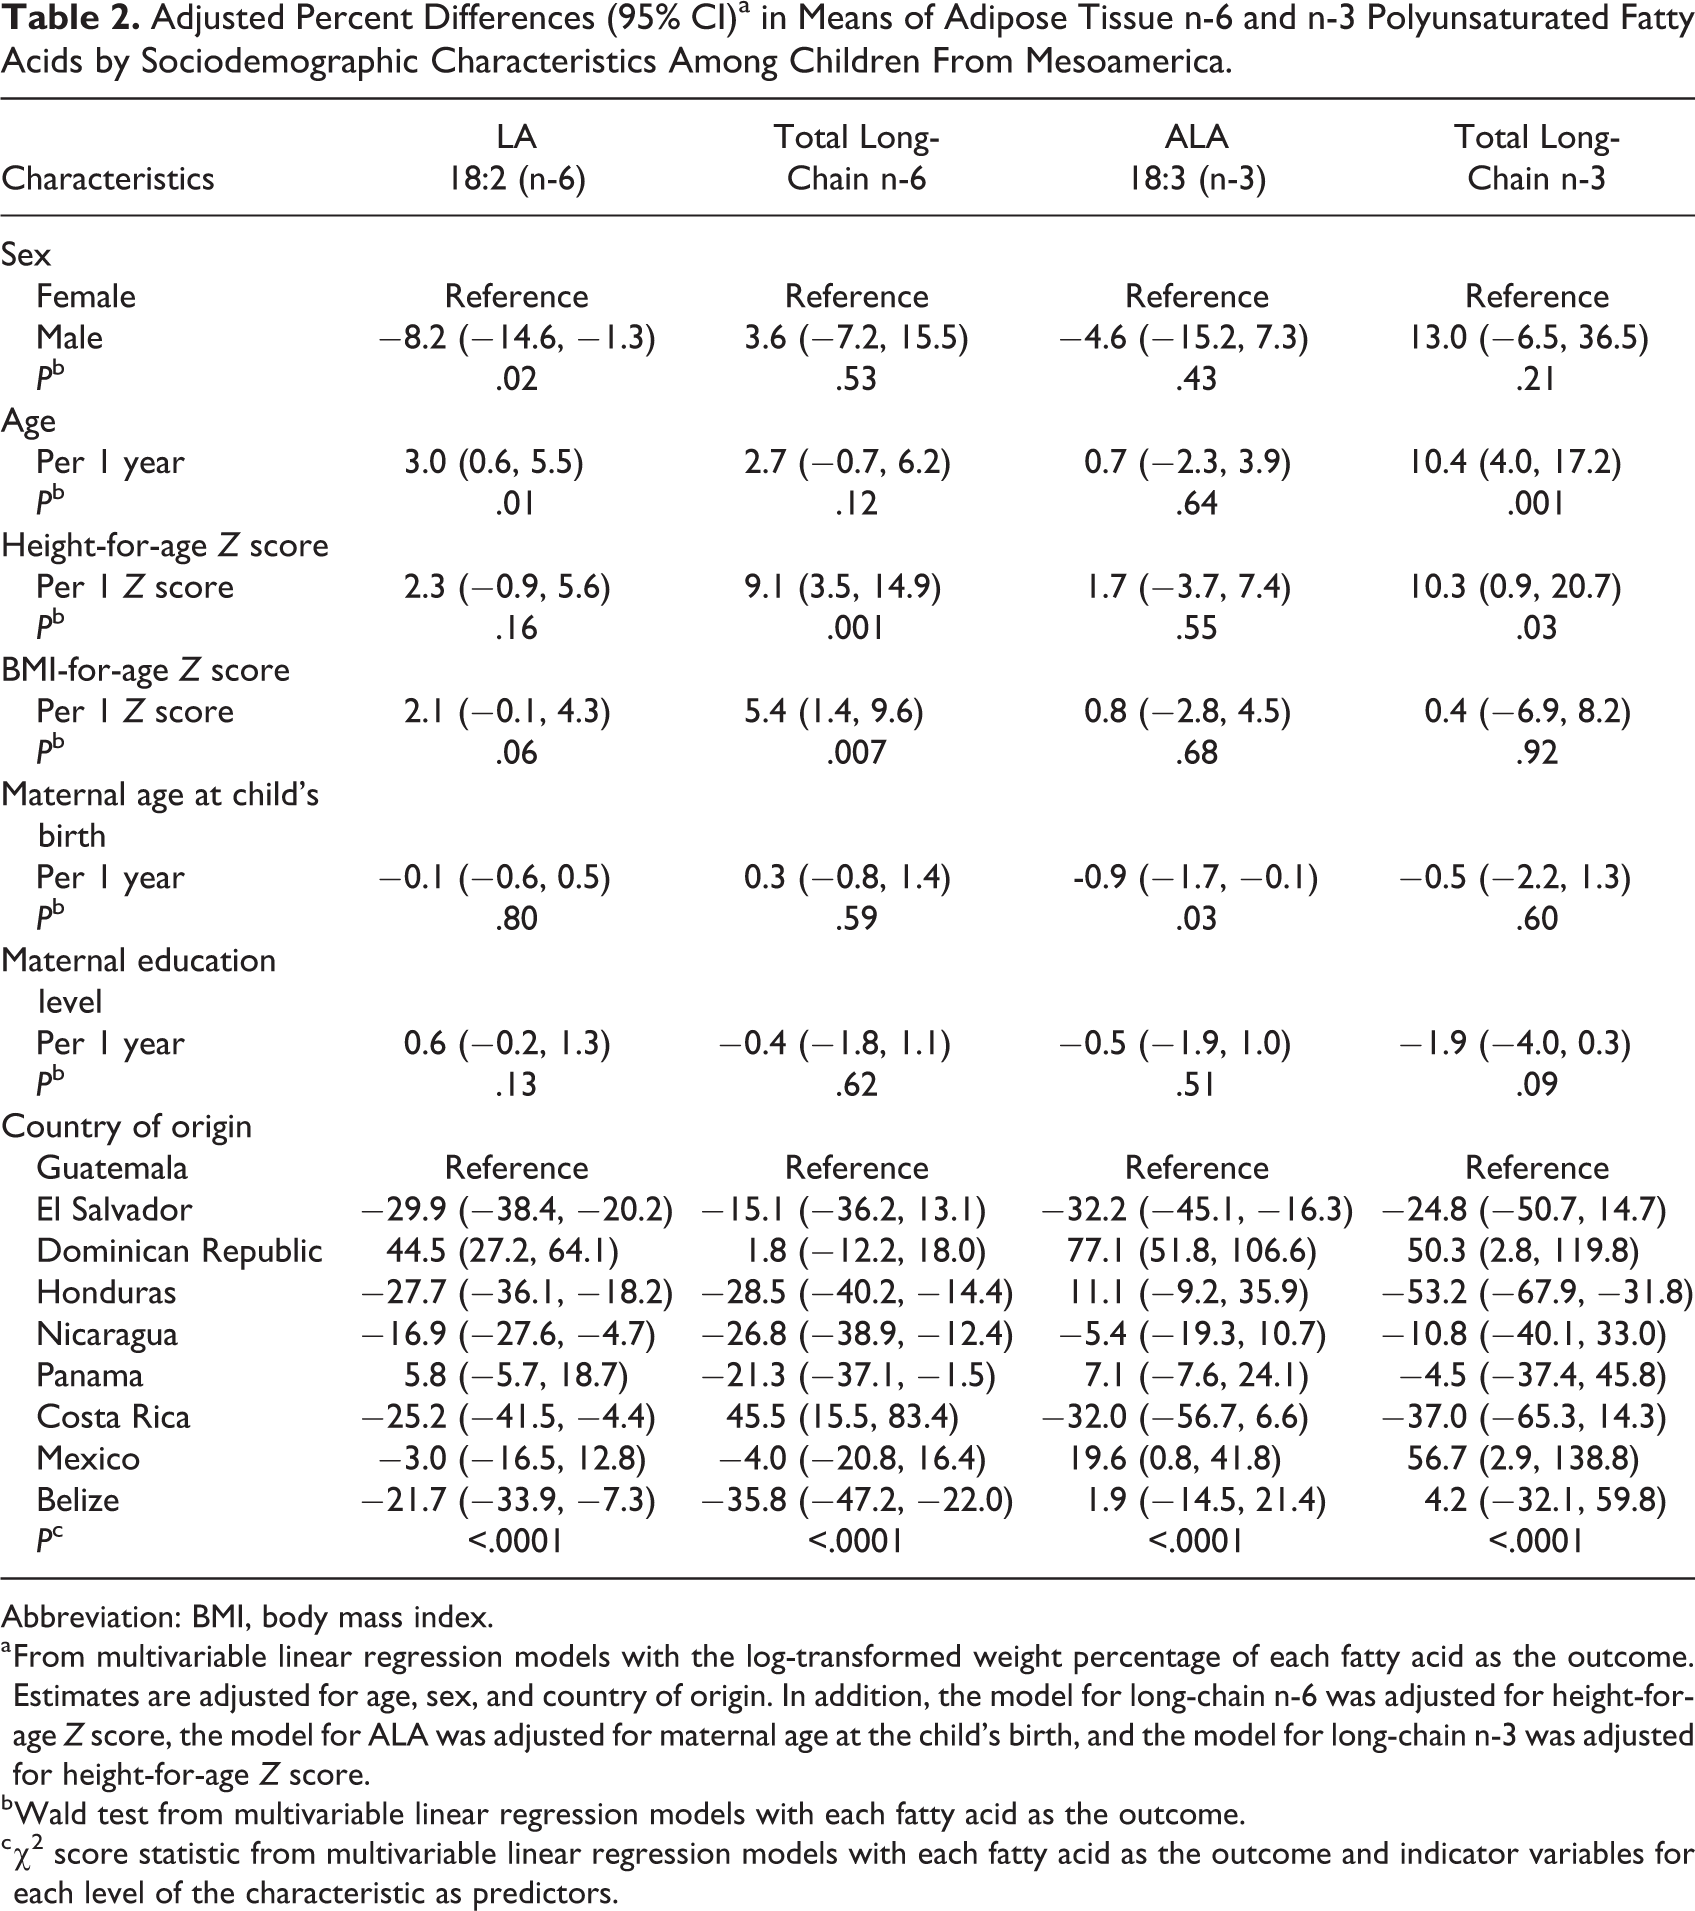
Abbreviation: BMI, body mass index.
a From multivariable linear regression models with the log-transformed weight percentage of each fatty acid as the outcome. Estimates are adjusted for age, sex, and country of origin. In addition, the model for long-chain n-6 was adjusted for height-for-age Z score, the model for ALA was adjusted for maternal age at the child’s birth, and the model for long-chain n-3 was adjusted for height-for-age Z score.
b Wald test from multivariable linear regression models with each fatty acid as the outcome.
c χ2 score statistic from multivariable linear regression models with each fatty acid as the outcome and indicator variables for each level of the characteristic as predictors.
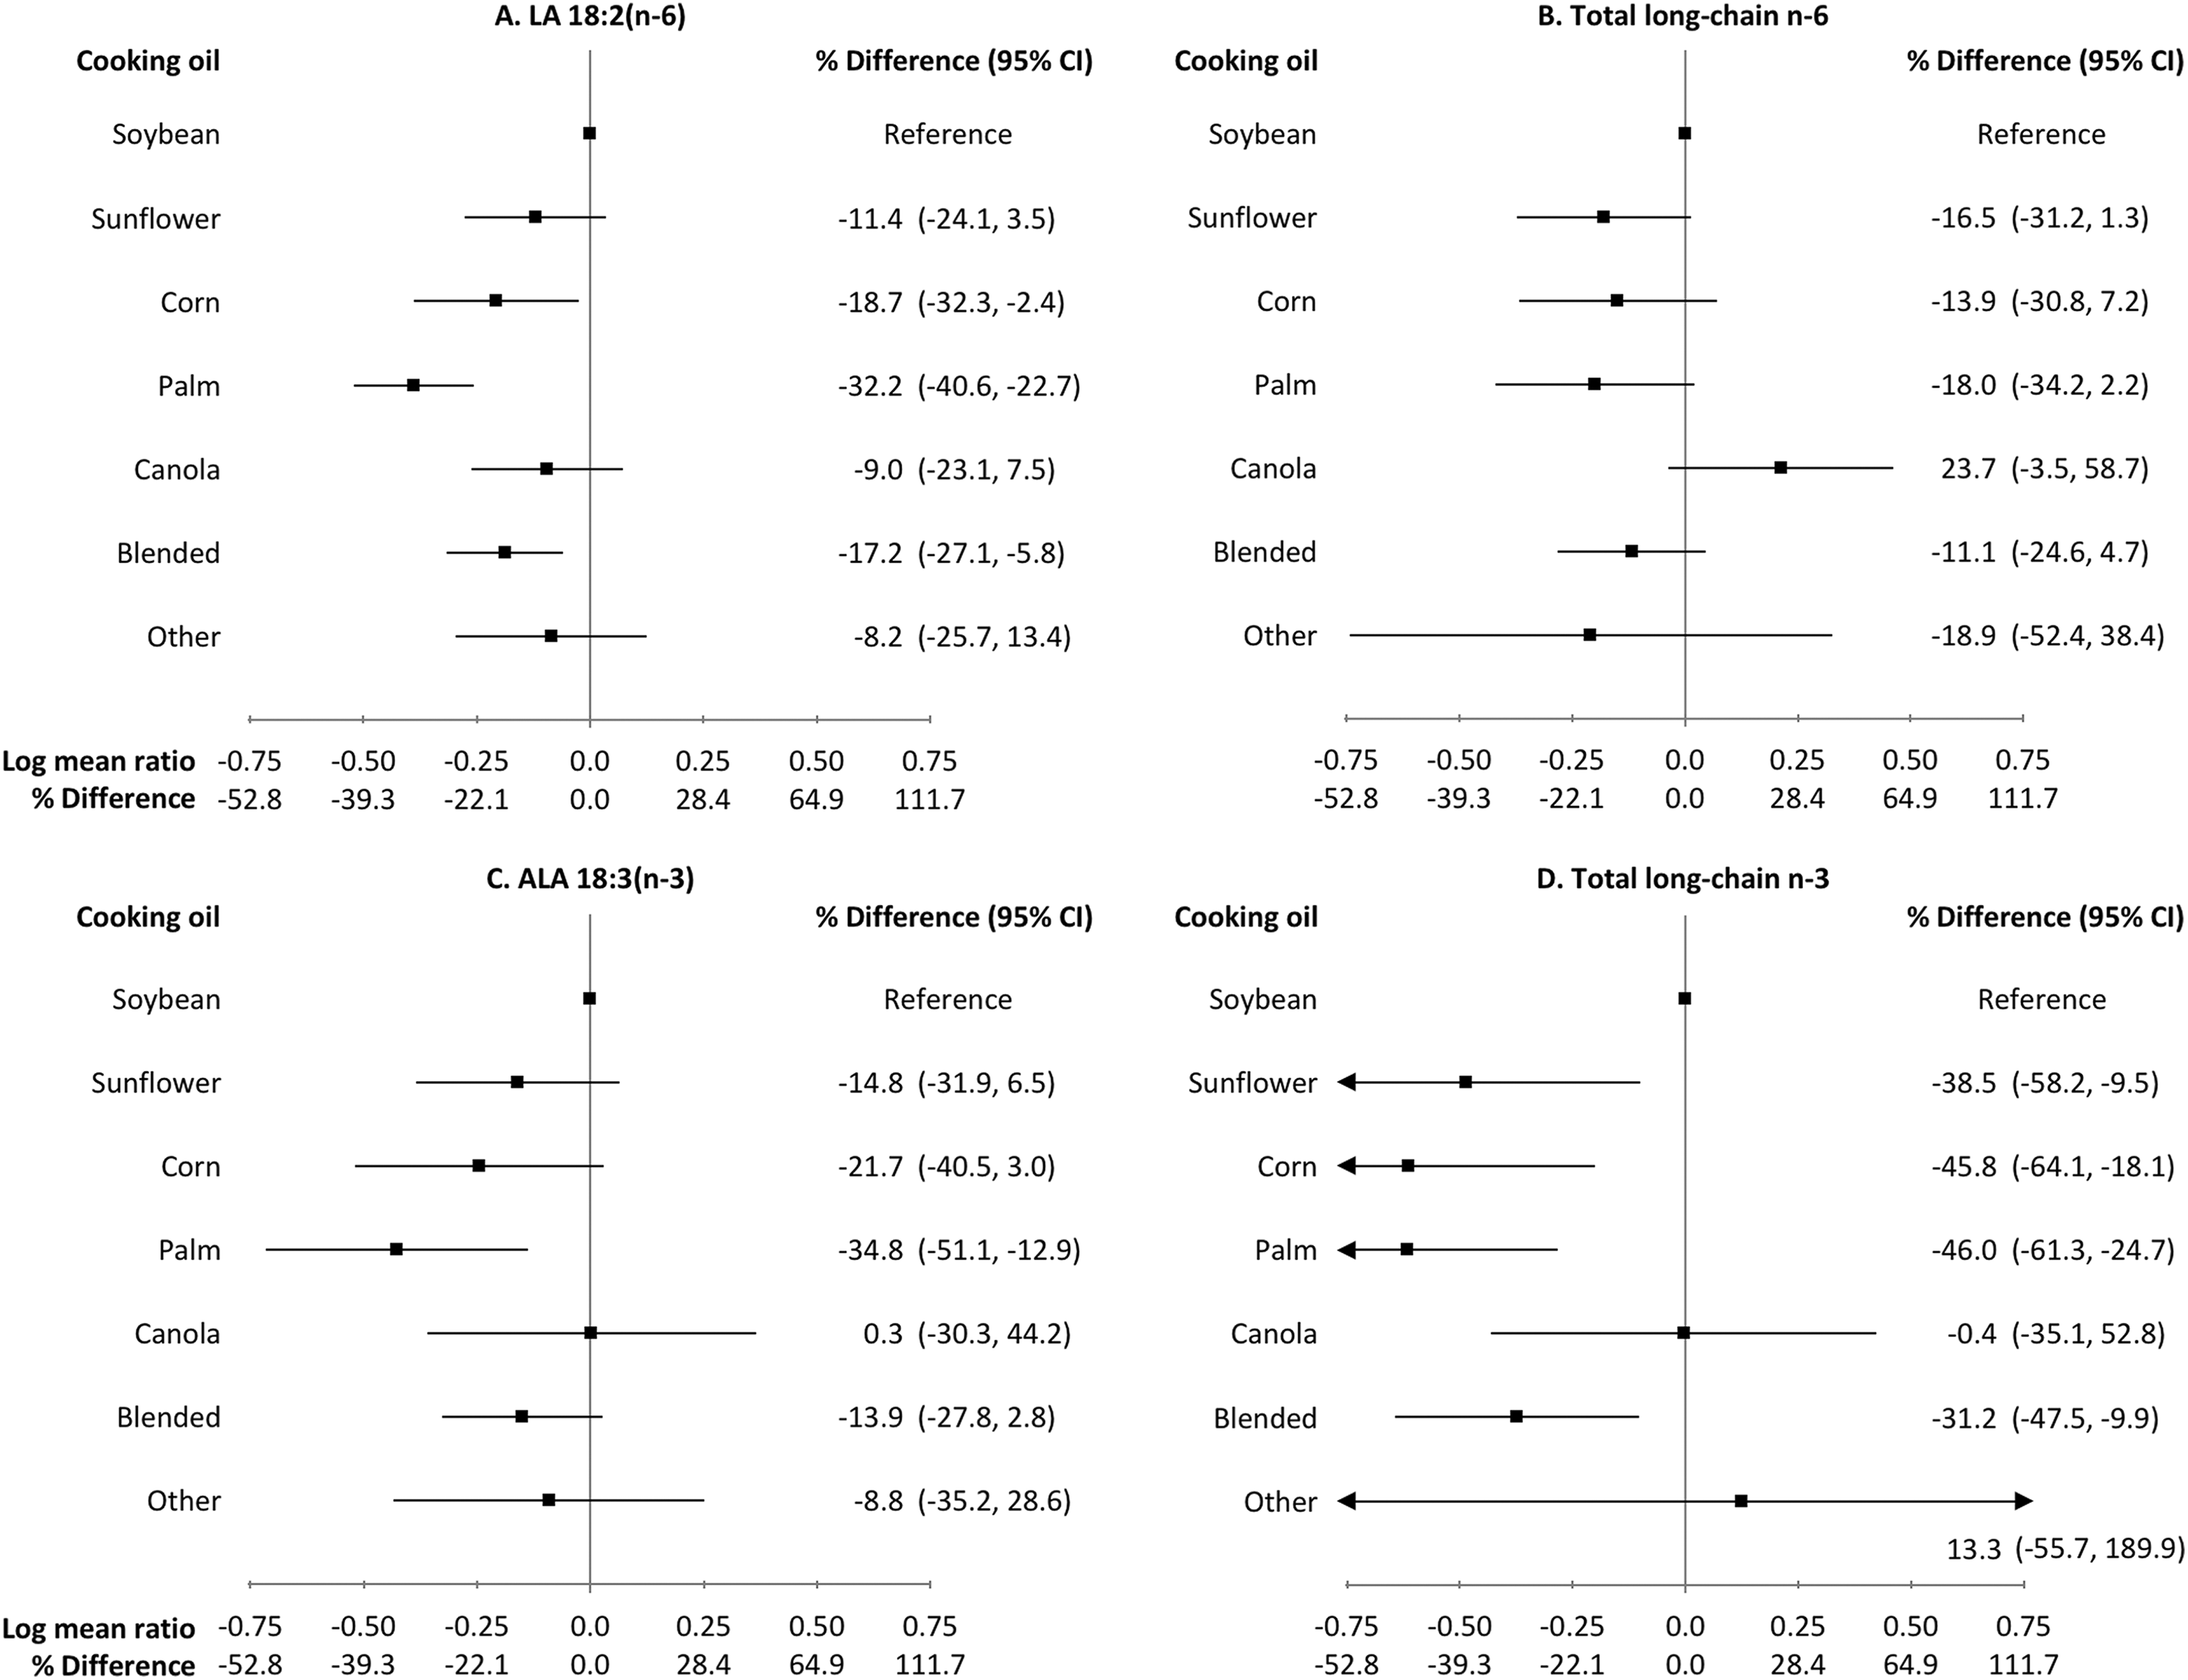
Adjusted percent differences (95% CI) in means of adipose tissue n-6 and n-3 polyunsaturated fatty acid weight percentages by main type of oil used for cooking at home among children from Mesoamerica. Estimates and confidence intervals are plotted on the log scale. Estimates are from multivariable linear regression models with log-transformed fatty acids as the outcome. All estimates are adjusted for age (continuous), sex, and maternal education (continuous). Additionally, the model for long-chain n-6 is adjusted for height-for-age Z score (continuous), the model for ALA is adjusted for maternal age at child’s birth (continuous), and the model for long-chain n-3 is adjusted for height-for-age Z score (continuous). N in each cooking oil category: soybean, 63; sunflower, 17; corn, 20; palm, 24; canola, 15; blended, 70; and other, 3. CI indicates confidence interval; ALA, α-linolenic acid.
Total long-chain n-6 PUFA
After adjustment, n-6 LCPUFA was positively associated with height- and BMI-for-age Z scores (Table 2). Children from Costa Rica and the Dominican Republic had the highest n-6 LCPUFA FA%, whereas children from Belize and Honduras had the lowest (P < 0.0001). The n-6 LCPUFA FA% was highest in children whose families used mainly canola oil and lowest in those whose families used “other” oils (P = .07; Figure 1B). When country and cooking oil type were included in the model together, the associations with cooking oil type were attenuated.
α-Linolenic acid
Mean (SD) ALA weight percentage was 0.74 (0.35). The ALA was inversely associated with the mother’s age at the child’s birth after multivariable adjustment (Table 2). The ALA was highest among children from the Dominican Republic and Mexico and lowest among children from El Salvador and Costa Rica (P < .0001). The ALA was highest among children whose families used canola or soybean oil and lowest among those whose families used palm oil (P = .16; Figure 1C). Inclusion of country in the model attenuated the associations with oil type, but did not appreciably change the associations with country.
Total long-chain n-3 PUFA
In adjusted analysis, n-3 LCPUFA was positively associated with age and height-for-age Z score (Table 2). Children from the Dominican Republic and Mexico had the highest n-3 LCPUFA FA% whereas children from Honduras and Costa Rica had the lowest (P < .0001). Children whose families used primarily soybean oil had the highest n-3 LCPUFA FA%, whereas those whose families used palm oil had the lowest (P = .005; Figure 1D). When country and oil type were included in the model simultaneously, the associations with oil type were attenuated.
Adults
Mean (SD) age of adult participants was 38.3 (7.3) years and 52% were women. Unadjusted means (SD) of adipose tissue PUFA varied by sociodemographic characteristics (Table 3) and cooking oil type (Supplemental Table 2).
Mean (SD) Adipose Tissue n-6 and n-3 Polyunsaturated Fatty Acid Weight Percentages by Sociodemographic Characteristics Among Adults From Mesoamerica.
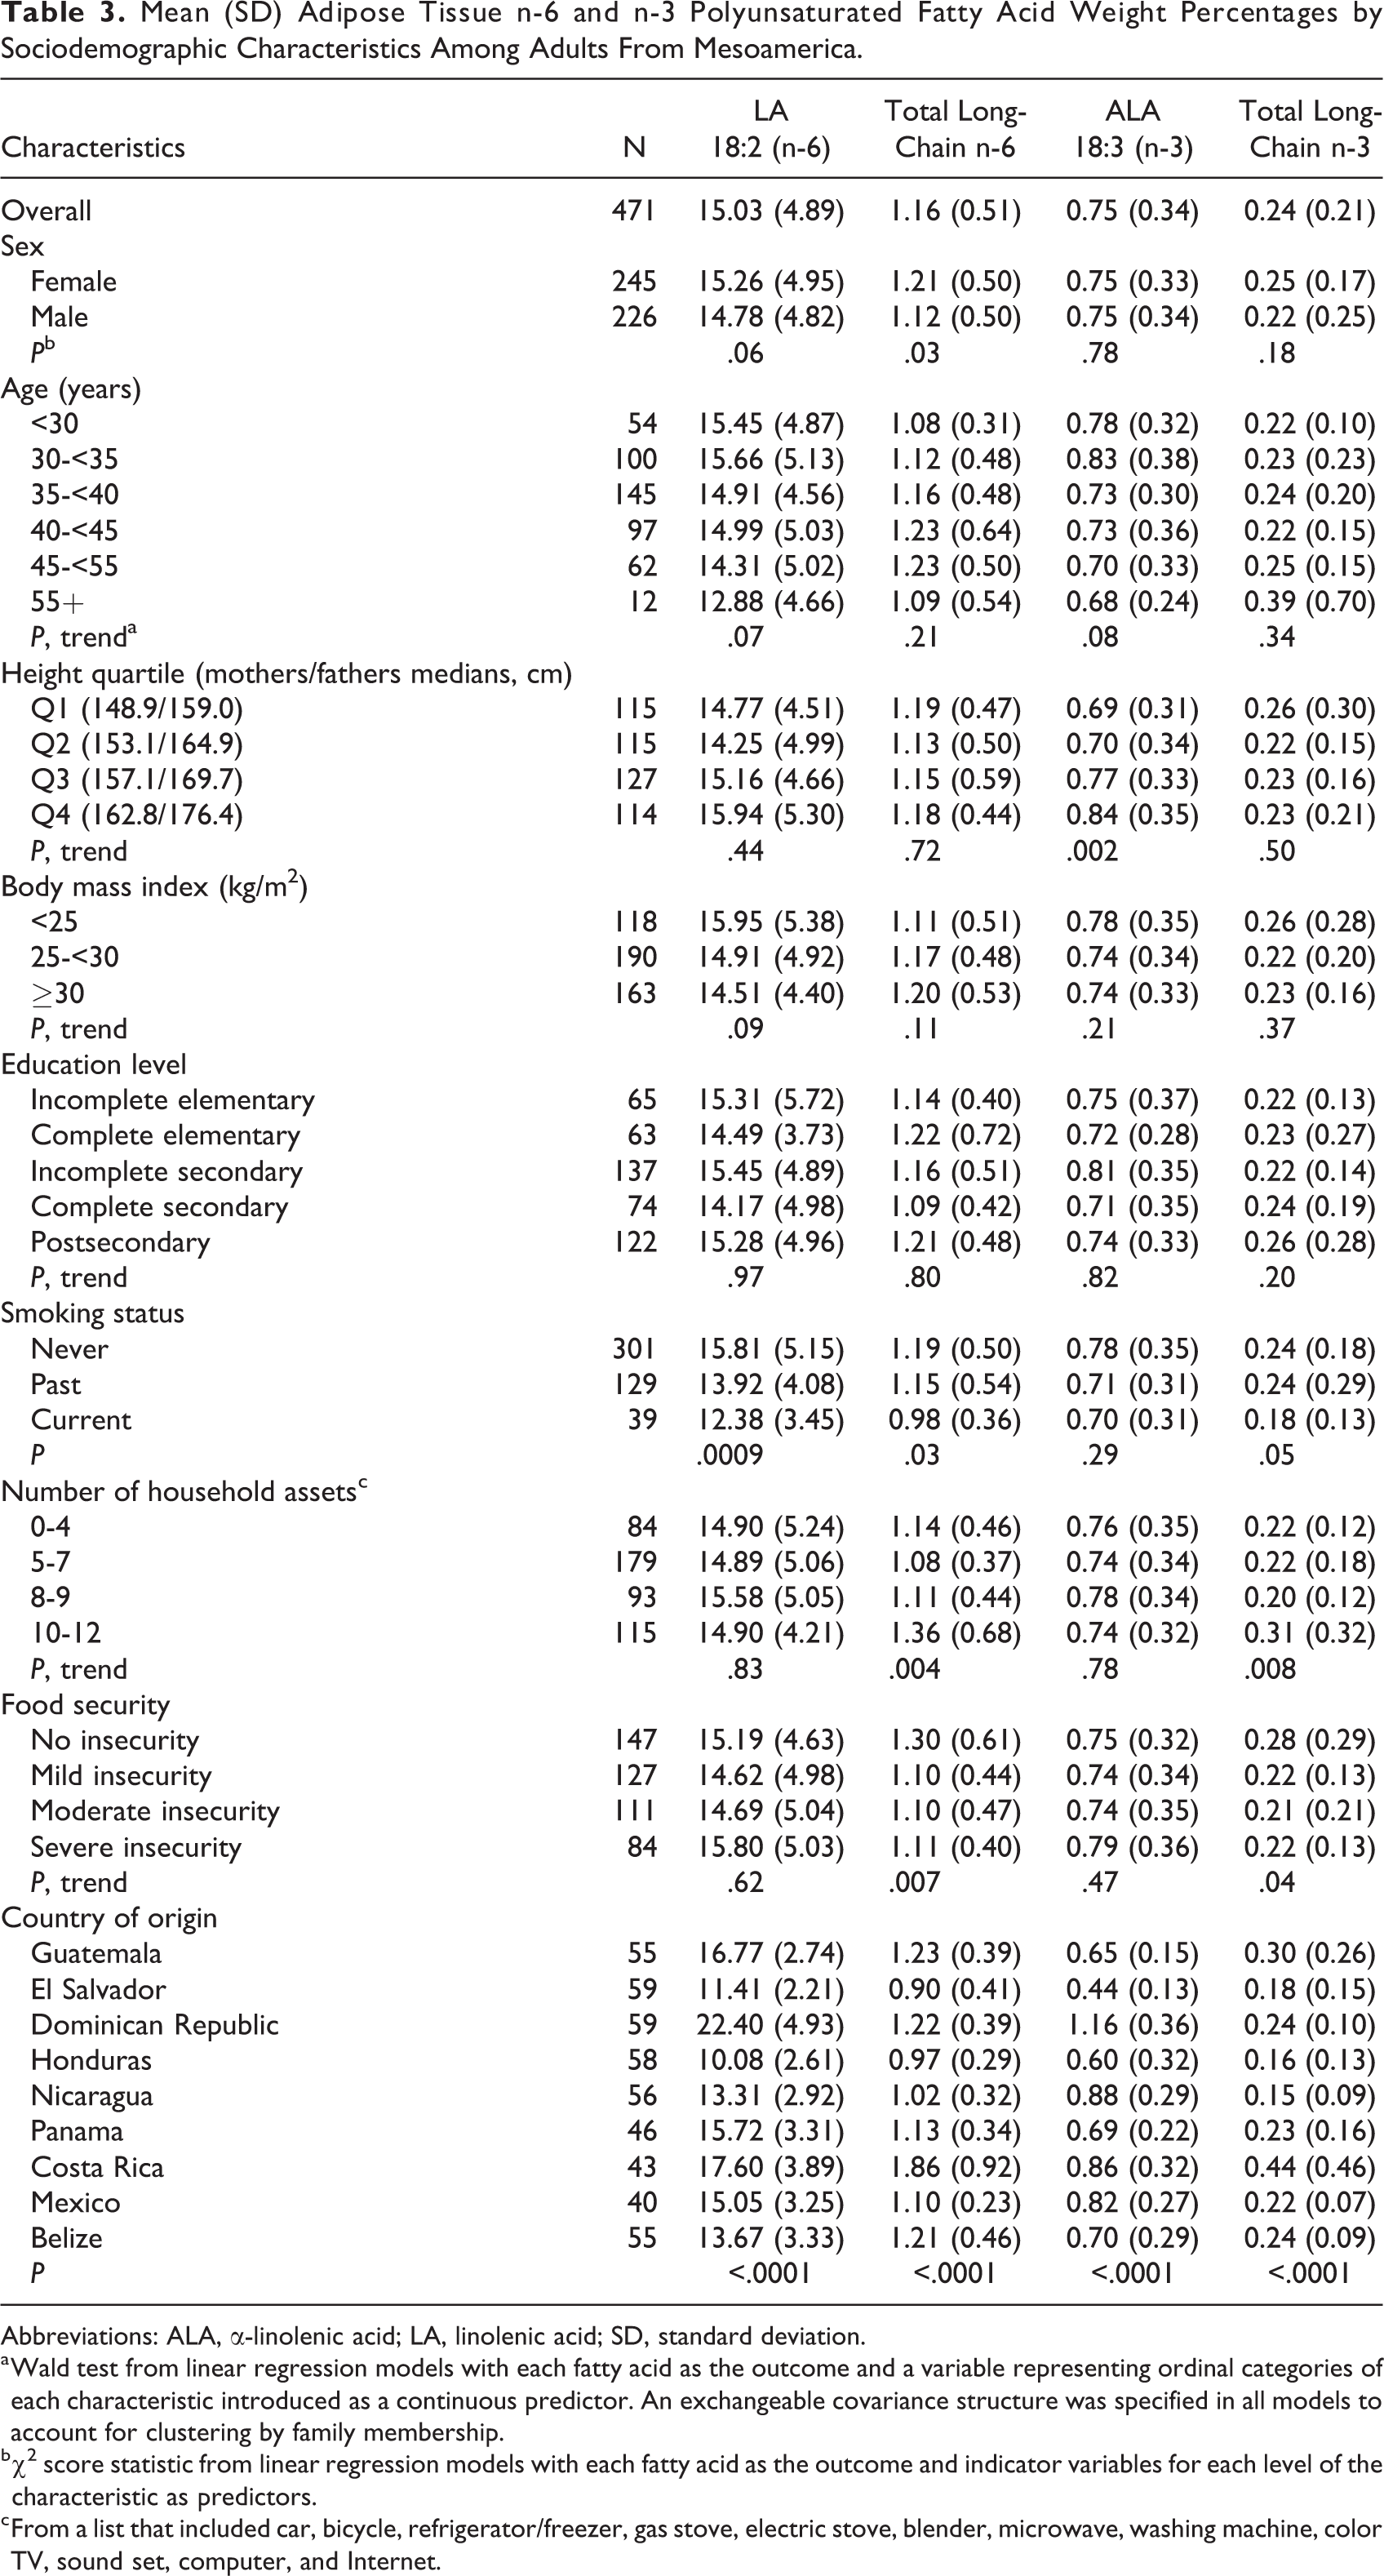
Abbreviations: ALA, α-linolenic acid; LA, linolenic acid; SD, standard deviation.
a Wald test from linear regression models with each fatty acid as the outcome and a variable representing ordinal categories of each characteristic introduced as a continuous predictor. An exchangeable covariance structure was specified in all models to account for clustering by family membership.
b χ2 score statistic from linear regression models with each fatty acid as the outcome and indicator variables for each level of the characteristic as predictors.
c From a list that included car, bicycle, refrigerator/freezer, gas stove, electric stove, blender, microwave, washing machine, color TV, sound set, computer, and Internet.
Linoleic acid
Mean (SD) LA weight percentage was 14.78 (4.82) in men and 15.26 (4.95) in women. In adjusted analysis, age and smoking were inversely associated with adipose tissue LA (Table 4). The LA FA% was the highest among participants from the Dominican Republic and Costa Rica and lowest among those from Honduras and El Salvador (P < .0001). Adipose tissue LA was highest among participants who used soybean oil as their primary cooking oil and lowest among those who used palm oil (P < .0001; Figure 2A). When country and cooking oil type were included in the model simultaneously, the associations with cooking oil were attenuated whereas the associations with country remained mostly unchanged.
Adjusted Percent Differencesa (95% CI) in Means of Adipose Tissue n-6 and n-3 Polyunsaturated Fatty Acids by Sociodemographic Characteristics Among Adults From Mesoamerica.
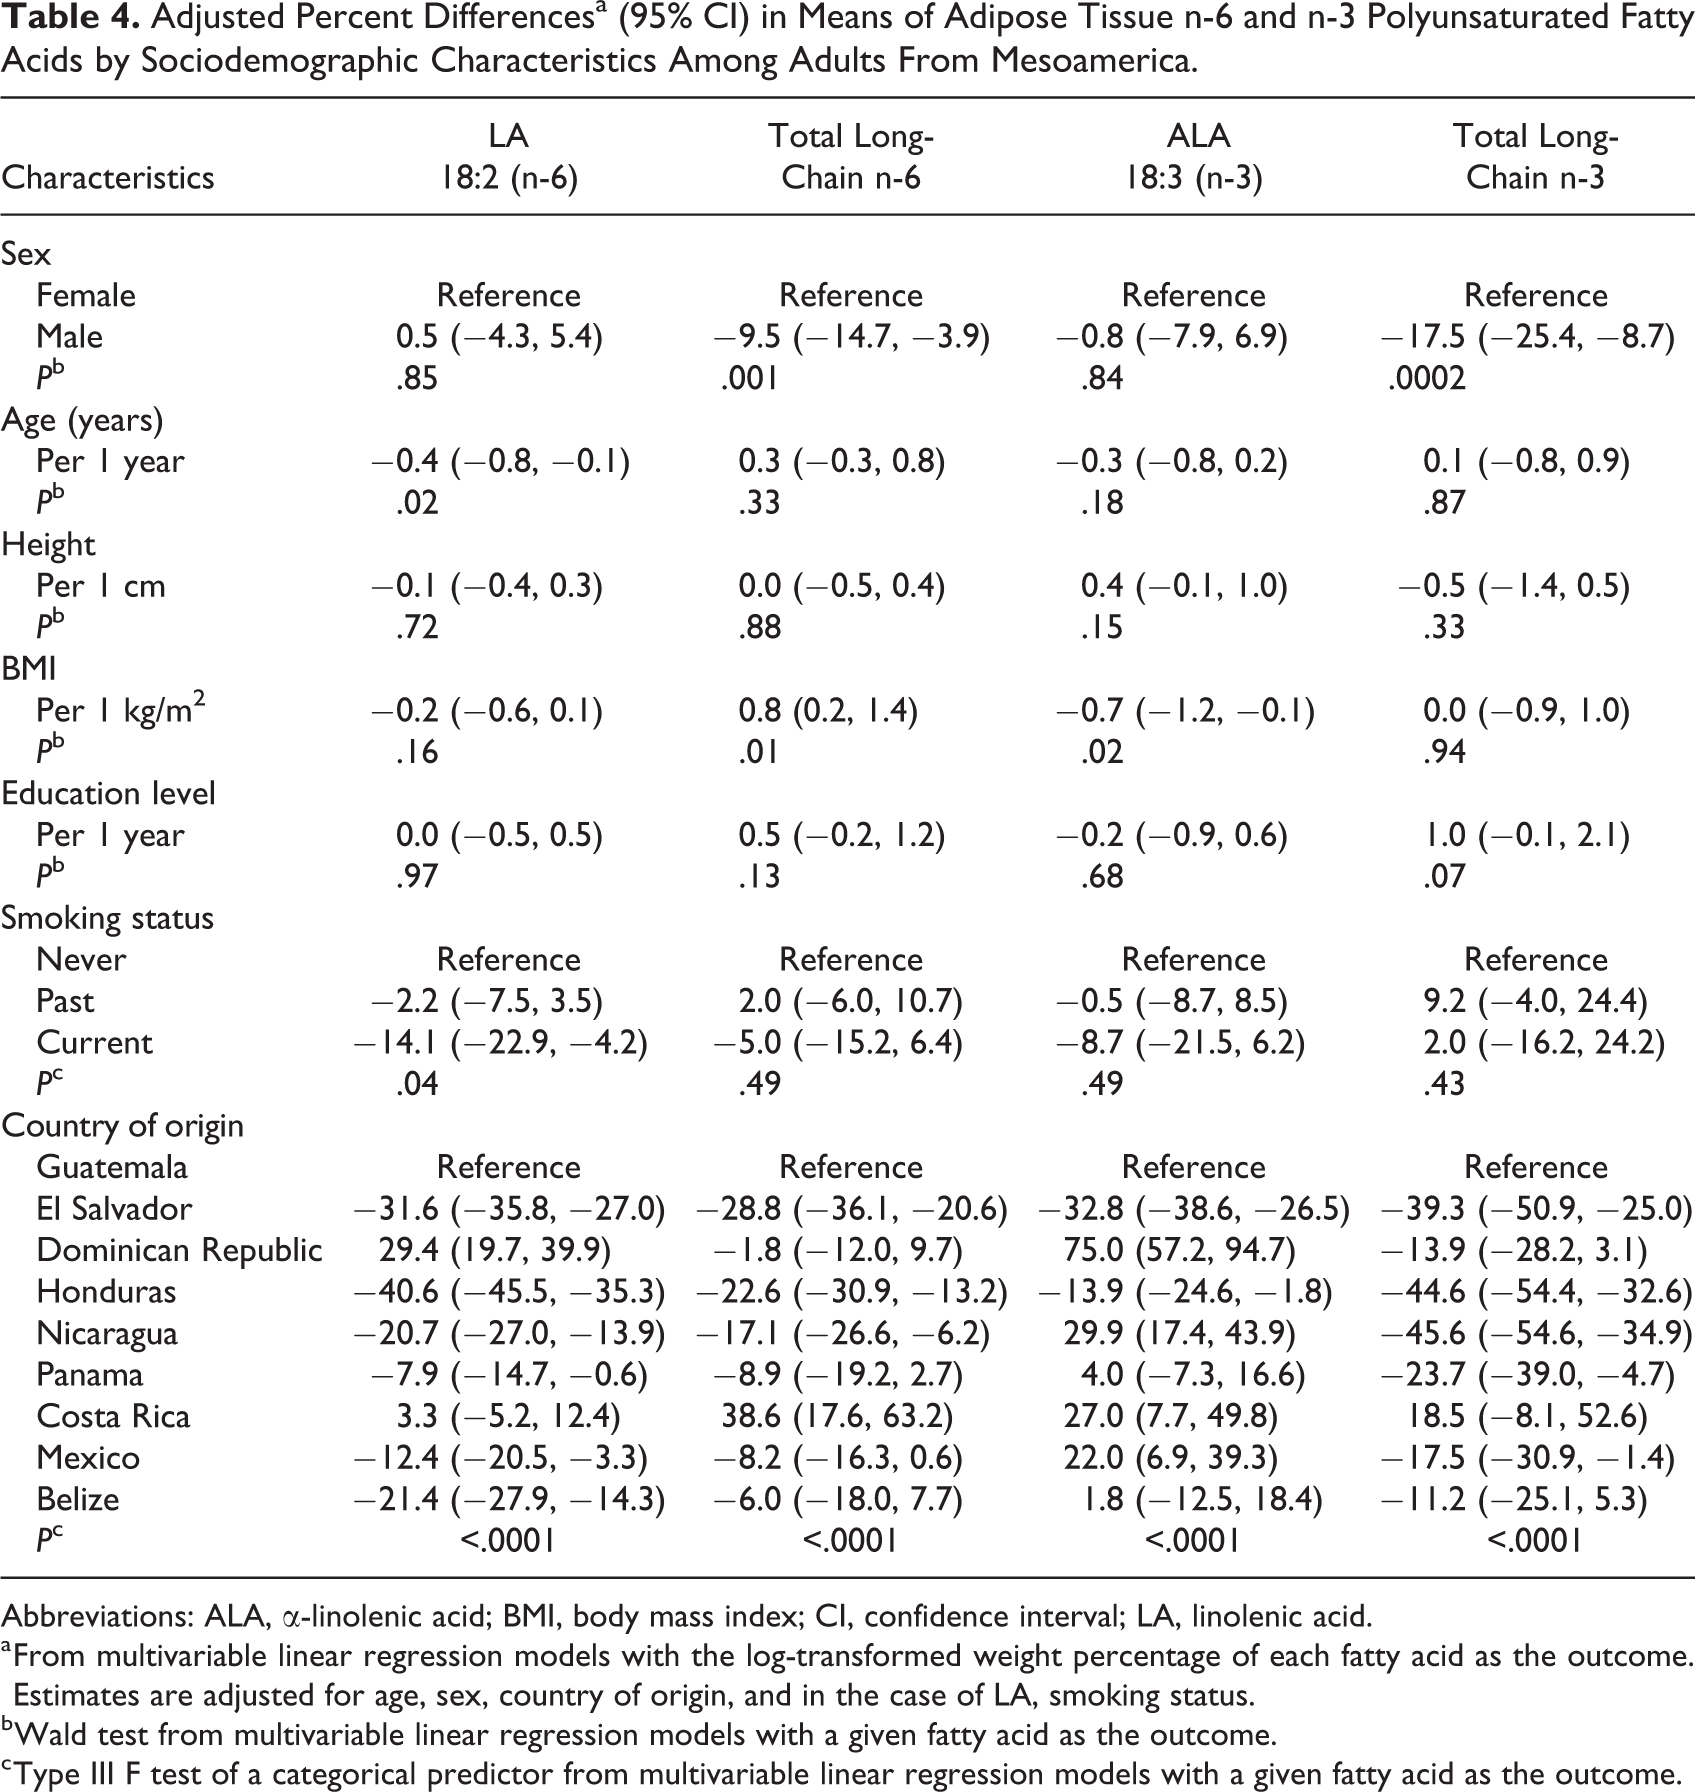
Abbreviations: ALA, α-linolenic acid; BMI, body mass index; CI, confidence interval; LA, linolenic acid.
a From multivariable linear regression models with the log-transformed weight percentage of each fatty acid as the outcome. Estimates are adjusted for age, sex, country of origin, and in the case of LA, smoking status.
b Wald test from multivariable linear regression models with a given fatty acid as the outcome.
c Type III F test of a categorical predictor from multivariable linear regression models with a given fatty acid as the outcome.
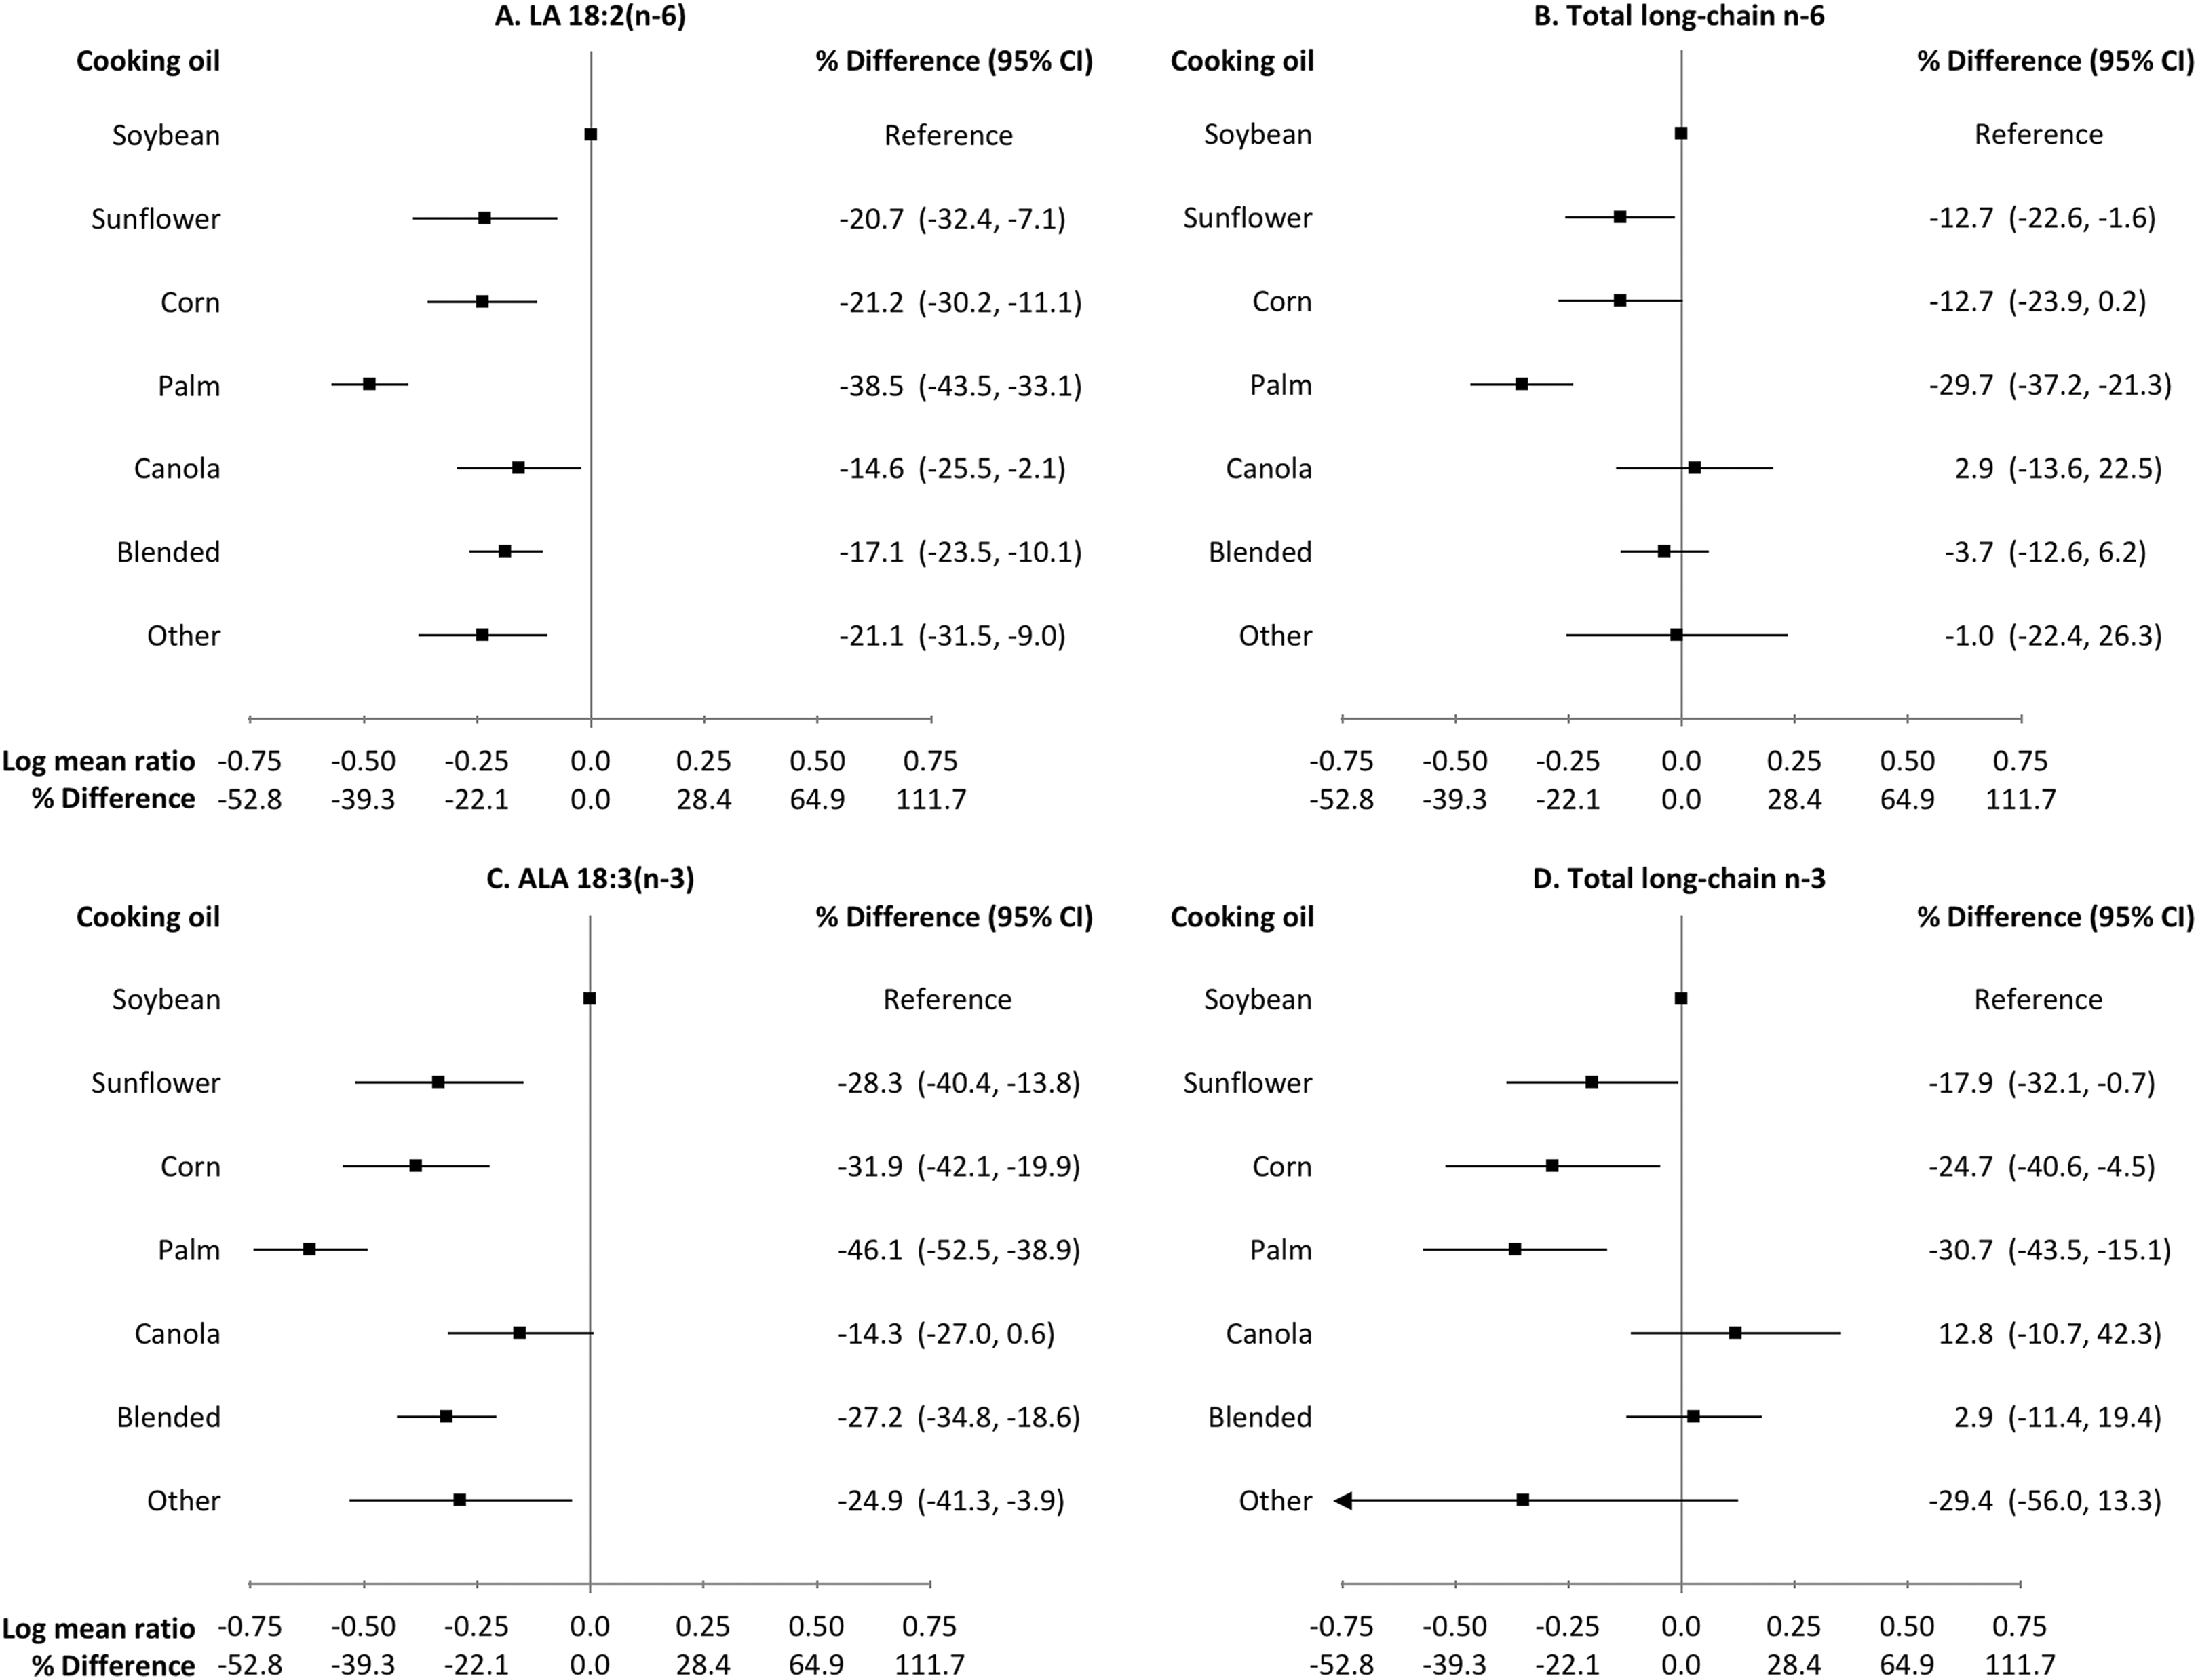
Adjusted percent differences (95% CI) in means of adipose tissue n-6 and n-3 polyunsaturated fatty acid weight percentages by main type of oil used for cooking at home among adults from Mesoamerica. Estimates and CIs are plotted on the log scale. Estimates are from multivariable linear regression models with log-transformed fatty acids as the outcome. All estimates are adjusted for age (continuous), sex, education (continuous), and for LA, smoking status (never, former, or current). N in each cooking oil category: soybean, 140; sunflower, 33; corn, 43; palm, 50; canola, 34; blended, 148; and other, 10. CI indicates confidence interval; LA, linolenic acid.
Total long-chain n-6 PUFA
After adjustment, adipose tissue n-6 LCPUFA was lower in men compared with women and positively associated with BMI (Table 4). The n-6 LCPUFA FA% were highest among participants from Costa Rica and Guatemala, and lowest among those from Honduras and El Salvador (P < .0001). People who used canola oil had the highest n-6 LCPUFA FA%, whereas those who primarily used palm oil had the lowest (P = .0004; Figure 2B). Including both country and cooking oil type in the model attenuated the associations with cooking oil type.
α-Linolenic acid
Mean (SD) ALA weight percent was 0.75 (0.34) in men and 0.75 (0.33) in women. The ALA was inversely associated with BMI in multivariable analysis (Table 4). Dominican and Nicaraguan participants had the highest FA%, whereas those from El Salvador and Honduras had the lowest (P < .0001). Users of soybean oil had the highest ALA FA%, whereas users of palm oil had the lowest (P < .0001; Figure 2C). Inclusion of country in the model attenuated the associations with cooking oil type.
Total long-chain n-3 PUFA
The n-3 LCPUFA FA% in adipose tissue was lower in men compared with women in multivariable analysis (Table 4). The n-3 LCPUFA was highest among participants from Costa Rica and Guatemala and lowest among those from Honduras and Nicaragua (P < .0001). Levels were highest in canola oil users and lowest among users of palm oil (P = .001; Figure 2D). When country was included in the model, the associations with oil type were attenuated.
Discussion
In this cross-sectional study of Mesoamerican families, adipose tissue biomarkers of LA, n-6 LCPUFA, ALA, and n-3 LCPUFA were associated with demographic and anthropometric characteristics and the main type of vegetable oil used for cooking in the home.
The overall means of adipose tissue LA and ALA in our study are similar to those from a meta-analysis of 19 studies conducted in healthy adult populations, primarily from Europe and the United States. 15 In that review, mean mole percentages of LA and ALA in adipose tissue were 13.9% and 0.8%, respectively, compared with 15.0% and 0.8% in adults and 14.0% and 0.7% in children from Mesoamerica. However, LA and ALA levels in some countries in our study, including El Salvador and Honduras, were much lower than those reported in other populations. This suggests that intake of essential fatty acids is low in parts of Mesoamerica as compared to high-income countries and that there is heterogeneity within the region. The only estimates previously available for Mesoamerica are from a study of Costa Rican adults evaluated between 1994 and 1998. In that study, mean LA and ALA weight percentages were 13.37% and 0.55%, respectively, 27 compared with 17.60% and 0.86% in Costa Rican adults from our study. The higher values measured in our study may indicate differences in diet by area of residence or an increase in PUFA intake over the previous decades.
The BMI was positively associated with n-6 LCPUFA in all participants and inversely associated with ALA in adults. Several previous studies of PUFA biomarkers have found positive associations between BMI and specific n-6 LCPUFA, but associations between BMI and ALA are inconsistent. 6,28 -30 Intake of ALA may inhibit the promotion of adipogenesis by n-6 LCPUFA, 31 which could explain both of our findings. However, these associations may also be attributable to reverse causation as a result of altered PUFA metabolism in adipose tissue of persons with obesity. 32
Country of origin was the strongest predictor of all PUFA in both children and adults. This is consistent with a European study in which region was the strongest predictor of plasma PUFA profiles. 33 Differences by country likely reflect differences in lifestyle and diet, but may also reflect genetic variation in the fatty acid desaturase (FADS) genes that encode the Δ6- and Δ5-desaturase enzymes. 34,35 Single-nucleotide polymorphisms in FADS genes modify the relations between dietary PUFA intake and tissue PUFA status by altering the rate of conversion of essential PUFA in to LCPUFA. 36 Thus variation in allele frequency between populations could result in different adipose tissue PUFA profiles among participants from different countries, even if PUFA intakes were similar. Nevertheless, country-specific distributions of cooking oil usage were consistent with some differences in PUFA by country: Soybean oil use was highest in Dominican households, corresponding to high LA and ALA among Dominican participants, and palm oil usage was highest in Honduras and El Salvador, corresponding to low levels of all PUFA among participants from these countries. Adjustment for cooking oil type did not appreciably change the associations of any PUFA with country, whereas the associations with cooking oil type were attenuated. We believe the reason for the attenuation is that country is the main source of variability in type of oil used. Previous studies in Costa Rica and Colombia suggest that cooking oil is a significant predictor of PUFA intake and status, 7,14 and we cannot rule out that usage of different types of oils explains at least in part the differences in PUFA by country in the present study. These associations may also reflect differences in intake of specific foods or variation in the PUFA content of oils and foods according to the country in which they are produced. 37
The primary type of oil used for cooking at home was a significant predictor of essential n-6 and n-3 PUFA in adults and of LA in children. Some of the associations between specific oils and essential PUFA are expected according to the fatty acid composition of cooking oils in Latin American countries. 38 -40 Soybean and canola oils are high in ALA, whereas palm oil is low in all n-6 and n-3 PUFA; correspondingly, in our study soybean and canola oil users had among the highest ALA levels, whereas palm oil users had among the lowest levels of all PUFA. The LA content is highest in corn and sunflower oils, 38 -40 but we observed the highest adipose LA FA% among users of soybean oil. This is consistent with previous findings from Costa Rica, where use of soybean oil low in trans fatty acids was associated with higher adipose tissue LA levels. 41
We also found that cooking oil usage predicted LCPUFA status, despite the low levels of preformed LCPUFA typically found in vegetable oils. 38 -40 This is in line with the results of an intervention study among Colombian families in which soybean or sunflower oil increased whole blood LCPUFA in school-aged children. 14 In our study, canola oil users had among the highest levels of both n-6 and n-3 LCPUFA, despite not having the highest levels of LA and ALA; this could reflect greater conversion of essential PUFA into LCPUFA. Canola oil is a rich source of ALA, which could explain the higher levels of n-3 LCPUFA, but has relatively less LA compared to the other oil types. The reason for higher levels of n-6 LCPUFA among canola users is unclear.
We did not find significant associations between SES indicators and adipose tissue PUFA. This could be because social determinants of PUFA intake, such as access to or preference for certain cooking oils among people of different SES, vary substantially by country. 39,42 Our sample sizes per country precluded within-country analyses.
Our study has several strengths. We examined associations that have not been well characterized in Mesoamerican populations and that are relevant to public health concerns in the region, including the low intake of dietary sources of n-3 LCPUFA. 10 The PUFA was measured in adipose tissue, the gold-standard biomarker of fatty acid intake. We had available measures of sociodemographic, anthropometric, and dietary characteristics, which allowed us to assess a wide range of correlates of PUFA status and control for many confounders. Finally, the family design provided an opportunity to investigate associations separately for adults and children.
The primary limitation of this study is its cross-sectional design, which prevents causal inference. Reverse causation could explain some of the results, including the association between BMI and n-6 LCPUFA. Levels of LCPUFA in adipose tissue are naturally low, 15 and thus measurement error of these PUFA in GC analyses may have been relatively high. Nevertheless, there is evidence that adipose tissue n-3 LCPUFAs are still adequate biomarkers of dietary intake, especially at low intake levels. 27 The study population was not intended to be representative of any particular group, which may limit the generalizability of our findings. In addition, the small sample sizes within each country prevented us from fully assessing country-specific associations.
In conclusion, we found that country of origin and the type of oil used for cooking are important correlates of adipose tissue PUFA biomarkers in Mesoamerican adults and children. Our results suggest that cooking oil type is a predictor not only of essential fatty acid status but of LCPUFA as well. Future studies should assess whether dietary interventions promoting the use of soybean or canola oils, particularly as replacements for palm oil, could improve the PUFA status of this population.
Supplemental Material
supplemental_material_fnb - Sociodemographic, Anthropometric, and Dietary Predictors of Polyunsaturated Fatty Acids in Adipose Tissue Among Mesoamerican Children and Their Parents
supplemental_material_fnb for Sociodemographic, Anthropometric, and Dietary Predictors of Polyunsaturated Fatty Acids in Adipose Tissue Among Mesoamerican Children and Their Parents by Kerry S. Flannagan, Manuel Ramirez-Zea, Ana Victoria Roman, Arun K. Das, Eduardo Villamor, and For the Nine Mesoamerican Countries Metabolic Syndrome Study (NiMeCoMeS) Group in Food and Nutrition Bulletin
Footnotes
Acknowledgments
Participants in the Nine Mesoamerican Countries Metabolic Syndrome Study (NiMeCoMeS) Group:
Mexico: Erika Lopez, Liz Peña, Alejandra Maldonado, Aldeni Vasquez, Aldrin Lopez
Belize: Lilly Mahung, Diomar Salazar
Guatemala: Fernanda Kroker, Maria Alejandra Cordova, Regina Garcia, Lilian Navas
El Salvador: Josefina Sibrian, Mauricio Flores, Noel Avalos
Honduras: Astarte Alegria, Jorge A. Sierra, Hector Murillo
Nicaragua: Ana María Gutierrez, Carmen María Flores, Mario Romero
Costa Rica: Emilce Ulate, Natalia Valverde, Andrea Fiatt, Juan Manuel Valverde
Panama: Flavia Fontes, Raisa Rodriguez, Emerita Pons, Lino Chue, Elka Gonzalez
Dominican Republic: Rafael Montero, Francisco Torres, Amarilis Then, Melvi Perez
Authors’ Note
K. S. F. performed the data analysis and K. S. F. and E. V. drafted the manuscript. M. R. Z., A. V. R., and E. V. designed the NiMeCoMeS Study, A. V. R. and M. R. Z. oversaw data collection. A. K. D. extracted and quantified fatty acid biomarkers. All authors read and approved the final version of the manuscript.
Declaration of Conflicting Interests
The author(s) declared no potential conflicts of interest with respect to the research, authorship, and/or publication of this article.
Funding
The author(s) disclosed receipt of the following financial support for the research, authorship, and/or publication of this article: The study was funded by the US National Heart, Lung, and Blood Institute, contract BAA-NHLBI-HV-09-12. Fatty acids were quantified using Core Services supported by grant DK097153 from the National Institutes of Health to the University of Michigan.
Supplemental Material
Supplemental material for this article is available online.
References
Supplementary Material
Please find the following supplemental material available below.
For Open Access articles published under a Creative Commons License, all supplemental material carries the same license as the article it is associated with.
For non-Open Access articles published, all supplemental material carries a non-exclusive license, and permission requests for re-use of supplemental material or any part of supplemental material shall be sent directly to the copyright owner as specified in the copyright notice associated with the article.