
Abstract
Background:
Production of rice and wheat increased dramatically in India over the past decades, with reduced proportion of coarse cereals in the food supply.
Objective:
We assess impacts of changes in cereal consumption in India on intake of iron and other micronutrients and whether increased consumption of coarse cereals could help alleviate anemia prevalence.
Methods:
With consumption data from over 800 000 households, we calculate intake of iron and other micronutrients from 84 food items from 1983 to 2011. We use mixed-effect models to relate state-level anemia prevalence in women and children to micronutrient consumption and household characteristics.
Results:
Coarse cereals reduced from 23% to 6% of calories from cereals in rural households (10% to 3% in urban households) between 1983 and 2011, with wide variations across states. Loss of iron from coarse cereals was only partially compensated by increased iron from other cereals and food groups, with a 21% (rural) and 11% (urban) net loss of total iron intake. Models indicate negative association between iron from cereals and anemia prevalence in women. The benefit from increased iron from coarse cereals is partially offset by the adverse effects from antinutrients. For children, anemia was negatively associated with heme–iron consumption but not with iron from cereals.
Conclusions:
Loss of coarse cereals in the Indian diet has substantially reduced iron intake without compensation from other food groups, particularly in states where rice rather than wheat replaced coarse cereals. Increased consumption of coarse cereals could reduce anemia prevalence in Indian women along with other interventions.
Introduction
Cereals provide a substantial proportion of calories for the human population and cover more than half of the world’s cropland area (approximately 45% and 54%, respectively, at the global scale in 2013). 1,2 Low-income populations, in particular, obtain a high proportion of calories and nutrients from cereals. 3 With intensification of cereal production in the last 50 years through multiseason cropping, improved varieties, irrigation, and fertilizers, the global production of cereals more than doubled. Simultaneously, the mix of cereals became more heavily dominated by rice and wheat, which were the focus of research and extension efforts, at the expense of nutrient-dense coarse cereals such as millet and sorghum. 4 Over the same time period, diets have incorporated more animal-based foods with urbanization and rising incomes, and fats and sugars are contributing a greater proportion of calories to diets in many places around the world. 5 All of these factors together contribute to a changing landscape of nutrient intake and diet-related health outcomes.
The global food supply of calories per capita (2884 kcal/day in 2013) surpasses requirements for an average adult (2245 kcal/day) at the global scale. 1,6 The number of undernourished people—defined as “a level of food intake insufficient to meet dietary energy requirements”—declined by more than 200 million in the last 2 decades to 795 million 7 but has recently increased to 815 million from increased conflict situations and climate extremes. 8 Despite the overall downward trend in undernourishment, micronutrient deficiencies are prevalent particularly in the developing world. Billions of people are at risk of micronutrient inadequacies as exemplified by estimates for calcium and zinc intakes. 9
These concerns are particularly prevalent in India, where cereal production increased more than 2.3-fold since the 1960s. The Green Revolution transformed India from a cereal-importing to an exporting country. Increased production was pivotal to alleviate food shortages as occurred, for example, in the Bengal famine of 1943 and the Bihar famine of 1966-1967. 10 Due to the focus on high-yielding rice and wheat, the national supply has become concentrated on these 2 cereals (Figure 1). Moreover, rice and wheat distributed through the Public Distribution System (PDS), which entitles poor households to subsidized grains and fuel, reaches an increasingly large percentage of the population. Approximately 51% and 34% of rural and urban households, respectively, received some portion of their cereals through PDS in 2011 (Supplemental Figure 1). 12
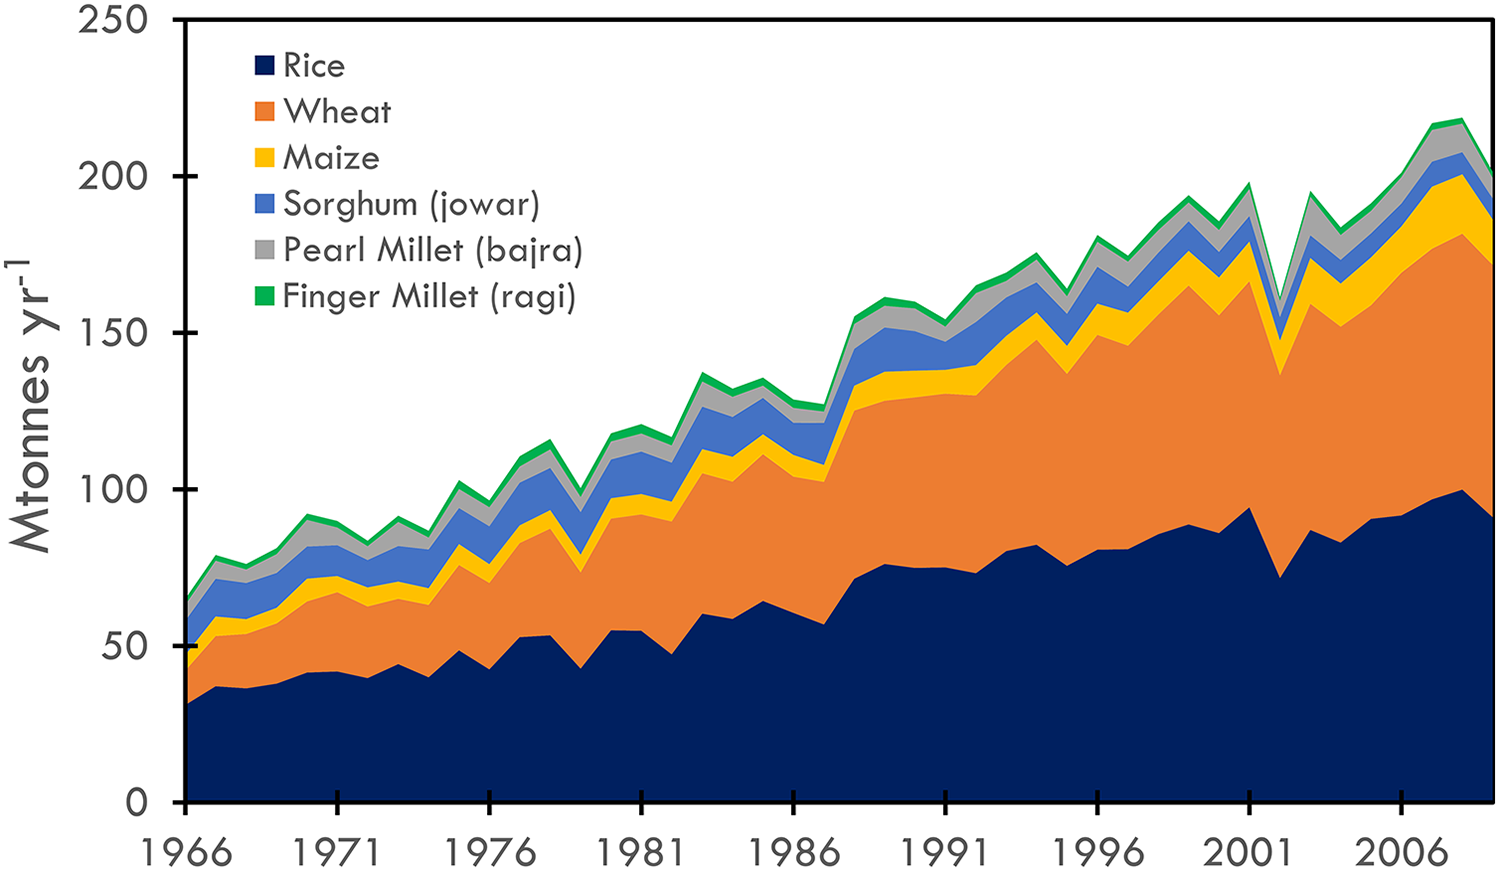
Change in production of cereals in India from 1966 to 2009. Data from study by International Crops Research Institute for the Semi-Arid Tropics. 11 Jowar (sorghum) is combined for monsoon (kharif) and winter (rabi) seasons.
The dominance of rice and wheat translated into changes in consumption patterns. Consumption of coarse cereals (defined as cereal grains other than rice and wheat including maize, pearl millet [local name bajra], finger millet [local name ragi], sorghum [local name jowar], barley, and rye) declined. 13 Coarse cereals are commonly used for fodder and brewing in industrialized countries and directly consumed in many developing countries. Nationally, the proportion of coarse to total cereals consumed declined from 35% to 5% and 17% to 3% in rural and urban areas, respectively, between 1961 and 2011 (Table 1), along with a well-documented overall decline in total calories and quantities of cereal consumed. 15 -17
Average 30-Day Consumption per Capita (kg/30-day/person) for Cereals in India for 1961 to 1962 and 2011 to 2012.a
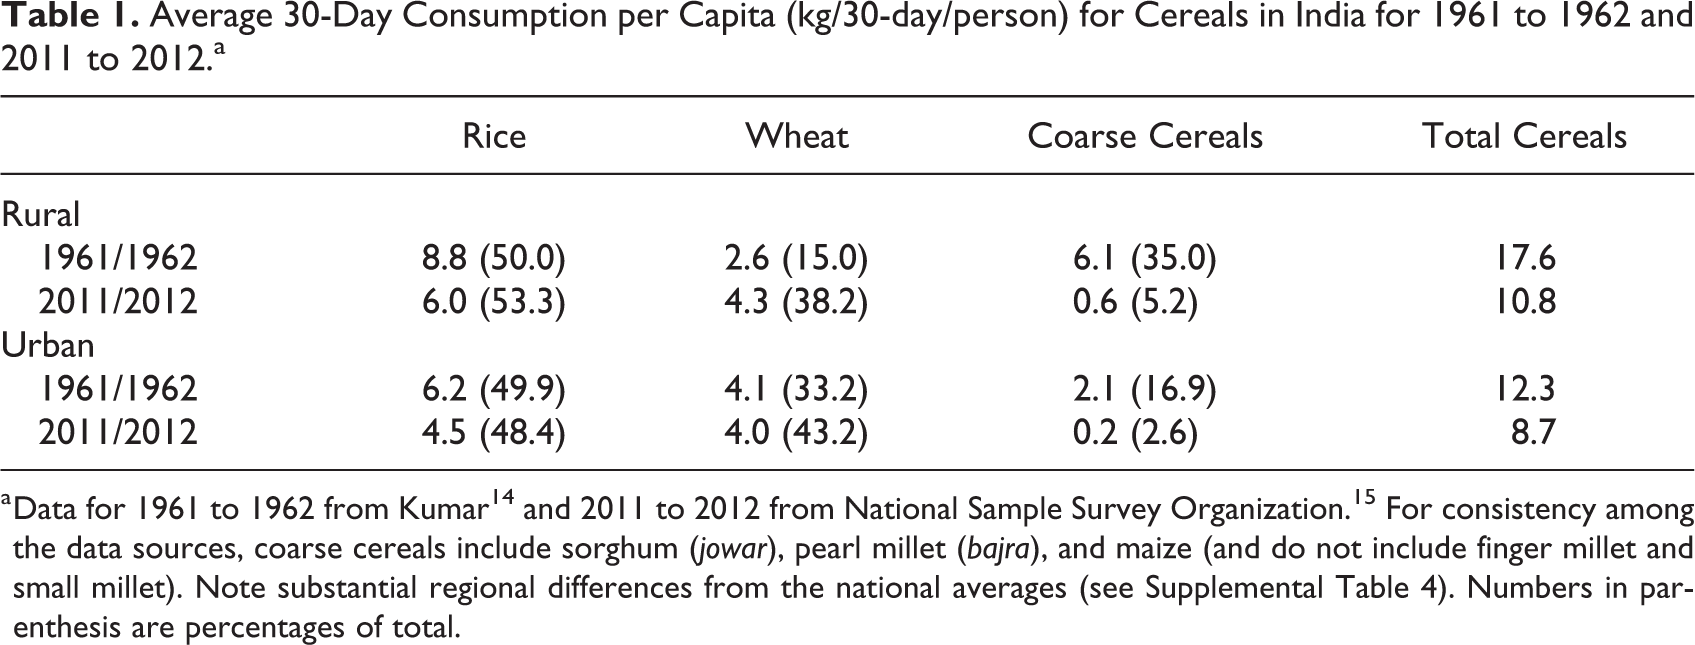
a Data for 1961 to 1962 from Kumar 14 and 2011 to 2012 from National Sample Survey Organization. 15 For consistency among the data sources, coarse cereals include sorghum (jowar), pearl millet (bajra), and maize (and do not include finger millet and small millet). Note substantial regional differences from the national averages (see Supplemental Table 4). Numbers in parenthesis are percentages of total.
Interest has risen in increasing production of coarse cereals for their nutritive value, along with their water efficiency, climate resilience in semiarid conditions, and ability to grow on poor soils. 18,19 In addition, coarse cereals are C4 crops and consequently less susceptible to reduced iron, zinc, and protein content than C3 cereals (eg, rice, wheat) as atmospheric concentration of carbon dioxide rises, 20,21 although yields of C4 crops respond more positively to increasing atmospheric carbon dioxide concentration than C3 crops. 22 We focus in this article on the implications of these changing production and consumption trends for cereals in India on iron intake and anemia. The study is motivated by the prospect of inclusion of millets in the country’s PDS as specified in the National Food Security Act passed in 2013. To date, a few states have distributed millets. 23 Specifically, we address the extent to which decreased consumption of coarse cereals has affected iron intake and health outcomes as well as the potential for reintroduction of coarse cereals to improve outcomes.
Iron deficiency is the most common cause of anemia, a global public health problem that affected 33% of the population in 2010, particularly women and young children. 24 Dietary intake of iron is one of several causal factors of anemia, which complicates attribution of the fraction of anemia explained by insufficient iron consumption alone. 25,26 Other causal factors include diseases such as malaria and hookworm as well as inherited disorders. Poor sanitation, hygiene, and crowding contribute to iron deficiency anemia through infections and inflammation which impede iron absorption.
Multiple micronutrients affect anemia. Deficiencies in folate (vitamin B9) and vitamin B12 are related to nutritional anemia. 27 Heme-iron found in animal-based foods is more bioavailable compared to plant-based, nonheme sources. 28 Vitamin C also enhances iron absorption. 29,30 However, antinutrients phytate and polyphenols bind with minerals, inhibit nonheme-iron and other micronutrient absorption (such as zinc and calcium), and reduce bioavailability. 31 Traditional processing methods such as fermentation and soaking reduce phytate content and consumption with ascorbic acid in the food matrix enhance absorption. 32,33 The low bioavailability of iron from plant-based diets is the reason that Indian recommended dietary allowances for iron are 2 to 3 times higher than US recommendations. 26
The effect of phytate on the bioavailability of minerals depends not only on the total phytate content in foods but on the relative proportions between phytate and minerals in those foods. Phytate-to-mineral molar ratios are used to predict the inhibitory effect of phytate on the bioavailability of minerals. 34 Among the cereals, milled rice has the lowest phytate content but the highest molar ratio (Table 2). In a meal, a phytate-to-iron molar ratio >1 significantly decreases iron absorption. 30 While a high relative amount of phytate indicates a negative effect on absorption, in recent decades a positive effect of phytate has been emphasized for its anticancer property, antioxidant activity, and reduction in blood glucose and cholesterol. 38
Nutrient Content of Rice, Wheat, and the Main Coarse Cereals for Iron and the Antinutrients Phytate and Polyphenols.a
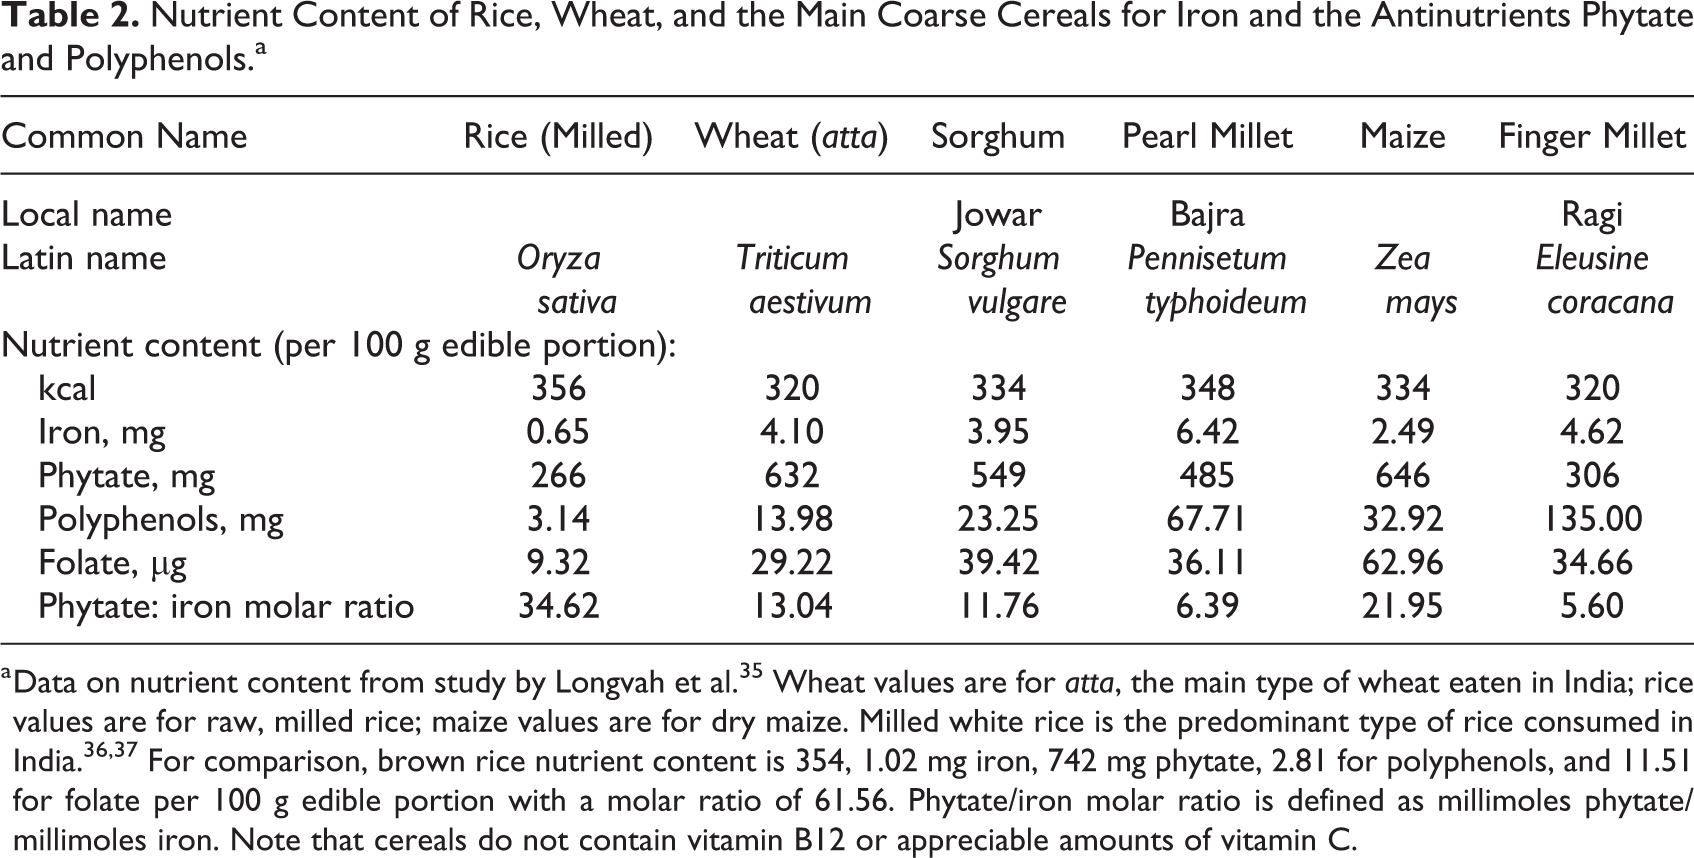
a Data on nutrient content from study by Longvah et al. 35 Wheat values are for atta, the main type of wheat eaten in India; rice values are for raw, milled rice; maize values are for dry maize. Milled white rice is the predominant type of rice consumed in India. 36,37 For comparison, brown rice nutrient content is 354, 1.02 mg iron, 742 mg phytate, 2.81 for polyphenols, and 11.51 for folate per 100 g edible portion with a molar ratio of 61.56. Phytate/iron molar ratio is defined as millimoles phytate/millimoles iron. Note that cereals do not contain vitamin B12 or appreciable amounts of vitamin C.
The micronutrient content of cereals varies substantially (Table 2). Milled rice is particularly low in iron and folate content but also low in inhibitory antinutrients such as phytate and polyphenols. Coarse cereals (sorghum, pearl millet, maize, and finger millet) and whole wheat (“atta’ commonly consumed in India) have relatively high iron and folate content but are also high in antinutrients. Cereals do not contain vitamin B12 or appreciable amounts of vitamin C. The differences in nutrient content of these cereals raises the question whether increased coarse cereal consumption could, in the context of the overall changes in the diet, help alleviate micronutrient deficiencies such as anemia.
Anemia is a major public health problem in India affecting more than half of all women and children under 5 years (Table 3). Researchers estimate that 20% of maternal deaths in India are directly related to anemia and another 50% are indirectly related. 25 Prevalence of anemia increased by more than 4 percentage points for both women and children between 1998 to 1999 and 2005 to 2006 (Table 3) as measured by the decadal National Family Health Surveys. 39 -41 Between 2006 to 2007 and 2015 to 2016, prevalence declined by 2 and 11 percentage points for women and children, respectively. Prevalence is higher in rural than in urban populations by up to 10 percentage points although the gap reduced by 2015 to 2016.
Percentages of Population With Anemia in the Indian Population from Decadal National Family Health Surveys.a
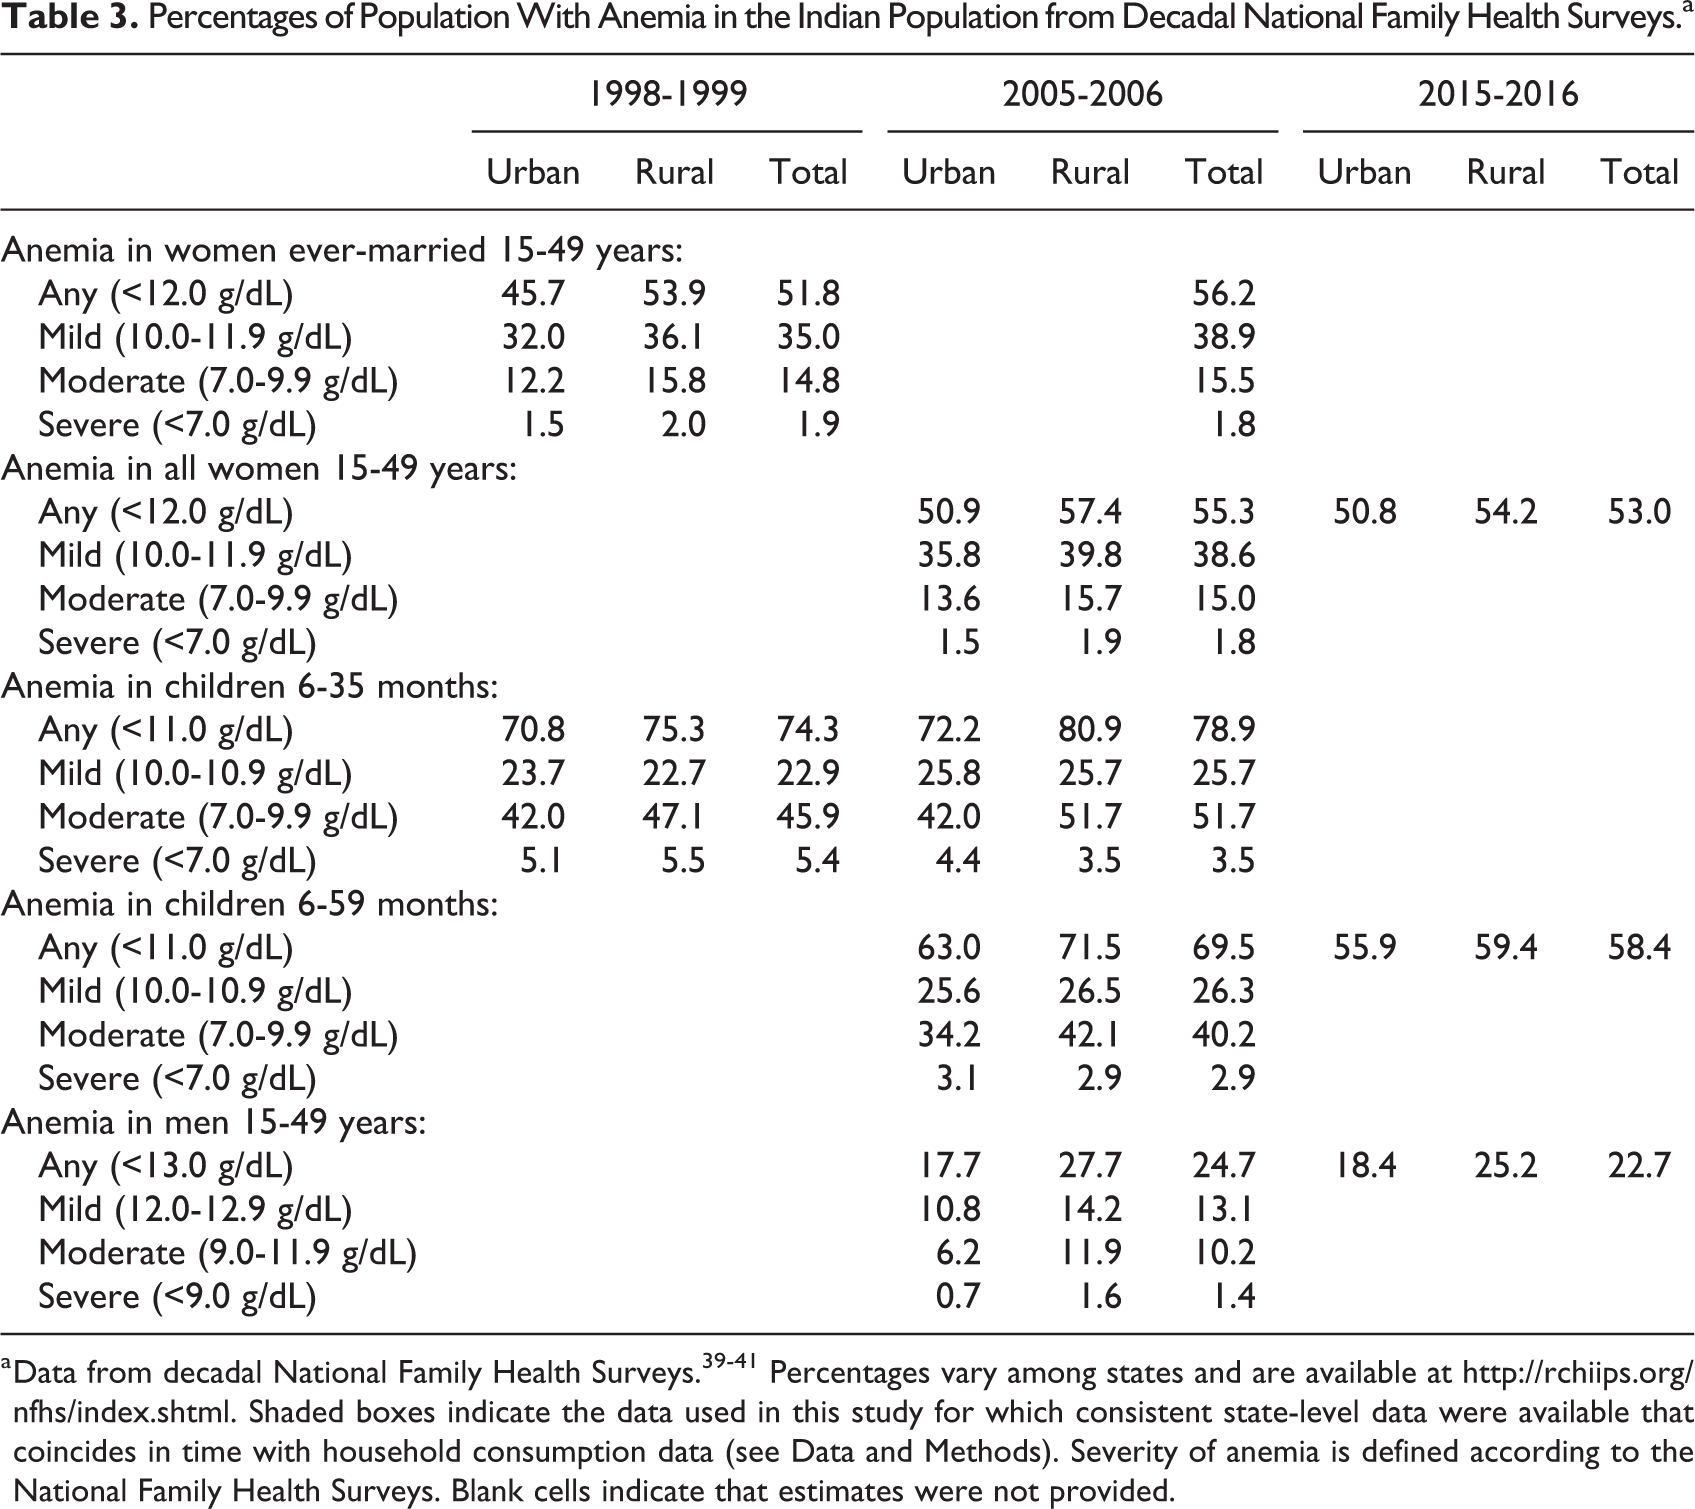
a Data from decadal National Family Health Surveys. 39 -41 Percentages vary among states and are available at http://rchiips.org/nfhs/index.shtml. Shaded boxes indicate the data used in this study for which consistent state-level data were available that coincides in time with household consumption data (see Data and Methods). Severity of anemia is defined according to the National Family Health Surveys. Blank cells indicate that estimates were not provided.
In order to understand the role of reduced coarse cereal consumption on health outcomes in India, we address the following questions: How has consumption of coarse cereals, iron, and other micronutrients associated with anemia changed over the study period across states, income groups, and rural/urban populations in India? To what extent is prevalence of anemia attributable to dietary iron and other micronutrients in the Indian diet? How does the prevalence of anemia vary with iron and other micronutrient intake from different food groups in the Indian diet?
The study period covers 1983 to 2011 which corresponds to the availability of household-level consumption data in India.
Data and Methods
Trends in Consumption of Coarse Cereals and Iron
To obtain data on consumption of food items, we used household-level data from the National Sample Survey of Consumption Expenditure available from the Government of India’s Ministry of Statistics and Program Implementation (http://www.mospi.gov.in/sample-surveys). The survey is a large national sample on household consumption and expenditure carried out approximately every 5 years and designed to be representative at national and state levels for rural and urban populations (see Appendix B in National Sample Survey Organisation 15 for sample design and survey procedure). The surveys include 30-day recall on quantities consumed and expenditure of more than 100 food items. We used data from the following survey rounds: 1983 (round 38), 1987 to 1988 (round 43), 1993 to 1994 (round 50), 1999 to 2000 (round 55), 2004 to 2005 (round 61), 2009 to 2010 (round 66), and 2011 to 2012 (round 68). The surveys include a total number of 806 831 observations spread over these time periods (see last column in Supplemental Table 4 for breakdown of number of observations by state, round, and urban/rural).
Due to differences in items included and changing administrative boundaries, we harmonized the data across rounds. The food items covered in the survey varied across rounds, which necessitated a subsampling of food items based on availability and importance. Because of their importance in the Indian diet, all cereals were included. For other food items, only those present in all (or most) rounds were included in the appended data set, resulting in 84 food items.
To harmonize across changing administrative boundaries between the earliest (1983) and most recent (2011-2012) surveys, we mapped every new district formed after 1983 to its parent district based on a list of 400 districts from 1981. We used state boundaries consistent with the earliest consumption data (1983), which merges Chhattisgarh and Madhya Pradesh into Madhya Pradesh; Jharkhand and Bihar into Bihar; and Uttaranchal and Uttar Pradesh into Uttar Pradesh. Following the procedure and the quantities used for edible fraction in study by Rao et al, 42 we combined quantities consumed in the 30-day recall period with India-specific nutritional content for the 84 food items. 35 Household composition was not available for earlier rounds, necessitating the assumption of equal consumption across household members. Consequently, we calculated per capita consumption (assuming household members consume equal quantities) in 30 days for iron, phytate, total polyphenols, folate, vitamin B12, vitamin C, and calories for each round (Supplemental Table 1). Due to outliers in survey responses, we truncated the variables of consumption quantities at the 95th percentile values.
We averaged the per capita consumption of nutrients disaggregated by urban/rural, state, and quartiles of monthly per capita expenditure (MPCE). We calculated a weighted average of per capita consumption, with weights calculated from National Sample Survey designated multipliers for every household. 15 To compare the contributions of food groups to overall nutrient consumption, we categorized food items into cereals, fruits/vegetables/tubers, nonmeat protein sources (eg, legumes), meat/fish (heme sources), milk products, and fats/sugars/beverages (Supplemental Table 1).
We used MPCE as a proxy to group households into quartiles of income level. The survey data report a MPCE for every household in a given round. However, on account of inflation-based temporal variation that impedes the comparison of MPCE values across rounds, we used an inflation-adjusted MPCE value for every household with 1997 to 1998 as the base year. The consumer price index data for the inflation adjustment calculation was taken from the Labor Bureau of India. We determined the quartile thresholds separately for each round.
Relating Anemia Prevalence to Iron and Other Micronutrient Consumption
We used mixed effect models (lmer() in R) to relate prevalence of anemia at the state level with dietary, demographic, and household characteristics for 2 response variables: percent state-level anemia of ever-married 15- to 49-year-old women and of children younger than 3 years. The time periods were restricted by the availability of consistent consumption and anemia data. We used round 55 (1999-2000) and round 61 (2004-2005) consumption data and health survey data from the National Family Health Survey for 1998 to 1999 and 2005 to 2006. 39,40 Prevalence of anemia in men was only available in 2005 to 2006 health surveys and was not included due to small sample size.
Diet-related predictor variables included state-average per capita 30-day iron consumption (consistent with the units of the survey data) in different food groups such as cereals, meat, and fish (heme sources), and other nonheme sources (fruits/vegetables, nonmeat protein, and dairy products). We also included total phytate consumption, molar ratio of phytate-to-iron, polyphenols, folate, vitamin B12, and vitamin C as separate variables. The molar ratio is calculated as phytate intake/phytate molar mass divided by iron intake/iron molar mass. Molar masses are 660.04 and 55.84, respectively.
In addition to consumption data, we included other predictor variables that possibly affect prevalence of anemia. These variables include income status (average MPCE as proxy), education level of female and head of household (years of schooling) which is known to be related to health outcomes, 43,44 and percentage of households with piped water and sanitation (see Supplemental Table 2 for data sources and units).
Phytate consumption in the total diet was strongly correlated with iron consumption from cereals. Due to this colinearity, it was not possible to use this variable in the models (Supplemental Table 3). In addition, education of female and household head, as well as MPCE and education of household head, were colinear (R 2 greater than or equal to 0.5). We consequently constructed models eliminating the colinear variables (phytate and education of household head) using state-level data for those population groups with consistent data across years that coincides with consumption data. We applied the model to each of the 2 response variables: anemia prevalence in women ever-married 15 to 49 years old and anemia prevalence in children 6 to 35 months. Random effects included in all models were round (55 or 61) and region. Random effects account for differences that occurred between rounds and between regions not captured by the other variables, such as iron supplementation programs and food preparation. We standardized the variables in order to assess the relative contributions of each variable to the response variables. We also reran the models with unstandardized variables to allow us to directly relate the coefficients to changes in consumption. In addition to eliminating colinear variables, we checked that the variable inflation factor was under 10 for all variables in the models that led to further elimination of folate as a variable in the models.
We used these models to assess whether iron in different food groups (cereals, heme sources, and noncereal nonheme sources) and other micronutrients in the diet are related to anemia in women and children. Our interest is in the significance and magnitude of the effect of these micronutrients after accounting for confounding effects, rather than on developing models to predict anemia from all possible factors.
Results
Trends in Consumption of Cereal and Iron
At a national scale, the contribution of cereals to total per capita calorie consumption declined on average from 81% in 1983 to 70% in 2011 for rural households (Figure 2A) and from 70% to 60% for urban households (Supplemental Figure 2A). Coarse cereals declined substantially from 23% of all cereal calories in 1983 to 6% in 2011 for rural households and 10% to 3% for urban households. For rural households (averaged over a national scale), a small portion (3%) of the decline in per capita calories from coarse cereals was compensated by increase in wheat consumption, a larger proportion (34%) from other food groups, and nearly no change in rice consumption, resulting in a net loss of 6% of overall calories between 1983 and 2011. For urban households, for which coarse cereals comprise a smaller portion of cereal consumption, the overall net loss of calories was 3% with increase in wheat consumption and other food groups compensating 4% and 45%, respectively of the loss from coarse cereals.
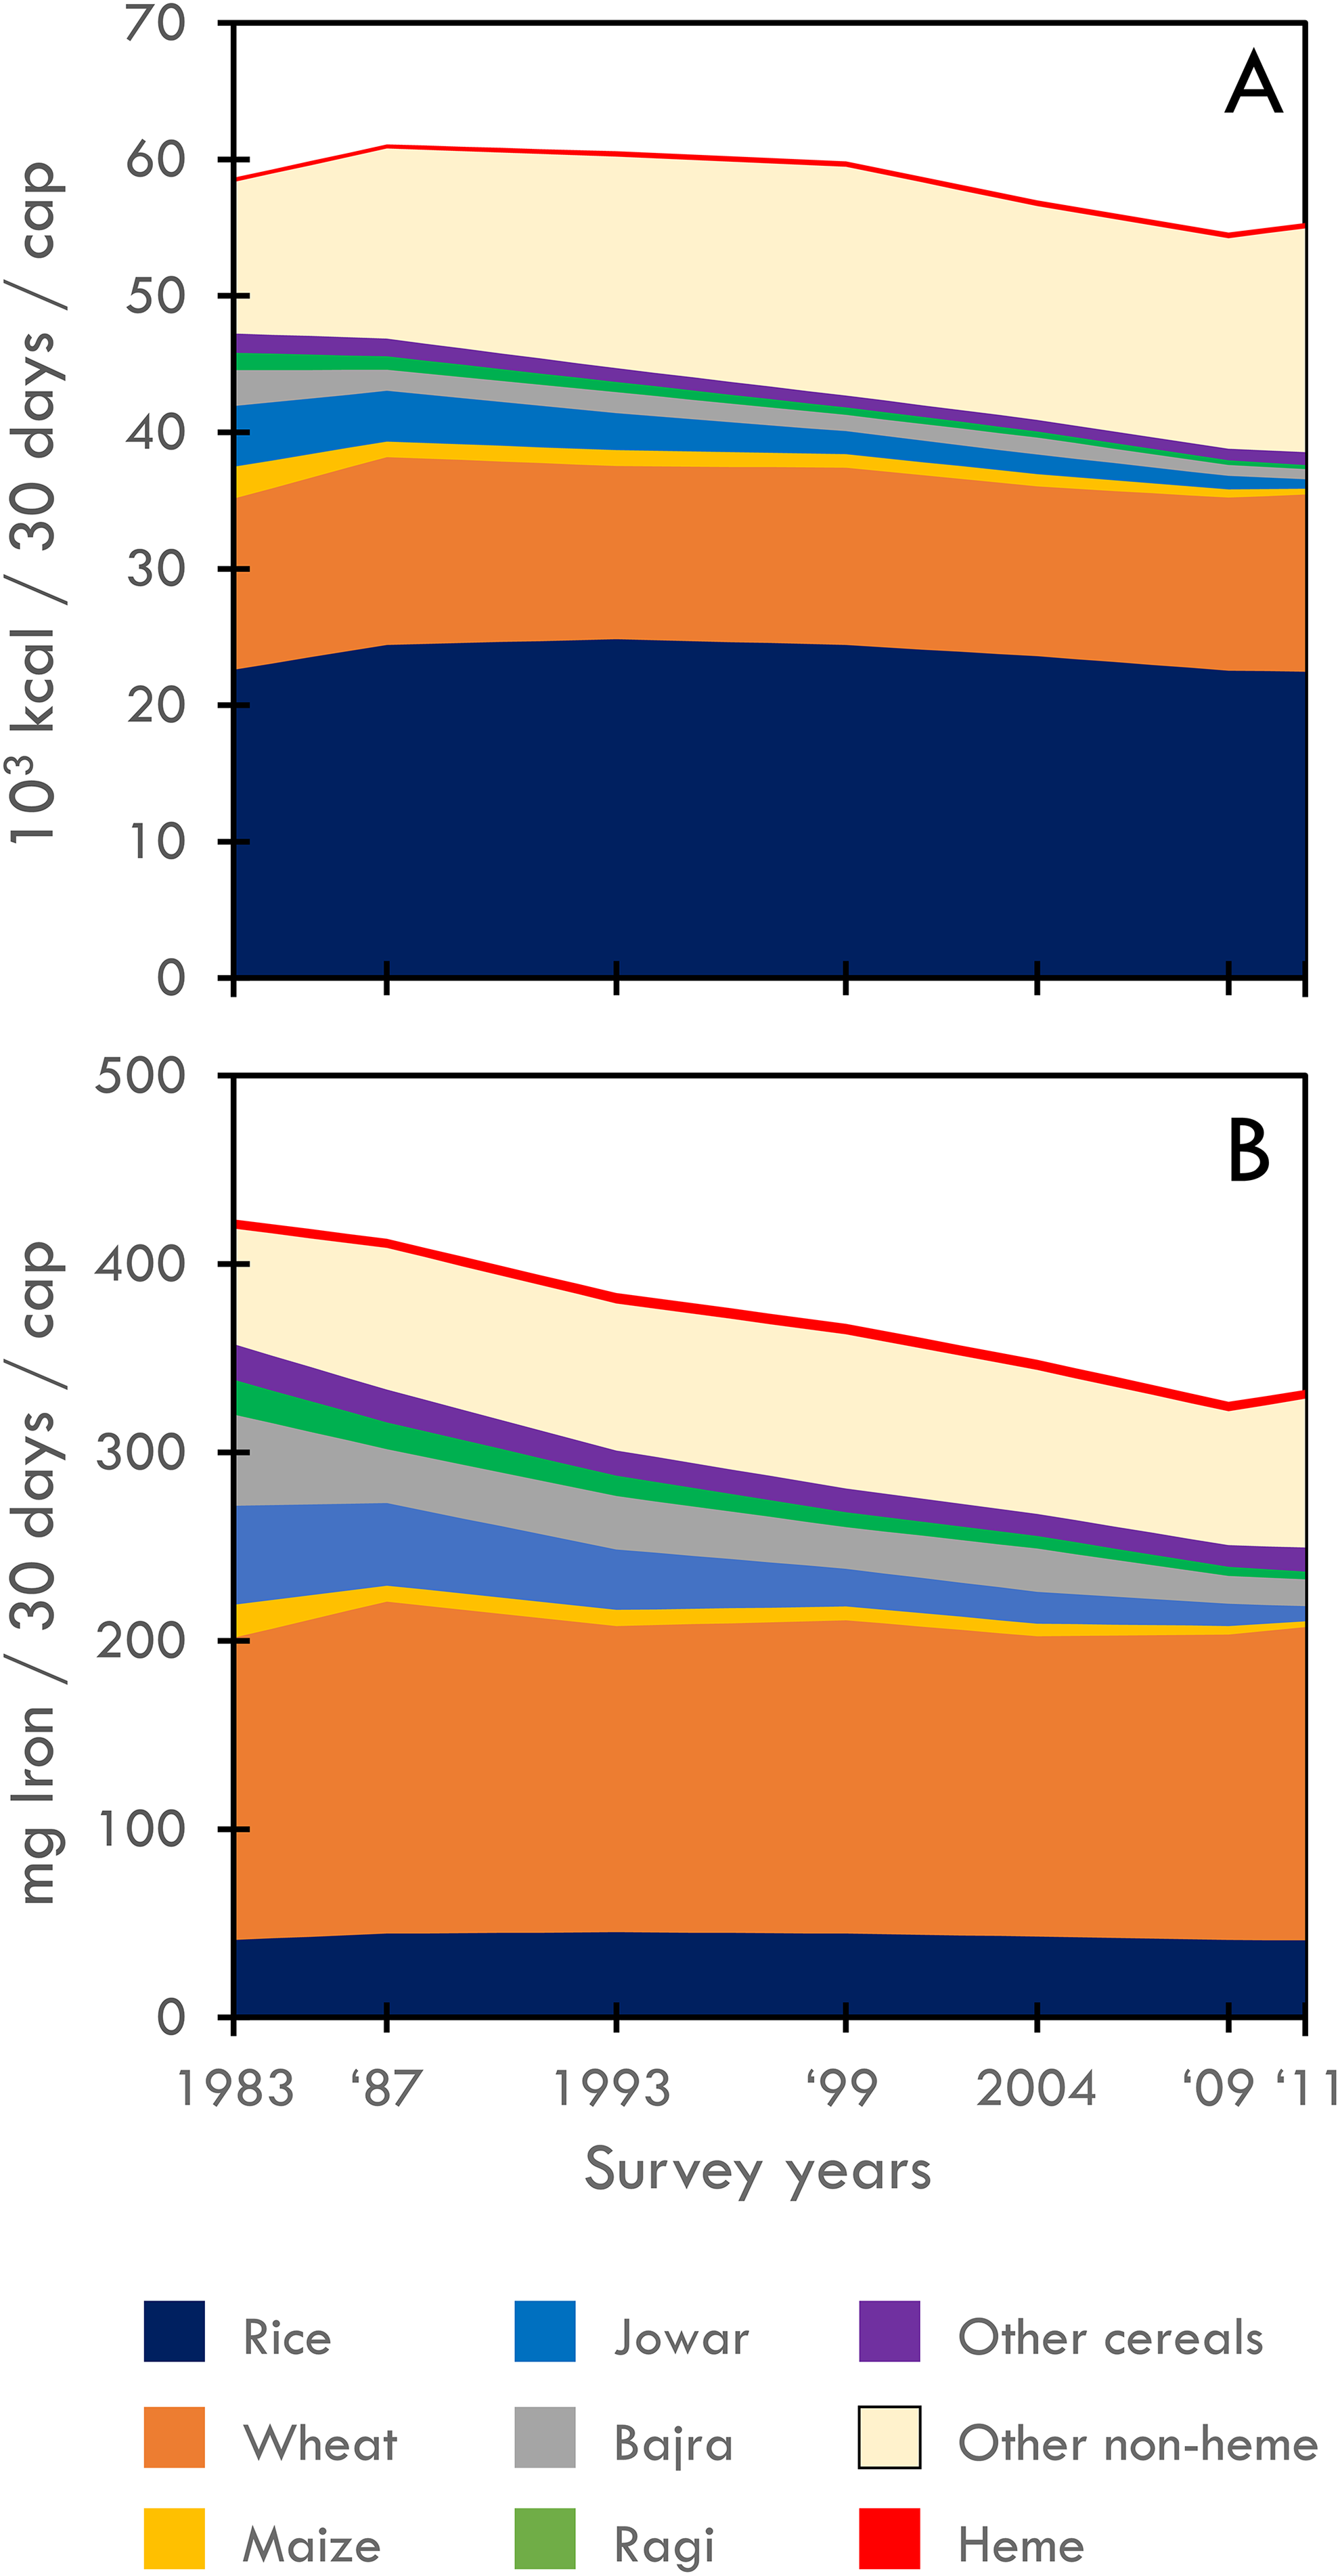
Contributions of rice, wheat, coarse cereals (jowar, bajra, maize, and ragi), other nonheme food groups (fruits/vegetables/tubers, milk products, and other nonanimal protein sources), and heme sources (meat and fish) to per capita consumption of calories (top) and iron (bottom) averaged nationally for rural households in consumption surveys from 1983 to 2011. See Supplemental Figure 1 for urban households and Supplemental Figure 2 for examples of state averages. Note: The color version of this figure is available online.
Because coarse cereals have relatively high iron content (Table 2 and Supplemental Table 1), they contribute a larger proportion of iron to the total diet than in the case of calories (Figure 2B). Rural households on net lost 21% of total iron intake between 1983 and 2011. The loss of iron from the decline in consumption of coarse cereals was compensated partially by increase in consumption of wheat (with relatively high iron content for widely consumed “atta” whole wheat) and other nonheme food groups, 6% and 18% of the iron loss from decline in coarse cereals respectively at a national scale. Heme sources account for <2% of total calories and 1% of iron intake. Consumption of heme sources remained nearly stable over the time period. Urban households’ net reduction in iron intake was 11% (Supplemental Figure 2B).
Disaggregated by quartiles of MPCE, rural households in the top MPCE quartile had on average the highest total iron intake at both the beginning and the end of the study period but iron declined by 27% (Figure 3A). The bottom quartile for rural households had the largest decline in iron (32%). At the beginning of the study period, total iron intake for the rural bottom quartile was equivalent to urban top quartile households but declined by the end of the study period to the lowest among all the groups. Rural bottom quartile households experienced the largest decline in coarse cereals, which resulted in the greatest decline in iron density for cereals among the quartile and rural/urban groupings (Supplemental Figure 3B). These households also experienced an increase in the phytate-to-iron molar ratio, unlike urban and higher income households (Supplemental Figure 4). The increase in the ratio is attributable to the high ratios in rice and wheat relative to the coarse cereals (except maize; Table 2).
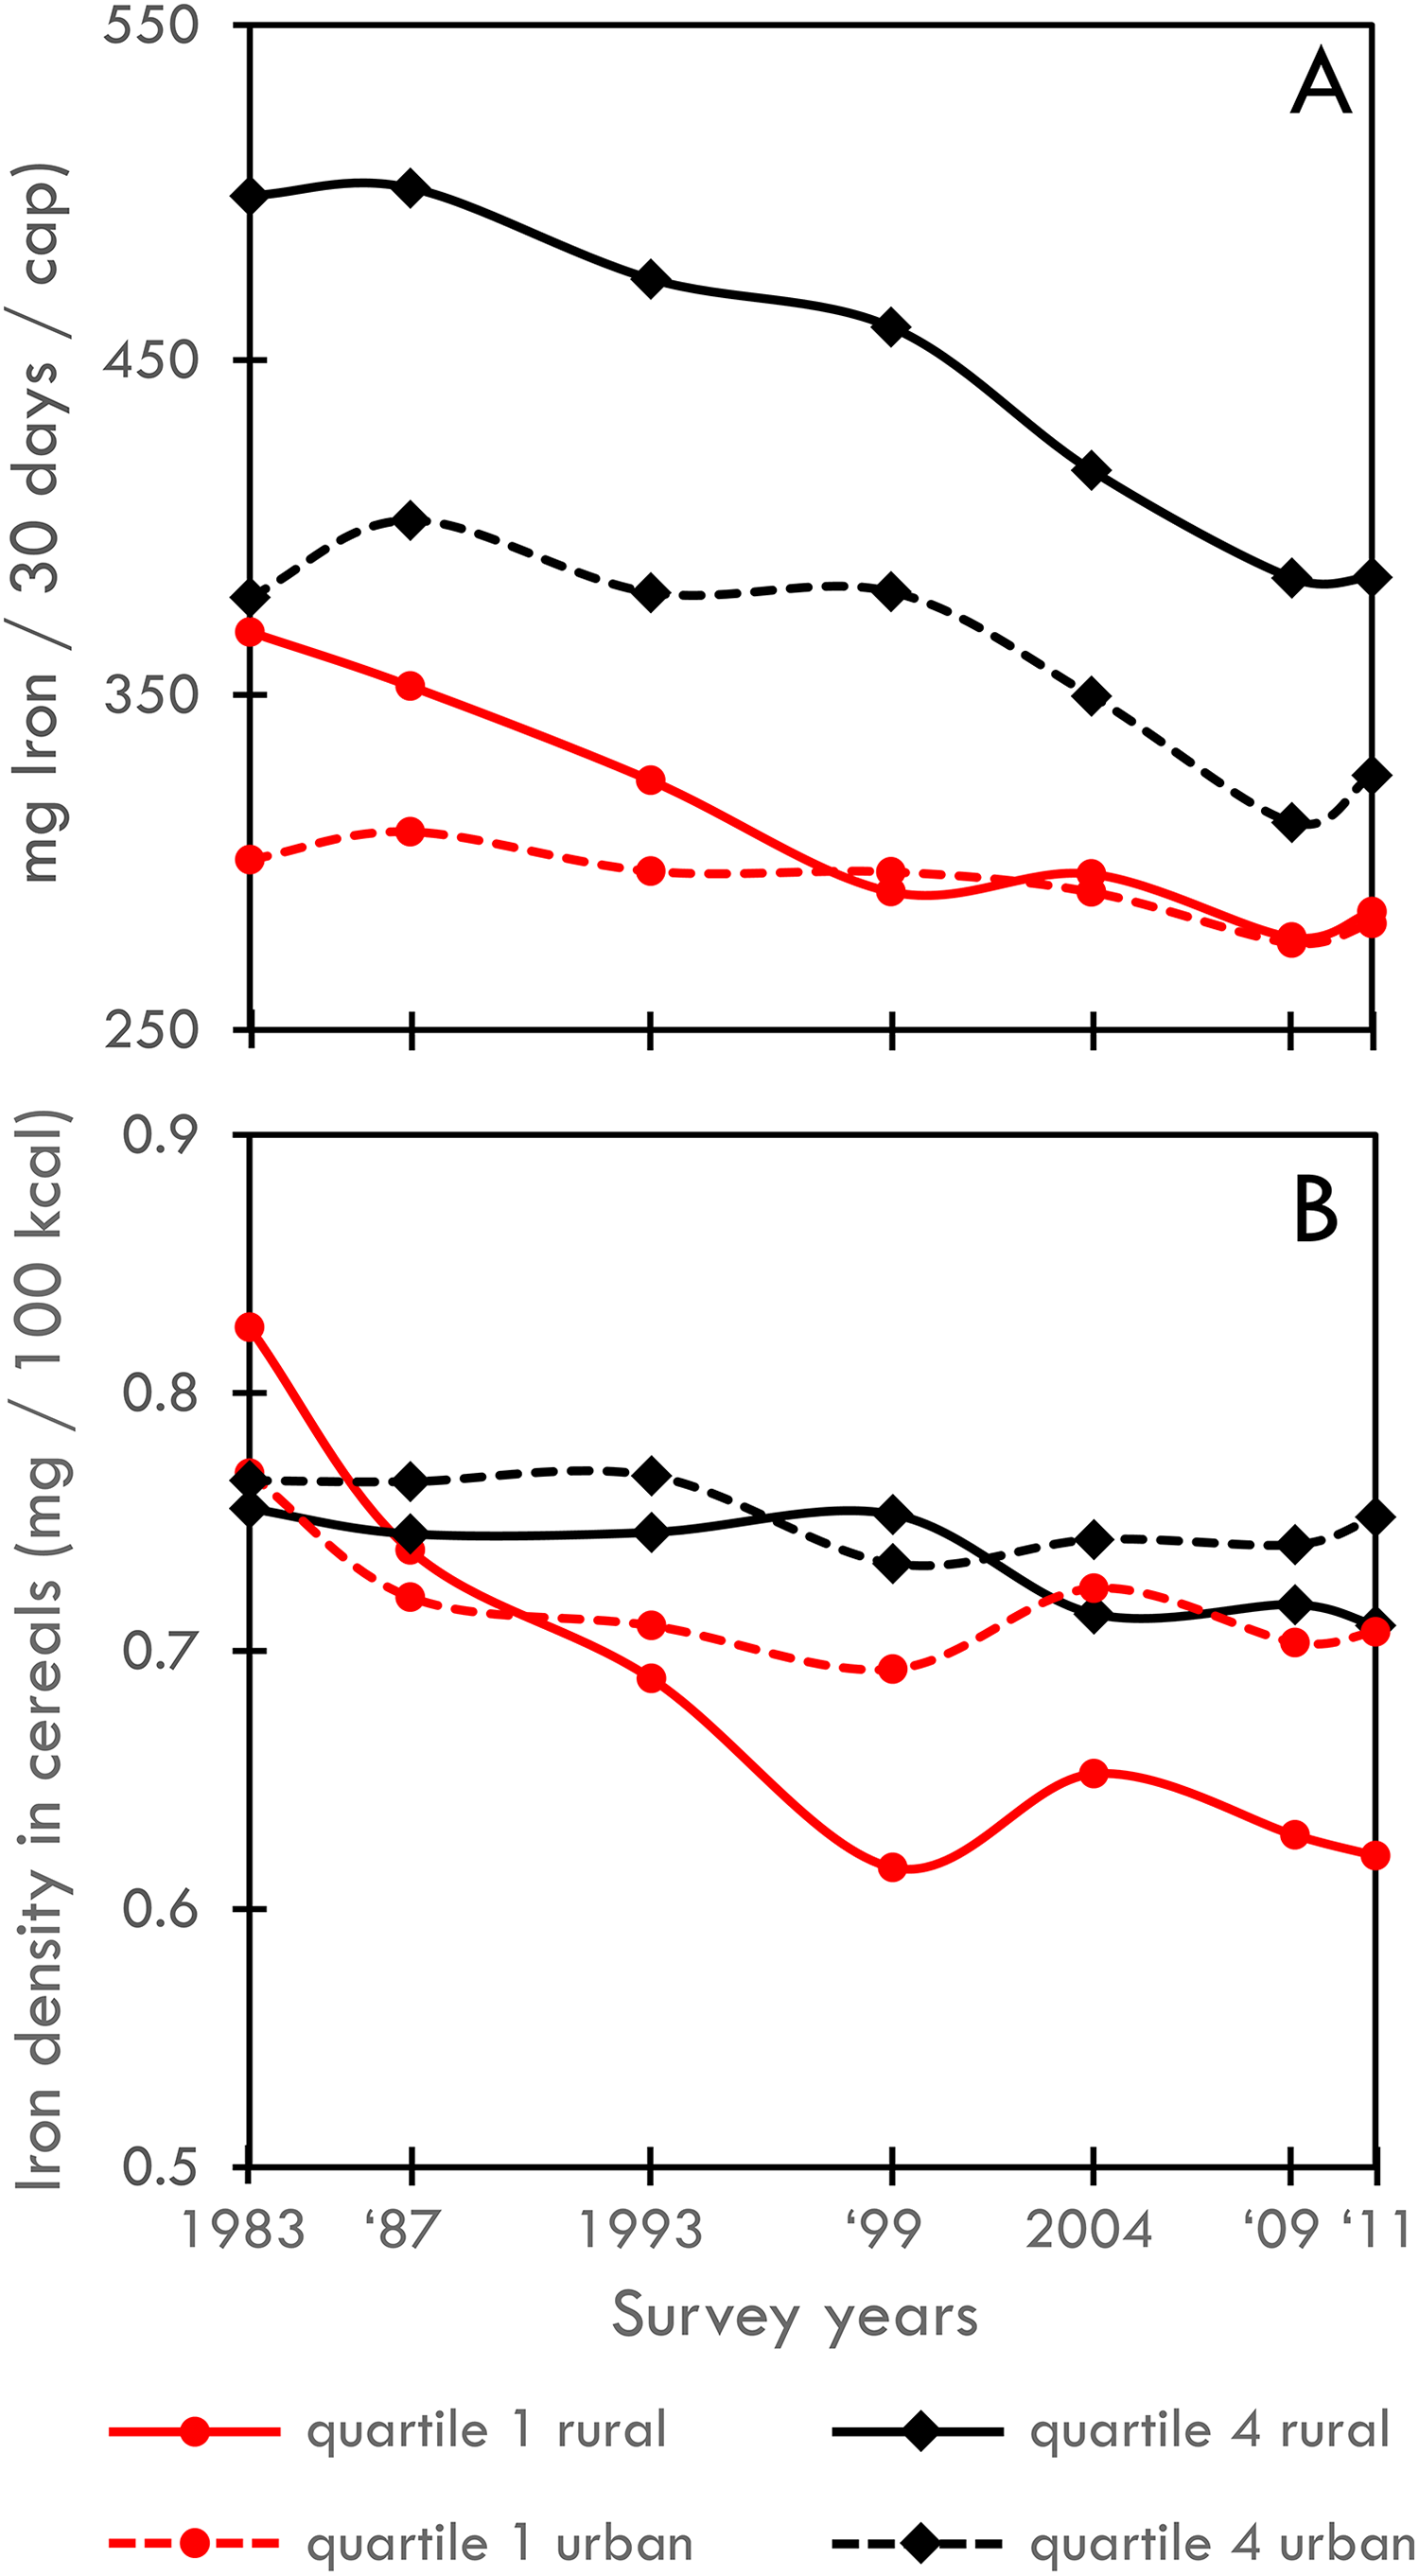
Total iron from all food groups averaged country-wide across the bottom quartile (red) and top quartile (black) of adjusted monthly per capita expenditure for rural (solid) and urban (dashed) households (top panel). Iron density of cereals (ratio of iron from cereals to calories from cereals; bottom panel).
National-level aggregations mask over many regional differences in dietary patterns and trends in consumption (Figure 4; Supplemental Table 4). Across all states, average net total iron consumption per capita (including all food groups) increased in 4 states and declined in 22 states for rural households, indicating that iron from other foods only partially replaced the iron lost from coarse cereals in most states (Supplemental Table 5). Average iron consumption per capita for rural households exceeded the recommended intake (470 mg/30 days/cap average for women, men, and children) 45 in 8 states in 1983 and in 1 state in 2011 (2 states in 1983 and no states in 2011 for urban households; Figure 4). Urban households show similar patterns (Supplemental Figure 5).
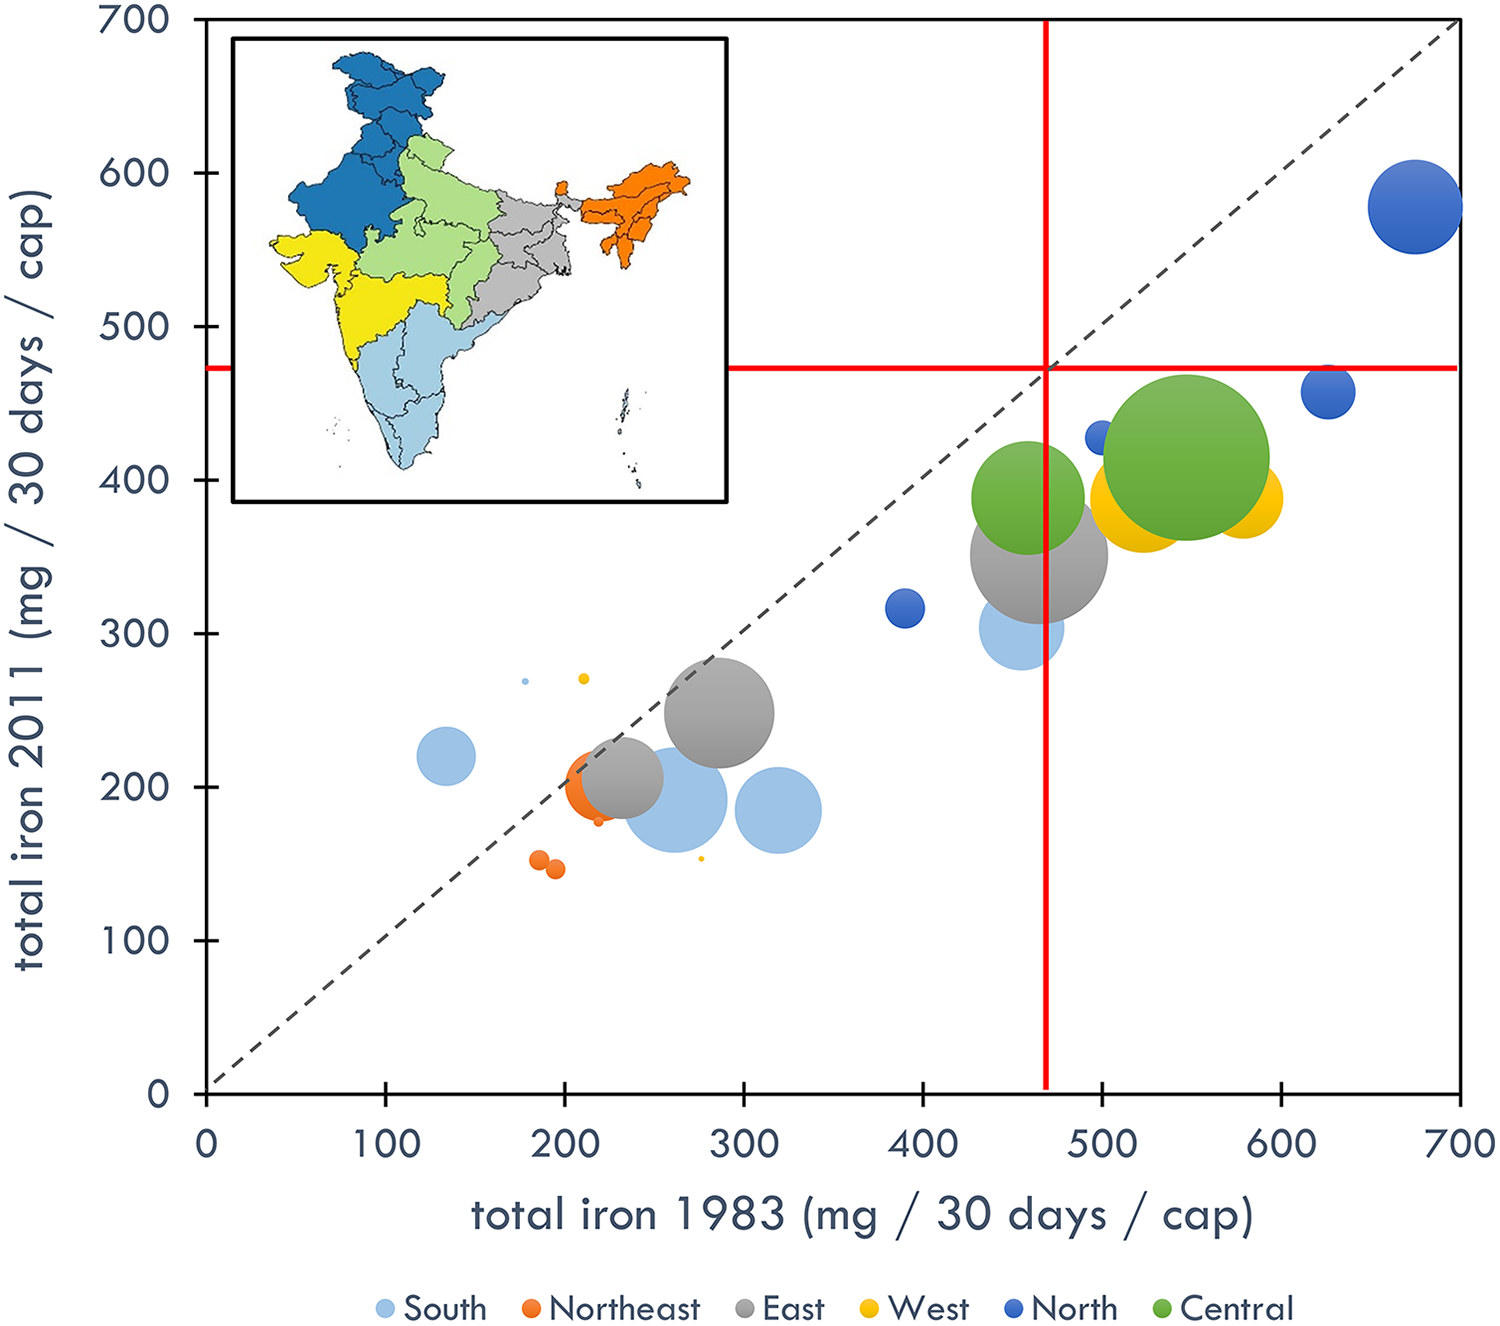
Total iron consumption (mg iron/30 days/cap) in 1983 and 2011 for rural households (bottom). Dashed line is one-to-one line. Red lines are recommended iron intake (mg/30 days/cap) averaged for men, women, and children. 45 Size of bubbles is relative to 2011 state population 46 and color coded by region defined by Longvah et al. 35 See Supplemental Figure 5 for urban households.
States vary greatly in the contributions of different cereals and other food groups to nutrient consumption (see 42 for large variations in nutrient consumption across states and regional patterns). Three state-level examples of average iron consumption in rural households illustrate different patterns (Supplemental Figure 6). In the southern state of Andhra Pradesh, where diets are heavily rice-based, total iron consumption is relatively low (approximately 200 compared with average 288 mg/30 days/cap across states in 2011). In 1983, coarse cereals, particularly sorghum (jowar), contributed over 60% of iron consumption from cereals and almost half of all iron consumption in Andhra Pradesh. The large decline in coarse cereals without replacement by iron-rich foods has resulted in an average decline of 70 mg/30 days/cap. Rural households in the western state of Gujarat had, on average, among the highest iron consumption of all states in 1983 (approximately 580 compared to average 342 mg/30 days/cap in 1983). A very large proportion of iron comes from pearl millet (bajra), which has declined but still contributed considerable iron in 2011. In 2011, rural households in Gujarat on average consumed relatively high amounts of iron (approximately 390 mg/30 days/cap). The southern coastal state of Kerala displays a very different pattern. Diets are rice-based with a small contribution of coarse cereals. Increased consumption from other food groups (fruits/vegetables/tubers, nonmeat protein sources, and meat/fish) increased average total iron consumption by 65% from 1983 to 2011. Except for the example of Kerala, the common pattern across states is a general decline in coarse cereal consumption, although the particular cereals and compensation by other food groups vary widely geographically, across income strata, and likely among ethnic groups (although the latter is not analyzed in this study).
Trends in Consumption of Other Micronutrients
Trends in total dietary consumption of noniron micronutrients generally indicate the following at a national scale: an overall increase in absorption-enhancing vitamin C; a net decline in absorption-inhibiting phytates and polyphenols resulting from a large decline in coarse cereals partially compensated by a small increase in other food groups; and a negligible net change in folates with a substantial increase in vitamin B12 from increased consumption in eggs and dairy (Figure 5). All of these trends (increased absorption-enhancing, decreased absorption-inhibiting, and increase in nutrients for which deficiencies are related to anemia) theoretically would contribute to a decline in anemia prevalence. On the contrary, the decline in net iron intake owing to the loss of coarse cereals would contribute to an increase in anemia prevalence. The large standard deviations around the national-scale averages indicate variability across states.
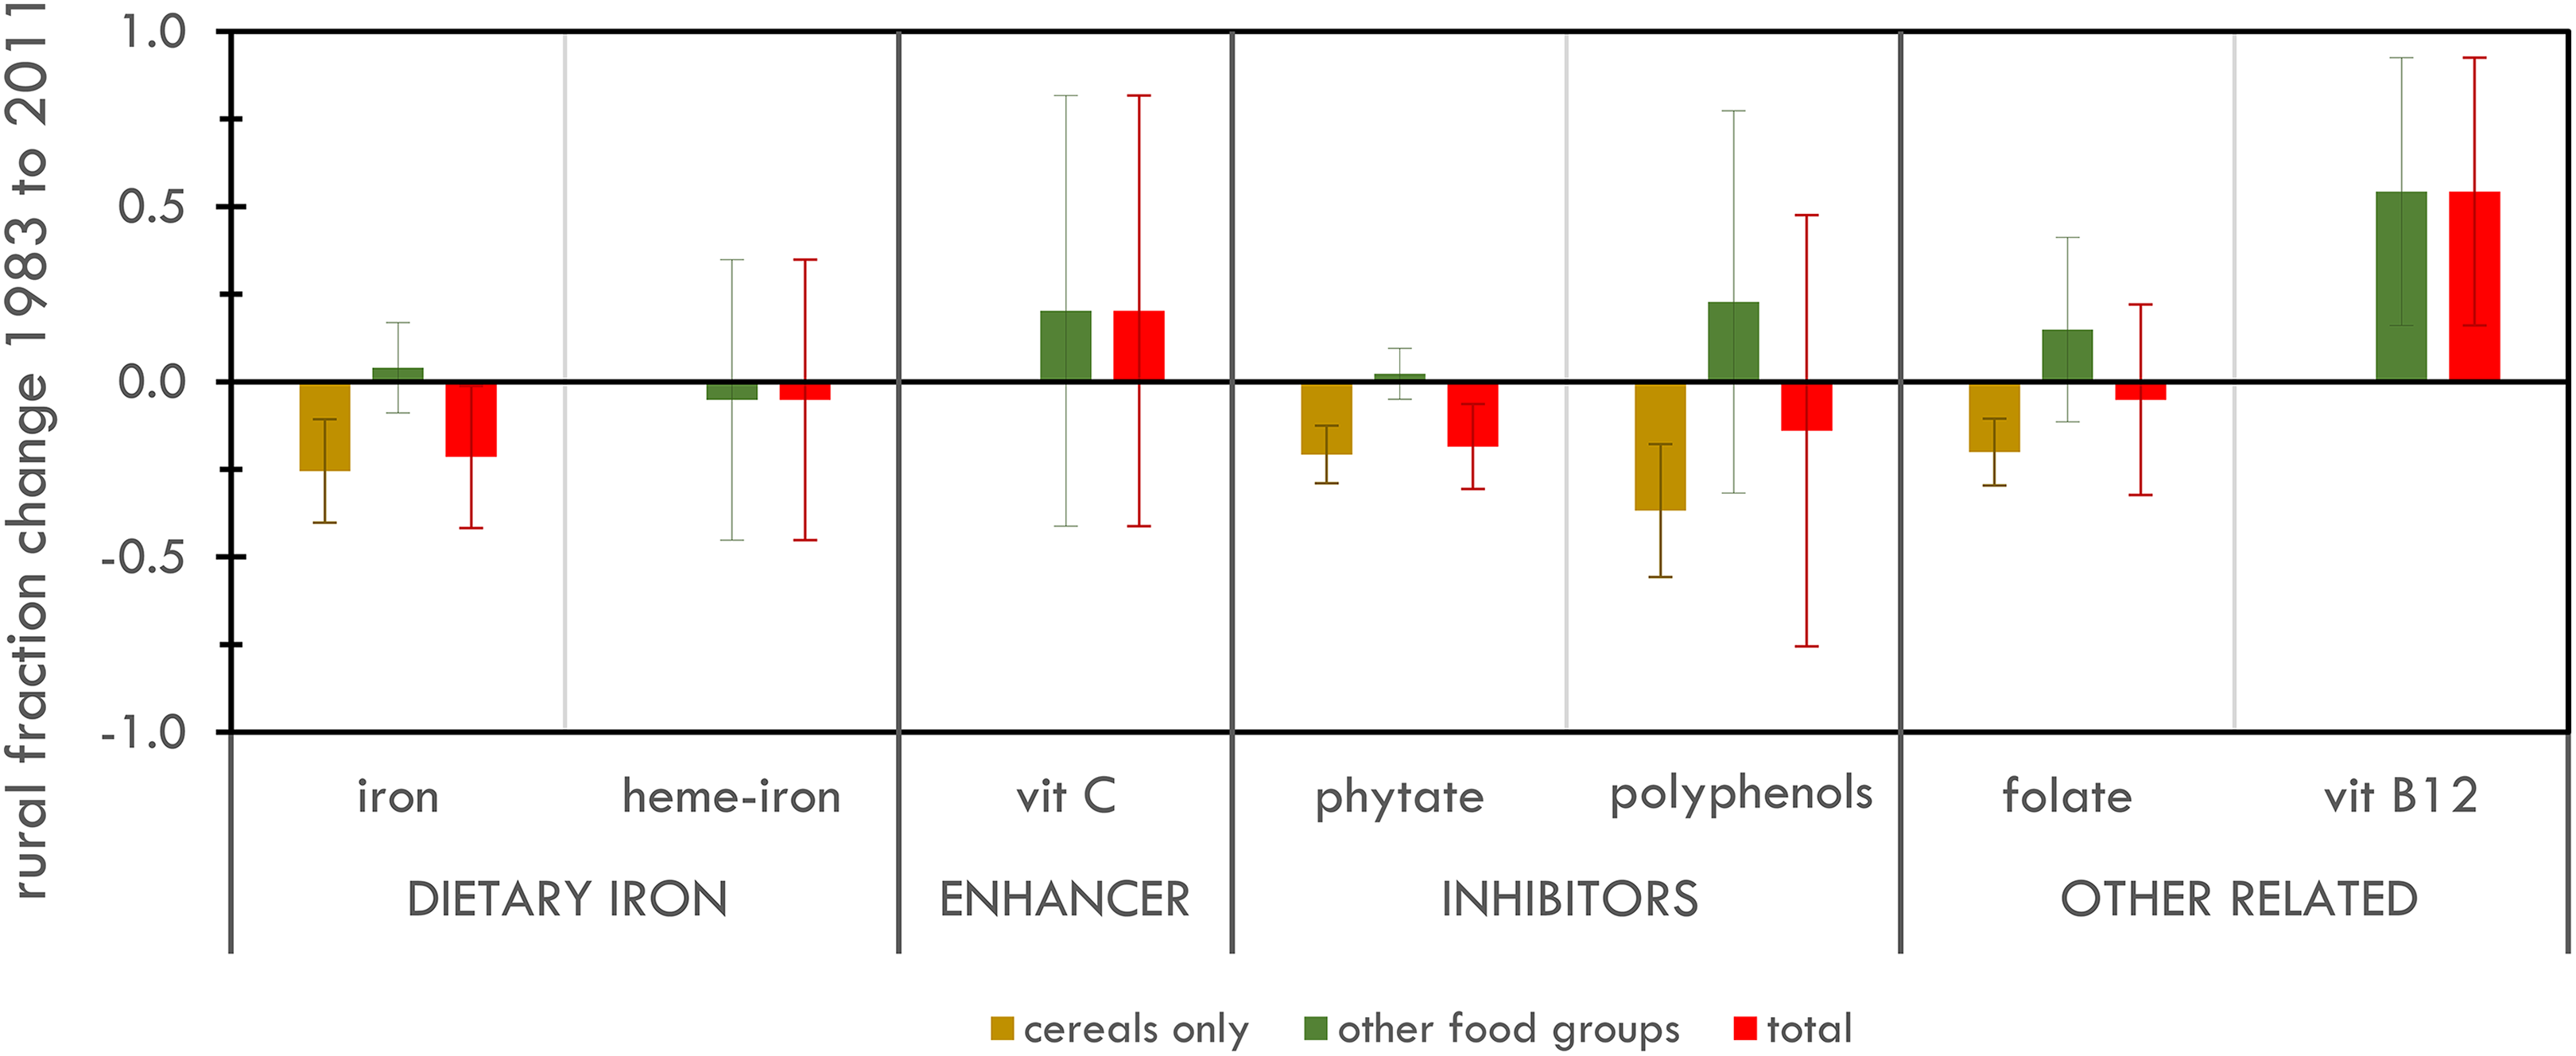
National-scale differences between 1983 and 2011 in average per capita consumption for dietary iron (total iron and heme-iron), absorption-enhancing (vitamin C), absorption-inhibiting (phytates and polyphenols), and other anemia-related (folate, vitamin B12) micronutrients from cereal sources and other food groups. Percentages are relative to 1983 consumption for each nutrient. Standard deviations represent variability across states.
Relation of Anemia to Iron and Other Micronutrient Consumption
For women’s anemia, iron consumption from cereals is negatively and significantly associated with prevalence (Table 4). The highest standardized coefficient indicates that iron consumption from cereals explains the most variability in anemia prevalence relative to the other variables. The coefficient (unstandardized) suggests that an increase of 100 mg/30 days of iron from a household’s average per capita cereal consumption is associated with a 7.5 (5.3-9.7) percentage point decline in prevalence of women’s anemia. The average national decline in iron from 1983 to 2011 was 108 and 58 mg/100 days/cap for rural and urban populations respectively, suggesting an 8% and 4% respective decline in anemia prevalence if coarse cereals were consumed in amounts prevalent in 1983. However, the significant negative association of the phytate-to-iron ratio with anemia prevalence suggest that high phytate content (which generally corresponds to a low ratio because cereals with relatively high phytate content have even higher relative iron content, see Table 2) partially offsets the benefit from increased iron in cereals (2.5% decline in anemia prevalence corresponding with a 1 point increase in the ratio; the ratio declined by 0.6 and 1.3 from 1983-2011). Higher female education is also negatively associated with anemia. Other micronutrients are not significant.
Standardized Coefficients and Standard Errors (in parentheses) for Mixed Effect Models to Predict Health Outcomes From Nutrient Consumption.a
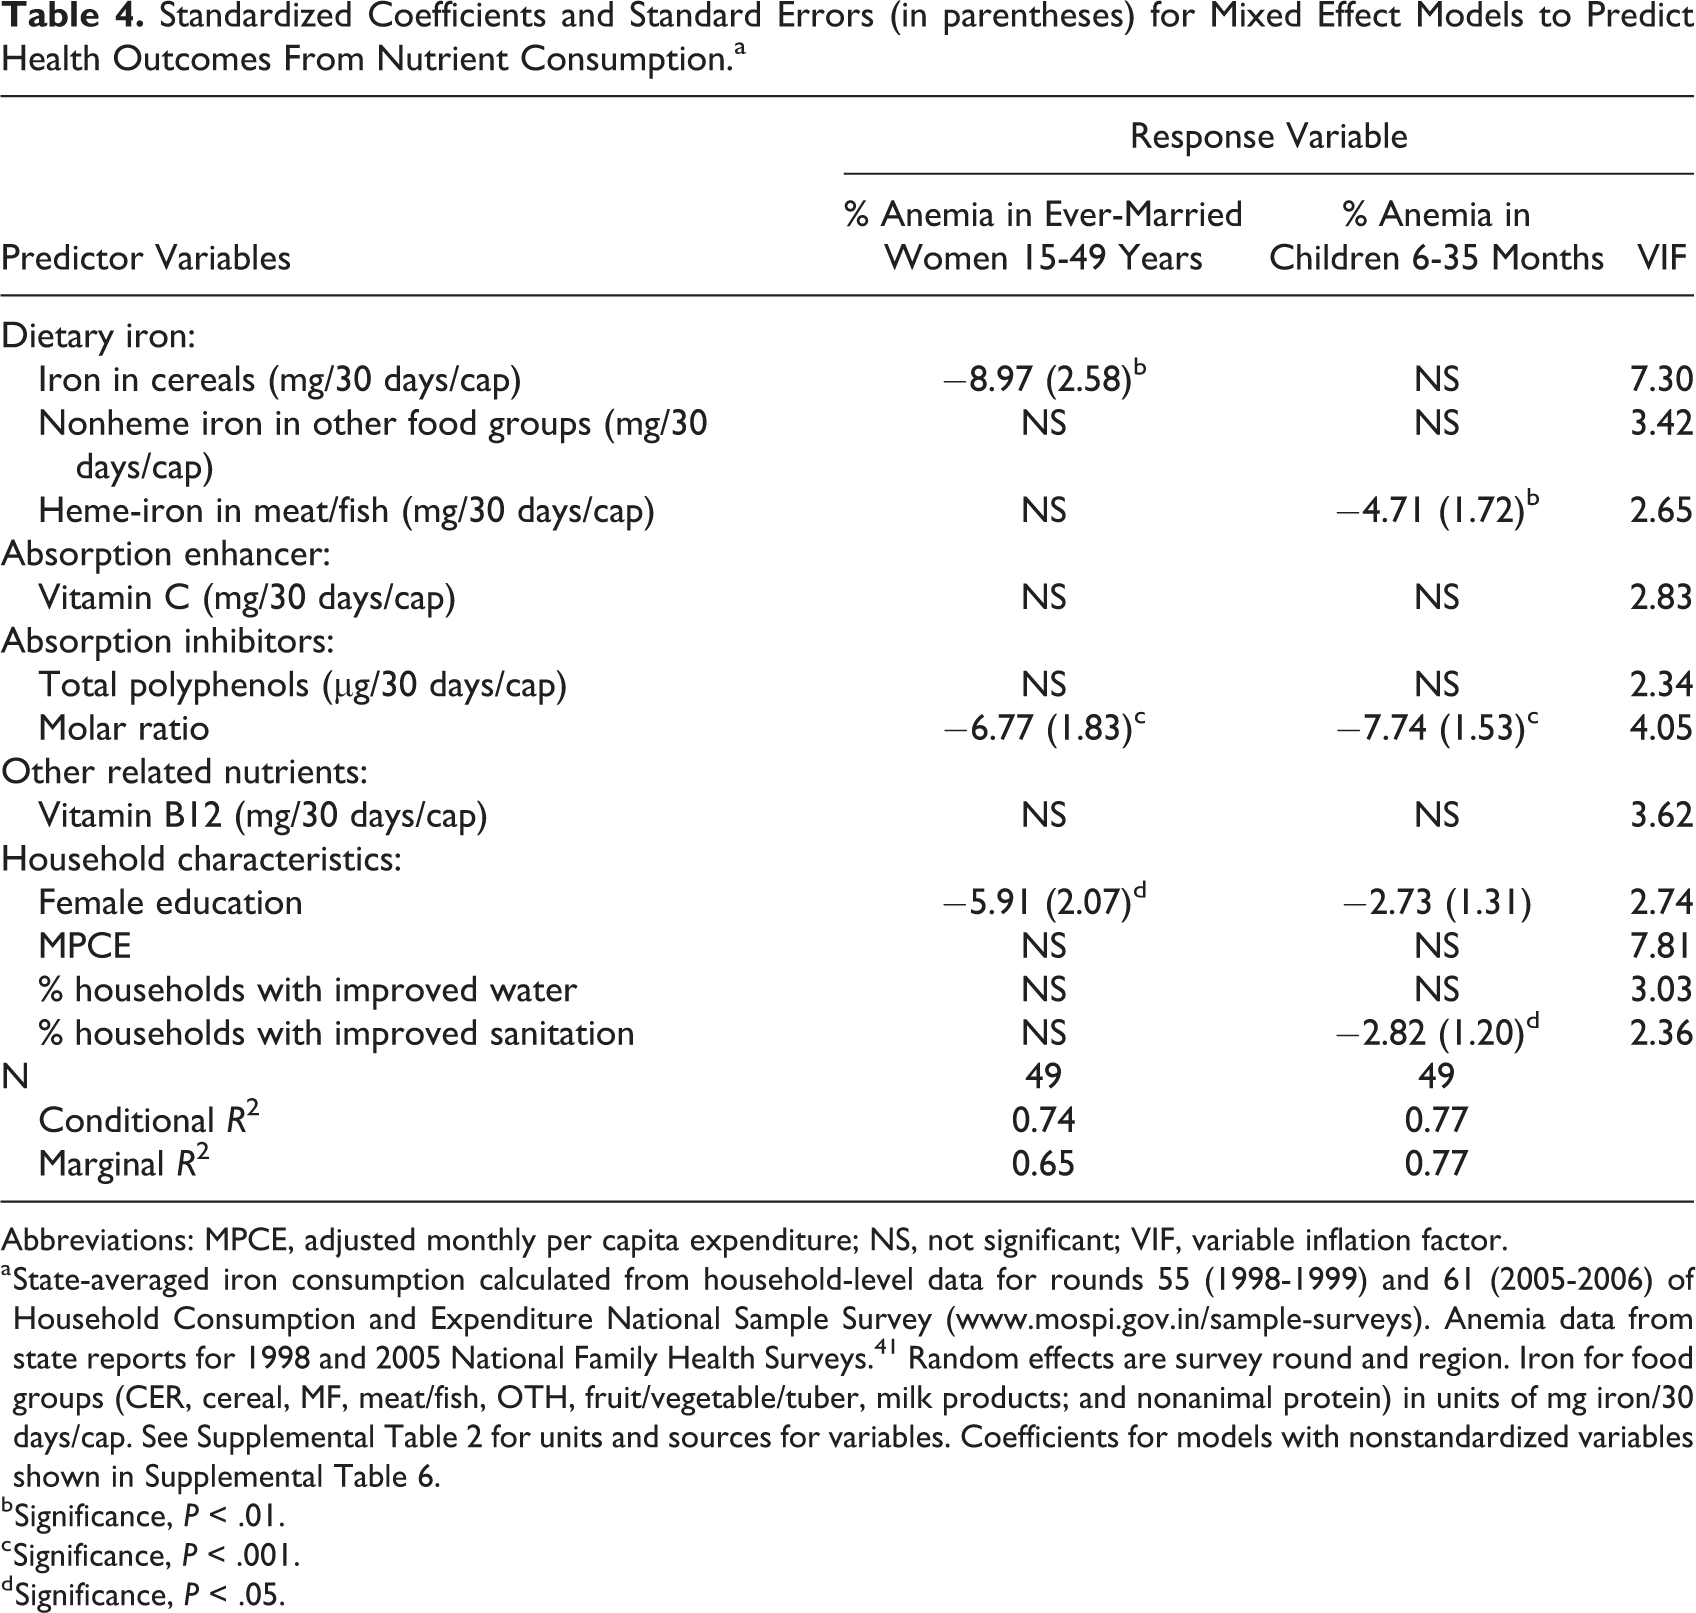
Abbreviations: MPCE, adjusted monthly per capita expenditure; NS, not significant; VIF, variable inflation factor.
a State-averaged iron consumption calculated from household-level data for rounds 55 (1998-1999) and 61 (2005-2006) of Household Consumption and Expenditure National Sample Survey (www.mospi.gov.in/sample-surveys). Anemia data from state reports for 1998 and 2005 National Family Health Surveys. 41 Random effects are survey round and region. Iron for food groups (CER, cereal, MF, meat/fish, OTH, fruit/vegetable/tuber, milk products; and nonanimal protein) in units of mg iron/30 days/cap. See Supplemental Table 2 for units and sources for variables. Coefficients for models with nonstandardized variables shown in Supplemental Table 6.
b Significance, P < .01.
c Significance, P < .001.
d Significance, P < .05.
For children, iron consumption in the heme–iron meat and fish food group is negatively associated with anemia, whereas iron in cereals is not significantly associated with anemia. The coefficient between iron in meat and fish food group and anemia prevalence in children is an order of magnitude higher than the coefficient between iron in cereals and anemia prevalence in women. Association with the phytate-to-iron ratio suggests the inhibiting effect of phytate on iron absorption (high ratio corresponds with low phytate and less anemia). Model results indicate associations between higher education level of female household members with lower prevalence of anemia in women and children (Table 4). For children’s anemia, sanitation is also negatively associated with anemia prevalence. As for women’s anemia, other micronutrients are not significant.
Discussion and Conclusion
The analysis of food consumption surveys for over 800 000 Indian households spanning almost 3 decades identifies several trends. The Green Revolution’s focus on rice and wheat as the main cereal crops is clearly reflected in consumption patterns. At a national scale, coarse cereals (jowar, bajra, maize, and ragi) have declined from 23% of cereal calories in 1983 to 6% in 2011 for rural households and from 10% to 3% in urban households.
Because coarse cereals are relatively high in iron content, the decline in coarse cereal consumption has led to an overall decrease in iron intake in cereals. This loss combined with an overall decline in cereal consumption has led to a net loss of iron in the average diet. The loss from cereals was only partially compensated by rice, wheat, and other food groups.
Patterns vary widely by state. Those states that partially replaced the loss of iron from coarse cereals with wheat and other food groups suffered less iron loss than those which increased the proportion of rice. Net per capita consumption of iron declined in 22 of 26 states for which there are data, ranging from a decline of 190 mg/30 days/cap in Gujarat to an increase of 86 mg/30 days/cap in Kerala, the latter due to an increase in iron from other food groups. Similar trends occur in urban households to a lesser extent.
The decline in the iron density of cereals between 1983 and 2011 was steepest for the lowest income quartile (as determined from a proxy of MPCE). In 1983, the bottom income quartile rural households consumed cereals with the highest iron density, and the highest income quartile urban households consumed the lowest iron density. By 2011, that pattern flipped, and the lowest income quartile rural households consumed the lowest iron density cereals.
Several reasons might explain the marked decline in consumption of coarse cereals and consequent loss of iron intake, particularly for poor rural households. India’s PDS, the largest food security program in the world, distributes rice and wheat at highly subsidized rates to below poverty-level households. Coarse cereals have not been a major component of the PDS. 47 Furthermore, rice has historically been viewed as high status food and may be preferred culturally. 48 Coarse cereals, without the research and technological focus that the fine cereals have received, generally have lower yields. Milling, processing, storage, and distribution systems have not kept pace with the advancements for fine cereals.
Many dietary and nondietary factors contribute to anemia, making direct relationships with iron intake difficult to establish. In addition to low iron intake and bioavailability, infection, parasites, blood loss, diarrhea from poor sanitation, and unsafe drinking water can reduce absorption of iron. An additional complicating factor is differences in bioavailability based on physiological status, such as higher iron absorption in pregnant women as pregnancy progresses. 26
Despite the many complicating factors and accounting for confounding demographic and household characteristics, we find that state-level prevalence of anemia in women of child-bearing age, determined by the National Family Health Surveys of 1998 and 2005 (which coincided in time with available consumption data), is negatively and significantly associated with consumption of iron in cereals. We find no such relationship for children’s anemia, rather heme–iron consumption is negatively associated with anemia prevalence in children. Highest education level of females in the household is strongly associated with prevalence of anemia in both women and children. We found some evidence that improved sanitation is associated with reduced anemia but little evidence for piped water or other micronutrients (vitamin C, vitamin B12, and polyphenols).
Because consumption patterns of different cereals vary widely by region in India, increased consumption of coarse cereals would have geographically variable impacts on anemia prevalence. Generally, the southern rice-eating states would benefit more than northern wheat-eating states. Rural, poor populations would benefit as well. These populations likely cannot readily add iron to their diets from noncereal food groups due to affordability and cultural preferences among some groups.
Coarse cereals have other attributes important in an overall assessment of their costs and benefits for Indian agriculture and diets. From a production standpoint, coarse cereals generally require less water, 18 are more resilient to climate variability, 49 and are less sensitive to carbon dioxide concentration in terms of nutrient content than rice and wheat. On the negative side, yields are generally lower. Improved varieties and agricultural practices, as well as processing and preparation that reduce phytate, require investment and research to address these deficiencies. In addition, cultural preferences and entrenched dietary patterns may provide obstacles to adoption of coarse cereals. Increased consumption of coarse cereals would entail behavior changes as well as infrastructure and technologies for production and distribution.
This study is intended as an assessment at the broad scale of the potential for coarse cereals to address the major public health problem of anemia. The study has many limitations. The models are predicated on highly aggregated, state-level averages that are likely not truly representative of diets that vary across income levels, ethnic groups, personal preferences, and many other factors within states. Second, the analysis includes only those food items included in the survey. While the survey is extensive and includes major food items, it is possible that some items are not included, particularly local and unpurchased foods. Third, nutritional content likely varies among varieties, growing conditions, processing, and cooking. We are unable to capture these variations, and how they change through time, from the available data. Fourth, the contribution of phytate in inhibiting iron absorption and folate as a nutrient associated with anemia was not possible to fully capture due to colinearity. The significant and negative association of iron in cereals with women’s anemia prevalence suggests that the positive effects of increased iron and lower molar ratios of phytate to iron outweigh the negative effect of phytate although this question requires more investigation. We were also not able to include many other micronutrients, such as calcium, that potentially inhibit or enhance iron absorption. 50 In addition, the available data allowed us to calculate per capita household consumption based on the aggregated number of household members, and we could not proportionally allocate consumption among adult males and females and children. Based on rounds for which numbers of males, females, boys and girls is available, the assumption of equal per capita consumption overestimates iron intake by approximately 13% compared to weighted per capita consumption based on consumption units. 42 Nor could we account for impacts of nutrients and food supplementation programs for children and pregnant women on specific households. Finally, the study rests on self-reported consumption data over a 30-day period. Researchers have highlighted the inaccuracy of such surveys. 51,52 Although we have identified and eliminated obvious errors in the data, there are likely remaining inaccuracies based on the inherent problems with the recall survey method.
We conclude that increased consumption of iron-dense cereals in the Indian diet, through improved access to coarse cereals and/or improved nutrient content and bioavailability in commonly consumed food (eg, biofortification and industrial fortification 53 ), could help reduce the prevalence of women’s anemia, particularly for rural and low-income households. Our analysis does not support the same conclusion about coarse cereals for children’s anemia. The contribution is modest and is not a sole solution to the public health problem but is one possible pathway to reverse the loss of iron intake that has occurred in Indian diets since the green revolution.
Supplemental Material
Supplemental Material, Supp_Fig_and_tables - Impact of Historical Changes in Coarse Cereals Consumption in India on Micronutrient Intake and Anemia Prevalence
Supplemental Material, Supp_Fig_and_tables for Impact of Historical Changes in Coarse Cereals Consumption in India on Micronutrient Intake and Anemia Prevalence by Ruth DeFries, Ashwini Chhatre, Kyle Frankel Davis, Arnab Dutta, Jessica Fanzo, Suparna Ghosh-Jerath, Samuel Myers, Narasimha D. Rao, and Matthew R. Smith in Food and Nutrition Bulletin
Footnotes
Authors’ Note
DeFries, Ruth contributed to conception, design, acquisition, analysis, and interpretation; drafted the manuscript; and critically revised the manuscript. Chhatre, Ashwini contributed to acquisition and analysis, and critically revised the manuscript. Davis, Kyle contributed to analysis and critically revised the manuscript. Dutta, Arnab contributed to acquisition and analysis and critically revised the manuscript. Fanzo, Jessica contributed to conception, acquisition, analysis, and interpretation, and critically revised the manuscript. Ghosh-Jerath, Suparna contributed to conception, acquisition, analysis, and interpretation, and critically revised the manuscript. Myers, Samuel contributed to design and interpretation, and critically revised the manuscript. Rao, Narasimha contributed to design and interpretation, and critically revised the manuscript. Smith, Matthew contributed to design, analysis, and interpretation, critically revised the manuscript. All authors gave final approval and agree to be accountable for all aspects of work ensuring integrity and accuracy.
Declaration of Conflicting Interests
The author(s) declared no potential conflicts of interest with respect to the research, authorship, and/or publication of this article.
Funding
The author(s) disclosed receipt of the following financial support for the research, authorship, and/or publication of this article: Funding for K.D. was provided by the Nature Conservancy’s NatureNet Science Fellows program. Funding for N.D.R. was provided by the European Research Council Starting Grant No. 637462. Funding for M.R.S. was provided by Weston Foods US, Inc. as a Weston Seeding Food Innovation Fellow.
Supplemental Material
Supplemental material for this article is available online.
References
Supplementary Material
Please find the following supplemental material available below.
For Open Access articles published under a Creative Commons License, all supplemental material carries the same license as the article it is associated with.
For non-Open Access articles published, all supplemental material carries a non-exclusive license, and permission requests for re-use of supplemental material or any part of supplemental material shall be sent directly to the copyright owner as specified in the copyright notice associated with the article.