
Abstract
Background:
Detailed information on global individual-level consumption patterns is imperative for informed policy making. However, such data are dispersed and incomplete.
Objective:
To review and discuss the methodologies, observed data availability, challenges, and opportunities pertaining to global dietary surveillance.
Methods:
This investigation provides an extensive review of global dietary assessment methodologies and challenges, including at the survey level, the dietary collection and assessment level, and the dietary data processing and analysis level. The focus is on nationally representative individual-level data, and additional types of dietary data, such as dietary biomarkers, household assessment, and food availability, are reviewed as alternatives. Practical guidance is provided to inform key decisions when designing dietary surveys and collecting, analyzing, and using dietary data. This article further identifies and describes existing global and regional dietary initiatives/data sets.
Results:
Harmonized and standardized primary individual-level dietary data collection, processing, and analysis worldwide are currently not available. Evaluation and decision-making should be based on best available data, that is, secondary nonharmonized yet to the extent possible, standardized individual-level dietary data. Existing initiatives differ substantially in methodologies, including survey design/representativeness, coverage, diet assessment, and dietary metric standardization and processing. Data gaps have been identified that were more profound for certain countries, certain dietary indicators across countries, population subgroups, representativeness, or time periods.
Conclusions:
Optimizing worldwide dietary habits to improve population health requires systematically identified and evaluated data on a continuing basis. Leveraging existing available dietary data and efforts is an indispensable prerequisite for informed priority setting targeting the intersections between diet and disease.
Introduction
The major global impacts of food insecurity and undernutrition have long been recognized, for which tremendous diet-related burdens of noncommunicable chronic diseases (NCDs) have now emerged. 1 In nearly every region of the world, suboptimal diet is the single leading modifiable risk factor for mortality and morbidity, exceeding the burdens attributable to many other major global health challenges. 2 Even modest dietary changes are associated with improvements in maternal and child undernutrition and micronutrient deficiencies 3 –14 as well as meaningful reductions in NCDs and associated risk factors such as obesity. 15 –21 Based on the crucial role of nutrition in health, a better understanding of patterns and distributions of dietary habits around the world is critical to inform and establish dietary priorities and improvement goals. 1,2,20,22 –33
Remarkably, the global patterns and distributions of consumption of dietary factors, as well as heterogeneity in these patterns by region, country, and important population characteristics, such as age and sex, are not well established. Global assessment of dietary habits has been limited by the absence of comparable and robust data on dietary intakes. Most previous global analyses have utilized crude national estimates of food balance sheets (FBSs) from the United Nations Food and Agriculture Organization (FAO) 34 –37 or expenditure data (eg, Household Consumption and Expenditure Surveys [HCESs]). 38 These constitute the only available national dietary data for most nations, particularly low-income ones. Availability and expenditure estimates may not accurately reflect individual dietary intakes, 39 while in addition, such national estimates cannot elucidate key differences within populations such as by age or sex. Even when individual dietary intakes are available, these are rarely standardized or comparable across countries or over time, including differences in intended use, survey design, implementation, dietary assessment instrument, and dietary data processing and analysis. Systematic and comparable global data on dietary intakes are pivotal to assess intakes within and across nations and regions; investigate correlates and drivers of dietary intakes and nutrition transitions over time; estimate corresponding undernutrition and NCD burdens attributable to suboptimal intakes; and model, design, and implement specific dietary policies to reduce diseases and disparities in different nations. Based on our experiences in academic and institutional research, the present investigation reviews and discusses the challenges and gaps and the opportunities pertaining to global dietary surveillance.
Challenges Pertaining to Global Dietary Assessment
Accurate and representative dietary data are essential to scientists, policy makers, and many other stakeholders. Their collection and assessment entail several methodological and analytical challenges, including at the survey level, the dietary collection and assessment level, and the dietary data processing and analysis level. Representativeness depends on need/use with national being relevant for global and national policy purposes and local/specific being relevant for informing local needs and policy actions or research on vulnerable populations. Ideally, dietary data should be assessed at the individual level, while their collection should be harmonized and standardized, that is, collected in a systematic, consistent, and comparable manner across nations and regions. However, this is rarely the case due to a range of different challenges such as in available established surveillance units (international and national), available resources, expertise, capacity, needs and priorities, local authority/expert engagement, and other country-specific challenges and constraints, particularly in low-income countries. This section reviews the key challenges pertaining to global dietary assessment while providing practical guidance to inform key decisions when designing dietary surveys and collecting, analyzing, and using dietary data. The potential for streamlining the collection and processing of dietary data is also discussed. The focus is on nationally representative individual-level dietary data, and additional types of dietary data are discussed as alternatives that, although less than optimal, can be useful for many types of policy-related decisions.
Needs Assessment and Data Needs
Data that describe a population’s food and nutrient consumption and dietary patterns are critical for achieving a wide range of policy, regulatory, programmatic, research, and advocacy objectives, including population-level problem diagnosis, surveillance, targeting, planning, evaluation, and global monitoring (Online Appendix 1). Some of the information needs required for meeting those objectives are commonly evaluated using currently available FBS data or HCES data sources, although their validity and utility remain unclear. Most applications require reliable individual-level dietary intake data to provide valid estimates, mainly because consumption patterns can vary widely by age, sex, or other demographics (eg, race, education, income, and pregnant/lactating status). The intended application of the information must drive decisions of what data sources are most appropriate and what the effective trade-offs are (in terms of usefulness, validity, cost, etc) of selecting 1 type of data source over another. 40
Challenges in Data Needs
National investment in the routine collection of individual-level dietary data is rare, particularly in low- to middle-income countries. There are several explanations for this paucity of investment in dietary data. First, there is a reasonable, in many cases, perception that dietary data are expensive, burdensome, and complex to collect. The time burden and cost of instruments used to assess many other important features of national, regional, and local trends, including physical characteristics, medical history, medication and supplement use, physical activity, and so on, can vary substantially in length, cost, and need for validation. Systems that have been set up in most countries for measuring and assessing traditional risk factors (eg, blood pressure, cholesterol levels, diabetes, exposure to contaminants) are more costly for the society overall. Relative to its importance as a global risk factor for health, disparities, and sustainability, the amount of time and resources spent on dietary assessment is substantially less than for many of these other risk factors.
Second, in many countries, there is no natural “institutional home”/surveillance unit for diet monitoring. 41 The result of being an institutional “orphan” is that there is often no government entity with a clear mandate or budget for carrying out regular, high-quality dietary surveys or for ensuring that the data are accessible and usable for the broad array of decision-making purposes described (Online Appendix 1). Small-scale dietary surveys are more commonly conducted on small population subsamples by individual researchers, but, as such, their generalizability is often limited as well as the willingness to make such data publicly available. Third, the lack of institutional support can lead to low technical capacity to undertake the design, implementation, and analysis of dietary data.
Fourth, the combination of these factors means that critical information needed to process dietary data, such as country-specific food composition databases (FCBs) and tables of conversion allowing quantification of context-specific portion size, is often out of date or not available. Without easy access to standardized information for dietary data processing and analysis, there is a tendency to “reinvent” the wheel every time a new survey (national or subnational) is performed, which wastes time and resources and contributes to the perception that dietary data collection is cost prohibitive. Furthermore, the lack of harmonized and standardized data makes it very difficult to conduct intranational time series analyses as well as international comparisons to discern temporal and spatial trends. The accretion of these challenges has hindered availability of, and access to, dietary data at the national and global level.
Suggestions and Opportunities in Data Needs
The establishment of a national, regional, and ultimately global dietary surveillance unit will enhance the monitoring of population-specific, country-specific, region-specific, and global trends in nutrition-related risk factors and conditions. This unit could provide regular and updated dietary information, and although currently there are no uniform guidelines on how to design such a system and what should its objectives be, some principles and examples have been described. 42
When a country is about to undertake a dietary survey, special attention should be paid to the planning and preparation phase, which may require months or even 1 to 2 years, in order to determine the purpose and intended use and thus subsequent data needs. 43 Key goals are to include a statistically appropriate size and representative sample with sufficient numbers and representativeness of relevant subgroups (Online Appendix 2), use instrument(s) relevant to the current dietary exposures of interest as well as future anticipated needs, and minimize measurement error with systematic planning and execution and standardized collection and analysis of information across participants. When planning and developing a survey, one should refer to existing surveys and instruments designed to measure the same concept or area of study when possible. Other sources of information include experts, literature review, and pilot and feasibility testing (in a subsample of the targeted population). Modes of survey administration vary and include face-to-face (interviewer-administered), computer-assisted personal interviewing (CAPI), telephone, interactive voice response, e-mail, and Internet. Although the selection of mode is usually determined by the research topic, characteristics of the population targeted, and available resources, the CAPI method—in which interview administration and information collection is performed with the use of a computer—is increasingly being used for dietary survey administration (already used by many dietary surveys around the world, such as several European ones and the US National Health and Nutrition Examination Survey). Compared to other modes, CAPI ensures anonymity, eliminates data entry time and errors, provides standardized and comparable data collection, and checks and minimizes respondent burden, including psychological burden related to sensitive questions. 44,45
Once the mode of administration has been selected, in addition of course to dietary data per se, every effort should be made to collect essential background information on the participants. The level of information will depend on the data needs/intended use and available resources but should minimize the responded burden—which is influenced by a number of factors, such as incentives, surveys length, and target audience—so as to ensure the highest possible response rate. 44,45 Specific background information may be readily available from the sampling frame, such as sex, age, and geographical location. Still, at the very least, for subsequent dietary data assessment and analysis, the following sociodemographic indicators should be collected: age (date of birth), sex, marital status, region, rural/urban area, size of the household, household income, education level, employment status, ethnicity, and pregnant or lactating status (for women only). 46 Ideally, information on special dietary patterns either choice (eg, vegetarians) or health related (eg, cancer and coeliac disease) should also be collected. To characterize nonresponse bias, 47 the degree to which respondents differ from the survey sample population as a whole, information on age, sex, region, education, and reason for not answering should be collected on a subsample of nonparticipants. Furthermore, any indicators related to quality assurance steps as determined at the survey planning stage (eg, participant ID, respondent if different to participant, interviewer ID, date of data collection, duration of interview, special circumstances affecting data collection) should also be collected. Finally, ancillary information to the dietary intake data may be considered depending on data needs, such as anthropometric measurements and biochemical data on nutritional status.
Data Used to Assess Dietary Intake
Individual-Level Assessment of Dietary Intake
Challenges in Individual-level Dietary Assessment
There are well-established self-reported diet assessment tools for collecting individual-level food data, including 24-hour dietary recall (24hR), diet records, and food frequency questionnaires (FFQs; Online Appendix 3). These tools vary substantially among diet surveys on a global scale, with single (1 day) 24hR/records being the most frequent. 48 Although the selection of a given tool will greatly depend on the purpose of the survey and data needs, there are important challenges associated with the selection of each of those tools, their design, administration, and analysis. The validity and resource requirements of these methods for different purposes along with their strengths and limitations has been extensively reviewed 46,49 –52 and is further discussed here (Table 1).
Validity and Resource Requirements of Dietary Assessment Methods for Measuring Dietary Intake.a
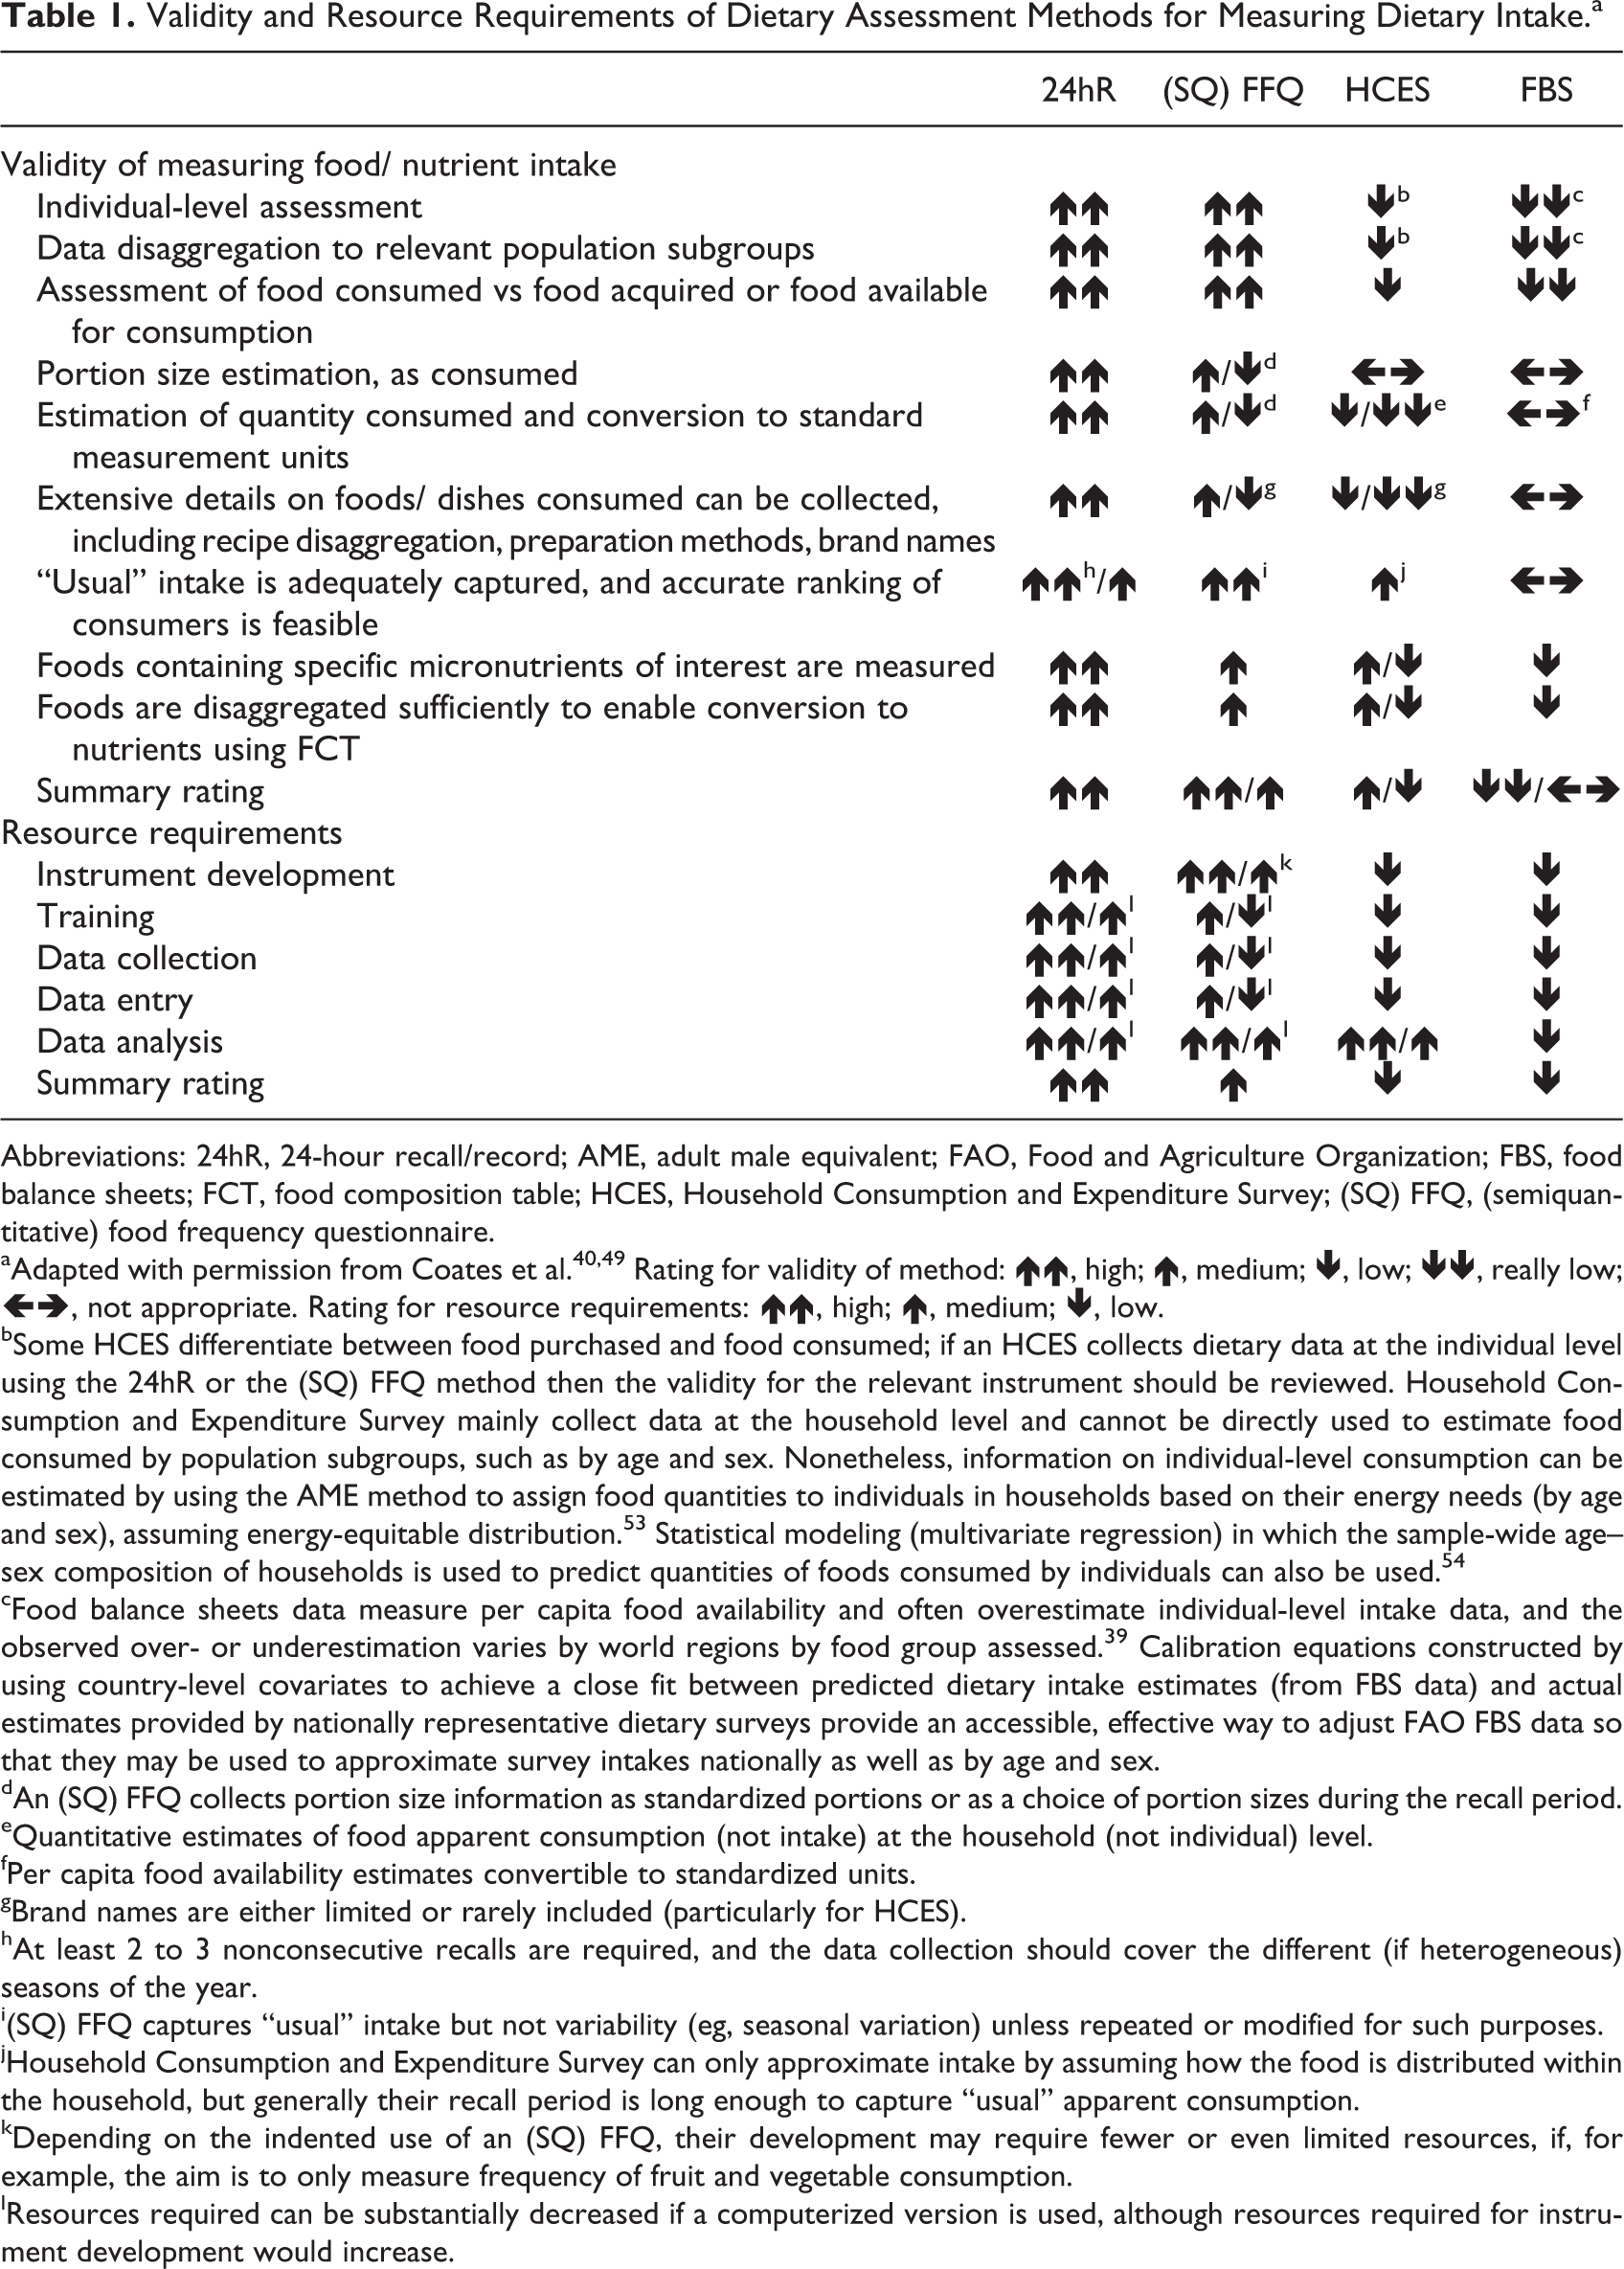
Abbreviations: 24hR, 24-hour recall/record; AME, adult male equivalent; FAO, Food and Agriculture Organization; FBS, food balance sheets; FCT, food composition table; HCES, Household Consumption and Expenditure Survey; (SQ) FFQ, (semiquantitative) food frequency questionnaire.
aAdapted with permission from Coates et al. 40,49 Rating for validity of method: ↑↑, high; ↑, medium; ↓, low; ↓↓, really low; ←→, not appropriate. Rating for resource requirements: ↑↑, high; ↑, medium; ↓, low.
bSome HCES differentiate between food purchased and food consumed; if an HCES collects dietary data at the individual level using the 24hR or the (SQ) FFQ method then the validity for the relevant instrument should be reviewed. Household Consumption and Expenditure Survey mainly collect data at the household level and cannot be directly used to estimate food consumed by population subgroups, such as by age and sex. Nonetheless, information on individual-level consumption can be estimated by using the AME method to assign food quantities to individuals in households based on their energy needs (by age and sex), assuming energy-equitable distribution. 53 Statistical modeling (multivariate regression) in which the sample-wide age–sex composition of households is used to predict quantities of foods consumed by individuals can also be used. 54
cFood balance sheets data measure per capita food availability and often overestimate individual-level intake data, and the observed over- or underestimation varies by world regions by food group assessed. 39 Calibration equations constructed by using country-level covariates to achieve a close fit between predicted dietary intake estimates (from FBS data) and actual estimates provided by nationally representative dietary surveys provide an accessible, effective way to adjust FAO FBS data so that they may be used to approximate survey intakes nationally as well as by age and sex.
dAn (SQ) FFQ collects portion size information as standardized portions or as a choice of portion sizes during the recall period.
eQuantitative estimates of food apparent consumption (not intake) at the household (not individual) level.
fPer capita food availability estimates convertible to standardized units.
gBrand names are either limited or rarely included (particularly for HCES).
hAt least 2 to 3 nonconsecutive recalls are required, and the data collection should cover the different (if heterogeneous) seasons of the year.
i(SQ) FFQ captures “usual” intake but not variability (eg, seasonal variation) unless repeated or modified for such purposes.
jHousehold Consumption and Expenditure Survey can only approximate intake by assuming how the food is distributed within the household, but generally their recall period is long enough to capture “usual” apparent consumption.
kDepending on the indented use of an (SQ) FFQ, their development may require fewer or even limited resources, if, for example, the aim is to only measure frequency of fruit and vegetable consumption.
lResources required can be substantially decreased if a computerized version is used, although resources required for instrument development would increase.
Τhe 24hR/record method is the recommended approach for collecting detailed individual-level food information in the context of national surveys. 46 In large-scale national surveys, a limited number of 24hR/records can be realistically obtained, due to increased cost and other challenges, such as associated participant burden and participation rate. A limitation of the restricted number of dietary measures is that “usual” intake cannot be accurately estimated for individuals, especially for foods/nutrients/contaminants that are not frequently consumed by the target population. It can provide valid estimates of the absolute mean “usual” intake of a population group (less so for infrequent foods) and an estimate of the distribution of intake in individual days and detailed information such as on the time and day of consumption, on the actual food/beverage consumed, and so on. 55 Since it is representative of limited days, it does not accurately assess within versus between variation or accurately rank individuals. The FFQ on the other hand includes a prespecified limited checklist of foods and attempts to capture an individual’s usual food intake by enquiring the frequency with which the respondent consumed each listed item over a specified period of time ranging from 1 week to 1 year. It thus relies on a longer recall period compared to the 24hR/record method (single or few measures, usually up to 3 for diet records) to assess “usual” individual intake and enable accurate ranking of individuals. Yet the number and type of foods selected influence the comprehensiveness of the data, the accuracy, and representativeness of the results and require an in-depth knowledge of the types of foods typically consumed by the population under study. 49
The administration of the dietary tools can be interviewer administered (in-person, telephone/web based) or self-reported and through traditional (eg, pen-and-paper) or more standardized modes (eg, CAPI and Internet; see Suggestions and Opportunities in Data Needs above). The 24hR dietary recalls are typically pen-and-paper-based interviews, particularly in low-income countries, 56 and diet records and FFQs are typically pen-and-paper-based and self-reported with ad hoc support from interviewers. The administration of the dietary interviews should be conducted by nutritionists/dieticians or other well-trained interviewers to ensure comparability and comprehensiveness of collected data, with frequent performance reviews during the survey, which can be costly. The pen-and-paper method for collecting detailed dietary data is time-consuming and costly to implement, clean, process, and analyze, while the computerized methods are more costly to set up and maintain.
There are also challenges and expenses associated with portion size assessment, including various methods to do so. Estimation of portion size, as consumed, is required as part of obtaining valid dietary intake data. Both random and systematic errors may occur when estimating food quantities as consumed. 57,58 Food weighing is the most valid method for recording quantity of intake, which is nonetheless difficult and costly to implement in a large-scale nutrition surveillance study, causes substantial burden to participants, and may potentially result in unintended changes in dietary habits. 51 Another important challenge is the use of food composition tables (FCTs) to match food consumed to its nutrient content (see Food Composition Tables). In particular, for 2 key nutrients—iodine and sodium—it is not possible to obtain adequate information on the content due to the variability in salt use between households and between food processors. Since iodized salt is a key source of iodine, natural iodine content of food does not allow an accurate assessment of iodine intake. For these 2 nutrients, use of biomarkers is preferred (see dietary biomarkers section).
Suggestions and Opportunities in Individual-Level Dietary Assessment
If planning a diet survey and absolute population means are crucial, then detailed food intake collection by means of multiple 24hR/records (on at least 2, preferably nonconsecutive days) is recommended for each individual or on a subset of the sample if not feasible on the whole sample (Online Appendix 4). 59 -61 This method further allows for extensive details on foods/dishes consumed to be collected and at the finest level possible and for their quantity and nutrient composition to be accurately estimated. For foods/nutrients/contaminants not frequently consumed by the target population, a food propensity questionnaire may be used in addition to the 24hR/record to obtain important covariate information and estimate “usual” intake. 46,62,63 Considering the costs associated with obtaining portion sizes through food weighing, a comparable approach is the use of country and age appropriate and tested or validated portion size measurement aids (PSMAs). 46 These include portion-size picture books (food atlases), household measures, standard portions, and known package sizes. The selection and development of PSMAs should be based on available national market information, food preferences, and portion sizes as consumed by the population of interest either using, preferably, weighed records or as estimated from the previous national surveys. The selection of a recall versus record method depends on the age of the population being assessed, with records being generally recommended for younger (<10 years) and recalls for older participants (Online Appendix 4). 46
If individual means are required when planning a diet survey or for linking diet changes to health and disease risk, then FFQ will be the preferred tool. The steps involved in the development of an FFQ have been extensively described (Online Appendix 4). 49,64,65 The list of foods selected defines the finest level of information available to characterize consumption, and portion size options in the case of semiquantitative FFQS should be ideally based on “typical” portion sizes derived from representative 24hR data. 49 Food frequency questionnaires that have been appropriately constructed and validated can also be used if the increased costs associated with 24hR/record data collection cannot be covered and/or if assessment of specific foods alone (such as fruits and vegetables) rather than assessing diet as a whole (foods, nutrients) is required.
The validity of the dietary data collected by means of the in-person and telephone interview are relatively comparable. 66,67 One option when 2 dietary measures are to be collected is that the first is administered in person and the second by phone. 46,68 Other solutions may include new web-based self-administered modules, although further validation is needed. A multiple-pass method should be used to guide the respondent in recalling all foods/beverages consumed during the previous day, such as the United States Department of Agriculture’s 5-step Automated Multiple-Pass Method, which has been shown to reduce bias in collection of energy intakes even among overweight/obese individuals. 69 -72
Standardized and streamlined technologies are needed to improve the ease, time, and cost of data collection and processing and also ensure high-quality standardized data entry, analysis, consistency, and comparability across dietary data. Such technologies, accompanied by capacity development, could go far in alleviating many of the barriers that have prevented routine collection and use of dietary information in the past. Technological innovation in dietary assessment is driven by the goals of improving data accuracy, reducing data collection costs, and lessening respondent burden. 73 -82 Image-assisted dietary assessment (dynamic images) can be used as a supplement to traditional diet assessment methods to assist with portion size estimation and shows promise for improving their accuracy. 83 -85 Image-based approaches (active, requiring the participant to take the image; or passive, the device taking the image at defined intervals, eg, with wearable cameras) can be used as the primary source of dietary information aiming to substitute conventional methods. 83,86 However, the validity of these technologies or associated costs and sustainability in various population subgroups/users (eg, illiterate and older), low-income settings, larger samples, and particularly in the context of national surveys is not established.
Diet software programs (for 24hR administration) are increasingly being used in national diet surveys. Many of these approaches are designed for use although in industrialized countries, where the population of interest is literate and has consistent, reliable access to telephones or Internet (Online Appendix 3) 46,74,81,78,85,87 -89 For application in low-income countries, these programs should meet essential criteria previously defined90; yet most currently available diet software does not meet all of those precluding widespread use across multiple low-income countries (Online Appendix 3). 56,90 While useful, most available systems were developed to be very specific to the context of a single country or to high-income countries, are not open source/access, cannot be easily adapted for new settings, or cannot be directly linked to external databases (such as FCTs) for simplified data processing. However, it may be possible to adapt one of the existing programs meeting most of the essential criteria rather than developing an entirely new program or consider incorporating and adapting useful features from other available programs. A recent inventory of dietary assessment tools available in Africa 91 found no instances of countries using computerized software or other new technologies to collect dietary data; since then, other sophisticated diet software programs have been extended for use in Africa that require further evaluation. 92 The dearth of validated tools that meets criteria for application in developing countries, coupled with the rapidly expanding availability and application of mobile platforms and other technology in developing countries, highlights an important need as well as a critical window of opportunity for innovation. The International Dietary Data Expansion (INDDEX) Project seeks to address dietary data collection impediments, by identifying, developing, and validating standardized and streamlined technologies for the collection and processing of individual dietary data in low-income country contexts.
Dietary Biomarkers
Additional methods may be considered to obtain ancillary information to the food intake data in the context of national diet surveys, such as biochemical data on nutritional status, which have been extensively reviewed. 93 -102 Biochemical indicators/biomarkers are often considered as the most robust and accurate method of determining micronutrient status (less so of intake) and thus of related deficiencies (such as water- and fat-soluble vitamins, iron, trace elements, sodium, iodine), and they are further useful for confirming/validating estimated dietary intakes from individual-level dietary assessment methods. 50,51,101 For example, urinary collections are needed to accurately assess sodium and iodine intake. However, contrary to biomarkers in urine, biomarkers in blood do not enable nutrient intake assessment, rather nutrient status assessment. Self-reported food intakes are subject to significant measurement error by recall bias and misreporting (under- or overreporting) likely further compounded by incomplete/outdated food composition data. Dietary biomarkers are desirable for their ability to validate self-reported intake measures and to more accurately link dietary intake with nutritional status and disease risk. 100,103 Yet biomarkers alone do not allow identification of nutrient food sources, whereas dietary instruments do. Biomarkers can be categorized into short term (reflecting intake over past hours per days), medium term (reflecting intake over weeks per months), and long term (reflecting intake over months per years), with the type of sample/compartment used being a main determinant of time. Recovery biomarkers, such as doubly labeled water or urinary nitrogen, are outside the scope of the present report since these are not used to capture food/nutrient intake and rather are used in interventional studies to assess the accuracy of self-reported total energy intake. 104
Challenges in Dietary Biomarker Assessment
Although in many cases the use of biomarker data is the optimal approach, collection of such invasive data may not be feasible in large-scale nutrition surveys due to increased cost and participant burden and decreased compliance and participation rate. The choice of biomarker will greatly depend on the study objectives and also the method of specimen collection (eg, blood, hair, and urine), storage, and analytic techniques. Nonetheless, many dietary factors cannot be reliably assessed by biomarkers, and even for those reliably assessed, the half-time of the biomarker is often shorter term, not reflecting habitual intake. 101 Biomarkers that measure intake of specific foods, rather than nutrients, are not currently available, yet the emerging field of metabolomics may advance the discovery of such novel biomarkers and their use in assessing diet–disease risk. 105 -107 Individual traits, such as genetic variability, lifestyle/physiologic factors (eg, smoking), other dietary factors (eg, nutrient–nutrient interaction), biologic sample, and analytic technique/methodology could skew biomarker measures of dietary intake. 108 Concentrations in other tissues, such as adipose tissue and cell membranes, are less influenced by acute conditions, such as infections or stress, and reflect longer term supply; yet these samples are far more invasive and thus more difficult to obtain. 98,109
Suggestions and Opportunities in Dietary Biomarker Assessment
When biomarker data are not collected, either due to survey constraints or simply because a reliable biomarker is currently not available for the diet exposure of interest, quantitative dietary intake data should be used to characterize micronutrient intakes, preferably from 24hR/record instruments linked to country-specific and updated FCBs. Collecting biological samples in a subsample of the surveyed population would be a viable option, further carefully considering genetics, age, type of biological sample, time of year, and other potential confounding factors. Emphasis should be placed, where possible and if a reliable biomarker exists, in selecting samples that are minimally invasive (eg, hair, nail, or fingerprick vs venipuncture or adipose tissue) and with low participant burden (eg, spot urine vs 24-hour urine collection, fasting vs nonfasting). Future research should refine the validity and reproducibility of existing biomarkers, differentiate between markers that provide objective measures of exposure to dietary intakes versus both dietary and metabolic processes, establish new indicators of food and dietary pattern intake, and develop techniques that are cost-effective, noninvasive, quick, and accurate measures of dietary intakes.
Household Assessment of Food Consumption
The general term “National Household Survey” (NHS) refers to HCES, Household Budget Surveys (HBS), and Living Standard Measurement Studies. These surveys are mainly designed to update the consumer price index (CPI), to conduct analysis on poverty and living conditions of households, or to inform national accounts. Although individual dietary assessment methods (surveys, biomarkers) are often the best source of information to perform nutrition or food security analysis, if an NHS is already in place, it is easier and less costly to additionally collect food data, particularly in low-income countries.
National household surveys are not specifically designed to conduct nutrition or food-security analysis; yet they collect data on apparent food consumption (not individual intake) as an integral part of their broader inquiry on household consumption and expenditures. Usually, food consumption data are collected as food consumed or acquired by households from different sources, in terms of both quantities and monetary values. In addition, NHSs provide data on household income and expenditure and other socioeconomic and demographic characteristics useful for classification purposes. National household surveys usually cover the entirety of a country’s territory, with samples distributed throughout the year, thus accounting for seasonality. Moreover, they allow for analysis of variations over time when the survey is repeated in different years or is conducted on a continuous basis.
Challenges in Household Assessment of Food Consumption
Despite the described positive attributes, NHSs are rarely designed to capture the level of the households’ habitual food consumption for several reasons. National Household Surveys most often collect information on household food acquisition/availability rather than consumption. In this case, it can be very difficult if not impossible to distinguish the food acquired for the actual household consumption over the data collection period from the food acquired for storage purposes. Further, NHS generally collect food data by means of a questionnaire with selected/limited food items (often broad groupings such as fruits) and/or short reference periods (1 week to 1 month), leading to increased variability in the estimate of habitual consumption because of the inherently greater variability within a short reference period (unusual events such as a wedding may occur during the reference period leading to an increase in the food acquired). In addition, with short recall reference periods, “telescoping errors” can occur whenever the respondents mistakenly recall events taking place more recently than they actually did. Contrarily, collecting data on longer reference periods leads to “recall loss” errors that can take place when the respondent is unable to remember events that took place long before.
Information on the foods and quantities consumed per household member are not recorded, leading to food consumption estimations based on the size of the household, which may differ from the number of people who actually consumed the food (partakers) over the reference period. Although this issue can be addressed in surveys that collect information on the number of food partakers, this piece of information is very often lacking. In addition, foods consumed outside home are normally not well captured by the survey questionnaire due to the use of generic categories (such as “meal in a restaurant”) or to the inability of the questionnaire design to capture some aspects of the food consumed away (such as school lunches for children). Finally, NHS do not always consider food stocks or “food wastage,” such as food acquired for purposes other than household consumption (eg, food given to other households, to guests, animals, charity, or used for resale) or food waste. Although food waste is generally considered to be more of a problem for households with higher incomes, low-income households can also have food waste from food spoils due to inadequate food storage technology. Finally, even when information on household food consumption is accurately captured, data on intrahousehold food distribution are very seldom available.
Suggestions and Opportunities in Household Assessment of Food Consumption
To better assess the challenges highlighted in household assessment of food consumption, the International Survey Network in collaboration with FAO assessed 100 surveys conducted in low- and middle-income countries mainly between 2000 and 2010. 52 A questionnaire was developed to assess the reliability and the relevance of each survey and was then applied to selected surveys. The criteria developed for the assessment of both reliability and relevance were used as tools to offer recommendations for improving each of those measures in the context of HCES.
The assessment found that <13% of included surveys presented the minimum criteria to be considered as reliable (Online Appendix 5). Basic reliability criteria were met by most surveys, such as including data from all acquisition modes (purchases, own production, and received in kind), fully accounting for food acquired or consumed, ensuring comprehensiveness of the at-home food list, and specifying a recall period for at-home food list. Priority areas were thus identified which should be addressed to ensure collection of reliable food information and their ability to capture “usual” food consumption. First, every effort should be made to collect information on products consumed (and not simply acquired over the reference period) and on all sources of acquisition. To further capture “individual” consumption, as data are usually collected on the household level (vs for each individual separately), household consumption data can be further “individualized” by either (a) assuming that each person within the household has equal access to food (expressed per capita) or (b) according to the energy-required requirements of household partakers (adult male equivalent [AME] approach, expressed per AME).53 However, either approach will divide all foods acquired among household members, which may lead to implausible consumption such as baby foods consumed by adults or alcohol by infants. Further research is needed to validate these approaches and their ability to predict individual intakes. Most importantly, implementing an individual diet assessment tool (such as 24hR/record, FFQ) should be considered as a worthwhile investment in the context of a household survey since relatively similar resources would be required for such an application.
Second, the reference period should be long enough to reflect the broad range of food products that constitute habitual diets but short enough to avoid imposing too high a burden on the respondent. To this extent, food records/diaries may be preferred, as they minimize errors due to recall; but they are more costly to implement and also represent a burden for the respondent that may not completely and accurately fill the diary due to fatigue or change diet as a result of recording, leading to different types of errors. Third, the list of in-house products should be exhaustive and specific to each food group. Fourth, information on seasonal variation in food consumption should be collected by spreading data collection across a whole year or periods that are expected to vary. Fifth, the actual number of people who participated to the meals during the reference period should be collected. Finally, all food consumed away from home should be included in the survey, with further information on both purchases and food received in kind.
The relevance of food data was assessed against the possibility to use collected data to perform poverty, food security, and nutrition analysis or to inform FBS, private sector, or CPI. It was found that food expenditures could be derived for all surveys assessed. Regarding dietary analyses, only 14% of surveys included individual food items and collected information on specific foods consumed away from home allowing estimation of dietary diversity. If the analysis-required conversion of the quantity consumed to metric units, this would have been possible in 53% of the surveys considering only at-home food and in less than 10% additionally considering outside home consumption. Calorie consumption and undernourishment could be measured in 40% of the surveys accounting for at-home consumption alone and in only 9.2% of the surveys further accounting for outside home consumption. Specific areas of improvement were identified. First, information on quantities (portions/amount consumed) should be collected in metric units by collecting metric conversion factors through weighing with scales, through reporting by respondents (portion size), or through information on local market of local currency per local unit. Second, detailed information on food away from home (products and quantities of food consumed away from home, or typical food consumed away from home and their recipe) should be further collected. Finally, an in-house food list should be constructed to be detailed and specific enough to allow for food matching and allocation into only 1 food group. Nutritionists should also be involved when preparing the food list to ensure it captures the diet of the target population and that it is specific enough to enable food matching to reference FCTs.
Often, NHSs are the only available source of information to assess the distribution of food consumption within a country. Indeed, 2 parameters used by FAO to estimate the prevalence of undernourishment are derived from the distribution of food consumption collected in NHS. In order to make the best use of food data collected in surveys and derive indicators on food consumption at national and for specific population subgroups, the FAO Statistics Division in collaboration with the World Bank has developed the ADePT-Food Security Module (FSM). 110 The ADePT-FSM (version 2) is a free and user-friendly software developed to derive consistent and readily available food security statistics from food consumption data collected in NHS (Online Appendix 6). The software also provides a transparent platform in which the user can reproduce the FAO official estimates of the prevalence of undernourishment within a country. To date, >100 NHS collecting food data have been analyzed in the context of capacity development activities and 43 survey results showing indicators on food security disaggregated by gender of the head of the household are now disseminated in the FAO FAOSTAT database. 34 The information on energy available for consumption derived from NHS has also been used to reconcile FAO FBS. 111 To explore all potentialities of food data collected in NHS, the FAO Statistics Division has been working under the INDDEX project toward the development of a new version of ADePT-FSM, including indicators on nutrient inadequacy by subpopulation groups derived from food consumption data collected in NHS.
Per Capita Assessment of Food Availability
Food and Agriculture Organization FBSs, 34 also referred to as national food accounts, food accounts, supply/utilization accounts, food disappearance data, and food consumption level estimates, are the most commonly used data sources for estimating information on “patterns, levels, and trends of national diets.” 49 Food balance sheet data provide information on the food that is available for consumption at the national level; they do not directly measure individual food intake, they cannot evaluate differences within the population, such as by age or gender, and they do not include key foods and nutrients (in fact, per capita data are available for only 2 macronutrients, protein, and fat and total energy). Due to their low cost, high accessibility, and ability to demonstrate shortfalls in food/nutrient availability on a population level and illustrate long-term trends in the national food supply, they have historically been the main data source of dietary information used to meet food fortification program design-related information needs 49 and to inform overall dietary patterns and needs for several countries that are lacking representative diet surveys.
Challenges in per Capita Assessment of Food Availability
Although a comparable and relatively consistent methodology is used for FAO FBS and dietary data are publicly available for several years (annually) and nearly in all nations, FBS data provide very crude national, and subsequently per capita, estimates of food availability. Compared to the other 3 dietary assessment methods, FBS data are the least suitable for assessing individual-level intakes and dietary quality or for evaluating diet–disease burdens. They provide no information on diet subnationally, for example, by age, sex, pregnant/nursing, rural/urban, or socioeconomic status (SES). Several additional limitations constrain their usefulness for assessing dietary intakes. First of all, FBS data are derived by combining input variables for each commodity, including total national production, total imports, total exports, total nonhuman use (eg, livestock feed), and total waste from farms, distribution, and processing, each of which are subject to considerable error. 34,112 Effectively, commodity data are reported in terms of primary equivalences, representing the sum of the weight of the primary commodity plus the processed version of that product converted back to the weight of its original commodity. Furthermore, data on livestock primary products are reported in dressed carcass weight, which reflects the bone-in weight after slaughter and initial butchering (ie, not the edible weight). Finally, such data can only be regarded as a crude estimate of per capita food consumption with a large margin of error. In addition, they do not account for waste from cooking, spoilage, or plate waste; meals not eaten at home; home farming or production, which can be common in lower income nations; and food reaching the household from nonretail markets.
Suggestions and Opportunities in Per Capita Assessment of Food Availability
In recent work, the potential for interaction in the relationships between the individual-level survey data and FBS data has been formally assessed using global data from individual-level diet surveys assessed as part of the Global Dietary Database (GDD). 39 In that work, we identified that FBS data often overestimate individual-level intake data and that the observed over- or underestimation varies by world region for all food groups assessed. Of the 22 foods/nutrients assessed, degree of overestimation ranged from 54% for total energy to 270% for whole grains, while FBS data significantly underestimated bean/legume and nut/seed intake. Calibration equations were further constructed by using country-level covariates to achieve a close fit between predicted dietary intake estimates (from FBS data) and actual estimates provided by nationally representative dietary surveys. These calibration equations provide an accessible, effective way to adjust FAO FBS data so that they may be used to approximate survey intakes nationally, as well as by age and sex, versus using the crude FAO FBS data. Given the other advantages of FBS data, these findings facilitate use of FAO estimates by scientists and policy makers to better approximate dietary intakes when individual-level estimates from either 24hR/records or FFQs are not available. Another recent extension of the FAO FBS data includes the Global Expanded Nutrient Supply model, which provides a novel method for estimating macro- and micronutrient supplies, extrapolating the only current global long-term data set—FBS—paired with regional FCTs and distributions by age and sex informed by national individual-level data from the GDD to produce a useful tool for nutritional studies. 113 However, important limitations should be considered mainly reliance on FBS, and as such these nutrient estimates provide information only on nutrient supplies and not true individual consumption.
Food Composition Tables
Food composition data are fundamental to almost all areas in nutrition, are needed for all dietary data collection methods other than biomarkers, and are also increasingly being used in agriculture. Without those data, no nutrition labeling can occur and no nutrient intake assessments be carried out, activities that are the basis for nutritional epidemiology, nutrient adequacy, nutrient requirements, diet formulations, and nutrition education. In agriculture, food composition data on varieties are used in breeding and production. 114,115 Thus, through these pathways, food composition data have an influence on nutrition and agriculture programs and policies.
Challenges in FCTs
Still today, many countries do not have a national FCT/FCDB, and many of the existing ones are outdated and not per international standards, in terms of quality, food, or nutrient coverage; analytical methods used; accessibility; or documentation. This is also true for most regional FCTs. Many of those tables are based on few, if any, analytical data generated for food composition purposes, that is, with the intention to represent foods consumed in a given country. Most FCTs contain less than25% of analytical data (often old and not generated for food composition purposes), meaning that most data are estimated or copied from other countries and sources. In other disciplines, such as food safety, this data estimation and “recycling” would be inacceptable. For food composition, this is a habit as most donors, at national and international level, prefer to not fund the expensive analysis of foods, that is, about USD$1000 to USD$1500 per analytical sample depending on components and laboratory. This leads to a huge data gap in food composition, not only of vitamins, minerals, fatty, and amino acids but also of phytochemicals. This data gap is more prominent in developing countries and also highly present in developed countries. Some categories of foods, even if consumed frequently and in high amounts, are not included in many FCTs such as cooked foods, recipes, biodiverse foods 116,117 (cultivars/varieties/breeds, wild, and underutilized foods), animal foods, 118 fortified or processed foods, and food supplements as well as branded foods. And there are virtually no analytical data available for many of those foods. The difference in nutrient composition between species can be as important as among the different varieties of the same species, meaning that the consumption of one variety instead of another one can represent the difference between nutrient deficiencies and nutrient adequacy in populations and individuals. For example, consumption of 200 g/d of rice can represent 25%, or more than 65%, of the recommended daily intake (RDI) of protein, depending on the variety consumed. One banana can provide less than 1% or more than 200% of the RDI for vitamin A. 115,119
This data gap forces users to estimate the nutrient content of foods in a more or less accurate manner by using available food composition data that do not represent the true nutrient content of the consumed foods such as applying the nutrient values of available FCTs from other countries (thus introducing random error) or to significantly underestimate the nutrient intake of a population (ie, by introducing a systematic error when not considering biodiversity, fortified foods, or food supplements). This will lead to an overestimation of nutrient inadequacy which will in turn lead to ill-targeted policies and programs intended to address an exacerbated problem. Thus, wasting not only scarce human and financial resources but also leading to little long-term impact in nutrition.
Food matching is also a major source of error, effectively reflecting the way foods from dietary surveys are matched to foods in FCTs/FCDBs. The food description of the foods in the survey and/or in the FCT/FCDB does not permit to find the “true” match; or adequate, updated foods are missing in the FCT/FCDB; or only similar foods can be matched; or wrong matches are made because of insufficient knowledge on the foods, carelessness, or the ignorance of the implication of wrong food matching. 120 All of these errors could lead to increased extent of random errors in nutrient intake estimations.
Suggestions and Opportunities in FCTs
In order to assist countries generate, compile, and use food composition data correctly, standardize food matching, and thus eliminate errors mentioned above, FAO/International Network of Food Data Systems (INFOODS) have issued guidelines and standards, 114 developed the FAO/INFOODS e-Learning Course on Food Composition Data and the Compilation Tool (a FCB management software in Microsoft Excel), 121 held or contributed to training courses, published and updated databases holding only analytical data (eg, BioFoodComp or AnFood, though progress in compiling more analytical data has slowed down due to lack of funding) 122 as well as a regional table (the West African FCT ended up being mainly based on European and American data because of scarce suitable data from Africa and even fewer analytical data of sufficient quality), 123 or assisted countries in developing a national or regional FCT. All publications are available free of charge on the INFOODS website. 124 The issued guidelines, 114 which will be regularly updated, provide guidance on principles to be considered for matching foods to FCTs (further assessing the quality of the food match), checking food composition data prior to publication of a user table/database (covering internal checks and documentation), and converting units, denominators, and expressions (eg, hydrous vs anhydrous forms) for standardization purposes. Future guidelines will cover issues of recipe calculation, nutrient retention factors, food sampling, and selection of food composition data. Another step forward would be to codify food consumption and composition data by means of a standardized food description and classification system, which would limit errors and time required for food matching.
However, the uptake at country level is still low, as many countries have difficulties in securing funds to compile existing analytical data and transform these data into a national or regional FCT and even more so to analyze consumed foods for their nutrient content. It seems that there is a revival in the interest in food composition in the recent years, probably also due to the repeated efforts of INFOODS as well as others in advocating for the need of updated and relevant FCTs, which are better equipped to respond to the requirement of labeling, research, policies, and programs. Nonetheless, donors are scarce, and in many cases, there is no funding to support sampling and chemical analysis of consumed foods, recipes, commercial products, crop varieties, or breeds. Therefore, most FCT/FCDB contain mainly outdated or nonrepresentative analytical values or large amounts of estimated nutrient values, while most of these data are for raw foods alone.
Dietary Indicator Selection and Standardization
Even when dietary data are available, users are not always clear how raw food consumption information (from individual 24hR/record, FBS, HCES, or other sources) should be manipulated to yield suitable indicators and policy relevant analyses. A range of disparate initiatives exist to address this challenge. For instance, the National Evaluation Platform works in a handful of low-income Scaling Up Nutrition countries to integrate nutrition-specific indicators into a national information system in order to improve monitoring and evaluation of nutrition policies and programs. A shortcoming of these initiatives is that their efforts thus far have been focused primarily on developing nutrition information systems for the health sector, and the type of food consumption information needed by sectors outside health has not been emphasized. Ideally, country-level decision-making across a range of sectors would be informed by an integrative information system (surveillance unit) that links the nutrition, health, and agriculture-related information needs of a range of sectors and actors. One of the aims of INDDEX 56 is to support low-income countries to develop guiding frameworks, information systems, and decision support tools that can improve dietary data use and illustrate the utility of dietary data in making a wide range of decisions spanning multiple sectors.
Food Classification and Description Systems
Preparing valid and reliable data on food and for subsequent usage in FCBs requires accurate nomenclature, comprehensive classification, and detailed description of foods. Of the individual dietary assessment tools reviewed herein, only the 24hR/record method allows for extensive details of foods consumed to be collected by means of open-ended questions, while the FFQ lists specific selected food items with or without additional collection of limited information on, for example, cooking or preparation methods. The former approach is quite advantageous in allowing substantial flexibility and analytical possibilities. Regardless of the approach, dietary data should be collected, processed, and analyzed in a harmonized and standardized way across participants of the same survey and across dietary surveys if exchange of dietary data is required to enable acquisition of reliable dietary data.
Challenges in Food Classification and Description Systems
Deriving dietary data from foods that are not clearly classified or described can be a source of error. For example, a local food name could be inadequate or unclear to those who are not local experts and not familiar with the local culture or language; a common name could be confusing if used for different foods in different parts of the world (eg, cookies vs biscuits) or even within the same country (eg, rural vs urban parts) or from different participants. Use of synonyms, same brand names for different products, scientific, or culinary terms complicates things even further. Considering that most diet assessment methods across dietary surveys use different methods or even language for identifying, classifying, and describing foods, it is particularly difficult to not only harmonize dietary data but to further exchange and analyze data from different countries, institutions, or even researchers from the same institution. Depending on the population and type of diet assessment tool used, the unique food items recorded could range from a few hundreds to several thousand providing numerous additional variations when accounting for the description and quantity of the food consumed. This makes the collection, processing, and analysis of such dietary data demanding and challenging. In the context of national dietary surveys, it is quite important that foods consumed are described in detail and that the same level of detail is obtained in a standardized fashion for the same food from respondents, which is more difficult in open-ended pen-and-paper approaches. For example, the type of ingredients used in bread (eg, grain used or whether or not whole grain); whether the milk was low fat or high fat; whether the fish was raw, cooked (and further steamed, fried, baked, etc), and/or smoked; or whether the pizza was purchased or homemade or for certain foods the variety (eg, white or orange-flesh sweet potatoes). Another important challenge is that a large part of dietary intakes comes from recipes/mixed dishes and not from individual foods that need to be accurately disaggregated. Mixed dishes should be disaggregated as much as possible into their main ingredients at a level that can be reported and further similarly described by participants as needed to be able to account, for example, vegetable intake from all sources. 46 Also, not clearly classifying the level of a particular food consumed may lead to further errors, such as by classifying a particular food item such as fruit when it is a vegetable (eg, vegetables and vegetable products, root and tuber vegetables [excluding starchy and sugar vegetables], and carrots and similar carrots). As previously described, subsequent matching of food intake to food composition data could introduce additional sources of error.
Suggestions and Opportunities in Food Classification and Description Systems
To overcome this issue and enable harmonized and high-quality dietary data collection and analysis, a common food classification and description system should be developed and used by each nation, region, or even worldwide. Such a system should enable collection of information available on single food items through a combination of classification (hierarchy/level of reported food item) and description elements (commonly called “facets”). However, national or regional systems may be more difficult to use on a global basis, as the foods classified and defined may not be applicable to other nations. Global dietary initiatives should aim to develop and use a standardized food classification and description system to enable harmonized dietary data collection and processing.
Although several food classification and description systems are available, 125,126 very few national individual-level diet surveys around the world actually have a food classification and description system in place. Household surveys in the European Union (EU) member states use the Eurostat Food Coding System (PROCOME) food classification scheme; the EU DAFNE (DAta Food NEtworking) Project has enhanced the PROCOME and UN Classification of Individual Consumption According to Purpose (COICOP) classification schemes to enable harmonized dietary data collection in the context of household surveys in European countries. 38,54 Food and Agriculture Organization FBSs also use a prespecified food classification scheme and enable provision of harmonized data across member states on an annual basis. In Europe, the use of FoodEx system is recommended (latest version FoodEx2) across all member states for individual-level dietary data, which have been further updated to include foods consumed outside Europe through a collaboration with FAO and World Health Organization (WHO; Online Appendix 7). 46 If dietary data collection is performed by means of computerized approaches (eg, CAPI), then the food classification and description system should be embedded within the dietary software. Effectively, once a food item is selected, a prespecified and successive set of questions should follow, enabling its description in a consistent and systematic manner across participants (so that the same level of information is collected for the same food item). The FoodEx system provides a unique opportunity for further enhancements and adaptation to enable harmonized dietary data collection and processing on a global scale providing that funding could be secured for continuous updates and monitoring.
Indicators of Dietary Quality and Quantity
Once the foods and nutrients of interest have been characterized and quantified, the key question is how to use those to define healthy or unhealthy diets. To facilitate comparability across nations, regions, time periods, and diet assessment methods, standardized exposure definitions (metrics) and units of measure need to be selected and defined in order to characterize and monitor diet quality and quantity. In low-income country contexts, the concept of diet quality has been defined primarily in terms of diet diversity. 127 However, multiple other dimensions of diet quality must also be considered (balance, moderation, adequacy, etc), particularly as countries undergo nutrition transition and increasing rates of NCDs. At the moment, diet quality is not monitored at a global level, despite the fact that the “quality” dimension is embedded in the definition of food security. Global measures of food security capture only energy sufficiency at national levels through FAOSTAT data.
Challenges in Indicators of Dietary Quality and Quantity
Considering that the ultimate aim is to understand the health implications of diet, a key challenge is in determining the most relevant dietary metrics for health (eg, which are the most relevant dietary indicators for NCD risk, micronutrient deficiencies or other conditions, and how these should be defined). A global measure of diet quality could be presented either as a composite index that aims to capture diet patterns of the population against a normative standard of healthful eating or as a dashboard of indicators.
In linking diet changes to disease burden, another key question is whether the most relevant dietary metric for health should be absolute intake, independent of calories, or relative intake, as a proportion of calories. Total energy intake varies among individuals due to age, body size, lean body mass, physical activity, and so forth. For example, if a large active man consumes 3000 kcal/d including 1 apple and a small woman consumes 1500 kcal/d with the same apple, should they be expected to receive similar benefit? Or does the man need to consume 2 apples to receive the same benefit due to larger size, muscle mass, and physical activity. These questions are not easily answered and will largely depend on the purposes of dietary data analysis.
Suggestions and Opportunities in Indicators of Dietary Quality and Quantity
Certain principles can be taken into account when selecting and subsequently defining the dietary indicators of interest. 128 For example, if the focus is to investigate associations of diet with disease risk, then the selected dietary indicators should be causally associated with the diseases of interest, based on standardized criteria for assessing causality of diet–disease relationships. 31,129 –132 Metrics and units of measure can be subsequently defined to be (1) as similar as possible to the corresponding values in epidemiological studies (cohorts and trials) used to quantify the harmful or protective effects on each dietary factor on the disease(s) of interest, (2) most interpretable from biologic and policy perspectives when considering diet, and (3) as similar as possible to common definitions used to ascertain exposure data in the regions and countries of interest. If the focus is to collect dietary data across multiple survey methods and tools, then alternative metrics can be further developed and used to facilitate data collection and standardization. 128,133 –136 Optimal and alternative measurement units can be developed based on similar considerations. These individual dietary indicators can be subsequently combined to derive a composite index as for the GDD. 137 Other composite indices available (eg, Healthy Eating Index and Mediterranean Diet Quality Index) have not been validated across multiple country contexts. The one that has undergone the most cross-country validation and appears promising is the Dietary Quality Index-International. 138 This must be further tested both in terms of cross-country appropriateness and in terms of its predictive validity.
Although the question on absolute versus relative intake is not easily addressed, associations of diet with disease are generally stronger following energy adjustment, which may relate both to biologic relevance of composition (energy-adjusted intake) and also to reduced measurement error with energy adjustment. There are also other approaches to correct for measurement error (Online Appendix 8). However, absolute intakes may be more relevant for characterizing and comparing intakes within or across populations and for food security.
In considering a global measure of diet quality, recent research has considered the possibility of deriving diet quality metrics from FBS data, which have the advantage of being standardized and collected annually across most countries. 139 Household data are another underutilized source of diet quality information as are, of course, individual-level dietary surveys. Incorporating a brief module of diet quality questions into the Demographic and Health Survey 140 would be another positive option. Movement toward a global metric or dashboard of diet quality indicators for global food security and nutrition surveillance are needed to balance the “ideal” set of indicators, from a scientific/technical standpoint, with data availability concerns. Such global metrics are crucial to characterize nutrition transitions across the world and to inform policies and priorities for reducing the health and economic burdens of poor diet quality.
Constructing a GDD Based on Available Data
Considering that harmonized and standardized primary individual-level dietary data collection, processing, and analysis across all countries and regions around the world is not currently in place, evaluation and decision-making needs to be based on the best data that are currently available. Although there are a few international initiatives that focus on harmonizing primary dietary data collection and analysis, these are either not available in all countries and years or do not focus on individual-level dietary data: the FAO FBSs, available in all countries and years, yet not reflecting individual-level intakes; the DAFNE project, focusing on European countries and household surveys, available for a few years and on household expenditures; and the Comprehensive Food Consumption Database by European Food Safety Authority (EFSA), focusing on European Member States and individual-level dietary data, similarly available for a few years (Online Appendix 9). Such initiatives are quite costly and require an “institutional home”/surveillance unit with substantial resources to support continuous monitoring and updating. As such, the only available option for constructing a GDD on individual-level dietary data is to rely on secondary nonharmonized, yet to the extent possible, standardized dietary data. This is the aim of a few other international initiatives, such as GDD, FAO/WHO Global Individual Food consumption data Tool (GIFT), which are described in greater detail in Online Appendix 9 (Supplemental Table 1). Of those, the GDD initiative provides modeled data in all countries around the word for key dietary indicators related to undernutrition and chronic diseases by key sociodemographics (such as by age and sex). These data, founded on individual-level nationally representative surveys, have implications for public health research and policy and cross-country comparisons. Country-specific GDD data inform national efforts to characterize and alter diet, reduce disease, and improve population health, particularly in countries where no other representative source of individual-level dietary data are available.
Challenges in Constructing a GDD
There are several challenges when constructing a GDD based on secondary data collection, processing, and analysis. First, publicly available individual-level dietary data are quite limited requiring extensive contacting with local contacts, which can be time-consuming and laborious. Second, survey design, representativeness, and targeted populations differ for dietary surveys across countries and further within the same country and over time, resulting in data that are not harmonized or standardized across dietary surveys. Third, the diet assessment method also varies, increasing complexity in terms of which dietary factors are assessed (foods and nutrients), their validity, and whether or not they reflect “true” individual intake. Fourth, FCT/FCDB are often outdated/inadequate compared to the type and quantity of food items reported. Fifth, any secondary data standardization and processing requires extensive resources both for the “initiative’s institutional home” and the “dietary survey home,” with requirements usually varying by institutional home thus increasing burden, confusion, and unwillingness to participate in various different global initiatives. Finally, data gaps are expected when assessing global dietary intakes, such as for certain countries, certain dietary indicators across countries, population subgroups, representativeness, or time periods.
Suggestions and Opportunities in Constructing a GDD
To construct a GDD based on existing data sources and generate valid and comparable intake estimates around the world, consistent methods need to be developed and used. This would require the establishment of an international global dietary surveillance unit. This will facilitate comparability across countries, regions, time periods, and diet assessment tools, and thus allow collection, extraction, and analysis of dietary data in a systematic and consistent manner. Most importantly, it would minimize burden to participating surveys, which would be approached by one versus multiple diverse international initiatives. As a first step, and depending on the purpose and intended use of a given GDD, specific inclusion and exclusion criteria have to be set to determine data needs, years of assessment, population coverage, survey coverage and representativeness (including sampling design), and dietary assessment methods/tools to be used. The methodology and protocols used to identify on a global scale the required dietary surveys and information related to the characteristics of the surveys, population, and diet assessment methods have to be extensive, systematic, and standardized and include review of both publicly available and unpublished dietary data sets. Interestingly, relatively few appropriate published data sources are available, although diet surveys have been carried out in many countries around the world. 48,128 This emphasizes the importance of engaging early on with nutrition country and global experts to not only identify and retrieve relevant diet surveys but also to further better understand, assess, and utilize country-specific dietary data. Therefore, in constructing a GDD, identification and engagement of experts are of utmost importance. Ways to formally recognize their effort and valuable contribution should also be considered. Standardized protocols are needed for each subsequent step, including systematic search strategies; survey identification, quality assessment, and inclusion; dietary quality assessment and inclusion; data retrieval and standardization (including recategorization using a common/harmonized food classification and description system); data quality checks, processing, and extraction; ascertainment of missing data; data analysis; and data dissemination. Making the data publicly available and easy to assess/access by the global community as well as selecting the most appropriate dissemination platform for data visualizations and summary statistics is particularly important. In recent years, substantial prior work has been performed as part of the GDD initiative which developed rigorous methodology to address each of these challenges. 128,133 –136,141 More recently, the FAO/WHO GIFT initiative has explored using the EFSA FoodEx2 classification and description system for secondary dietary data recategorization (Online Appendix 9).
Despite systematic approaches to survey identification and data retrieval, data gaps are expected when assessing global dietary intakes, such as for certain countries, certain dietary indicators across countries, national representativeness, or time periods. Furthermore, even using systematic data retrieval and standardization methods, identified surveys and measures may not always be comparable—for example, varying in representativeness; urban or rural coverage; age, gender, and other SES groups; dietary instruments; or dietary metrics. To address missing data, incomparability of measured values, and related effects on uncertainty on dietary estimates, and further be able to provide consistent and comparable intake estimates across all countries and regions, sophisticated modeling can be considered such as that used in the recent work (Online Appendix 9). 1,133,134,136,142 To place observed intake levels in context and allow separate consideration of potential impact of current levels on disease so that policies and priorities can be directly informed, and for each dietary indicator, the optimal (maximum for protective exposures, minimum for less protective or harmful exposures), yet feasible, intake levels to minimize disease risk need to be characterized. These can be primarily based on observed levels associated with lowest disease risk in meta-analyses of relevant clinical end points, with further considerations of feasibility (mean national intake levels actually observed in at least 2 to 3 countries around the world) and general consistency with major dietary guidelines as, for example, determined in recent GDD work. 128,133,134,143 As not all individuals within a population can have precisely the same exposure level, the plausible distribution (eg, standard deviation) of optimal intake should also be determined, reflecting the residual between-person variation within the population after implementation of optimal changes in mean population exposure.
Optimizing dietary habits to improve population health requires systematically identified and evaluated data. These data facilitate quantitative assessment of disease burdens attributable to these dietary factors and inform public health and policy priorities for global, regional, and country-specific interventions. Although ecologic comparisons between population diet changes and outcomes can provide possible hints, these are fraught with danger due to ecologic confounding, that is, multiple other differences and unrelated trends over time between nations. Consequently, the Global Burden of Disease (GBD) Study and similar modeling exercises perform comparative risk assessment analysis 1,17,131,142,144 –147 and use state-transition Markov models 148,149 and food impact models 150 –152 to assess potential impacts on disease burden, utilizing separate information on causal effects of dietary factors from controlled trials and prospective cohorts to understand the impact on health.
Recommendations for Improving Global Dietary Surveillance
Suboptimal diet is one of the leading causes of morbidity and mortality worldwide, exceeding the burdens due to physical inactivity and tobacco combined. Most of this is due to diet-related malnutrition, which collectively poses immense health and economic burdens. Quantifying the patterns and distributions of dietary habits is thus crucial to inform and establish dietary priorities, improvement goals, diet interventions and policies, and reduce diet-related disease and disparities in different nations. Several different priorities and recommendations have emerged for improving global dietary surveillance from the present review. These include the following: Establish a central surveillance unit for continuous global dietary monitoring that should be internationally recognized as such and will lead and implement recommendations that follow. The establishment of this unit should be based on an evidence- and consensus-based process following established criteria (eg, Delphi process).
153,154
Although several different regional or global initiatives exist that serve distinct and/or common purposes and priorities, there a clear need to bring together those initiatives, identify requirements and areas of improvement/focus, maximize use of resources, avoid duplication of effort and minimize survey participation burden, and jointly establish common principles for improving global dietary surveillance. This unit would serve as a reference and support for other global/regional initiatives and national institutions engaged in surveillance (satisfy users’ needs). Investigate public–private partnerships, sponsors, or other options for funding the global dietary surveillance initiative and ensuring effective continuity of the surveillance system. The system should be effective and sensitive in monitoring within- and between-country changes over time. Monitor global and national surveillance costs, reduce such costs over time, and enhance sustainability of surveillance. Change the perception that dietary intake data are expensive and complex to collect; relative to its importance as a global risk factor for health, disparities, and sustainability; and compared to the amount of time and resources spent on many other traditional risk factors. Differentiate between the different types of dietary data, their strengths/limitations, and potential usage and highlight the need for acquiring individual-level dietary intake data. Leverage available valid dietary data from all available sources across nations to establish the global dietary surveillance initiative. Particularly considering that only half of dietary surveys worldwide use single or multiple diet recalls/records. Use standardized approaches to secondary data collection, analysis, and dissemination and evaluate quality (representativeness, accuracy, completeness, adequacy, etc) of dietary surveys and data. Further develop and validate existing approaches for the ability of food availability and household expenditure/consumption data to predict individual intakes (consider diet assessment method and level of aggregation: national, household, and individual). The GDD initiative could provide the starting basis for such efforts. Currently, the GDD provides modeled dietary intake data for all countries worldwide that can be used, with appropriate considerations, to characterize national dietary habits and inform dietary policies and priorities for improving population health. Expand dietary surveillance in developing countries and particularly in sub-Saharan Africa. Identify and/or establish a local “institutional home”/surveillance unit for diet monitoring in each nation. Countries should leverage existing infrastructure and surveys, such as HBSs, to add on or improve the collection of dietary data and to satisfy local, population-specific or national needs. Ensure it becomes a regular activity with appropriate resources, including availability of technical expertise, to monitor and evaluate dietary intakes and nutrition transitions over time. Build the evidence base to guide the design of Household Consumption and Expenditure Surveys in order to improve their potential to inform food and nutrition information needs and in particular to capture information on intrahousehold distribution of food according to age and sex if not possible to acquire individual-level dietary intake data in the short term. Prioritize the collection of individual-level dietary intake data versus food availability, food expenditure, or household-level consumption data in national/regional surveys. Further consider collecting objective dietary biomarker data, where possible, at least in a subsample of the population. Provide standardized guidelines for dietary survey design, tool selection, collection, processing, analysis, and dissemination, with a focus on countries/regions that have low-quality dietary surveys or limited dietary surveys. These guidelines should build on any existing efforts and be easily accessible. Harmonize the design, collection, and analysis of primary individual-level dietary intake data on a global scale. Recent examples in Europe (EFSA EU Menu Initiative) can provide the basis for such global dietary harmonization. Engage and work closely with national and international nutrition and policy experts and stakeholders. This is particularly important for dietary data sharing, harmonization, and standardization. Develop and validate a data collection and processing platform for use in all countries with necessary local/regional adaptations that can standardize, simplify, and streamline the collection, analysis, and use of individual-level dietary data. Update and/or create at least regional FCTs and, for priority countries, country-specific FCTs. These tables should include commonly consumed foods in raw, cooked, and processed/fortified forms as well as branded and fortified products and biodiverse foods. The included data should be based as much as possible on analytical data representative of the country or region. These tables should be accompanied by a database with nutrient composition information on common food supplements, either at national level or including in the FAO/INFOODS/The George Institute for Global Health (TGI) Global supplement database.
122
Investigate crowd-sourced methods, public–private partnerships, or other options for amassing food composition information to reflect changes in the food supply and improvements in the estimation of nutrient composition, particularly for products that are constantly changing (eg, processed foods). Develop and validate a global food classification and description system with appropriate local and/or regional extensions and adaptations. Evaluate and leverage existing systems such as the EFSA FoodEx2. Global Dietary Database and FAO/WHO GIFT are promoting use of FoodEx2 in participating surveys. Standardize the way in which food items are coded in FCTs and dietary data collection and processing systems in order to facilitate data processing and use. INDDEX is exploring using FoodEx2 to standardize data collection using the INDDEX24 platform in low-income countries. Develop a free-to-use global dietary software for streamlining the collection and processing of food consumption data, easily adapted for new settings, and directly linked to external databases (such as FCTs) for simplified data processing. Provide relevant guidance and resources to low-income countries, particularly in Africa, that have not used computerized software or other new technologies. Evaluate and leverage existing systems, if possible. Develop the capacity of low-income countries to make use of guidance and tools for improved diet assessment and analysis. Create a publicly accessible database of individual food consumption survey data that can be used to generate key dietary indicators. Increase the appropriate use of food consumption data to guide agriculture and nutrition policies and programs. Develop and validate indicators of diet quality that can be collected and monitored at a local, national, regional, and global level. Fruits and vegetables are the most available; yet dietary surveillance should be expanded to cover multiple other dietary indicators relevant to human health. Integrate diet-related indicators and information on the food environment into national health and agriculture information systems. Establish and monitor links with socioeconomic indicators, food security, agriculture (availability of food), health sector, causes of disease (eg, metabolic risks), and disease (eg, micronutrient deficiencies, obesity, diabetes, cardiovascular disease, and cancer). Investigate potential causes of nutritional problems. Inform and formulate local, national, regional, and global nutrition policy priorities with specific objectives and indicators. Disseminate the results of monitoring and evaluating activities, including outputs of the global surveillance initiative and feedback from users and how they are using it. Ensure consistency between the data disseminated by the global initiative and similar data published by other collaborating initiatives, participating countries, and so on. Continuously monitor progress, evaluate, update, and adapt the global surveillance initiative to include necessary changes for improvements identified in early/previous phases.
Supplemental Material
Supplemental Material, Supplemental_material - Global Dietary Surveillance: Data Gaps and Challenges
Supplemental Material, Supplemental_material for Global Dietary Surveillance: Data Gaps and Challenges by Renata Micha, Jennifer Coates, Catherine Leclercq, U. Ruth Charrondiere, and Dariush Mozaffarian in Food and Nutrition Bulletin
Footnotes
Authors’ Note
The funding agency did not contribute to design or conduct of the study; collection, management, analysis, or interpretation of the data; preparation, review, or approval of the manuscript; or decision to submit the manuscript for publication. RM and DM designed the research and provided overall guidance. RM drafted the manuscript. All authors checked and interpreted results, revised the manuscript for important intellectual content, read and approved the final manuscript. RM has primary responsibility for final content.
Acknowledgments
The authors would like to thank Ms Troubat from the Food Security and Nutrition Statistics team, Statistics Division (ESS), Food and Agricultural Organization of the United Nations, for her assistance in developing the section on household food consumption.
Declaration of Conflicting Interests
The author(s) declared the following potential conflicts of interest with respect to the research, authorship, and/or publication of this article: Dr Mozaffarian and Dr Micha report grants from Gates Foundation during the conduct of the study. Dr Micha reports grants from NIH/NHLBI and Unilever R&D and personal fees from the World Bank. Dr Mozaffarian reports grants from NIH/NHLBI and personal fees from Life Sciences Research Organization, Astra Zeneca, Boston Heart Diagnostics, GOED, DSM, Haas Avocado Board, Pollock Communications, and UpToDate; and scientific advisory board, Omada Health, and Elysium Health. All other authors declare no competing interests.
Funding
The author(s) disclosed receipt of the following financial support for the research, authorship, and/or publication of this article: This research was supported by the Bill & Melinda Gates Foundation.
Supplemental Material
Supplementary material for this article is available online.
References
Supplementary Material
Please find the following supplemental material available below.
For Open Access articles published under a Creative Commons License, all supplemental material carries the same license as the article it is associated with.
For non-Open Access articles published, all supplemental material carries a non-exclusive license, and permission requests for re-use of supplemental material or any part of supplemental material shall be sent directly to the copyright owner as specified in the copyright notice associated with the article.