
Abstract
Objective:
To perform a systematic review to evaluate iron, vitamin A, zinc, and iodine status and intakes in children and adolescents (0-19 years) in Ethiopia, Kenya, Nigeria, and South Africa.
Method:
Both national and subnational data published from the year 2005 to 2015 were searched via MEDLINE, Scopus, and national public health websites. For each micronutrient and country, status data from relevant studies and surveys were combined into an average prevalence and weighted by sample size (WAVG). Inadequate intakes were estimated from mean (SD) intakes.
Results:
This review included 55 surveys and studies, 17 from Ethiopia, 11 from Kenya, 12 from Nigeria, and 16 from South Africa. The WAVG prevalence of anemia ranged from 25% to 53%, iron deficiency from 12% to 29%, vitamin A deficiency (VAD) from 14% to 42%, zinc deficiency from 32% to 63%, and iodine deficiency from 15% to 86% in children aged 0 to 19 years from 4 countries. Generally, children <5 years had higher prevalence of anemia (32%-63%), VAD (15%-35%), and zinc deficiency (35%-63%) compared to children aged 5 to 19 years. Studies with intake data indicated that inadequate intakes ranged from 51% to 99% for zinc, 13% to 100% for iron, and 1% to 100% for vitamin A. Households failing to consume adequately iodized (>15 ppm) salt ranged from 2% in Kenya to 96% in Ethiopia.
Conclusion:
With large variation within the 4 African countries, our data indicate that anemia and vitamin A, zinc, and iodine deficiencies are problems of public health significance. Effective public health strategies such as dietary diversification and food fortification are needed to improve micronutrient intake in both younger and older children.
Introduction
Iron, vitamin A, zinc, and iodine are important micronutrients for growth, development, and survival of children, making them important micronutrients in global public health terms. 1 Both iron deficiency (ID) and ID anemia (IDA) as well as iodine deficiency are known to adversely affect cognitive development in children which may result in lower educational achievements and hence impact economic development negatively. 2,3 Vitamin A deficiency (VAD) affects immune function and leads to an increased risk of morbidity (often from diarrhea and measles). 4 Zinc deficiency may lead to growth failure and impaired immune function. 5 Both vitamin A and zinc deficiencies increase the risk of mortality in children. 4,5 Children, especially younger than 5 years from low- and middle-income countries, are particularly vulnerable to micronutrient deficiencies due to relatively high requirements of micronutrients for rapid growth and development, 6 accompanied with lower energy and micronutrient intakes and higher infection burden. 5 The 2013 Lancet series on Maternal and Child Undernutrition reported that stunting, wasting, and micronutrient deficiencies were associated with almost 45% of all deaths in young children worldwide, with the vast majority being from sub-Saharan Africa and South Central Asia. 6
Recent reviews showed that the sub-Saharan Africa region has the highest rates of anemia (46%-71%) and VAD (48%) prevalence in children <5 years, 7,8 while the prevalence of iodine deficiency (42%) and estimated inadequate zinc nutrition (25%) were also high in Africa. 9 –11 Majority of the surveys included in these reviews concern children <5 years only and were published more than 10 years ago, while data for school-age children and adolescents are largely lacking. Besides, most African countries lack nationally representative and up-to-date figures for micronutrient intake in children. Monitoring micronutrient status and intake is important, especially for countries with rapid population growth and urbanization. 12 Therefore, this study aims to perform a comprehensive systematic review to evaluate micronutrient status and dietary intake of iron, vitamin A, zinc, and iodine in children and adolescents aged 0 to 19 years in 4 of the 7 largest and rapidly growing countries in Africa, 13 including Ethiopia, Kenya, Nigeria, and South Africa, based on data reported in the last 10 years.
Method
Search Strategy
We followed a systematic approach to select all studies with data on iron, vitamin A, zinc, and iodine status and intakes in Ethiopia, Kenya, Nigeria, and South Africa. A literature search was conducted on MEDLINE, Scopus, World Health Organization (WHO), and The United Nations Children’s Fund (Vitamin and Mineral Nutrition Information System) databases from October (2015) to March (2016). A combination of the following terms were used to search abstracts and titles: anemia/iron/zinc/iodine/vitamin A AND deficiency/intake/status/prevalence AND Nigeria/Ethiopia/Kenya/South Africa AND infants/children/adolescents.
Full-text articles were obtained and reviewed to identify those that met the selection criteria given subsequently. The reference lists of all articles of interest were checked for additional studies. Websites of public health organizations were searched, and local experts were contacted to get access to additional studies and surveys.
Inclusion Criteria
After the initial search, all the publications and reports were screened to determine eligibility of data based on the following inclusion criteria. Reported data on the prevalence of micronutrient deficiencies in apparently healthy children (free of overt diseases) aged 0 to 19 years in Ethiopia, Kenya, Nigeria, and South Africa as assessed by the following biomarkers: For iron: Anemia: for 0 to 6 months to 5 years hemoglobin (Hb) <110 g/L; for 5 to 11 years Hb <115 g/L; and for >12 years Hb <120 g/L/130 g/L (boys). Roughly, 50% of anemia is caused by ID
14
; therefore, anemia prevalence was also included. Iron deficiency: Serum ferritin <5 years at <12 µg/L and >5 years at <15 µg/L,
14
regardless of correction for inflammation. Iron deficiency anemia: Combination of anemia and ID
14
For VAD: serum retinol <0.7 nmol/L (20 µg/dL).
15
For zinc deficiency: serum zinc <65 ug/dL (9.9 umol/L).
16
For iodine deficiency: Urinary iodine excretion (UIE) <100 µg/L.
17
WHO recommends school-based (6-12 years) sampling to be used when measuring UIE, and this can be used as a proxy for the younger age-group
17
; thus, data in >6 to 12 years also applies to <5 years and >12 years. Surveys and studies providing micronutrient intake data measured at individual level Study types: national surveys, population-based observational (cross-sectional or longitudinal) studies, or baseline or control group data from intervention studies Surveys and studies published and conducted later than year 2005 till 2015.
Data Extraction
Status data
For micronutrient deficiencies, we extracted the prevalence of anemia, ID, IDA, VAD, zinc, and iodine deficiency as specified in the inclusion criteria.
The prevalence of clinical signs of deficiency for vitamin A (ie, night blindness, bitot spots, corneal xerosis, and xeropthalmia) 15 and iodine (ie, goiter) 18 were also extracted and reported separately. For the biochemical markers of micronutrient status, we extracted the means, and when reported, standard deviations (SD) from each data source and report separately.
Intake data
Information on daily dietary intake of iron, vitamin A, and zinc in children aged 0 to 19 years was included as reported. For iodine, little data were available and therefore, data on household consumption of iodized salt were used.
When data were reported for subgroups (eg, by age range or gender), a weighted mean was calculated by weighing the mean intake of each subgroup by the number of the participants in the subgroup. When SDs were not reported, they were calculated from the standard error of mean or confidence interval. When data were reported as median (and ranges), we converted it to mean (±SD) by taking an average of median and the interquartile ranges (IQR). For converting the ranges to SD, we divided the difference between high and low IQR by 1.35.
Data Analysis
When, within a country, more than 1 study and/or survey was included on the status data of the same micronutrient, the results of these were pooled for each biomarker separately into an average that was weighted for the sample size of the studies (subnational data) and national surveys (national data).
Per country, and per micronutrient, the weighted average (WAVG) was calculated for all children (0-19 years) and specific age groups, including <5 y, >5-10 years, and 10-19 years.
Within these age subgroups, the WAVG from national and subnational data were calculated separately. Studies reporting on age groups combining both <5 years or >5-10 years (eg, 3-8 years) or >10- 19 years were included in the age group where majority of the children belonged (>5 years in this case).
Calculating inadequacy of micronutrient intakes
The Estimated Average Requirement (EAR) cutpoint method provides a way to estimate the prevalence of inadequate nutrient intake in a population. The proportion of participants with intakes below the EAR was used to estimate the prevalence of inadequate intake of micronutrients in the population. Per Institute of Medicine guidelines, 19 the conversion factor of 1.4 was used for iron and vitamin A, and 1.2 for zinc was used for calculating EAR from Recommended Daily Allowance set by WHO/Food and Agriculture Organization for each of the micronutrients. 20 For iron, the same conversion factor was used for children <9 years and for children >9 years to calculate the EAR. The bioavailability of 10% was used for dietary iron, and the “lowest bioavailability” was used for dietary zinc. For each survey/study, the prevalence of inadequate intake for iron, vitamin A, and zinc were estimated by comparing the reported mean ± SD to the corresponding EAR, assuming a normal distribution of the data. 21 For iodine, percentage of households consuming inadequately iodized salt (<15 ppm) or noniodized was included as reported.
Results
Data Availability
A total of 147 studies and 8 surveys were identified from the literature search, whereas only 55 data sets met the inclusion criteria. Of the 55 studies and surveys that were included in this review, 17 were from Ethiopia, 11 from Kenya, 12 from Nigeria (1 study reported data from both Kenya and Nigeria 22 ), and 16 from South Africa (Figure 1). Of the total 55 data sets, 15 surveys and studies included both urban and rural area. Twenty-four studies and surveys included only rural area and were mostly conducted in subsistence farmers or resource-poor settings. Thirteen studies and surveys included only urban areas and were mostly conducted in low socioeconomic settings (Table 1).
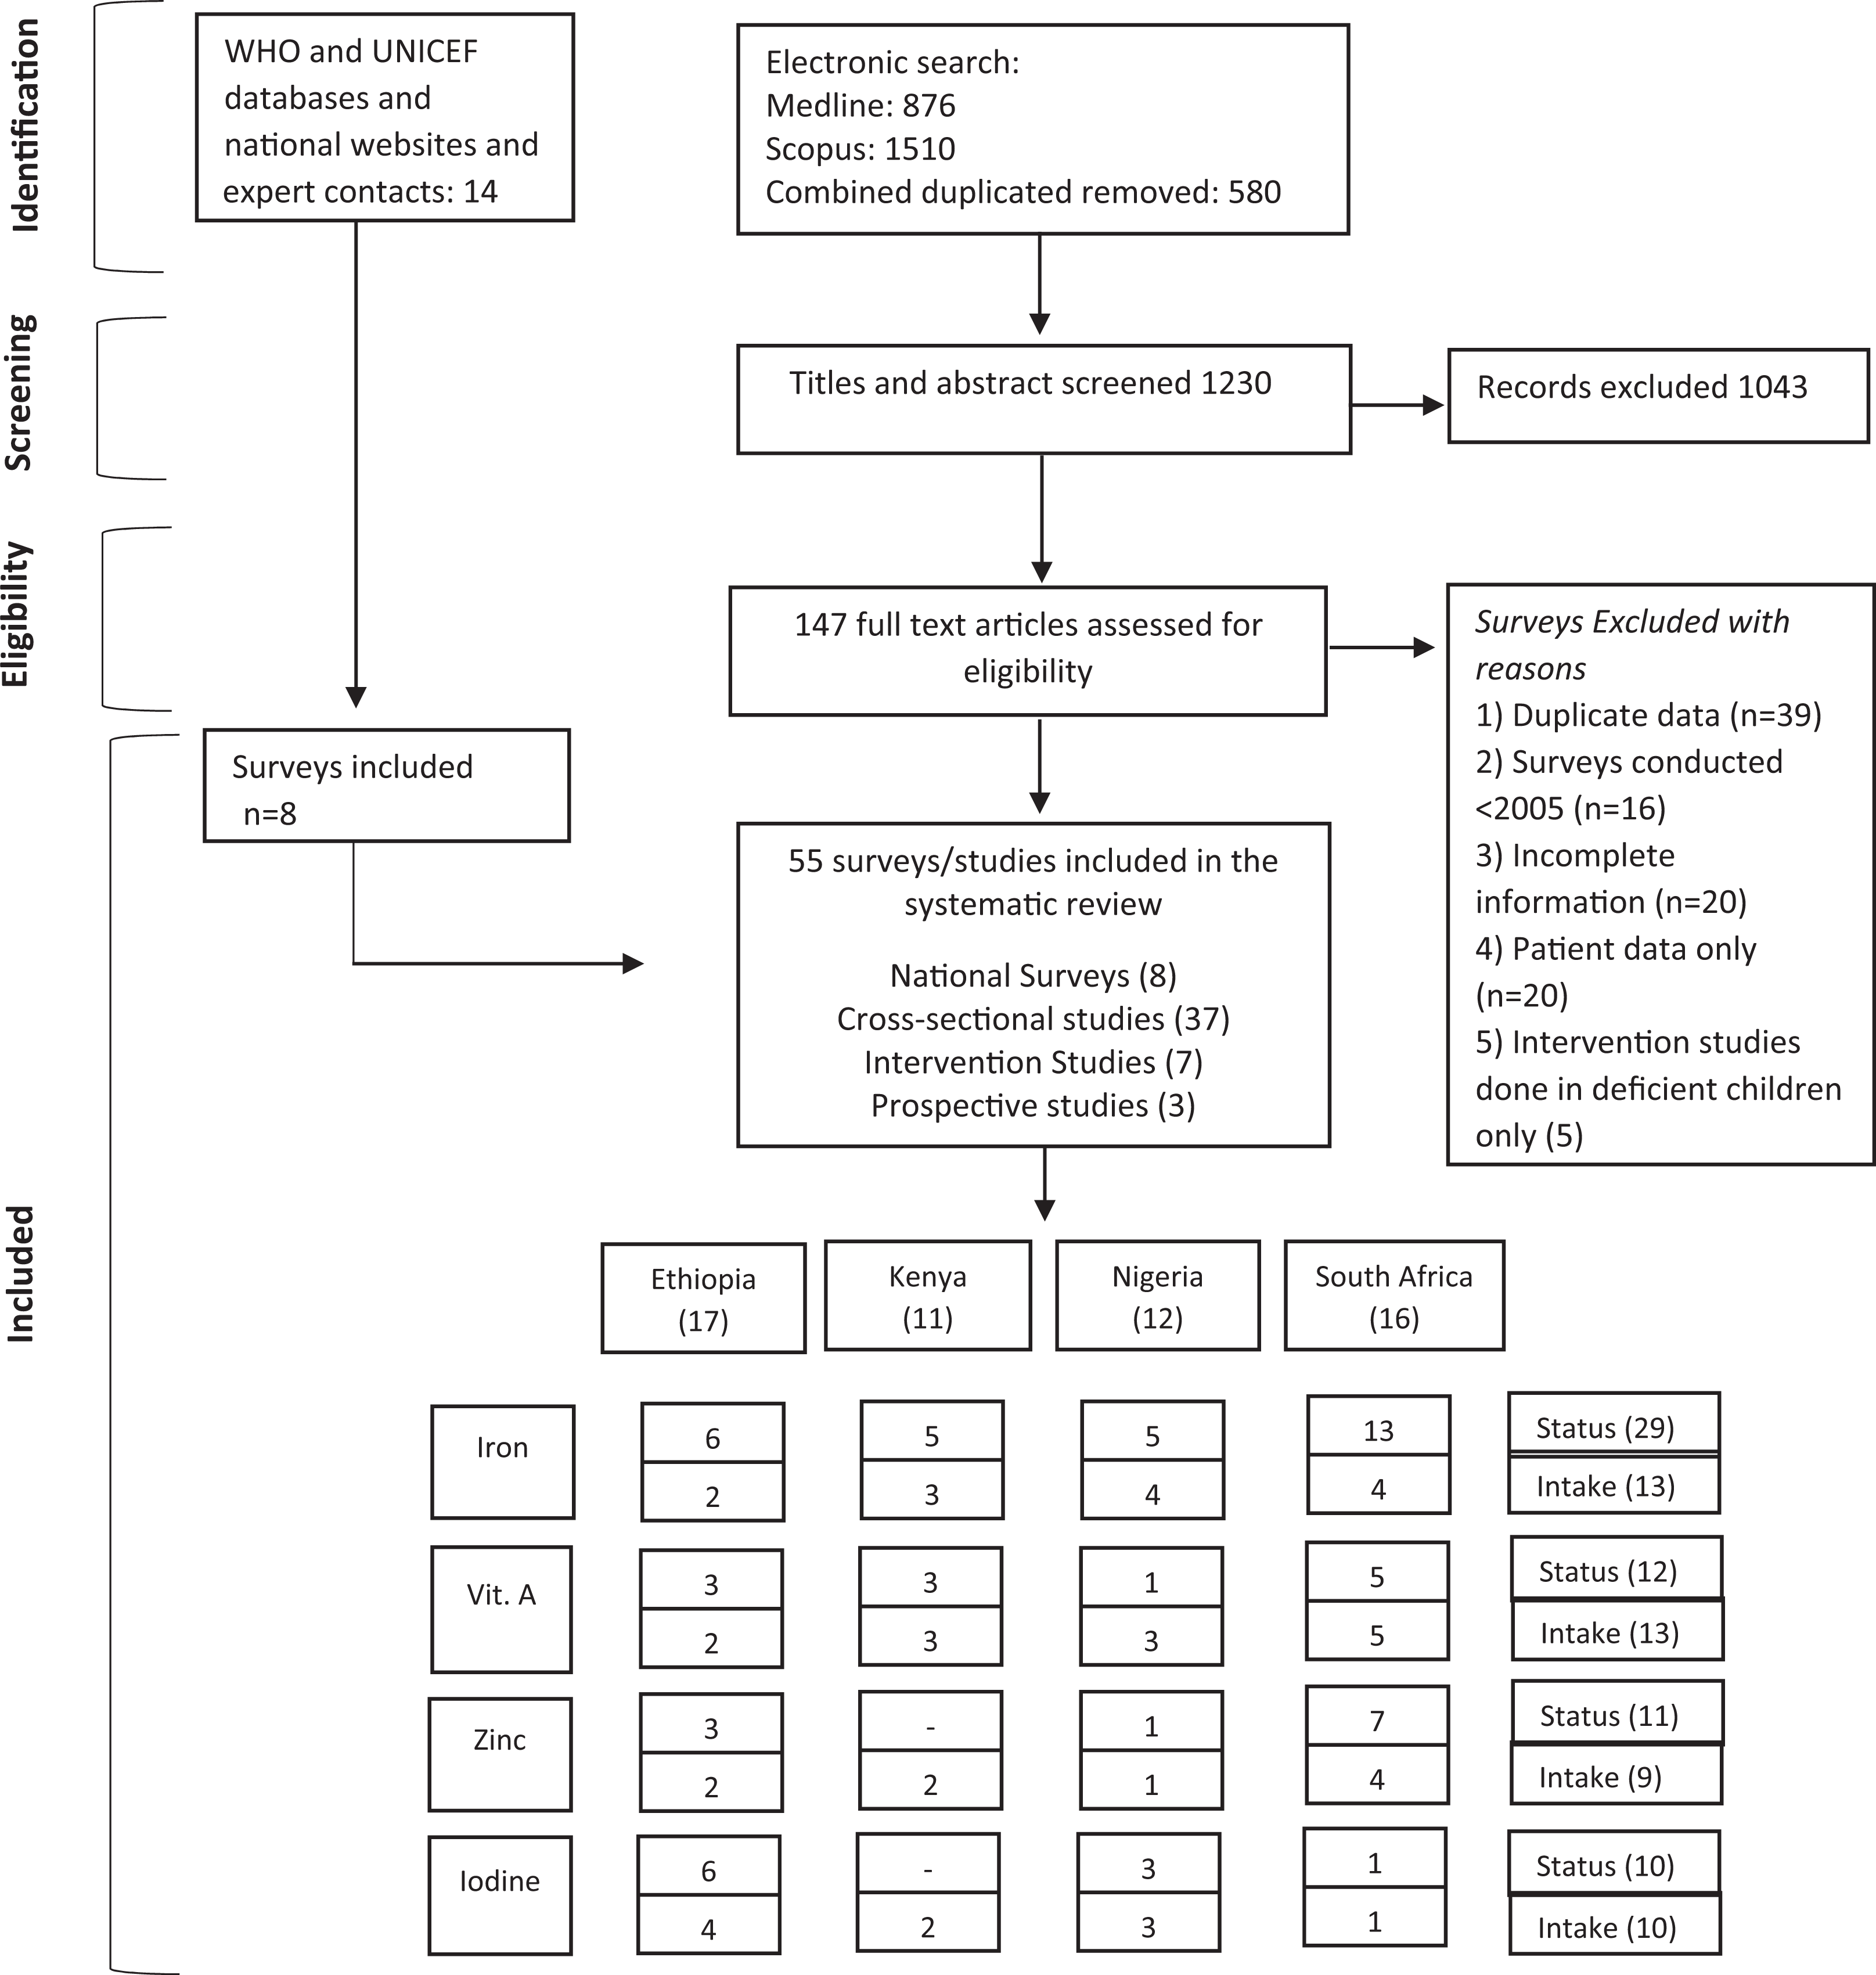
PRISMA Flow diagram 23 of the identification of literature for inclusion in this systematic review.
Characteristics of the Studies and Surveys Included From Ethiopia, Kenya, Nigeria, and South Africa.
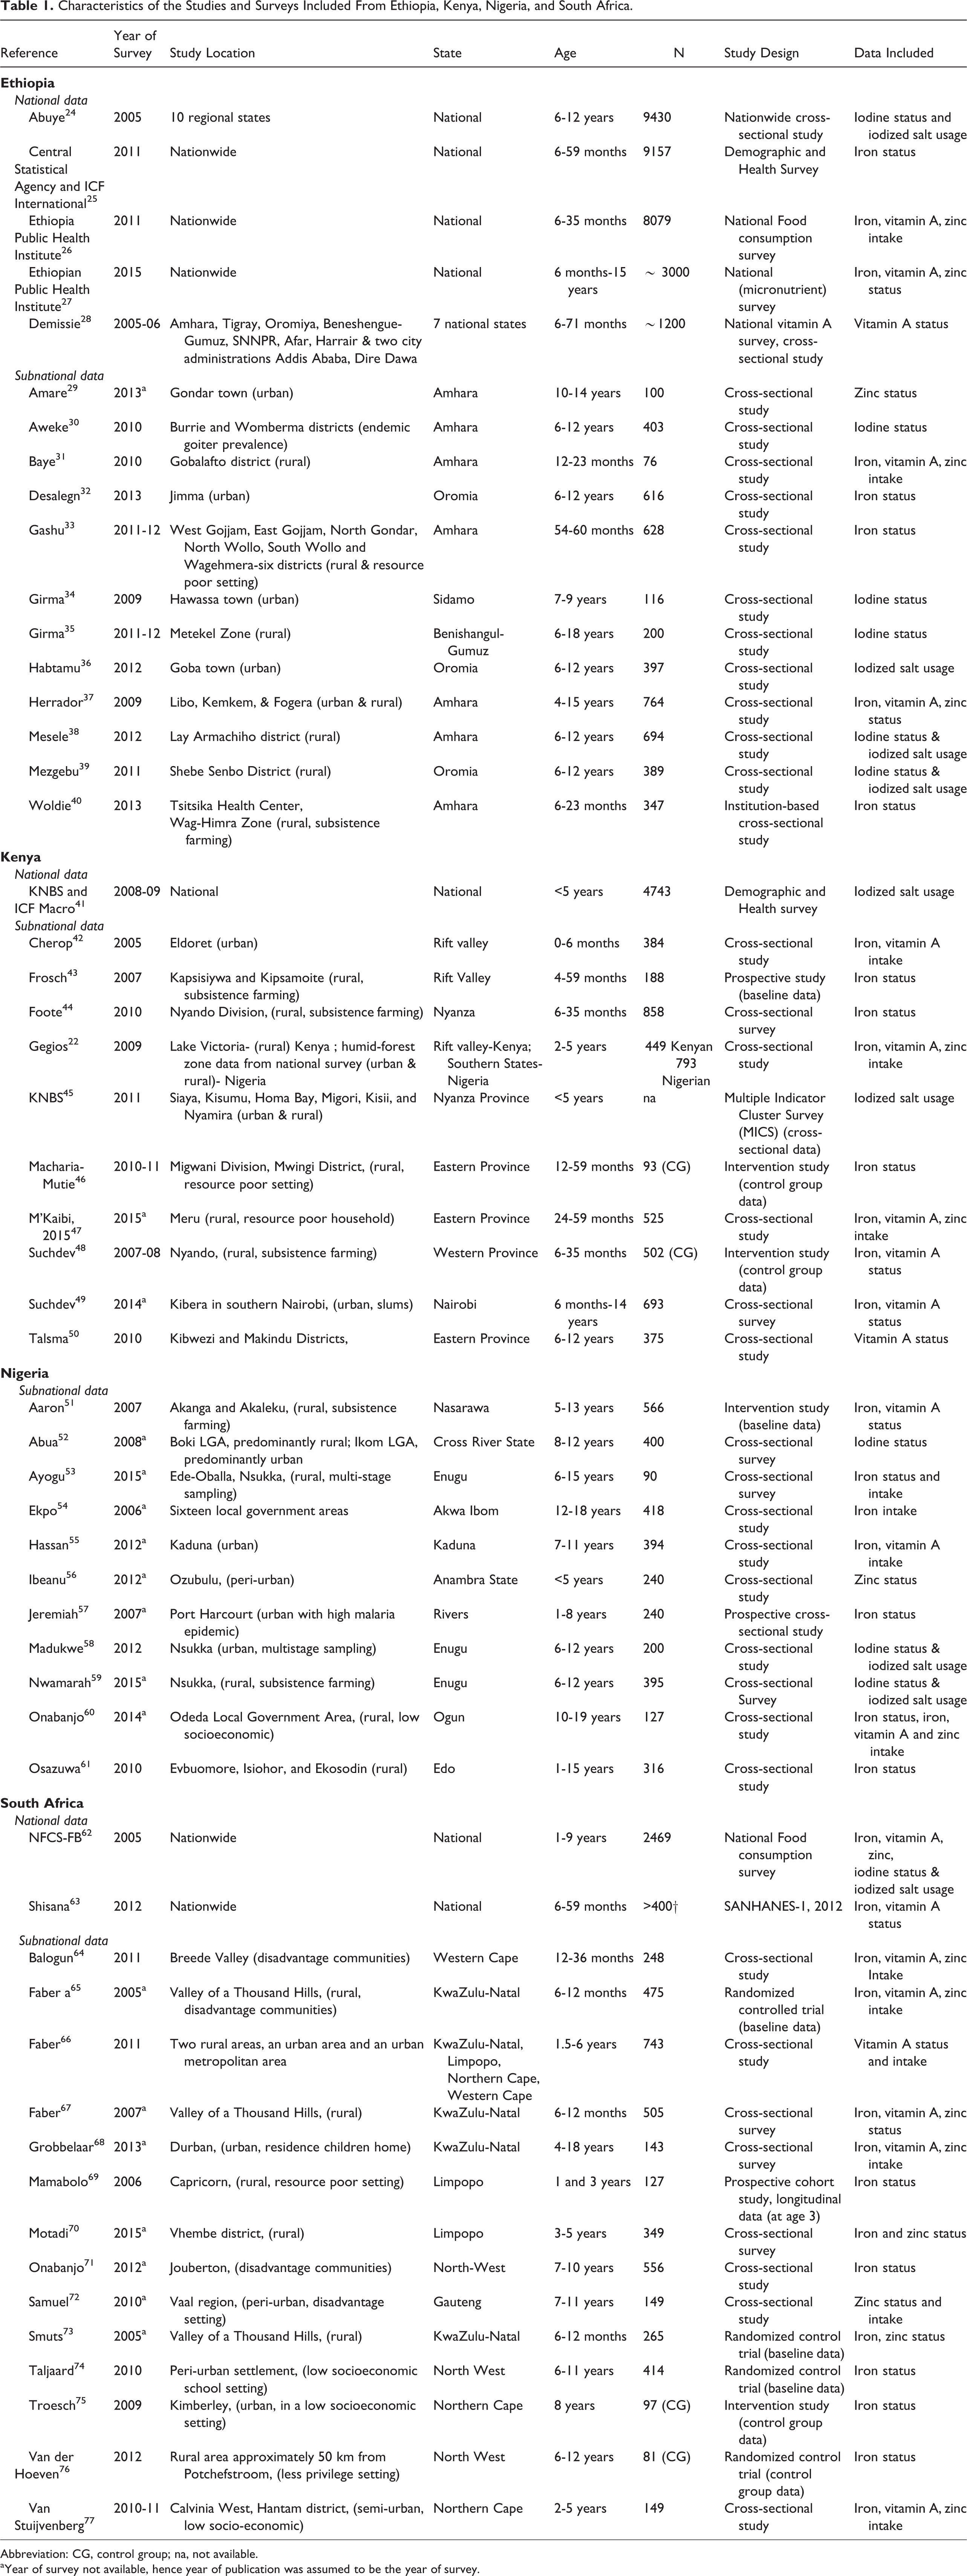
Abbreviation: CG, control group; na, not available.
aYear of survey not available, hence year of publication was assumed to be the year of survey.
Of the 55 data sources, 8 were national data and 47 were subnational data (37 cross-sectional studies, 7 intervention studies, 3 three prospective cohorts). For national data, 5 surveys were from Ethiopia, 24 –28 1 was from Kenya (iodine data only), 41 and 2 from South Africa. 62,63 No national survey was found for Nigeria. Majority of the data were on iron, and fewer data were found on vitamin A, iodine, and zinc (Figure 1). For 6 studies the sample size was <100, and for the other studies and surveys it ranged from 100 to 9430. All the included studies and surveys represent a total of ∼54 905 children aged 0 to 19 years in the 4 countries.
With regard to age-groups, there were 25 data sets for 0 to 5 years, 7 data sets for 5 to 10 years, and 3 data sets for 10 to 19 years, and 19 data sets had data for ages ranging from >5 to 19 years. Therefore, it was decided to create 2 separate age categories, including 0 to 5 years and >5 to 19 years.
Prevalence of Micronutrient Deficiencies in Children (0-19 Years)
Iron
Anemia prevalence in children (0-19 years) ranged from 25% to 53% (WAVG) in the 4 countries (Figure 2). Prevalence of ID ranged from 12% to 29% and IDA from 11 to 14% in the 4 countries. The prevalence of anemia was higher in children <5 years of age than in children >5 years of age in all countries except Nigeria (Table 2). Mean hemoglobin concentration ranged from 98 to 133 g/L, and mean serum ferritin concentration from 10 to 64 µg/L (see Supplemental Figure S1a).
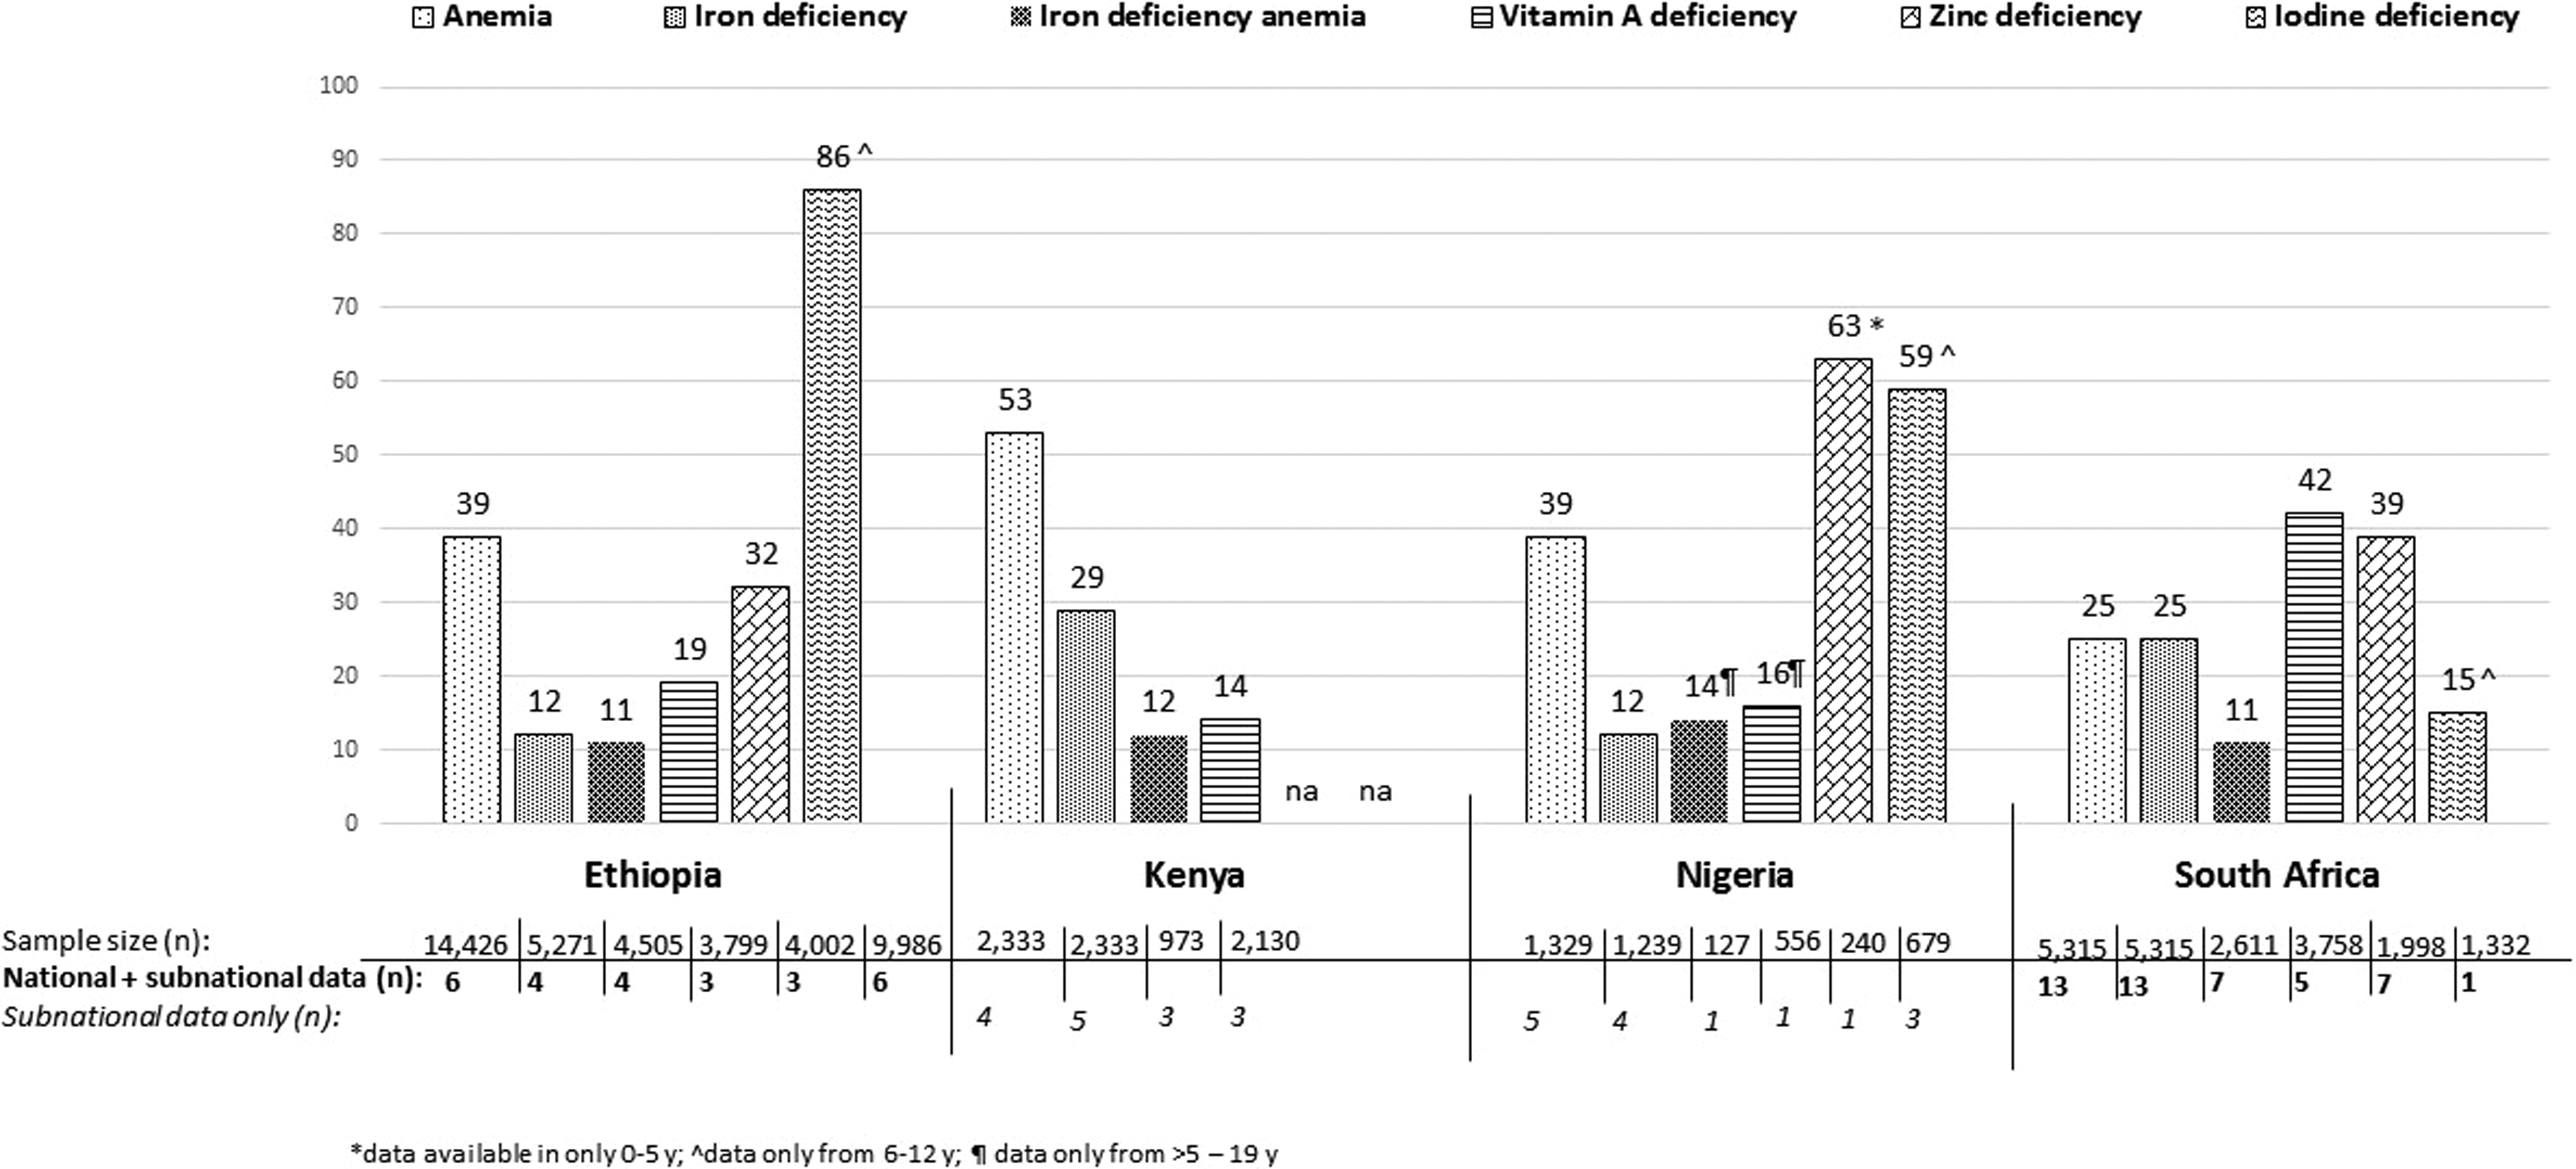
Prevalence of micronutrient deficiencies in children (0-19 years) in Ethiopia, Kenya, Nigeria, and South Africa. Abbreviation: na, not available.
Prevalence of Micronutrient Deficiencies (%) in Children (0-19 years) in Ethiopia, Kenya, Nigeria, and South Africa.
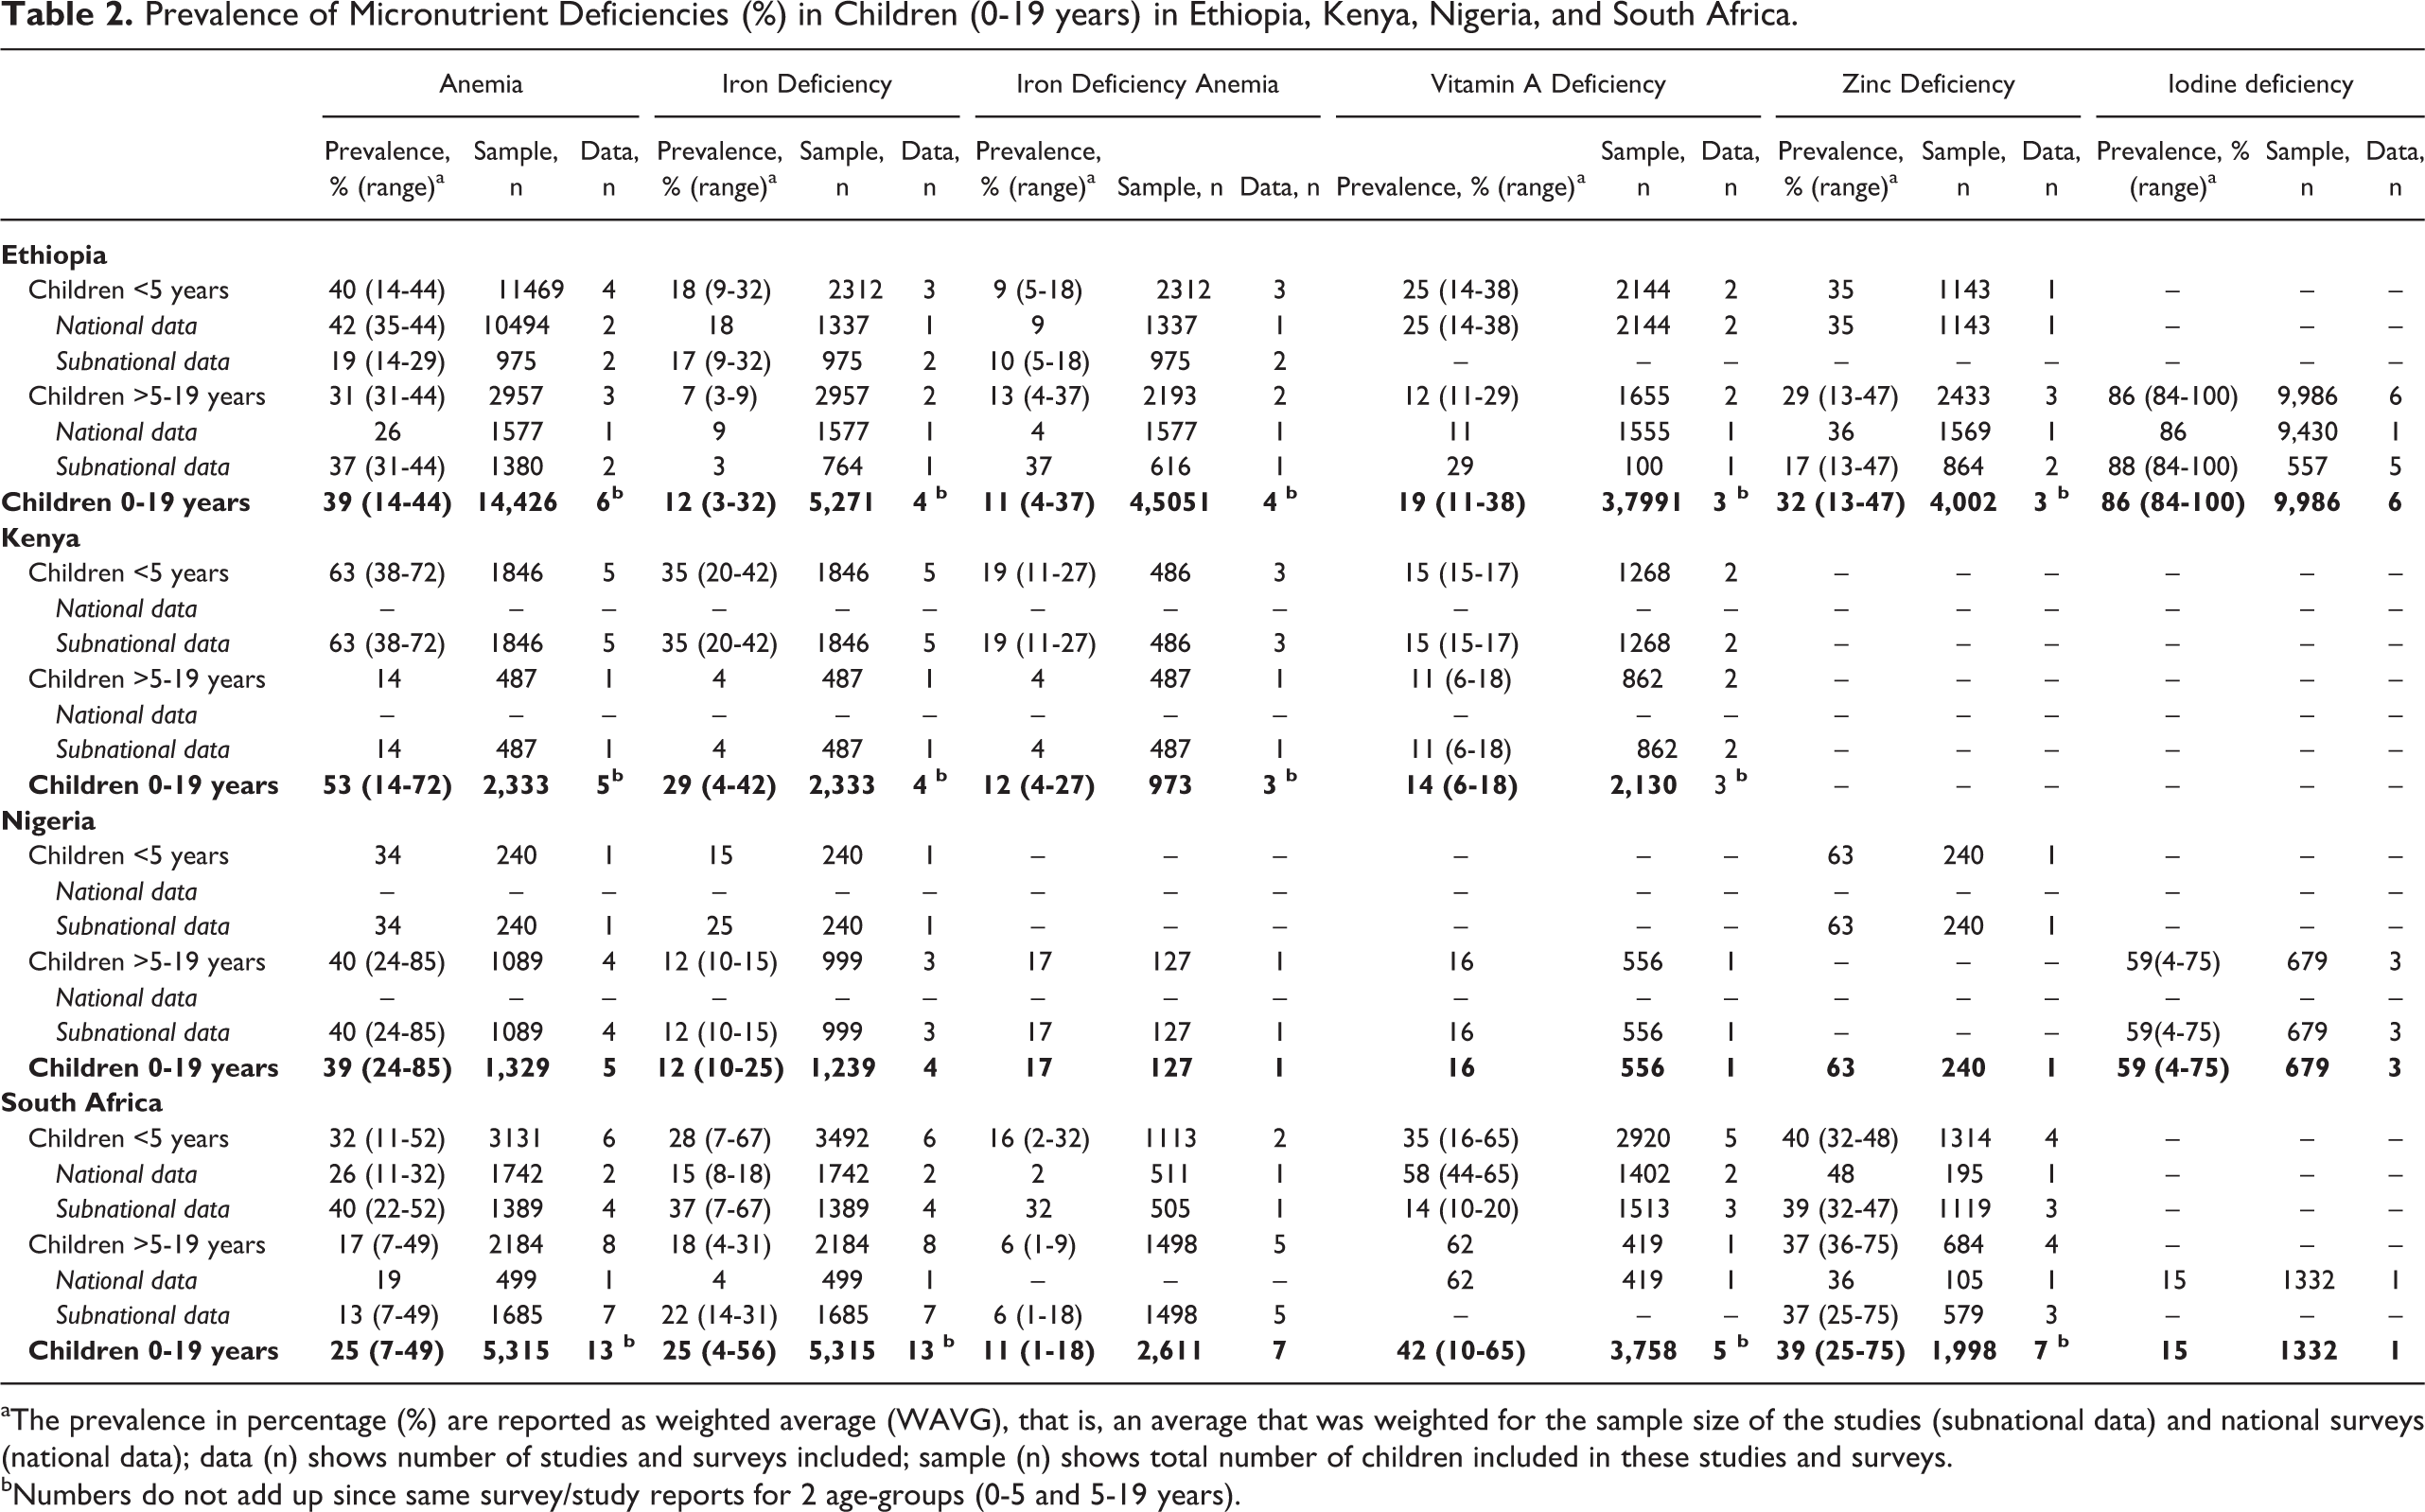
aThe prevalence in percentage (%) are reported as weighted average (WAVG), that is, an average that was weighted for the sample size of the studies (subnational data) and national surveys (national data); data (n) shows number of studies and surveys included; sample (n) shows total number of children included in these studies and surveys.
bNumbers do not add up since same survey/study reports for 2 age-groups (0-5 and 5-19 years).
Vitamin A
Prevalence of VAD in children (0-19 years) ranged from 14% to 42% (WAVG) in the 4 countries (Figure 2). No data on VAD were found for children aged 0 to 5 years in Nigeria. Mean serum retinol concentration ranged from 0.61 to 1.1 µmol/L (see Supplemental Figure S1b). Prevalence of VAD in <5 years was higher than in >5 to 19 years except for South Africa, where older children had higher (62%) prevalence of VAD. In South Africa, WAVG VAD reported in the 2 national surveys was more than double that of the WAVG of independent studies in children aged <0 to 5 years (Table 2). Mean serum retinol concentration ranged from 0.6 to 1.1 nmol/L (see Supplemental Figure S1b). The prevalence of xeropthalmia was reported in Ethiopia only, with night blindness at 0.8% and Bitot spot at 1.7% (see Supplemental Table S1).
Zinc
No data on zinc deficiency were found in children aged 0 to 19 years in Kenya. The prevalence of zinc deficiency in children (0-19 years) ranged from 32% to 63% in Ethiopia, Nigeria, and South Africa (Figure 2). Rates of zinc deficiency in <5 years were higher in both Ethiopia and South Africa (Table 2). Mean serum zinc concentration ranged from 6.6 to 13.3 µmol/L (see Supplemental Figure S1c).
Iodine
No data on iodine deficiency were found in Kenya. The prevalence of iodine deficiency showed a large variation among the 3 countries and was highest in Ethiopia at 86% (84%-100%), followed by Nigeria at 59%, and South Africa at 15% (Figure 2). Urinary iodine excretion ranged from 24 to 214 µg/L (see Supplemental Figure S1d). Prevalence of goiter was reported at 14% to 59% for Ethiopia (see Supplemental Table S2).
Dietary Intake of Iron, Vitamin A, Zinc, and Household Consumption of Iodized Salt in Children (0 to 19 years)
Iron
Mean dietary iron intake ranged from 4 to 28 mg/d, and the percentage of children with inadequate intake ranged from 13% to 100% (Table 3). In all 4 countries, up to 62% of the children aged <5 years had inadequate intake of iron. Data for children aged 5 to 19 years was available from Nigeria and South Africa, where 51% to 100% had inadequate intake of iron.
Average Iron, Vitamin A, Zinc, and Iodized Salt Intake and Percentage of Children (0-19 years) Population Failing to Meet the Recommended Intake in Ethiopia, Kenya, Nigeria, and South Africa.
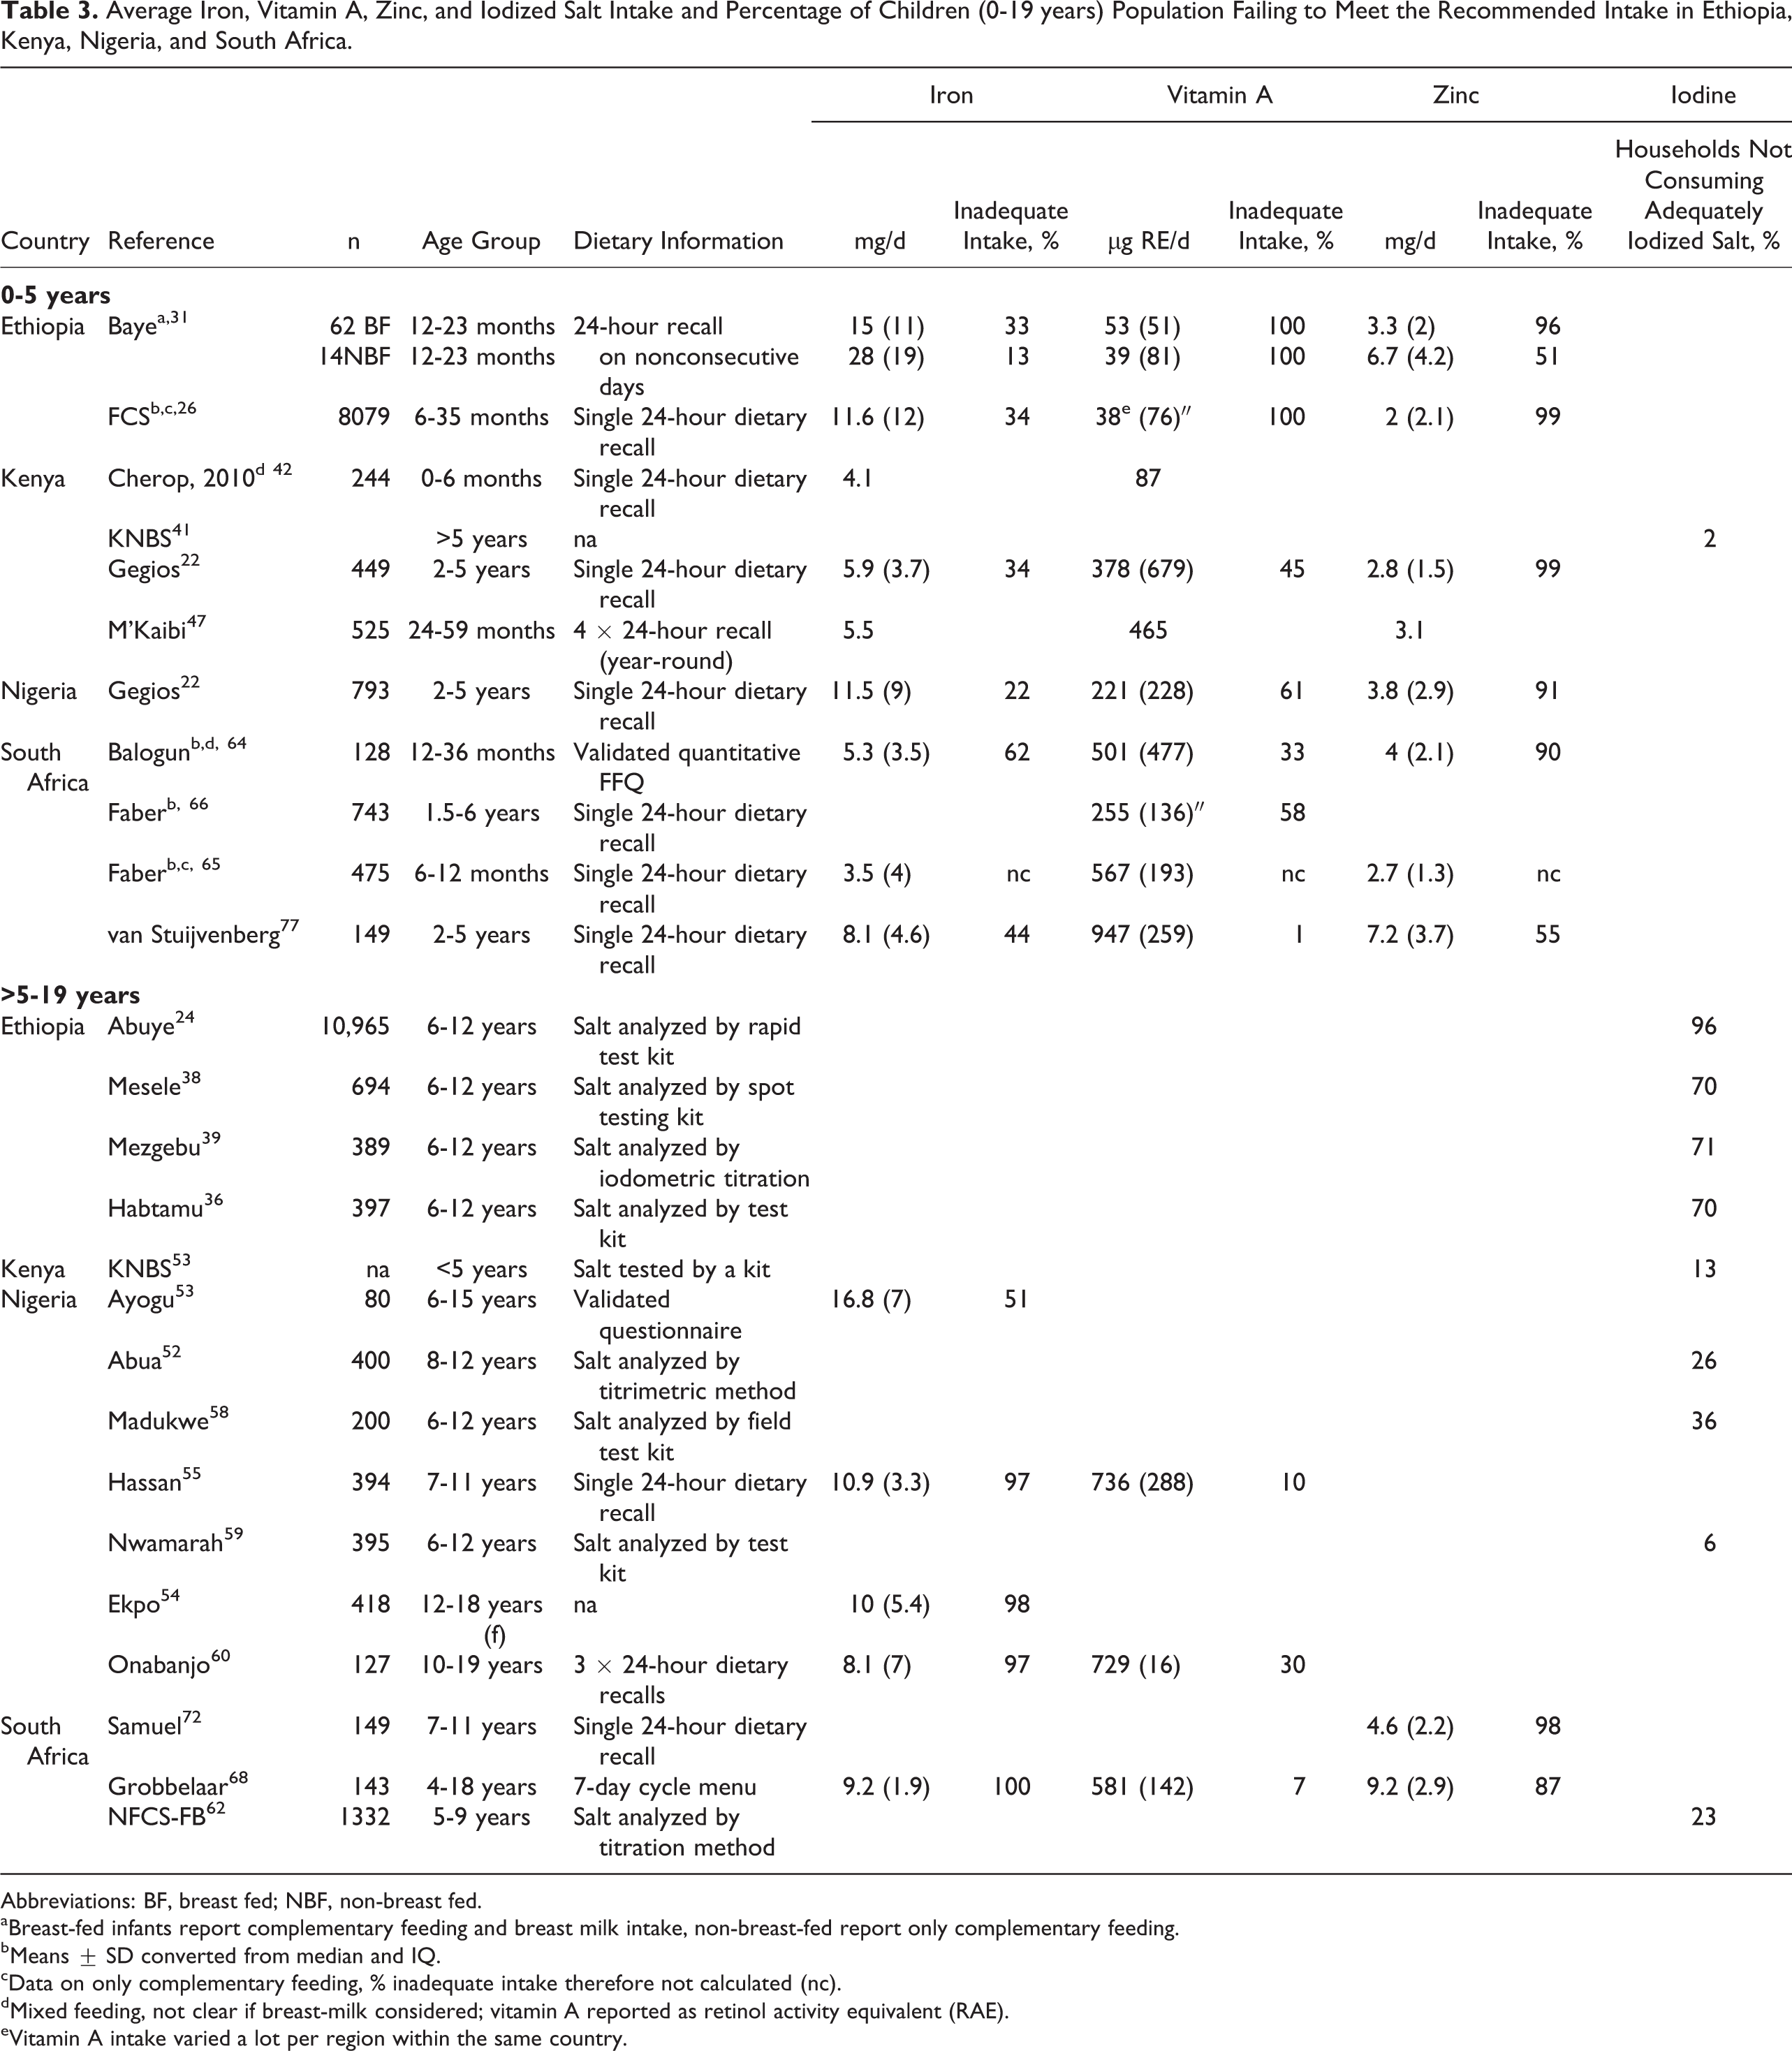
Abbreviations: BF, breast fed; NBF, non-breast fed.
aBreast-fed infants report complementary feeding and breast milk intake, non-breast-fed report only complementary feeding.
bMeans ± SD converted from median and IQ.
cData on only complementary feeding, % inadequate intake therefore not calculated (nc).
dMixed feeding, not clear if breast-milk considered; vitamin A reported as retinol activity equivalent (RAE).
eVitamin A intake varied a lot per region within the same country.
Vitamin A
Mean dietary vitamin A intake ranged from 38 to 947 µg/d, and the percentage of children with inadequate intake ranged from 1% to 100% (Table 3). For 5 to 19 years, data were available in Nigerian and South African children, and 7% to 30% had inadequate intakes.
Zinc
Mean dietary zinc intake ranged from 2 to 9 mg/d, and the percentage of children with inadequate intake ranged from 51% to 99% (Table 3). For 5 to 19 years, data were only available in South African children, and 87% to 98% of them had inadequate intakes.
Iodine
The percentage of households not consuming adequately iodized salt (>15 ppm) ranged from 2% to 96% (Table 3). Ethiopian households reported the highest (70%-96%) intake of inadequately iodized salt followed by South Africa (23%), Nigeria (6%-36%), and Kenya (2%-13%).
Discussion
This systematic review, based on both national and subnational data published in the last 10 years, shows that with large variation within and among the 4 African countries, prevalence of anemia, vitamin A, zinc, and iodine deficiencies are of public health significance. The prevalence of anemia is higher (25%-53%) than VAD (14%-42%) in all countries except South Africa while zinc deficiency (>30%) is also high in Ethiopia, Nigeria, and South Africa. The prevalence of iodine deficiency is high in Ethiopia (86%) and Nigeria (59%). Generally, children <5 years had a higher prevalence of anemia, VAD, and zinc deficiency compared to children aged 5 to 19 years. Data on inadequate intake of iron, vitamin A, and zinc and household consumption of iodized salt largely correspond to the prevalence figures for micronutrient deficiencies.
This systematic review is the first to provide an overview of both status and dietary intakes of iron, vitamin A, zinc, and iodine in children aged 0 to 19 years in 4 sub-Saharan African countries. Another strength of this review is the use of most recent data from 2005 to 2015 including both national and subnational data to determine the prevalence of deficiencies and inadequate intakes. Therefore, this review may help guide public health practitioners and policy makers in advocacy for public health strategies to prevent micronutrient deficiencies in children of different age-groups, especially where nationally representative data are lacking.
However, there are a few limitations to this systematic review. First, our figures of WAVG on the prevalence of micronutrient deficiencies for each country were based on both national and subnational data (which primarily were conducted in specific regions and rural areas) and need to be interpreted with caution. In our review, the prevalence of micronutrient deficiencies in rural areas was often higher than that of urban areas (data not shown) and may have therefore overestimated the problem of micronutrient deficiencies at a national level. Similarly, the subnational data (studies) were mostly conducted in children from low socioeconomic backgrounds, which may have led to an overestimation of the prevalence of micronutrient deficiencies and inadequate intakes. This is especially the case for Kenya and Nigeria and for children aged 5 to 19 years, where subnational data provided substantial weight to the overall figures on micronutrient deficiencies as national data were generally missing.
Second, dietary intake data from both national and subnational studies were based mostly on a single 24-hour dietary recall, which may have resulted in an under- or overestimation of micronutrient inadequacy because of day-to-day (within-person) variability in dietary intake. Within-person variability can be adjusted for if at least 2 nonconsecutive recalls (either on the full sample or on a subsample) are available. 78 Collecting repeated 24-hour recalls in large community-based surveys may however be challenging. Micronutrient intakes reported in the studies may also have been affected by the food composition tables used to calculate micronutrient intake. Nutrient content of certain foods, for example, fortified foods, biofortified foods, and indigenous foods, are often very country specific. If the food composition database did not reflect the country-specific nutrient content of these foods at the time of the survey, the nutrient values reported may have been an underestimation of actual intake and therefore leading to an overestimation of inadequacy.
Finally, for calculations of inadequate intake, it was assumed that the nutrient intake data were normally distributed, which may not have been the case, particularly for the nutrients under investigation. In addition, for 342, 64,65 of 5 studies in children younger than 2 years, information on breast-milk consumption was not provided explicitly which may have led to an underestimation of micronutrient intake. Therefore, figures for inadequate intake of iron, vitamin A, and zinc are crude approximations and should be interpreted as such.
Despite these limitations, the available data provide useful insights into the current ranges of the prevalence of deficiency and inadequate intake of iron, vitamin A, zinc, and iodine in children and adolescents in the 4 African countries as published during the past 10 years.
With a WAVG prevalence of >20% in all 4 countries, anemia is a moderate to severe public health problem as per WHO criteria. 14 The prevalence of anemia in children aged <5 years (32%-63%) was higher than in older children (14%-40%) in Ethiopia, Kenya, and South Africa. For Nigeria, it is not possible to make this comparison because only a small study (n = 240) was available for children <5 years. Drorbaugh and Neumann 79 reviewed the micronutrient status in 7 food aid beneficiary countries in Africa, including Niger, Ethiopia, Kenya, Uganda, Rwanda, Zambia, and Zimbabwe. Similar to our review, they reported that >40% of children <5 years had anemia. Furthermore, 2 recent global reviews covering population-representative data from 1995 to 2011, from up to 187 countries, reported that children <5 years living in African countries were among the populations with the highest prevalence of anemia (70%) next to South Asia. 80 More importantly, this was the only age-group in which anemia prevalence increased from 1990 to 2010. 80 This is of concern, as younger children are most vulnerable to detrimental long-term effects of anemia. 81 World Health Organization estimates that ID is the major cause of anemia responsible for almost half of anemia cases 14 ; however, most surveys only report figures for anemia, while data on iron status (ID and IDA) are limited. For the few studies that did report iron status, the prevalence of ID was 12% to 29% and IDA 11% to 14%. However, it should be noted that there is uncertainty for most of these studies whether serum ferritin levels were corrected for inflammation, and therefore the prevalence of ID in our review may be underestimated. 82 In line with high prevalence of anemia, inadequate intakes of iron were also reported in children <5 years (13%-62%) in all 4 countries. The prevalence of inadequate iron intake was particularly high (51%-100%) in children >5 years (data from Nigeria and South Africa only), which may be due to higher daily requirements for adolescents. 83
The prevalence of VAD indicates varying degrees of severity in the 4 countries (severe in South Africa and moderate for the other 3 countries) and is considered a significant public health problem as per WHO criteria. 84 Similar to anemia, VAD prevalence is higher (14%-35%) in <5 years children except for South Africa. This difference in South Africa may be explained by the difference in time frame, since the data in >5- to 19-year-old children (VAD 62%) is predominantly based on an older national survey from 2005, 23 whereas that of children <5 years (VAD 35%) also included a more recent national survey (2012) and studies. This decrease in VAD could be attributed to national vitamin A supplementation (VAS) program (since 2002) and mandatory fortification of 2 staple foods (maize meal and wheat flour that is used for making bread; since 2003). 63
The prevalence for VAD in children aged <5 years in the 4 countries are lower than the 48% (95% CI 25%-75%) prevalence estimated by the WHO from studies published 1991 to 2013 in sub-Saharan African <5 years children. 7 The higher estimates from WHO could be due to inclusion of African countries with a higher prevalence of VAD. It could also be that prevalence of VAD may have decreased over time due to VAS and fortification programs as shown for South Africa. Similar to status data, the intake data on vitamin A showed large variation within and among the 4 countries. The large variation in intake of vitamin A could be due to seasonal differences in consumption of vitamin A-rich fruits and vegetables or consumption of high liver products 77 or due to lack of clarity in some of the studies regarding the conversion factors used to calculate retinol equivalents from carotenoid intake, particularly in populations where plant foods are the major source of dietary vitamin A.
Our review showed that data on zinc status are limited which may be due to high costs, logistical challenges, and the limited number of valid biomarkers. 85 National and subnational data from Ethiopia and South Africa have reported the prevalence of zinc deficiency, which ranged from 32% to 39% in children aged 0 to 19 years, whereas only 1 subnational data reported zinc deficiency in Nigeria at 63% (<5 years). The prevalence of high zinc deficiency is in line with the large percentage (51%-98%) of children with inadequate zinc intakes in these countries. Wessells and Brown predicted that 25.6% of the sub-Saharan African population had inadequate intake based on estimated absorbable zinc supply from food balance sheets 86 which is lower than that found in our review. This difference may be explained by the fact that food balance sheet data may be more reflective of adult dietary intakes than intakes of children, since the type of foods consumed and the adequacy of food intakes by young children may differ substantially from those of adults in the same population. 85 The difference between estimated zinc intake based on calculations using food balance sheets and that reported by subnational studies may also reflect unequal access to foods within a country. Moreover, to compare the zinc intake to EAR, we used the lowest bioavailability for zinc, as diets in this region are high in phytic acids, 87 thus making the gap between current and recommended intake large.
Among the 4 countries included in our review, Ethiopia reported the highest iodine deficiency (86%) and high goiter prevalence (14% to 59%; see Supplemental Table S2). Similarly, in a 7 African country survey, Ethiopia (and Zambia) reported the highest prevalence of iodine deficiency. 79 Compared to Ethiopia, iodine deficiency was lower in South Africa (15%). However, our data show regional differences in the prevalence of iodine deficiency in these countries, with some regions having optimal iodine nutrition, while other regions within the same country reported mild to moderate iodine deficiency. Because of the difficulties in quantifying iodine intake in dietary surveys, and as iodized salt is the main source of dietary iodine intake in many countries, 88 percentage households consuming inadequately iodized salt was used as proxy measure for iodine intake. Salt iodization data do however not take all dietary iodine sources into account, particularly the contribution of (iodized) salt in processed foods and dairy products that are important sources of iodine in many countries as well as iodine-rich ground water found in some regions. Nevertheless, the high prevalence of iodine deficiency in Ethiopia corresponds with the high number of (70%) of the households consuming inadequately iodized (<15 ppm) salt. Despite mandatory salt iodization in these 4 countries, household coverage rates of adequately iodized salt remain low especially in Ethiopia. 26
Fortification programs are implemented in African countries, and most countries are increasingly fortifying wheat and maize flour with iron, zinc, and folic acid, cooking oils and sugar with vitamin A, and salt with iodine. Nevertheless, the progress is made at different pace across countries, where for more than a decade Nigeria and South Africa has mandatory fortification of flour and oil (Nigeria only), Kenya has recently mandated fortifying the staples, and Ethiopia is in the planning phase. 89 With legislation on mandatory food fortification, the quality of fortified foods is not automatically guaranteed and compliance to legislation may be low. 90 Therefore, there is a need for strengthening and expanding these programs. Next to staples, fortification of commonly consumed foods such as cooking aids (bouillon cubes, condiments, and seasonings) and nutrition education to promote dietary diversification should be considered together with other programs such as micronutrient supplementation of vitamin A and iron; promotion of breast-feeding, safe water, sanitation, and hygiene interventions; and poverty alleviation. 91 –93 In addition, micronutrient nutrition of older children and adolescent girls, in particular, would need further investigation to identify effective programs to improve their micronutrient intake.
Nationally representative data on micronutrient status and intake are essential to guide the development of public health programs to improve micronutrient intake and to monitor the impact of national programs. Given the observed differences within countries (eg, VAD in South Africa), subnational data may strengthen national data. It is recommended, that in the future surveys should be conducted on a regular basis and include all age-groups, as our review indicates that both young and older children are vulnerable to micronutrient deficiencies.
Conclusion
In conclusion, the available data indicate that the prevalence of anemia, vitamin A, zinc, and iodine deficiencies are of public health significance in children living in Ethiopia, Kenya, Nigeria, and South Africa. Underlying these deficiencies are inadequate dietary intakes. These deficiencies and inadequate intakes may vary largely among different regions within the countries, which may not necessarily be revealed by national surveys only. National representative surveys, covering all age-groups, are needed to monitor micronutrient status and intake in African children and adolescents on a regular basis are however important. Micronutrient deficiencies seem to be more prevalent in children <5 years, but older children and adolescents also have inadequate micronutrient nutrition. Therefore, effective public health strategies are imperative to prevent micronutrient deficiencies to improve growth and development of children. These public health initiatives should focus on improving micronutrient intake of both children aged <5 years and older children (>5-19 years) through fortification of daily consumed and affordable food products as well as by stimulating dietary diversity.
Footnotes
Authors’ Note
R.H. and A.E. initiated the research design and did the data analysis and interpretation. All the authors contributed to data collection and to the writing of the manuscript.
Declaration of Conflicting Interests
The author(s) declared the following potential conflicts of interest with respect to the research, authorship, and/or publication of this article: R.H. and A.E. are employees of Unilever. Unilever sells food products globally including in African countries.
Funding
The author(s) received no financial support for the research, authorship, and/or publication of this article.
Supplemental Material
Supplementary material is available for this article online.
References
Supplementary Material
Please find the following supplemental material available below.
For Open Access articles published under a Creative Commons License, all supplemental material carries the same license as the article it is associated with.
For non-Open Access articles published, all supplemental material carries a non-exclusive license, and permission requests for re-use of supplemental material or any part of supplemental material shall be sent directly to the copyright owner as specified in the copyright notice associated with the article.