
Abstract
Background:
Acute malnutrition is linked to child mortality and morbidity. Community-Based Management of Acute Malnutrition (CMAM) programs can be instrumental in large-scale detection and treatment of undernutrition. The World Health Organization (WHO) 2006 weight-for-height/length tables are diagnostic tools available to screen for acute malnutrition. Frontline workers (FWs) in a CMAM program in Dharavi, Mumbai, were using CommCare, a mobile application, for monitoring and case management of children in combination with the paper-based WHO simplified tables. A strategy was undertaken to digitize the WHO tables into the CommCare application.
Objective:
To measure differences in diagnostic accuracy in community-based screening for acute malnutrition, by FWs, using a mobile-based solution.
Methods:
Twenty-seven FWs initially used the paper-based tables and then switched to an updated mobile application that included a nutritional grade calculator. Human error rates specifically associated with grade classification were calculated by comparison of the grade assigned by the FW to the grade each child should have received based on the same WHO tables. Cohen kappa coefficient, sensitivity and specificity rates were also calculated and compared for paper-based grade assignments and calculator grade assignments.
Results:
Comparing FWs (N = 14) who completed at least 40 screenings without and 40 with the calculator, the error rates were 5.5% and 0.7%, respectively (p < .0001). Interrater reliability (κ) increased to an almost perfect level (>.90), from .79 to .97, after switching to the mobile calculator. Sensitivity and specificity also improved significantly.
Conclusion:
The mobile calculator significantly reduces an important component of human error in using the WHO tables to assess acute malnutrition at the community level.
Keywords
Introduction
Background
Malnutrition remains a significant global health challenge, with nearly 20 million children younger than 5 years worldwide suffering from severe acute malnutrition (SAM). 1 Poor nutrition during the first years of life can result in repeated infectious diseases, decreased learning capacity, and increased risk of death. 2 A SAM nutritional grade (weight-for-height [WFH] z-score < −3 standard deviations [SD] from the median WFH of the World Health Organization [WHO] standard reference population) is a strong predictor of child mortality. 3 Prevalence of acute malnutrition >15% in a population is considered a situation of critical emergency. 4 In the informal settlements of Mumbai, Maharashtra, India, acute malnutrition rates were estimated to be 16.1% in 2005/2006. 5 More recent 2012 data on urban Maharashtra estimated acute malnutrition at 14.2% for children younger than 2 years. 6 International and national support for Community-based Management of Acute Malnutrition (CMAM) programs to treat acute malnutrition has grown, and large-scale programs are being implemented by governments and nongovernmental organizations. 7
Society for Nutrition Education and Health Action Aahar CMAM Program
Society for Nutrition Education and Health Action (SNEHA) is a Mumbai-based nonprofit invested in building viable urban communities by targeting maternal and child health-care providers and care seekers. SNEHA has been coordinating a CMAM program, Aahar, since 2012, covering a population of 300 000 in Dharavi, one of South Asia’s largest informal settlements. The program targets a child’s life from conception to age 3 and adopts a holistic approach through prevention and treatment to reduce the prevalence of acute malnutrition. The Aahar program works in partnership with the Government of India Integrated Child Development Services (ICDS) Scheme and the Municipal Corporation of Greater Mumbai Nutritional Rehabilitation and Research Centre at Lokmanya Tilak Municipal General Hospital. The Aahar CMAM approach involves early identification of malnutrition through identification of all pregnant women and children younger than 3 years, growth monitoring, home-based counseling on feeding and care practices, referrals to public health-care facilities, treatment of malnourished children through community-based medical screenings, and provision of antibiotics and Medical Nutrition Therapy (note 1), when indicated.
Aahar community health frontline workers (FWs) are the primary point of contact to caregivers and their children younger than 3 years. The FWs are responsible for building rapport with community members, motivating caregivers to participate in CMAM activities and working cooperatively with government health workers to conduct growth monitoring, counseling, referrals, and support access to treatment. Most FWs, typically women, in the program have completed 10th grade. The program covers 300 ICDS anganwadi (note 2) coverage areas, and each Aahar FW is responsible for the geographic coverage area of 3 anganwadi cluster areas, totaling approximately 150 to 180 children younger than 3 years per Aahar FW.
The FWs collect monitoring data to track women and children’s health and malnutrition status using Android smartphones and a mobile application called CommCare (Dimagi India, New Delhi, India). CommCare is a case management and data collection tool for community health workers used by FWs to compile longitudinal data records on each person tracked and to aid the program in prioritizing and monitoring health status of children and pregnant women. Information collected in the application is sent to a server over a cellular data or WiFi network. The data can then be downloaded from the server into MS-Excel for reporting and analysis. Due to high network coverage within Mumbai, CommCare has been an optimal FW job aid tool for child health surveillance. The CommCare application used by the FWs was specifically configured for the Aahar program and contains a variety of forms that are used during different interactions such as screening, follow-up, and referral.
Every household in the anganwadi cluster area is visited by FWs to identify and screen children and pregnant women. The FWs use the screening questionnaire form in CommCare to document acute malnutrition levels, collect socioeconomic information, track illnesses or complications, and measure key hygiene and feeding practices. In collaboration with ICDS staff, Aahar FWs aim to monitor the growth of every child on a monthly basis, track recovery for malnourished children, and ensure preventative counseling for at-risk or faltering children. Aahar FWs and ICDS anganwadi staff typically cover children in 1 anganwadi coverage area in 1 to 2 days—this could involve weighing and assessing up to 60 children in a half-day growth monitoring session.
Objectives
A commission formed by The Lancet and Imperial College London, United Kingdom, to study technologies in global health highlighted that “frugal technologies” designed to meet the needs of the poorest are needed. They noted the potential of m-Health for improved “collection of health-care information, provision of mobile diagnostic tests, and encouragement of healthy behaviors” but emphasized that there is still a lack of evidence on the contribution of m-Health innovations. 8 This study aims to fill this lacuna by adding to the body of knowledge on how use of technology could potentially transform public health practice.
The use of mobile phones to collect basic data and adhere to treatment protocols was successfully adopted by the FWs in the Aahar program. Feedback from FWs and their supervisors indicated that they were interested in further automation of processes to help minimize mistakes made by FWs in assessing malnutrition grades at the community level. In 2013, one strategy proposed by the implementation team to minimize human errors was to automate the process of calculation of nutritional grades. The objective of this study is to measure differences in diagnostic accuracy in community-based screening for acute malnutrition using a mobile-based solution.
Screening for Acute Malnutrition
Accurate identification of children with acute malnutrition by FWs is a challenge faced globally by organizations conducting growth-monitoring activities. 9 Screening tools that can be easily implemented by FWs, and that require minimal training and equipment, are needed for immediate and accurate assessment of acute malnutrition.
The recommended diagnostic criteria for SAM in children include WFH, mid-upper arm circumference (MUAC), or bilateral edema. 10 A growing body of research indicates that WFH and MUAC actually identify very different subgroups of children, with little overlap. 11 –13 During the pilot phase, the Aahar program explored using both MUAC and WFH and also found there to be very little overlap in children identified as malnourished using both methods. Using the recommended MUAC cut off of <115 mm, it identified very few children for referral as compared with WFH < −3 SD. These results remained consistent after repeated FW training on measuring MUAC with United Nations International Children’s Emergency Fund (UNICEF) support.
Using a combination of WFH and MUAC criterion in CMAM programs increases logistical complexity in admission and discharge processes and additional measurement burden without clear additional value in identifying vulnerable children, 9,14 particularly in the Aahar program’s specific context of a non-emergency setting with high levels of stunting. 15 Apart from the quantitative review of MUAC and WFH data from the Aahar program, focus group discussions were conducted to understand FWs’ own experience of measuring children using both methods. The discussions included negative and positive personal experiences of those involved in overseeing and/or conducting these measurements when screening and monitoring children. Preliminary analysis indicated that the FWs faced specific difficulties in using both MUAC and WFH. Challenges in using MUAC included difficulty in locating the mid-upper arm point, lack of familiarity of the caregivers with MUAC measurements, and the fact that MUAC is not recommended by the WHO for children younger than 6 months, a critical target group in the Aahar program. 16 The FWs indicated it was easier for the caregiver to detect and understand increases in weight and height than arm measurements. On the other hand, calibration of the weighing machines, finding a flat surface in the informal settlements to place the machines, and difficulty in taking measurements of a crying child were some of the challenges reported in WFH measurements. Keeping these considerations in mind, the Aahar program, in consultation with its government partners, chose to continue with WFH as the single criteria for admission and discharge.
In the Aahar program, assessment of acute malnutrition levels using WFH is conducted in real time by FWs using the 2006 WHO Child Growth Standards simplified field tables. 17 Using the field tables, FWs categorize the children for 3 different acute malnutrition grades, as normal, experiencing moderate acute malnutrition (MAM), or SAM in the CommCare mobile application. The paper-based field tables require the FW to do a manual look-up on 4 possible tables to assess the nutritional grade of a child based on his or her gender and age. Figure 1 provides a snapshot of a simplified WHO field table. For each child weighed, the FW has to select the appropriate table according to their gender and whether they are younger or older than 2 years. After rounding the child’s height or length to the nearest 0.5, they look up the z-score of the child on the chart and then determine whether the child falls into SAM, MAM, or normal category.
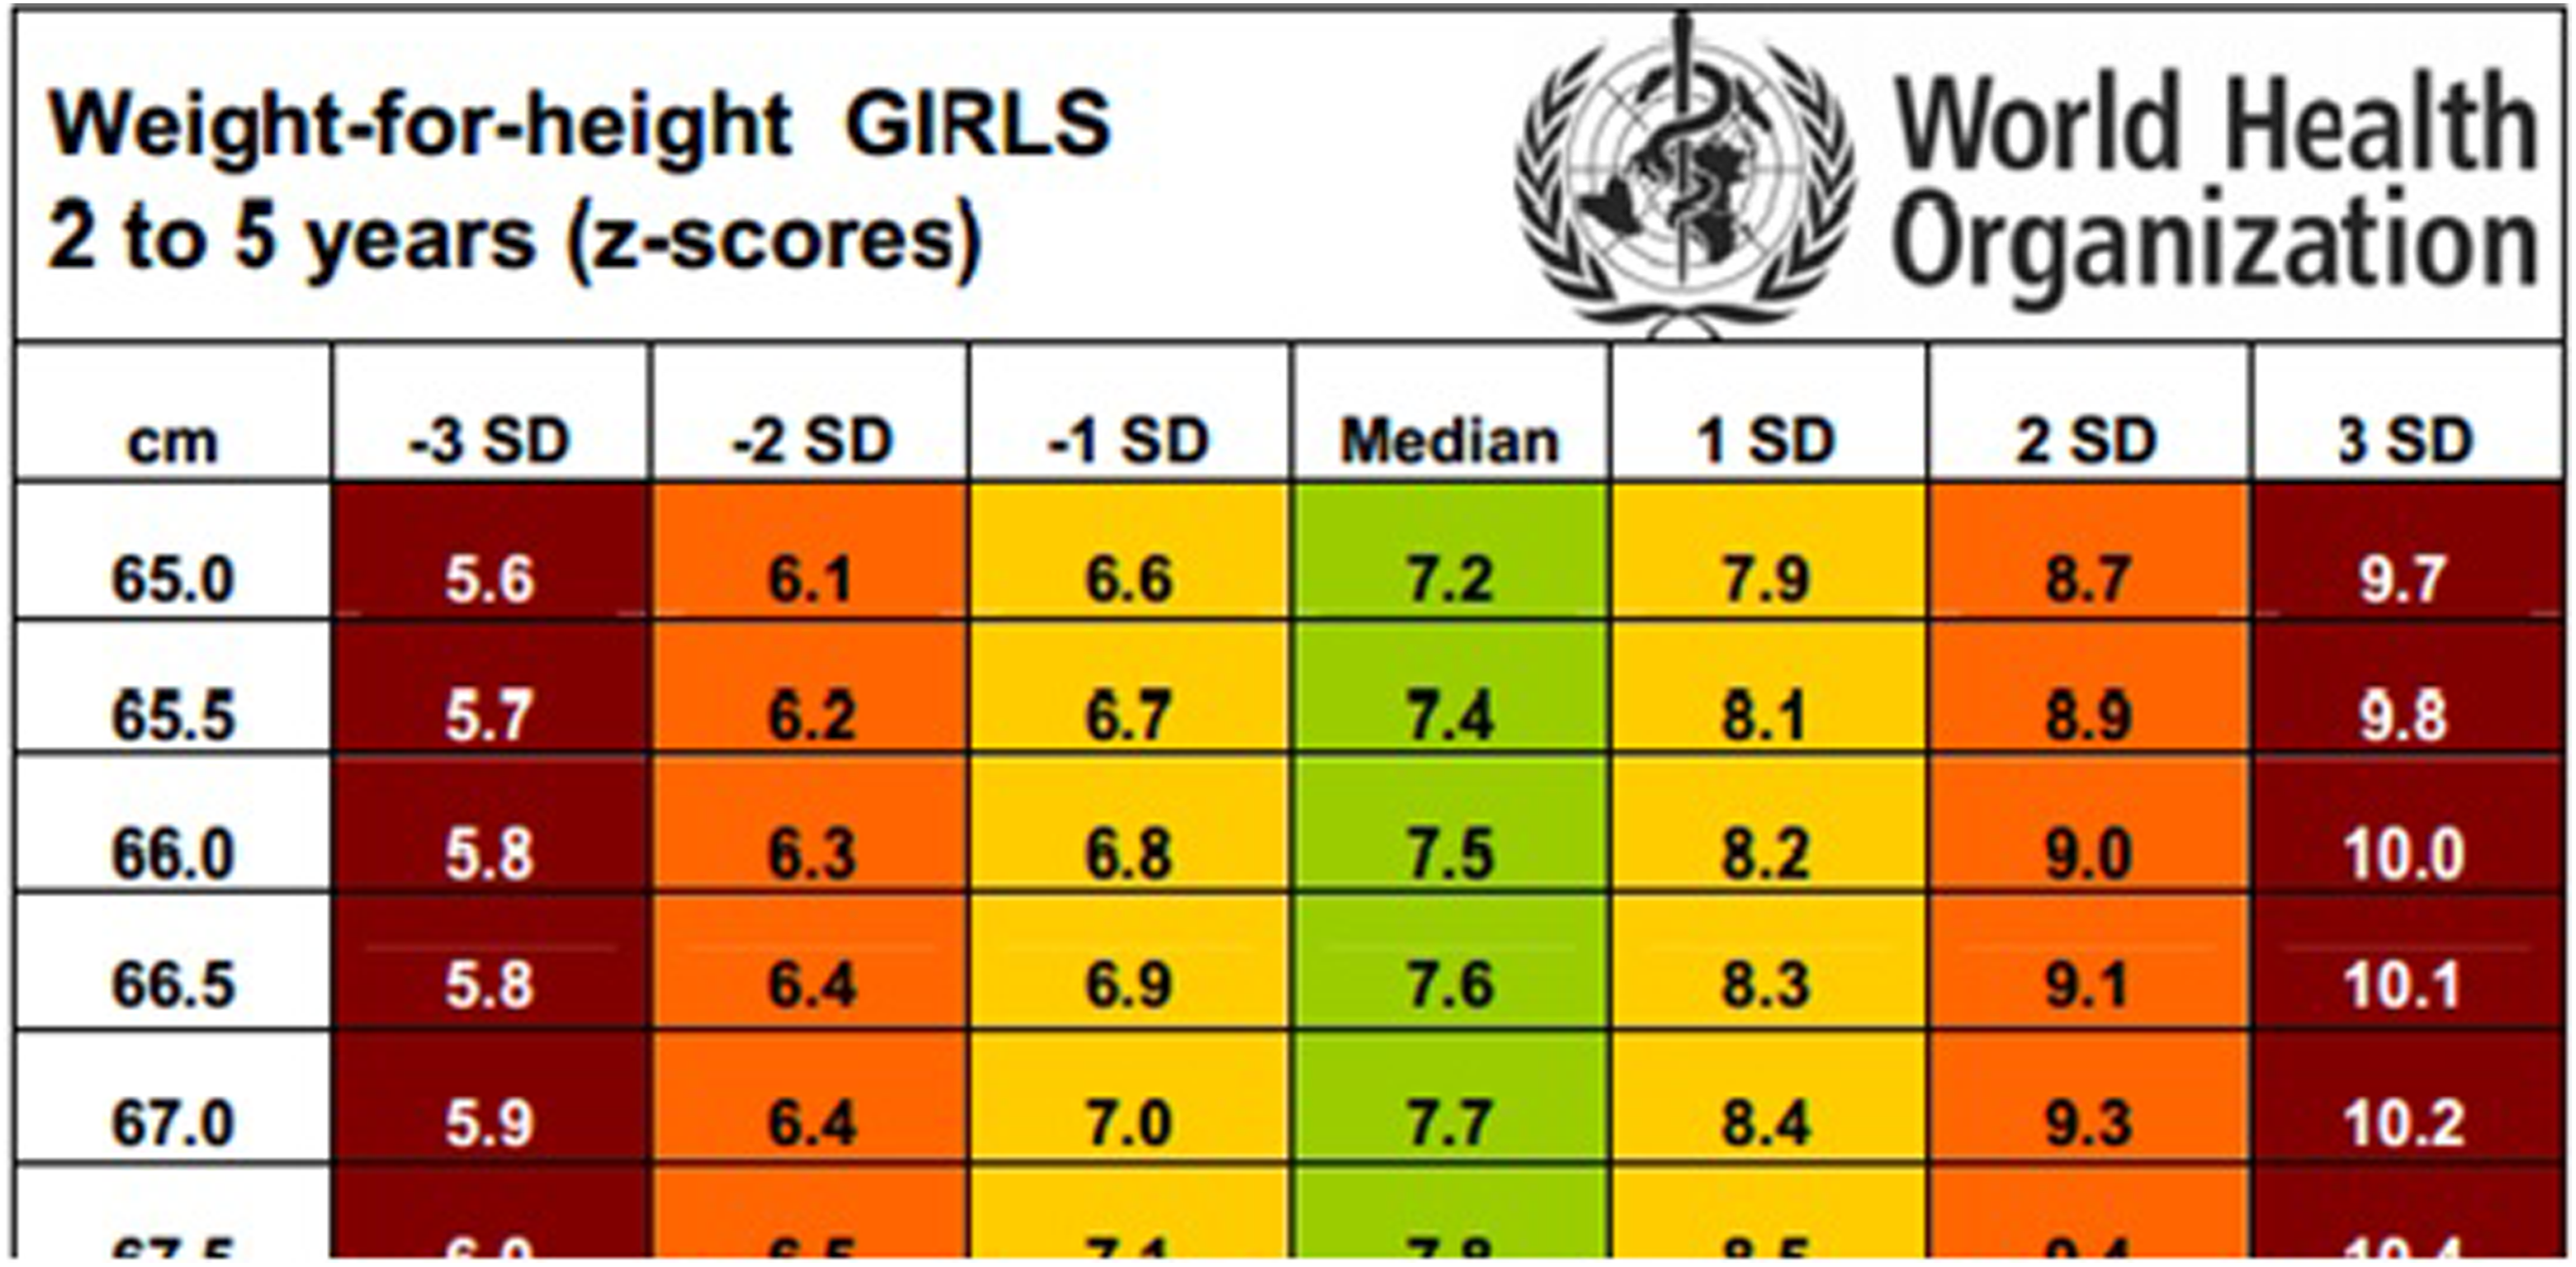
Example of World Health Organization (WHO) simplified field table used by frontline worker (FW).
Design of Mobile Calculator
In developing the mobile nutritional grade calculator, the program considered including exact WFH z-score estimations through the formula 18 or the more precise expanded WHO tables that provide z-score look-ups for heights rounded to 0.1 cm, 17 as compared with 0.5 cm in the simplified field tables.
The approach to continue with the simplified tables was taken because the CommCare platform, at the time, did not support calculations of such high precision. The CommCare application used the simplified WHO weight-for-length tables for boys and girls, with a 0.7 cm correction subtracted if height was taken instead of length. 19 The screenshots in Figure 2 detail the steps the FWs take to compute the grade using the nutritional grade calculator in the mobile application.
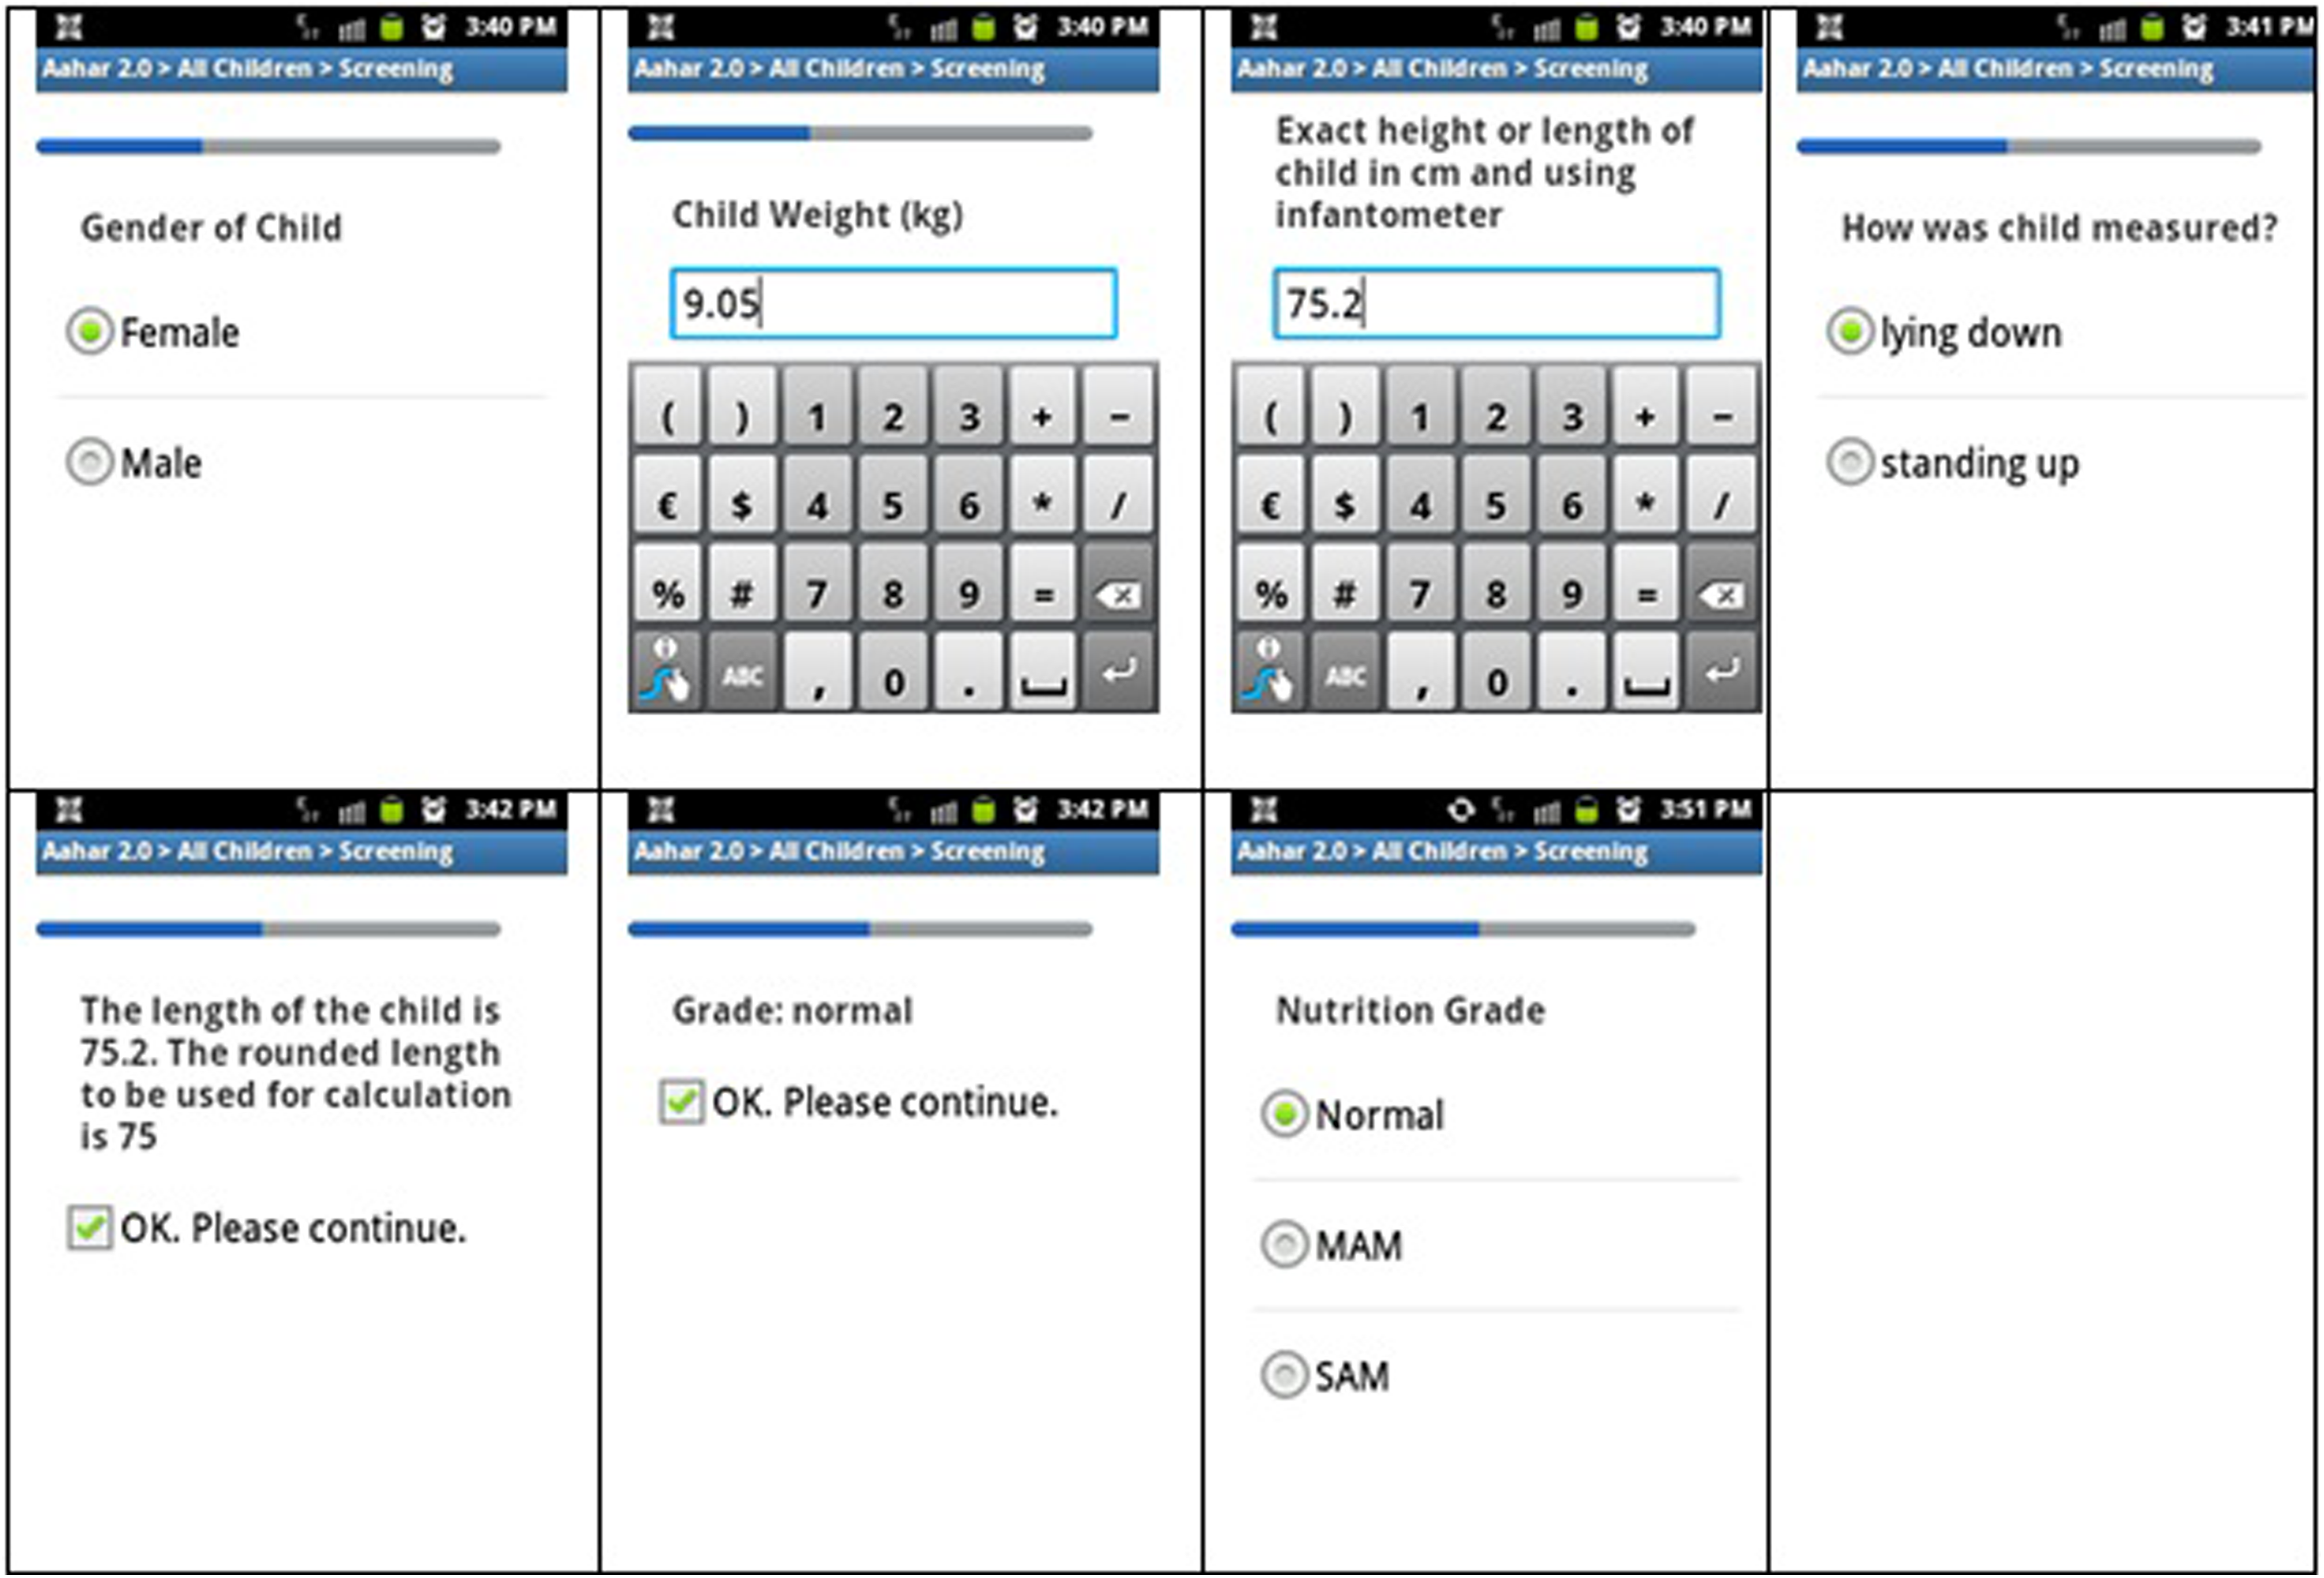
Nutrition grade calculator screen shots.
Errors in WFH Anthropometric Assessment
Table 1 outlines the specific steps in the measurement process that could contribute to human error in assessment of acute malnutrition. For each step, the table specifies whether this error can occur in the conventional paper method and/or the mobile application and what are the potential sources of human error for that particular step.
FW takes weight and height/length measurements: Step 1 errors are the first source of potential error in assessment of acute malnutrition using WFH. The FWs and their supervisors adhere to a strict protocol and checklist for conducting anthropometry which includes detailed instructions on calibration of electronic weighing scales, clothes and jewelry removal for all children, and location and equipment to be utilized. Once the monthly weighing dates are set with ICDS staff, the venues for conducting the anthropometry are confirmed and approved by supervisors in advance. Bubble levels (Freemans Measures Pvt Ltd, Punjab, India) are used to verify that each weighing location is flat. All anthropometry is completed by pairs of FWs with assistance from the ICDS staff and/or the caregivers. Children younger than 2 years of age lie or sit on an electronic baby weighing scale (Nitiraj Engineers Pvt Ltd, Maharashtra, India) and their lengths are measured on an infantometer (Meditrin Instruments Pvt Ltd, Maharashtra, India). All children older than 2 years of age are weighed on an adult mechanical weighing scale, and their heights are measured using a measuring tape. The FWs use a wooden triangle to assist in marking the height with a pencil when using a measuring tape, and extra batteries are carried by the FWs for the electronic scale. The FWs must confirm that the scale is at zero prior to the weighing of each child. Intensive and regular refresher training on measuring WFH along with random cross-checking by supervisors is built into the program to minimize errors. Any human error occurring in measuring height, weight, or length would be present in both the conventional method and the mobile nutritional grade calculator.
FW records weight and height/length and enters into mobile device: Step 2 errors are any human error made in the process of recording data. One FW reads the measurements out to the other FW who writes the measurements down on a specific format. After completing all the measurements, the FW then enters the data into the mobile. The FWs occasionally reverse digits or misplace decimal points when recording data either on paper or into the mobile. These are errors are also present in both the conventional method and the mobile nutritional grade calculator.
FW uses paper-based field table to calculate grade: Step 3 errors occur when FWs incorrectly conduct the manual look-up from the set of 4 paper-based WHO tables, based on gender and age. An FW can incorrectly select the wrong table to conduct the look-up, such as using the girls’ table when measuring a boy or using the length table when they are actually measuring the child’s height. They also can incorrectly round the height, length, or weight as required for an accurate look-up. Even with the correct parameters for conducting the look-up, a FW might still look at the wrong column on the field table.
Step 4 (FW selects grade of child in the mobile device) Errors in selecting the wrong grade of a child can occur if the FW selects the wrong button on the screen. This can be a simple mistake in accidentally manually selecting the wrong button on the screen and can happen when using either the paper-based tables or the mobile calculator. The FW may also select the wrong grade if the child’s anthropometry falls out of the range of the WHO field tables. This typically happens when an infant is below 45 cm min length, as the program also screens for children younger than 6 months of age. The 45-cm lower limit is set to cover children who are normal WFH at birth, 19 so the FWs have been trained to categorize an infant younger than 45 cm as SAM at the time of anthropometry.
Possible Types of Human Error for Identification of Acute Malnutrition.
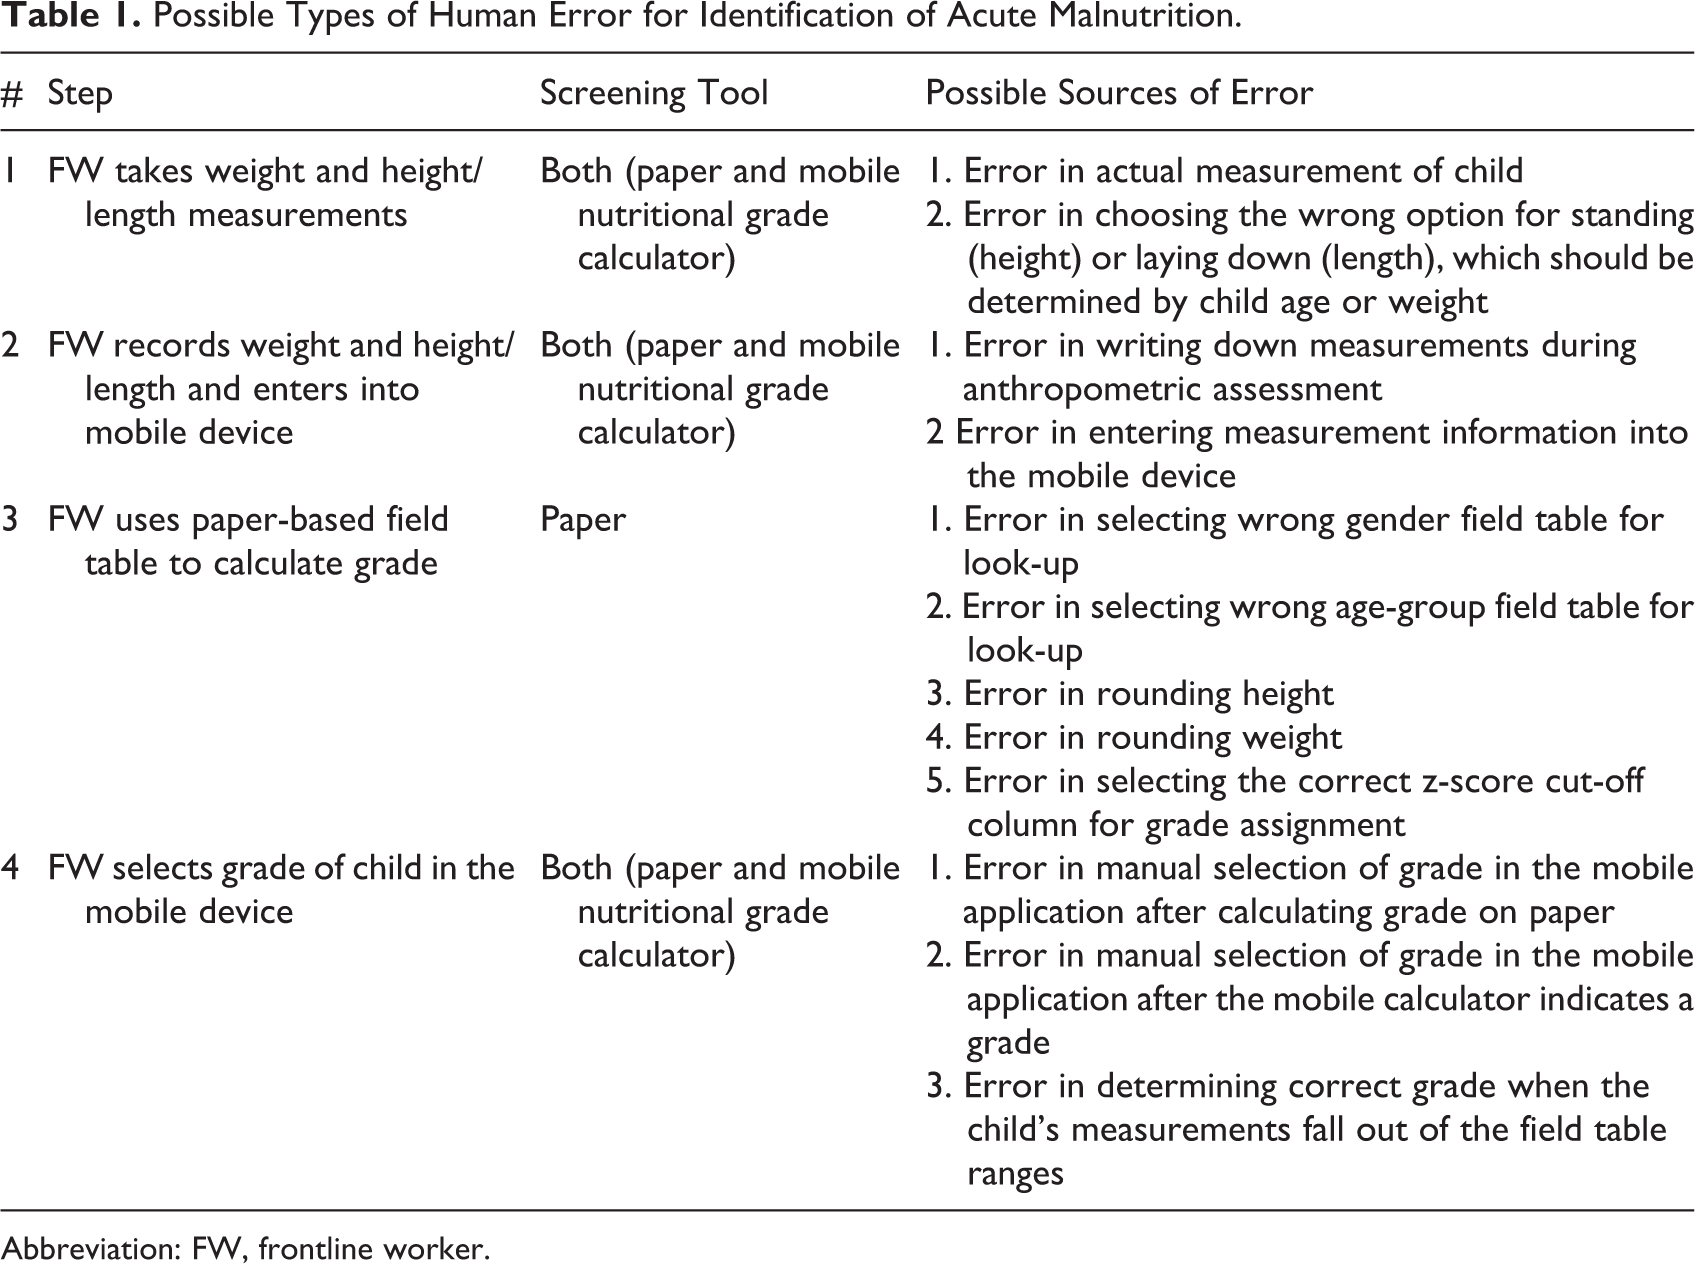
Abbreviation: FW, frontline worker.
Of the 4 types of errors, removing step 3 errors by automating the calculation of nutritional grades was the optimal technology solution for the current mobile application. The CommCare mobile application had already incorporated typical electronic data entry validation techniques that prevent entry of measurement outliers and inform FWs with error messages when they enter out-of-range measurements. These steps likely reduce both step 1 and step 2 errors, but correction of these measurement errors substantially was not technically feasible in the mobile application.
Methods
This study is part of an operations research framework intended to test out a strategy to reduce 1 critical FW human error component in diagnosing acute malnutrition using the WHO-simplified WFH field tables. The study aims to measure differences in error rates, interrater reliability, sensitivity, and specificity after switching from the conventional paper-based field tables to a mobile nutritional grade calculator based on the same tables. Since the study compares human error differences in 2 diagnostic tools designed specifically for immediate diagnosis in a community setting, the grades estimated by the WHO-simplified field tables are the “gold standard.”
Statistical Tests
The screening data collected by the FWs along with the malnutrition grades calculated in MS-Excel for this study were imported into STATA version 12 (StataCorp LP, College Station, Texas) for testing differences in error, sensitivity, and specificity rates using the Pearson chi-square. The Cohen κ statistics, which measures interrater reliability, are also calculated using STATA. The statistical methodology is based on a similar study comparing a paper-based nutrition environment survey to a digitized version in a mobile application. 20 Sensitivity is estimated as the proportion of children who were either SAM or MAM according to the imported field tables calculated for the study, who were correctly identified as either SAM or MAM, using either the paper-based tables or the mobile calculator. Specificity is estimated as the proportion of children who were normal according to the study-calculated grades and who were correctly identified as normal using either the paper-based tables or the calculator.
Study Procedures
Between August and October 2014, the Aahar program expanded into 3 new areas of Dharavi; the new area covered a total population estimated at 90 000 and 90 ICDS anganwadi cluster areas. All 27 FWs assigned to cover these 3 new regions were included in the study and informed that they would initially use the WHO paper field tables for assessing acute malnutrition. All 27 FWs were trained on how to use the simplified WHO field tables and initially provided the CommCare mobile application without the mobile nutritional grade calculator. Some FWs had previous experience with using the field tables, and all had previous experience conducting anthropometry for children younger than 3 years. Experienced FWs were typically paired with new FWs for the screening activities. The FWs were instructed to select the nutritional status of the child in the mobiles after using the paper-based simplified WHO field tables. After approximately 1 month of screening using the conventional method, the nutritional grade calculator was embedded into the mobile application with no other changes. No additional training was required for using the mobile nutritional grade calculator. The FWs were informed that the CommCare application would now suggest a malnutrition grade (see Figure 2) and that they no longer should use the paper tables to do a nutritional grade assessment. The FWs would still need to select the grade of the child after the calculator suggested a grade based on anthropometric inputs.
Calculation of Errors
The WHO simplified field tables and measurement data collected by FWs are imported into MS-Excel. Using look-up functions, the nutritional grades that should have been assigned to the child by the FW can be calculated for each child using their sex, date of birth, and anthropometry and the imported WHO simplified field tables. The grade that the FW assigned for each child in the field can then be checked against the grade calculated in the MS-Excel analysis and marked as an error if not the same grade. These errors are used to quantify the combined step 3 and 4 error rates.
Step 3 and 4 error rates during each screening period are compared to measure the reduction in error after removing the step 3 errors, by no longer requiring the FWs to manually look-up the nutritional grade using the conventional field tables. The only error component that is easily measurable after switching to the calculator are the errors related to step 4, manually selecting the grade on the mobile device.
All 27 FWs did not conduct an equal number of screenings prior to and after the inclusion of the calculator due to timing of when certain anganwadis would begin intervention. In order to adjust for bias due to unequal screening levels by individual FWs, our analysis also limits the screening data to FWs who completed at least 40 screenings conventionally and at least 40 screenings with the mobile nutritional grade calculator. This analysis compares step 3 and 4 error rates from their last 40 screenings completed conventionally to the next 40 screenings that they conducted with the inclusion of the mobile calculator.
Ethical Approval
Data presented are part of program implementation data and not collected for the sole purpose of research, so informed consent was not required. Use of the intervention data for a study on the benefits of the nutritional grade calculator was approved by the Bandra Holy Family Medical Research Society, Mumbai.
Results
Table 2 demonstrates that the combined step 3 and 4 human error rate when using the WHO simplified paper-based field tables was 6.5% or 95 errors of 1454 screenings of children younger than 3 years of age. After switching to the mobile nutritional grade calculator, this error rate fell to 0.8% or 13 of 1586 screenings of children younger than 3 years. As the mobile calculator removes human error from only step 3, the remaining errors (0.8%) are from step 4, when the FW manually selects the nutritional grade button on the screen.
Child Screenings Between August and October 2014 (27 FWs).
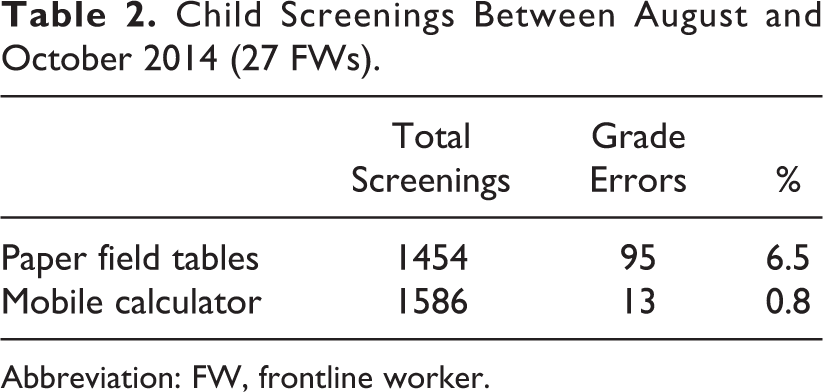
Abbreviation: FW, frontline worker.
Table 3 limits the screening data to 14 FWs who completed at least 40 screenings using both the methods. For this group, the overall step 3 and 4 error rate reduced from 5.5%, or 31 of 560 screenings of children younger than 3 years to 0.7% (p < .0001) or 4 of 560 screenings of children younger than 3 years. The remaining 0.7% of errors can be attributed to step 4 errors. The range of individual FW step 3 and 4 errors using the paper tables is from 0% to 17.5%, and the range of only step 4 errors when using the mobile nutritional grade calculator is 0% to 5%.
Average Error Rates for FWs With 40 Pre/Post-Mobile Nutritional Grade Calculator Screenings (14 FWs).
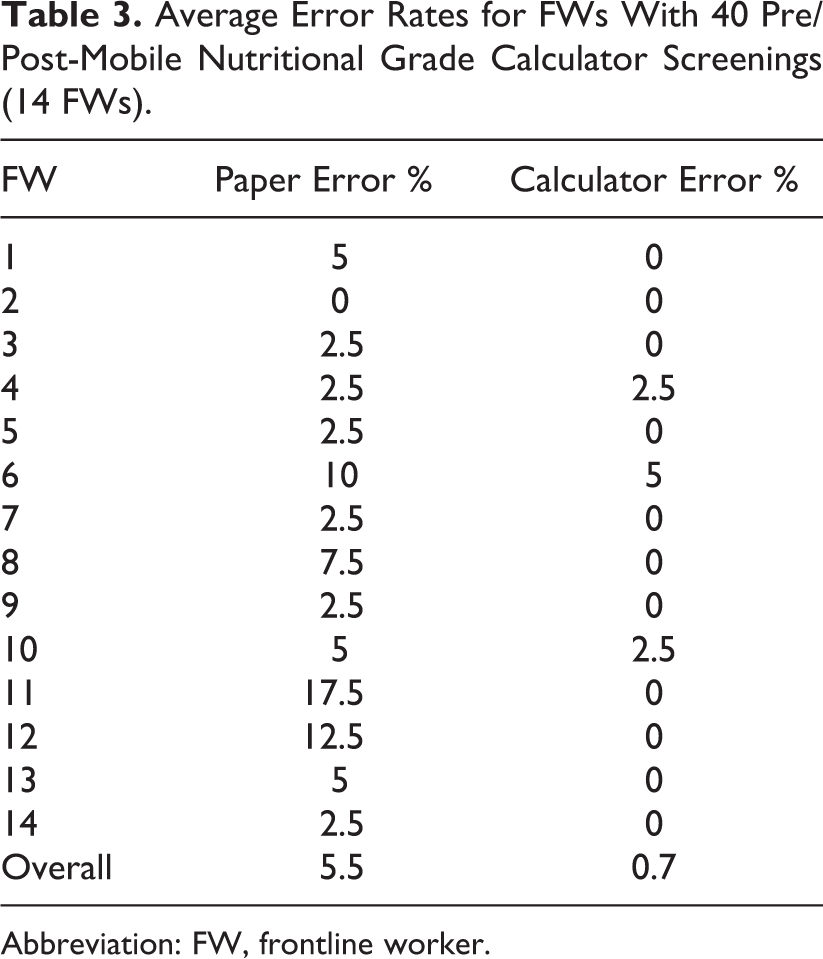
Abbreviation: FW, frontline worker.
Table 4 presents the interrater reliability (κ) statistic, sensitivity, and specificity estimations for the restricted data set, with the 14 FWs who completed at least 40 screenings using both methods. Kappa estimates increase from .79 to .97 after inclusion of the mobile calculator. The sensitivity rate for diagnosis of SAM increased from 0.79 to 1 (p < .05). Similarly positive and significant increases in sensitivity for MAM diagnosis and specificity rates are observed.
Comparison of Cohen Kappa Statistics, Sensitivity, and Specificity Rates for 40 Pre/Post Screenings (14 FWs).
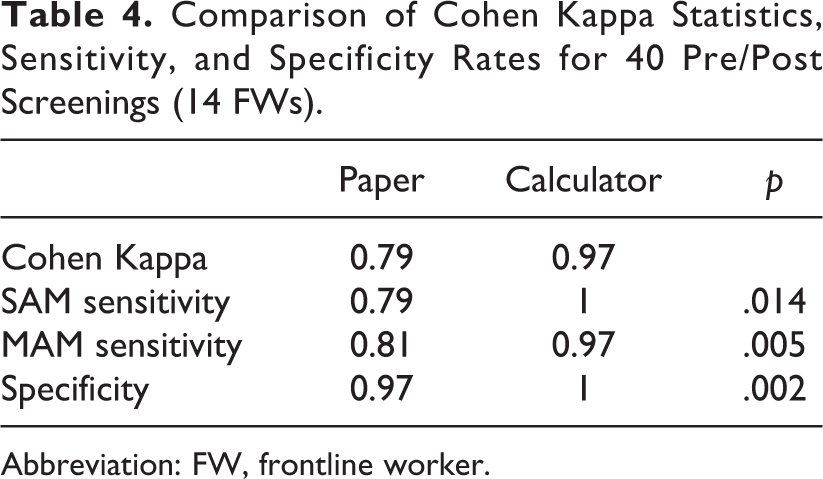
Abbreviation: FW, frontline worker.
Discussion
The strategy of digitizing the WHO tables into a mobile nutritional grade calculator significantly reduced the error rate in assessing acute malnutrition at the field level by approximately 5%. The κ measure of agreement rose from a level that is considered “substantial” to “almost perfect” according to common interpretation. 21 The significant increase in sensitivity for SAM detection is particularly important for the program’s capacity to immediately refer and treat the most vulnerable children in the community. The mobile calculator also reduces the variability in error rates across community health workers. The poorest performing FWs using the paper tables went on to perform at the same level as other FWs once the calculator was included in the mobile application.
The implications for small improvements in diagnostic accuracy are not trivial in contexts where organizations are trying to reach out to large numbers of the poorest and most vulnerable children. As of October 2014, the Aahar program had screened over 20 000 children and regularly monitored the growth of at least 15 000 of those children. Baseline figures for the intervention area indicated acute malnutrition levels of approximately 18%. In just the Aahar screening activity, this improvement would likely have affected the initial screenings of up to 1000 children younger than 3 years.
The role of the FW in contributing to child survival through large-scale community health programs is dependent on FWs achieving and maintaining high-quality performance. 22 Systematic reviews of m-Health project evaluations suggest that maternal and child health evaluations typically report improved process efficiencies and better compliance with standards of care, but there still remains an evidence gap in evaluating large-scale implementations and outcomes that specifically measure FW performance. 23 –25 A pilot evaluation of RapidSMS in Malawi, an m-Health text messaging application to improve child malnutrition surveillance, noted that real-time automated calculations of WFH was an empowering component of the mobile tool for the FWs. 26 Reviews of innovative technologies in nutritional epidemiological studies have called for more research to explore the validity of innovations beyond cost-effectiveness, data collection efficiencies, and labor reduction. 27 Beyond the recognized benefits of moving from paper to electronic systems, this study measures whether a technological innovation can also improve the underlying methodology of a conventional diagnostic process used by FWs in a community setting.
The calculator was embedded during a scaling out of the program and not during a pilot, reinforcing the applicability of the innovation for child health programs aiming to cover large populations. The calculator can be easily adopted by other child health programs; the structure has been shared through an application sharing community and to date has been downloaded by other organizations over 100 times. 28
Within just the state of Maharashtra, there are over 88 000 such anganwadis. 29 A recent audit of ICDS highlighted the negative finding that the nutritional grades of children were not adequately based on the WHO Growth Standards. 30 Digitizing growth-monitoring processes and facilitating access of that data by all levels of governance can play a role in building accountability.
The calculator also demonstrates successful collaboration in developing technological innovations that directly respond to the context, the problem, and the needs of users of the technology. m-Health project designs are frequently designed with inadequate input from users. 24 The innovation was developed in response to a feedback from the FWs and their supervisors. Thus, it was easily adopted with immediate improvements in diagnosing malnutrition at the field level.
Limitations
Due to the case series (uncontrolled longitudinal) design of the intervention, FWs may have continued to improve their performance with the paper-based field tables over time. However, experience from pilot areas of the Aahar program, where the conventional field tables were used for more than 1 year, suggests that the error rates encountered during the first month would not have improved substantially. Despite repeated training on the use of the field tables, the step 3 and 4 human errors made in using the field tables remained consistent.
The scope of this study is to address only the mitigation of human errors when using the simplified WHO WFH field tables for assessment of acute malnutrition. We do not compare classification errors to exact z-score calculations or the more precise expanded WHO growth chart tables, as the study is only intended to compare two field methods for screening for acute malnutrition.
Switching to the calculator effectively removes only step 3 errors from Table 1 as part of the anthropometric process. The study neither measures nor studies the impact of any strategies to reduce step 1 and 2 errors, a subject that needs further research for more effective CMAM implementation.
Conclusion
The WHO field tables are used globally to assess acute malnutrition, so an innovation to improve this particular method in community settings is significant. While the nutritional grade calculator does not correct for all possible types of human error, it reduces one of the key human errors leading to incorrect diagnosis. In large-scale public health interventions, such as CMAM, programmatic success hinges on implementation by the FWs. Successful pilots can subsequently suffer from training quality and appropriate supervision during expansion. CMAM programs using a technological innovation such as the mobile nutritional calculator can grow with greater confidence that children are being screened correctly. Continual effort should be made to make the FW implementation experience less complicated, and developing the mobile nutritional grade calculator is one such effort.
Footnotes
Acknowledgment
We thank the families and caregivers in Dharavi who made the study possible through their participation in the Aahar program. We thank SNEHA and the Aahar team, including all the FWs for data collection and screening of children, and the program officers, coordinators, and program directors for their supervision and willingness to coordinate program operations with our study. We are thankful for the support of the current leadership of the Aahar program, Anagha Waingankar and Neena Shah More. We are thankful to Monica Gagnon, Proshant Chakraborty, and SNEHA colleagues in the SNEHA Research Group for their inputs and support. We are thankful to the funders of the Aahar program. Finally, we thank the Integrated Child Development Services Scheme staff and The Municipal Corporation of Greater Mumbai for their partnership.
Declaration of Conflicting Interests
The author(s) declared the following potential conflicts of interest with respect to the research, authorship, and/or publication of this article: The co-author JW is an employee of Dimagi which develops the CommCare mobile application.
Funding
The author(s) disclosed receipt of the following financial support for the research, authorship, and/or publication of this article: The Aahar program is funded by The Impact Foundation, India; Comic Relief, UK; Maitri Trust, UK; Breadsticks Foundation, UK; and HDFC Bank, India.