
Abstract
Background:
Poverty and food insecurity are intrinsically linked as poor households often lack the resources required to access sufficient nutritious food to live an active and healthy life. Consumption and expenditure surveys are typically used to identify poor versus nonpoor households but are detailed and costly. Measures of wealth based on asset ownership and housing characteristics can be generated from lighter, less costly surveys.
Objective:
To examine whether indices based on asset ownership and housing characteristics (stock) complement household consumption (flow) when used to analyze inequalities in food security outcomes.
Methods:
Comprehensive data from Nepal, Malawi, Tanzania, Uganda, and Madagascar are used to examine correlations and overlaps in classification between indices of household wealth and consumption per capita. Inequality in food security indicators representing quantity, quality, and vulnerability is examined across wealth and consumption per capita quintiles.
Results:
Wealth indices are correlated with consumption per capita, with coefficients between 0.5 and 0.6. The prevalence of food insecurity decreases from poorer to wealthier quintiles for all variables and for all food security measures in all countries. Energy deficiency varies much more across consumption quintiles than wealth index quintiles. Interestingly, inequalities in the share of consumption of food are more pronounced across the wealth index quintiles than per capita consumption.
Conclusion:
Although wealth indices and consumption per capita are related and both are drivers of food security, they cannot be used interchangeably for food security analysis. Each inequality measure is important for describing different aspects of food security.
Introduction
A root cause of food insecurity is poverty as poor households lack the resources required to access sufficient nutritious food to live a healthy active life. Poor households also usually lack a financial buffer to protect them from shocks such as illness or crop failure. Measures of income and wealth and subsequent classification of poor households are therefore key factors to capture in food security analysis. Poverty classification is a key measure required for the design and subsequent evaluation of policies and programs aimed at reducing food insecurity essential for targeting households. However, capturing adequate measures of income and wealth is a difficult task, particularly in light surveys. Further, different aspects of economic welfare may be more important determinants of varying facets of household food security. An understanding of the relationship between various poverty measures and various food security indicators is therefore of high importance for the design of programs and their subsequent evaluation. Specifically, poverty measures based on “flows” such as household consumption and poverty measures based on “stocks” such as an asset-based wealth index (WI) must be understood within the conceptual framework of food security in order to appropriately inform policies and programs. This article examines which poverty measures are most appropriate for related food security indicators and the extent to which these measures may be substituted for one another in the context of limited resources available for in-depth consumption expenditure surveys.
In assessments based on household consumption and expenditure surveys (HCES), the main indicator for welfare is the consumption aggregate, 1 here used interchangeably with consumption per capita. The consumption aggregate is based on the value of all consumption (food and nonfood) in the household within a specific recall period. In developing countries, consumption is often preferred over income as a measure of welfare because it is considered more stable, allows for consumption smoothing, and is considered less subject to respondent bias than income. However, collecting detailed information on consumption and expenditure is complex and expensive. As such, HCES surveys are typically undertaken every 3 to 5 years. In the absence of extensive consumption and expenditure surveys, alternative measures of economic well-being and inequality are often based on a household’s ownership of assets and quality of housing. A commonly used approach is the calculation of a WI, developed and used by Filmer and Pritchett. 2 This approach assigns weights to asset ownership and housing characteristics based on principal component analysis (PCA). The WI is then used to rank households into wealth quintiles and used as a background variable for analysis of multiple indicators. The WI and its quintiles are standard variables used in Demographic and Health Surveys, Multiple Indicator Cluster Surveys, and most United Nations World Food Programme surveys.
As the WI is constructed from asset ownership variables, it can be interpreted as a reflection of a household’s “stocks” and therefore describes the extent to which a household has some protection from the shocks it may face. The consumption aggregate, on the other hand, measures current consumption and is a better indicator of the economic dimension of flow. Thus, in addition to the practical advantages of lower costs and greater ease in obtaining data, there is a conceptual rationale for using an asset-based approach for assessing wealth instead of a consumption-based measure. 2 –5 Filmer and Pritchett 2 propose that the WI be seen as a measurement of household wealth in the longer term. Sahn and Stifel 3 have illustrated that an asset index is able to proxy long-term wealth with less error than consumption.
The stock/flow distinction is a useful simplification. However, in theory, a household’s consumption is a function of its physical and nonphysical assets, and the 2 are expected to be highly correlated. Therefore and since there is no gold standard measurement of long-term wealth, Filmer and Pritchett 2 assessed the WI against the per capita consumption aggregate with the rationale that the “current” standard of living, at least to some extent, is a proxy for long-term wealth. Studies examining the relationship between wealth indices and consumption per capita have shown mixed results. For example, in an 11-country case study, 5 wealth indices constructed using the PCA approach and using a simple asset count have shown a moderate to strong relationship with consumption per capita. However, a study by Howe et al, 6 (p. 871) based on a desk review of 36 data sets, is more pessimistic and concludes: “the wealth index is mostly a poor proxy for consumption expenditure”.
Although the relationship between wealth indices and consumption per capita has been variable, their relationship with other variables of interest has been more positive. Wealth indices based on asset ownership have been shown to map inequalities in school enrollment rates and child malnutrition at similar rates to the consumption aggregate. 2,7 Filmer and Scott 5 found the inequalities in education, health-care use, fertility, child mortality, and labor market outcomes to be “remarkably robust” to the specific economic status measure used.
Surveys on household food access are often implemented in response to emergencies or as part of monitoring systems that require light survey tools in order to provide quick results. In this context, the inclusion of detailed consumption expenditure modules is usually not feasible, and subsequently, the ability to describe the “flow” aspect of economic status is limited. However, light surveys can still be used to analyze wealth from a “stock” perspective. From a light survey module on asset ownership and housing characteristics, wealth indices can be created—a PCA-derived index or a simple asset count.
Food security itself is a multidimensional concept requiring multiple measures to describe different components. The most common definition of food security from the 1996 World Food Summit states that “Food security … [is achieved] when all people, at all times, have physical and economic access to sufficient, safe, and nutritious food to meet their dietary needs and food preferences for an active and healthy life.” 8 This definition highlights that household food security status can be described in terms of the household’s ability to access sufficient quantities of food and sufficient quality of food. Further, this definition notes that a state of food security requires household food access to be stable over time.
This study focuses on how 2 approaches for measuring economic status—an asset ownership approach and a consumption approach—differ in their ability to explain food security outcomes in terms of quantity, quality, and stability of food security. If one measure of economic status is found to be a more important determinant of household food access than the other, it would be a useful and pragmatic finding that can further refine information needs in food security assessments.
Further, this study examines the extent to which household rankings based on wealth indices constructed from asset ownership and housing qualities match with household rankings based on a comprehensive consumption aggregate. For the asset ownership approach, 2 types of wealth indices are compared: a PCA-derived WI and a simple asset count. This component of the study adds evidence to the existing literature, which examines whether asset- and consumption-based indices can be used interchangeably and whether some of these indices yield better results than others, specifically seeking to understand whether a simple, transparent asset count can sufficiently be used as a substitute for a more complex PCA-derived index.
The analysis is based on 5 Living Standard Measurement Surveys (LSMS); these surveys are useful for our research because they can be used to construct consumption aggregates along with various household-level wealth and food security indicators.
Data and Methodology
Data
The analysis relies on survey data from the Malawi Integrated Household Survey 2010/2011, Nepal Living Standard Survey 2010/2011, Uganda National Panel Survey 2009/2010, Tanzania National Panel Survey 2010/2011, and the Madagascar National Survey on Monitoring the Millennium Development Goals (ENSOMD) conducted between December 2012 and January 2013. The Malawi survey was administered to 12 288 households, the Nepal survey to 5988 households, the Uganda survey to 2563 households, the Tanzania survey to 3846 households, and the Madagascar survey to 16 920 households. All data sets include comprehensive modules on food and nonfood consumption from purchases and consumption from own production and in-kind sources. All data sets include a module on housing characteristics and a module on asset ownership. The information collected allows for calculation of a set of food security indicators. For more information about the surveys for Malawi, Nepal, Uganda, Tanzania, and Madagascar, see the documentation provided by the respective statistical agencies. 9 –13
Indicators Constructed
We analyzed a suite of indicators relating to poverty and another suite of indicators related to food security. Table 1 and the text that follows provide more details on each indicator.
Description of Each Indicator Used in the Analysis.
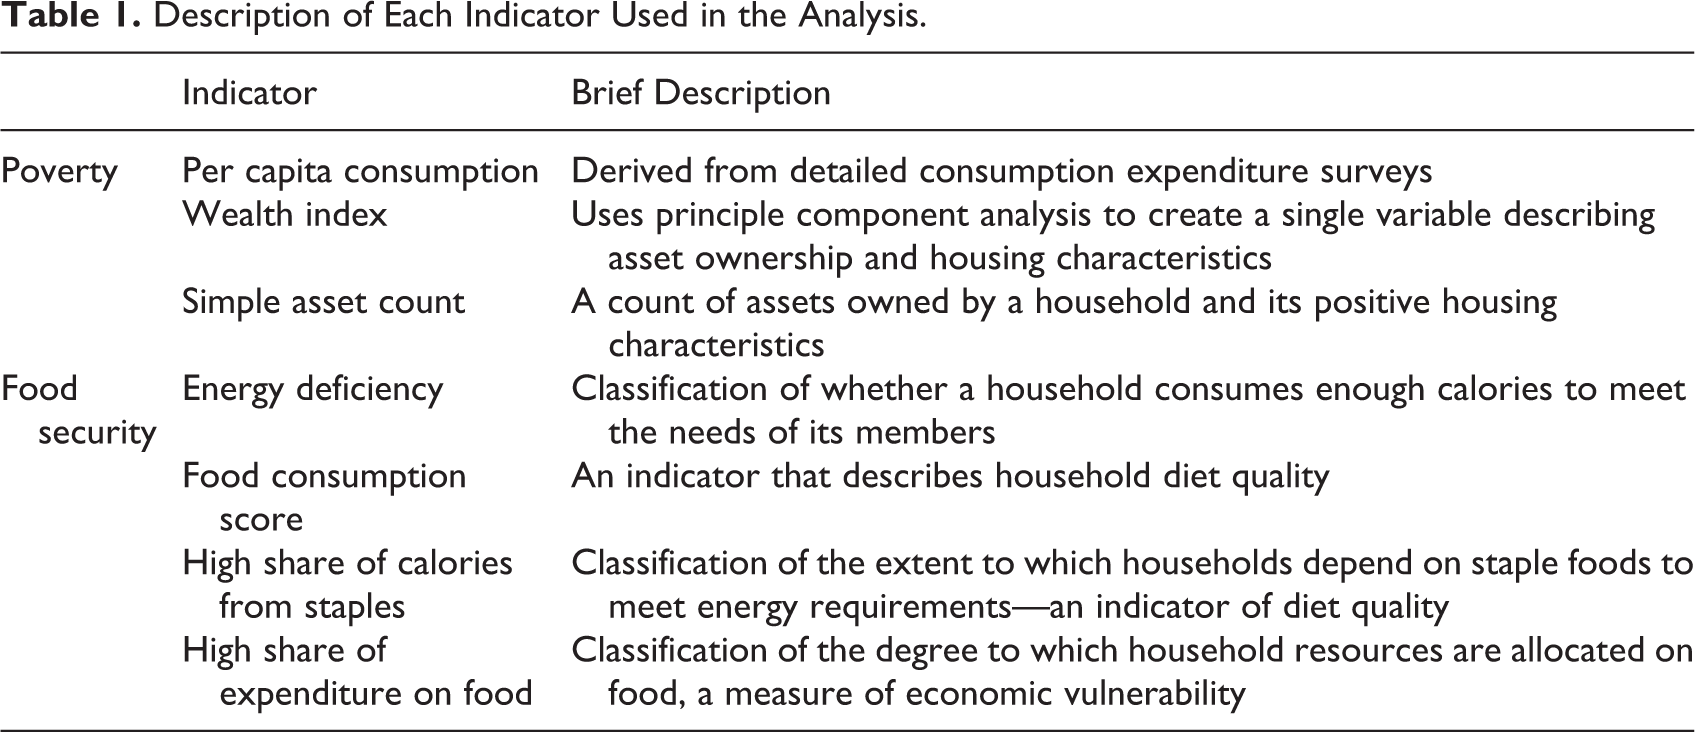
Household consumption aggregate
The consumption aggregate is the value of the flow of all consumption in a household. It includes purchased goods/products and in-kind and own production, including the computed values of housing (represented by the rent or imputed rent) and, in some cases, the estimated value of assets (eg, the price of a car, its depreciation rate, and estimated duration). These values are usually not collected directly in the survey but are imputed by the national statistical offices, based on characteristics of the household or its assets. More information can be found in the respective survey reports. Notably, they all follow the approach described by Deaton and Zaidi. 1 Households are classified into consumption per capita quintiles by ranking their household consumption aggregate per capita values.
Wealth index
Principal component analysis is a method used to reduce the dimensionality of multiple factors in a data set. It involves replacing a set of correlated variables with a set of uncorrelated “principal components” while minimizing information loss. 14 The PCA method extracts the most important information that is able to identify patterns in the data in the form of principle components. The first principal component is used as the WI, similarly to the approach used by others previously. 15 Subsequently, households are classified into wealth quintiles by ranking their assigned WI values.
The variable selection for conducting the PCA includes nonproductive durable assets, housing conditions, and utilities. At the national level, productive assets, such as land ownership and livestock, were not found to be suitable for a national analysis across all livelihood groups as they are likely to distort the ranking of household wealth with livelihood bias. For example, ownership of a plough suggests a positive effect on income earning and thus wealth for a farmer, whereas owning a plough is not likely to have the same implication for an industrial worker. Household characteristics related to human capital such as education are not included in a typical WI. Education, for example, is an additional independent variable of interest for analysis and including it in the construction of the WI would complicate any analysis of wealth and education. The criteria for variables selected for inclusion in the PCA are a prevalence between 5% and 95% and an insurance that variables are not overcorrelated with each other. Assets that were negatively correlated with other variables were excluded. Following the creation of the WI and quintiles, variables that did not show a clear pattern in increasing ownership between each wealth quintile were excluded in an iterative process. The final wealth indices created across all of the data sets consisted of between 12 (Uganda) and 23 (Nepal) variables. In Madagascar, the WI was constructed by the statistical office and included livelihood-specific assets such as ownership of animals. This WI therefore differs from the other data sets where the authors chose the variables to include in the PCA. As the national statistical office selected the variables, the assumptions made are based on their local knowledge and are not questioned by the authors. See Table A1 for a complete list of the variables included in each country.
Asset count
The asset count is based on the number of assets owned by a household. The rationale for the asset count approach is that wealthier households would own a greater number of assets irrespective of the distribution of ownership of the asset. In this approach, each asset has the same weight. The asset count indices were created by simply summing dichotomous variables (0 = no ownership, 1 = ownership), including nonproductive assets and housing characteristics with the maximum number of available assets and housing characteristics included (from 20 variables in Madagascar to 42 in Tanzania). See Table A1 for a complete list of the variables included in each country. Households are classified into asset quintiles by ranking their asset count values.
Energy deficiency
A household is energy deficient if its members do not meet their caloric requirement. So energy deficiency is a measure of the quantity dimension of access to food. It is calculated by summing the total calories in all food items consumed in the last week and comparing the finding with the total requirement for the household members given by Food and Agriculture Organization/United Nations University/World Health Organization 16 assuming light activity level. The calculation follows the protocol given by Smith and Subandoro. 17 Country-specific food composition tables are used when available. As for standard caloric deficiency calculations, the demographic composition (age and sex) of the household is taken into account to adjust for differences in the energy requirements for each household member. Thus, a household is energy deficient if its total caloric consumption is below the requirement of all household members, assuming light activity levels.
The food consumption score
The food consumption score (FCS) measures the diversity of the diet. A diverse diet is necessary to ensure adequate consumption of essential micro- and macronutrients. Diet diversity measures, such as the FCS, measure the dietary quality of the food basket. 18 The FCS is the sum of the number of days, of 7, that each food group (of 8 possible food groups) is consumed by the household. The 8 food groups are (1) staples (cereals, tubers, and roots); (2) legumes and nuts; (3) meat, fish, poultry, and eggs; (4) vegetables; (5) fruits; (6) oils and fats; (7) milk and dairy products; and (8) sugar and sweets. The FCS applies weights to each food group according to its relative nutrient density. 19 The FCS is then used to categorize households into poor, borderline, and acceptable food consumption groups using standard thresholds.
Share of calories from staples
The share of calories from staples is calculated by estimating the proportion of total calories consumed from staple foods in a household. Consuming a high proportion of calories from staples in the diet (>75% of total calories) indicates a low-quality diet, as energy-dense staple foods contain only small amounts of protein and micronutrients. 17 Share of calories from staples is another measure of diet quality.
Food expenditure share
The share of expenditure on food is used to describe household vulnerability to food insecurity. A high share of expenditure on food suggests that a household is vulnerable to economic shocks—negatively impacting the stability dimension of their access to food. 17 A high share of expenditure on food (>65%) indicates a high vulnerability to food insecurity and implies that a household may have to sacrifice nonfood necessities, such as health care and clothing, in order to acquire sufficient food. 17 Food expenditure share is calculated as the total value of food consumed relative to the total consumption aggregate including food and nonfood.
Methodological Approach
A mix of descriptive analysis, correlation, and sensitivity analysis will be used to discuss the indices of economic status. Spearman rank correlation is used to explore the relationship in household rankings between the wealth indices and consumption aggregate across the population. Sensitivity analysis estimates the share of households that are simultaneously in the same quintile by the different measures used. Unweighted quintiles are used in the analysis.
The asset count index is an integer variable with maximum values ranging from 20 (Madagascar) to 42 (Tanzania). The relatively small range of values and households often concentrated around the same score makes classification of households into equal size groups impractical in some cases. Thus, the asset score quintiles are not all of the exact same size of 20% of households across quintiles.
By comparing food security variables, capturing food quantity, food quality, and stability/vulnerability, to food security, across the WI, asset count index, and consumption aggregate quintiles, we discuss whether differences are more pronounced across these 3 measures of inequality.
Results
Correlations
Table 2 shows the correlation coefficients between the WI and the asset count, between the WI and per capita consumption, and between the asset count and per capita consumption. The correlations are all significant at 0.01 levels. Correlations between the WI and the asset count are very high and near to 1 in a couple of cases (Nepal and Tanzania). Not surprisingly, the correlation is lowest in Madagascar, where ownership of livestock was included in the WI but not in the asset count score. The correlations between per capita consumption and each of the 2 indices (WI and asset count) based on assets and housing are also strong (between 0.47 and 0.63). The correlation is slightly higher for WI and per capita consumption than for asset count and per capita consumption.
Spearman Correlation Coefficient Between the Wealth Index, Asset Count, and Per Capita Consumption.
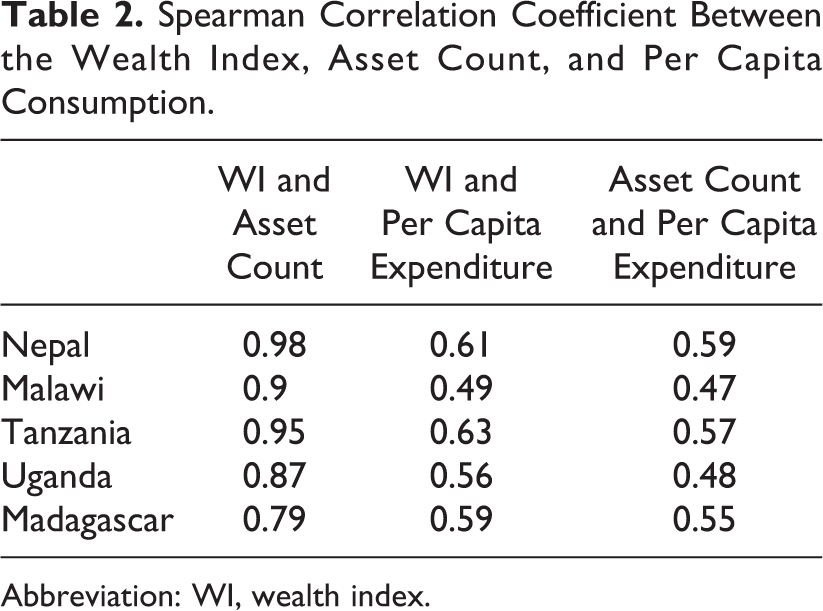
Abbreviation: WI, wealth index.
Overlap in Classification of Households in the Quintiles
Table 3 shows the overlap in classification of quintiles by the per capita consumption measure and by WI for Nepal. The table shows the distribution of households in each of the WI quintiles across the 5 consumption quintiles. If there was no association between the 2 indicators and the results were evenly spread, each box would have 4% (an even distribution of all households across the 25 cells in the matrix), and in total 20% of households would be classified in the same quintile according to both measures. Conversely, if there were a perfect one-to-one relationship between the 2 variables, we would find 20% in the diagonal fields and 0% in the other fields.
Overlap in Classification by Consumption Per Capita and Wealth Index (Nepal).
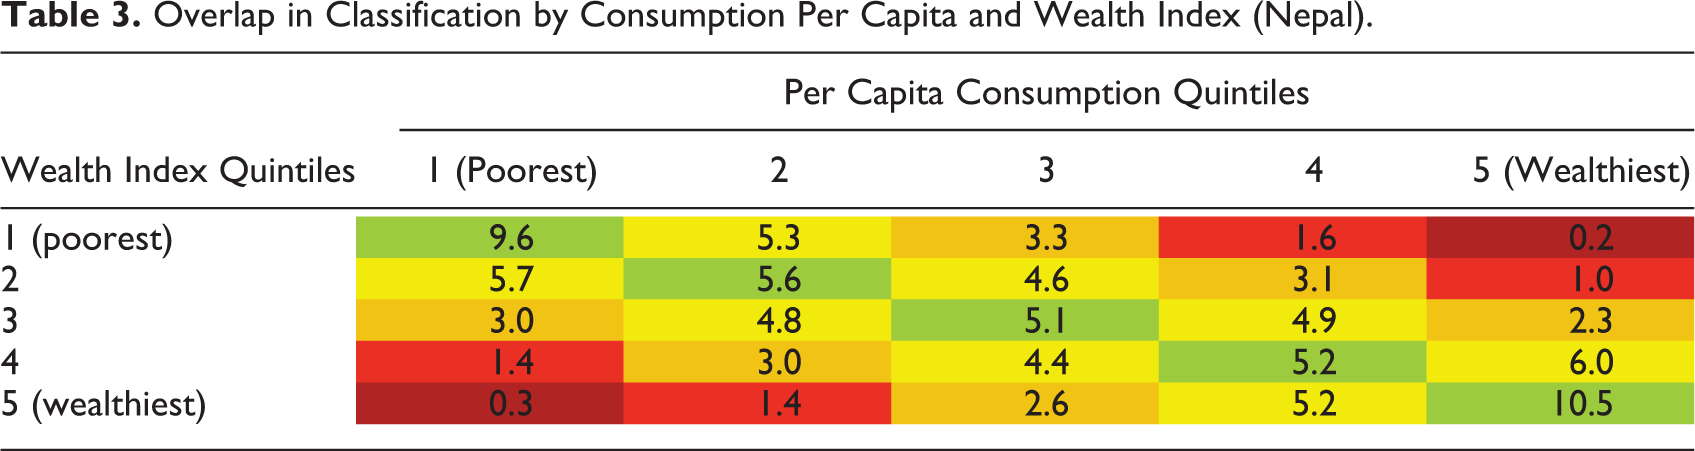
The table for Nepal illustrates that the greatest overlap between the 2 measures is found in the richest quintiles and in the poorest quintile. The results from the other countries are similar (see Table A2).
Similarly, the overlap in classification between the quintiles using the WI and asset count in the poorest and wealthiest quintiles is higher than in the middle quintiles (see second part of Table A2).
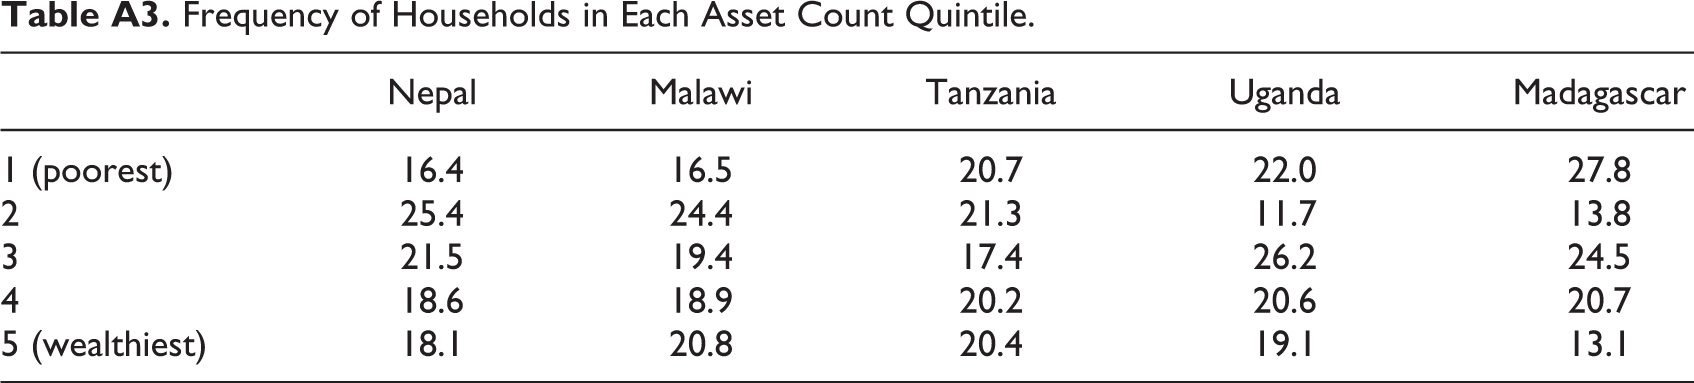
Table 4 summarizes the information for all countries as given in the examples earlier, showing the percentage of households classified in the same quintile, or in the same or 1 quintile away, for each pair of combinations of the 3 variables. In total, between 35% and 38% of households are classified in the same quintile by the WI and consumption per capita, and about 73% to 78% are classified not more than 1 quintile away (third column in Table 4). The figures comparing the asset count index and the per capita consumption quintiles are of a very similar magnitude. In general, the wealth and asset count indices show high agreement. Between 79% and 99% are classified 1 or 2 quintiles away, whereas between 45% and 85% are classified within the same wealth and asset count indices quintile. Note that a likely reason for the relatively low classification overlap between the WI and asset count quintiles in Madagascar, Uganda, and Malawi is that the asset count quintiles do not each consist of 20% of households (as one would expect for quintiles by definition, see Table A3). Further, the distribution is concentrated around a few score values; in Uganda, for example, 50% of households have an asset count between 6 and 9.
Percentage of Overlap in Classification of Households.
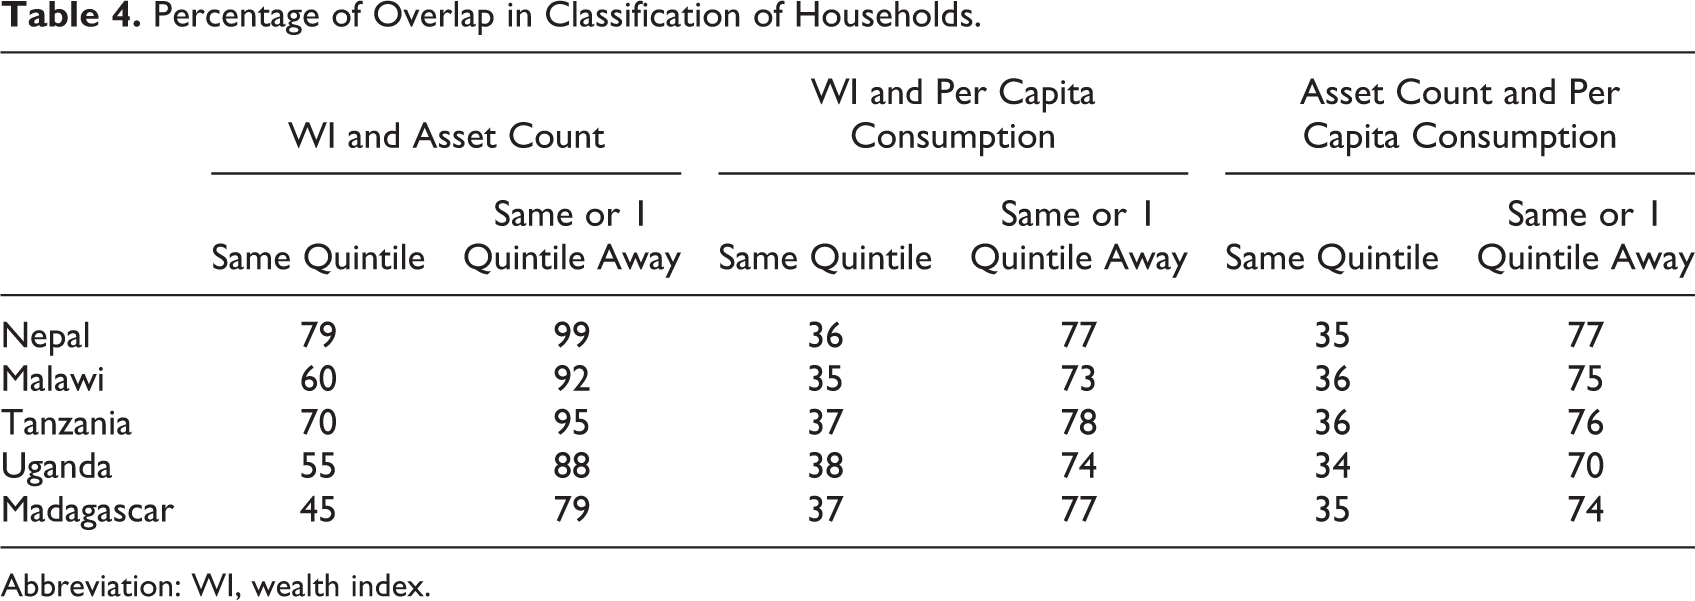
Abbreviation: WI, wealth index.
Food Security by Quintiles
Table 5 describes the prevalence of various food security indicators by quintiles of the 3 inequality measures. The prevalence of food insecurity decreases from poorer to wealthier quintiles for all variables of economic status and for all food security measures in all countries. The patterns of food security across the wealth and asset count quintiles are very similar. The prevalence of caloric deficiency, capturing the quantitative dimension of food consumption in our analysis, decreases more markedly across the consumption per capita quintiles than across the quintiles based on WI and asset counts. This holds for all countries. For all countries except Tanzania, there is much less variation in the prevalence of energy deficiency across asset count and wealth quintiles than there are in the other food security indicators.
Prevalence of Food Security Dimensions by Quintiles.
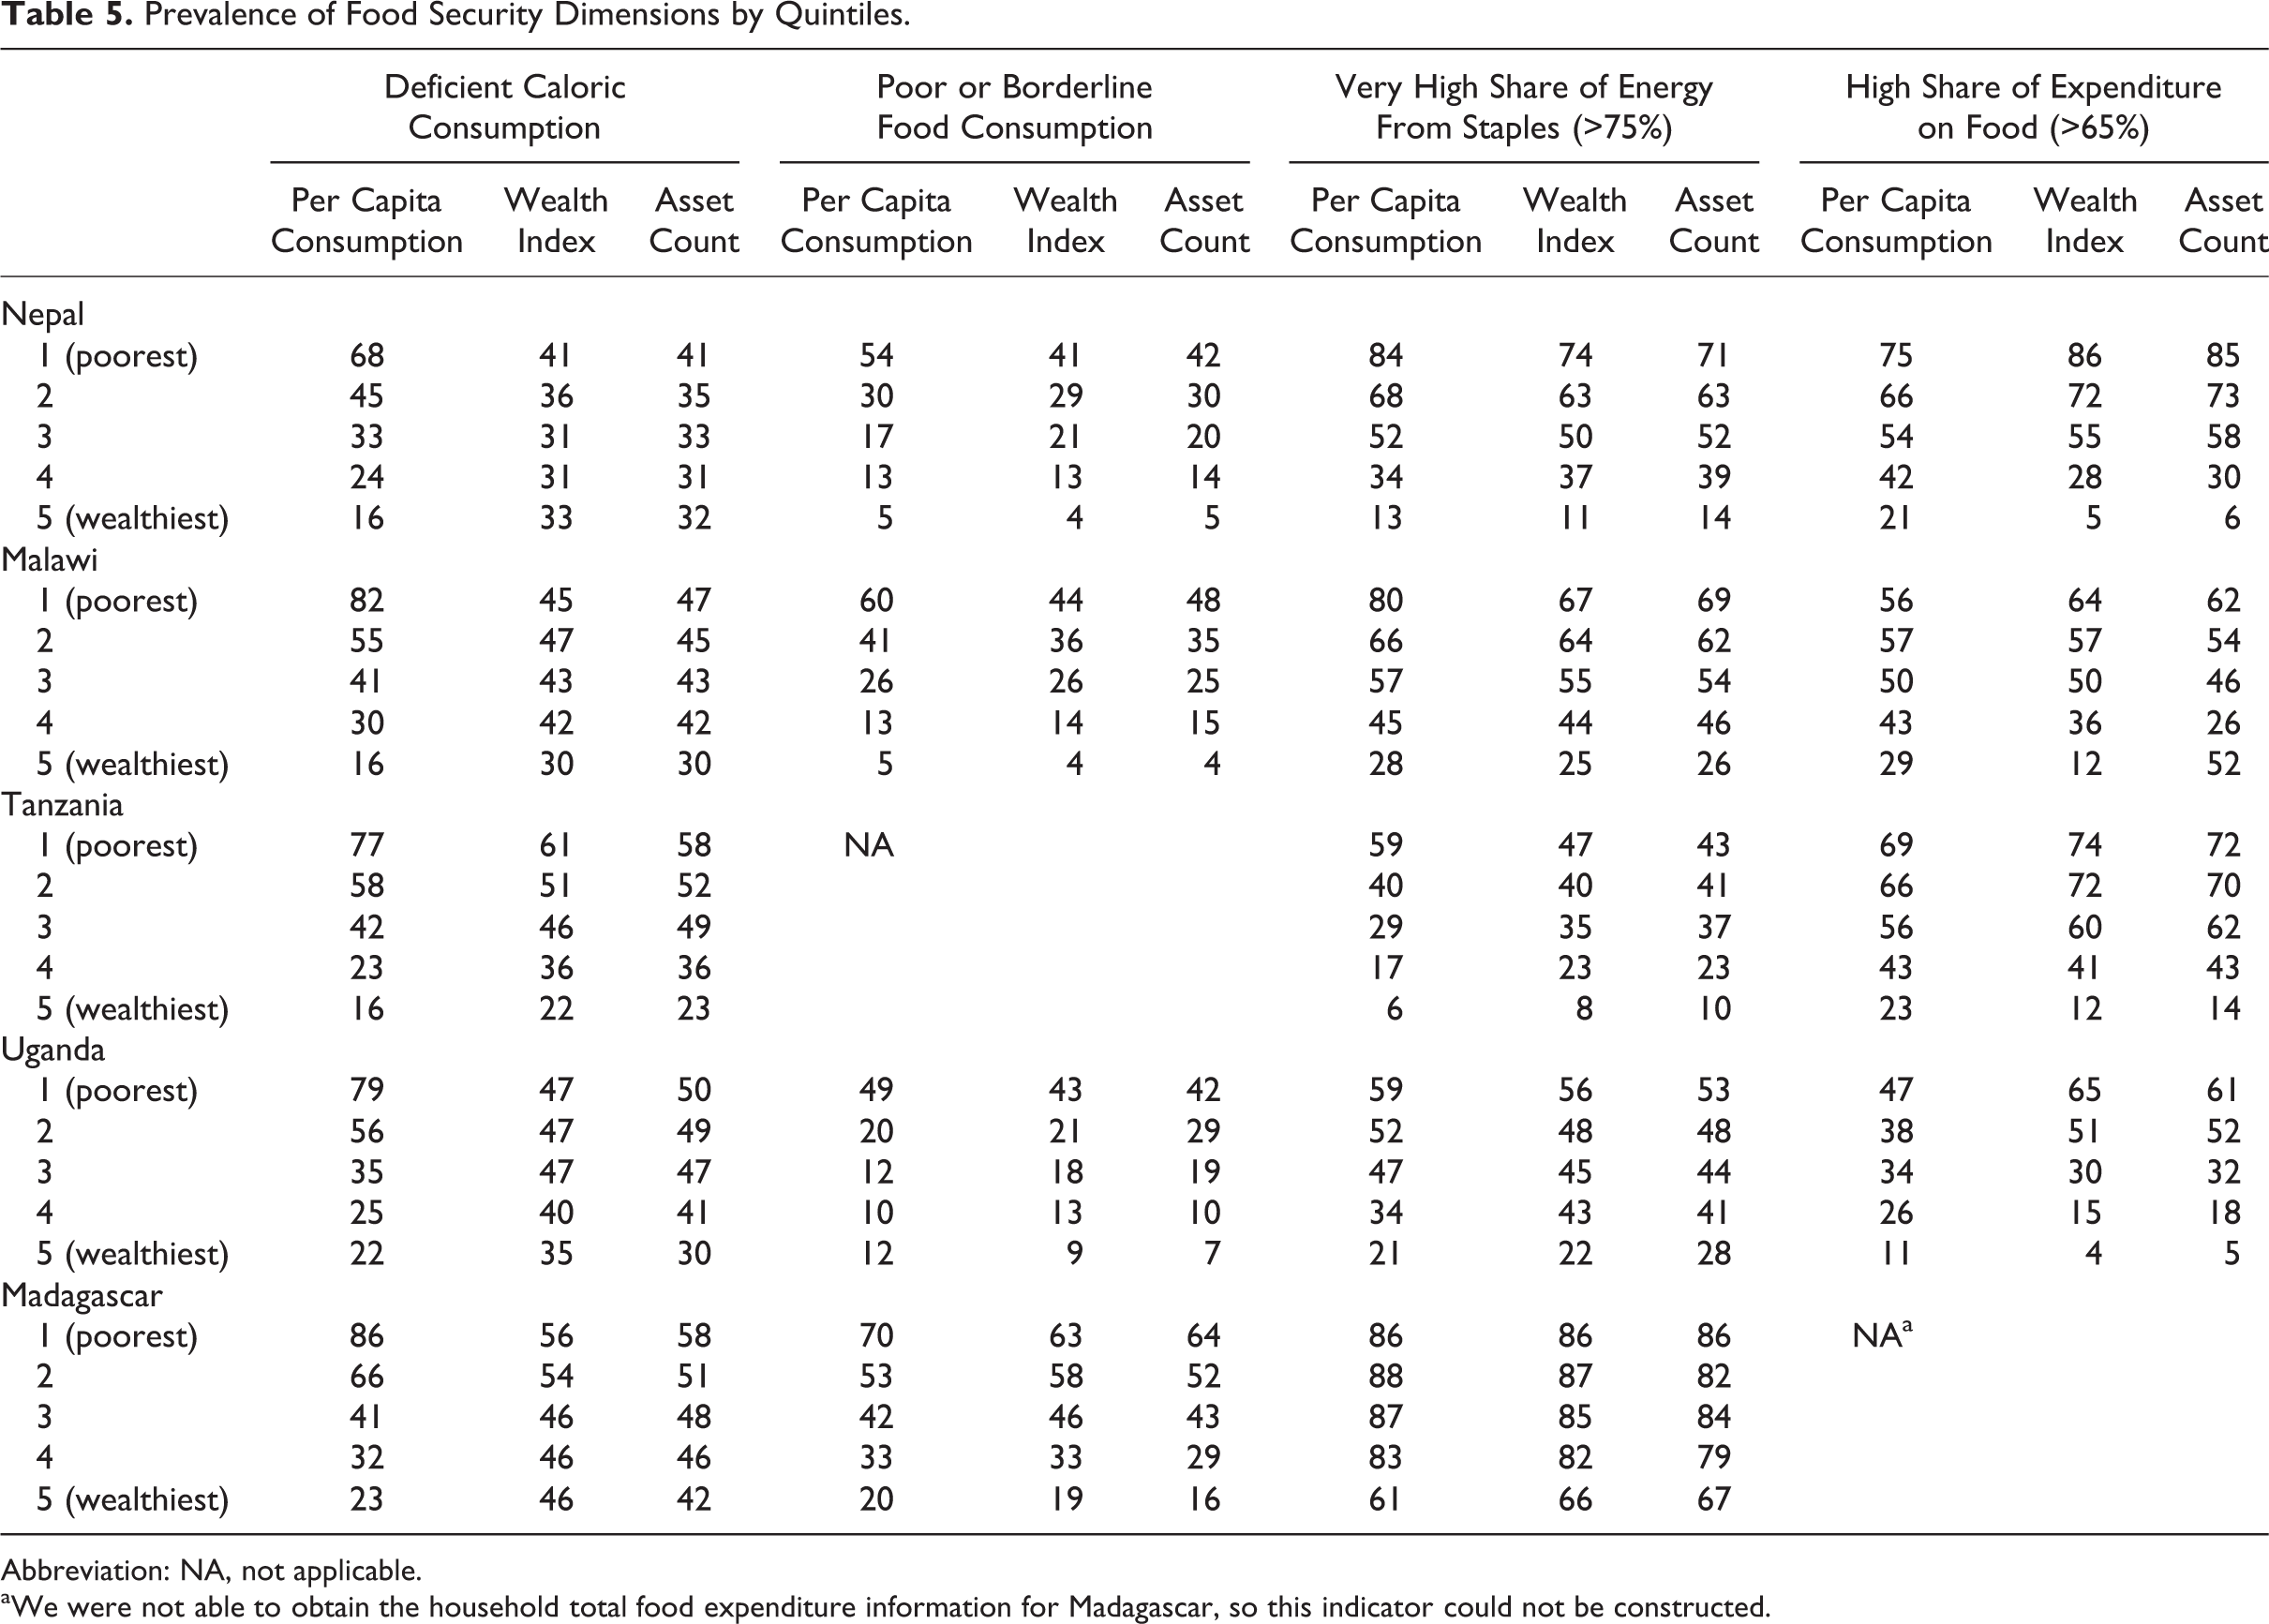
Abbreviation: NA, not applicable.
aWe were not able to obtain the household total food expenditure information for Madagascar, so this indicator could not be constructed.
The difference in the prevalence of households with high food expenditure share is considerably larger between the poorest and wealthiest wealth quintiles and asset count quintiles than between per capita consumption quintiles in all countries.
For the 2 diet quality indicators—the FCS and the share of calories from staples—the picture is more mixed. For Nepal, Malawi, and Tanzania, the consumption quintiles show a larger difference in the prevalence of households eating a poor quality diet than the asset count and wealth-based quintiles. For example, in the poorest consumption quintile, 54% have poor or borderline food consumption and 84% have a high share of energy from staples, whereas the corresponding figures for the poorest WI quintile are 41% unacceptable food consumption and 74% high staple dependency. The wealthiest consumption and wealth quintiles have about the same prevalence of poor diet quality measures. However, the difference is not very large (as it is for the energy deficiency variable). For the other countries, the patterns in diet quality are similar across all 3 groups of quintiles.
Discussion
The empirical analyses in this article are based on large national data sets and mostly show consistent results across the 5 countries, allowing some general inferences to be made. The correlations between the various economic status indicators—measures of current income (flow) and measures of economic wealth (stocks)—range from 0.49 to 0.63 and are at similar magnitude to those found in other multicountry studies. 3,5 As a household’s consumption is likely to be a function of its possibility to generate income, we would expect the correlation to be higher if productive assets were included in the WI measures. As expected, a simple asset count and a WI based on PCA are highly correlated, with coefficients ranging from 0.82 to 0.99.
The 3 indicators of economic status concur most when classifying households in the poorest and wealthiest quintiles rather than the 3 middle quintiles. Thus, extremely poor and wealthy households are more likely to be classified in the same way by the various indicators. This is a positive result as the extreme poor and extreme food insecure households are the most important to identify for targeting purposes.
Inequalities in the quantity dimension of food security, measured through energy deficiency, are larger between consumption quintiles compared to the wealth and asset count indices. This holds true for all countries analyzed. The lack of sufficient quantities of food in a household is more strongly related to current income than to the stock of wealth in the household. This is a reasonable finding as caloric consumption is a reflection of the immediate food security situation and therefore expected to be more sensitive to changes in income. This finding requires further investigation before any definitive conclusions can be made. However, compared to the other food security indicators assessed, the prevalence of energy-deficient households is high, even for the wealthiest quintile. This may be due to some well-known measurement issues related to energy deficiencies, including not accounting for physical activity, and the difficulty in assessing out-of-household consumption. Typically, a poor household will be engaged in more physically strenuous activities than a wealthier household and therefore will likely have a higher caloric requirement. 20 Wealthier households, and urban households in general, tend to eat more food outside the home. This type of consumption is difficult to capture in surveys as noted by Smith and Subandoro 17 and may lead to underestimation of food energy intake.
In contrast, differences in the proportion of households with high food expenditure share are more pronounced between the WI quintiles compared to the per capita consumption quintiles. Thus, a measure of wealth stock in the household seems more important than a flow measure for distinguishing household vulnerability to food insecurity—considered to be instability of food access. Similarly, Sahn and Stifel 3 compare outcomes in child stunting between expenditure quintiles and quintiles based on an asset index. Their findings suggest that the asset index quintiles are equally good or better for identifying groups with high prevalence of malnutrition compared to expenditure quintiles. This finding warrants further exploration of stock measures as an indicator of long-term wealth and chronic malnutrition that results from many causal factors, including repeated deprivation. Ownership of assets indicates that a household has a buffer to lend it resilience to shocks and food insecurity. Asset-poor households are more likely to spend a larger share of their budget on food and are more vulnerable to shocks such as high food prices, compared with the poorest households as ranked by the current consumption. Asset-poor households likely have extremely limited income available for nonfood expenditures as reflected in their high share of expenditure on food. In addition, they may have deprived their asset stocks when faced with economic shocks. Thus, economic vulnerability to food insecurity seems to be more closely related to stocks, as measured through assets and housing characteristics, than to current consumption.
Using 2 measures of diet quality—the FCS and share of calories from staples—the poorest households have much lower diet quality than the wealthiest. However, there is no clear pattern demonstrating a stronger ability of 1 of the 2 measures of economic status (stock and flows) to explain differences in diet quality. A future study, ideally based on panel data, would prove useful for understanding changes in diet quality over time and how they relate to the 2 dimensions of economic status examined.
Although the 2 measures of economic status studied have the same direction in the determinants on food security dimensions, the strength of the effect systematically differs for 2 of the 3 food security dimensions. Therefore, targeting households based on a WI may better identify those highly vulnerable to food insecurity than a consumption measure. However, a WI approach may be less successful in addressing a gap in calories. As current consumption is an important underlying factor for food security, but cannot be fully accounted for by an asset index, food security assessments addressing the current income (“flow”) aspect of economic status are useful to design appropriate policies and programs. Comprehensive consumption expenditure surveys can also facilitate estimation of the monetary gap needed to achieve food security. Such information is critical for the design of cash transfer programs focused on achieving food security. However, a measure of economic status using quintiles such as the asset index quintiles is not able to identify how poor the poorest are in absolute terms, and therefore, the monetary resources needed to fill the food gap. Acknowledging that resource demands for collecting detailed information in emergencies and monitoring systems is a major challenge, food security agencies should make better use of comprehensive national consumption expenditure surveys for baselines and emergency preparedness information systems. Most national statistical agencies regularly conduct comprehensive consumption and expenditure surveys with the aim of identifying total current household consumption and income, particularly for establishing targets for and monitoring poverty reduction strategies. Although these surveys are not directly designed to capture food security, many have added simple stand-alone food security modules such as FCS or household dietary diversity score and experienced-based measures such as the hunger scale or Food Insecurity Experience Scale (eg, the LSMS—Integrated Surveys on Agriculture implemented by the World Bank’s LSMS team). Even if food security modules are not added, the share of expenditure on food, calories, and dietary diversity scores can be derived from a comprehensive consumption module. A system with baseline food security assessments coupled with light monitoring and emergency assessments should be put in place. The baselines would be based on large-scale consumption and expenditure modules, where, in particular, food insecurity levels for different dimensions of economic status are calculated and could form the tool for emergency preparedness. The light tools could monitor and assess changes in levels of food security.
There are some limitations to this study. First, there is no gold standard for measuring long-term wealth and stocks in the household. Although consumption per capita is considered to be the gold standard proxy for measuring current income, there is no such standard for the WI measuring assets and housing characteristics. Ideally, we would have estimates of the monetary value of the assets a household owns, but there is no established, well-defined module to collect this information.
Consumption can be affected by measurement errors in various steps: in collecting monetary values, creating price deflators, and when imputing user values (eg, Deaton and Zaidi for the procedure for calculating the consumption aggregate). 1 An asset module on the other hand is less likely to be affected by measurement errors, being based on yes or no answers to ownership. Helton and Thoresen 21 show that the impact of random measurement errors on PCA score is negligible. Beegle et al 22 show that consumption is quite sensitive to design in the questionnaire; specifically, the number of food items asked about and the recall length used can have a major influence on the consumption value. In addition, consumption expenditure surveys are limited by the difficulty in accounting for food eaten away from home in a standard recall module (eg, Smith and Subandoro). 17 If a measurement error due to underreporting is likely to be proportional to the total consumption, it may not affect the ranking. However, if measurement error is proportionally larger for households having a higher consumption, this may lower the correlation with food security and with the other wealth indices—as households with a real high consumption will receive a relatively low rank.
There is an inherent difference between the asset indices and the expenditure measures because only the latter is in per capita terms. This may affect the rankings made by the different measures if a large family was to have a relatively high number of total assets but low per capita expenditures. However, many of the variables included are relevant for the whole household (eg, material used in construction of the house, water, and sanitation as well as assets such as refrigerator, television, and car), so this should not pose too big a problem.
The overall assumption is that poverty, in terms of income or accumulated wealth, is intrinsically linked to the food security status of a household, both in terms of diet quantity and diet quality, and to the allocation of resources to food versus nonfood. It should be noted that although we find the expected sign of relationship between economic status and the food security indicators, the former cannot be used to predict the latter. Firstly, because economic status defined by quintiles does not express an absolute level of economic status but only a relative ranking, and secondly, because the economic status indicators studied have varying relationships with different dimensions of food security.
Food security indicators themselves are proxies measuring multiple aspects of a multidimensional issue. The most accepted and measurable indicators of food security—calorie intake and share of expenditure on food—are only available in comprehensive consumption expenditure surveys. Other food security indicators, such as coping strategies and experiential food security indicators, which are important for early warning signals (reference), were not included in this analysis as they were not available within the surveys used. These indicators are typically included in light monitoring surveys and warrant research as well.
This study is based on an assessment of 5 countries only. Although a clear picture emerges with respect to the relationship between various dimensions of food security and stock and flow measures of economic status, further studies with broader geographic scope are needed to confirm this relationship.
Concluding Remarks
The indicators consumption per capita (a measure of flow) and the WI (an asset-based measure of economic wealth/stock), are, as expected, well related. Despite being highly related and both being fundamental drivers of food security, they cannot be used interchangeably for food security analysis. Based on this 5-country study, the 2 different inequality measures are important for describing different aspects of food security. Consumption expenditures are better at describing quantity measures of food security, whereas an asset ownership index is more suitable for describing vulnerability to food insecurity as it highlights poor stability of food access. However, this study is only an initial analysis of stock and flow measures of economic status and how they relate to the various dimensions of food security based on limited available data. The relationship between these measures must be further understood and should be examined in subsequent studies.
From the results of this study, it follows that it is important that food security agencies and policy makers work together on establishing harmonized food security information systems, based on large-scale national surveys coupled with light monitoring and emergency assessments. In this way, existing data can have increased utility while also facilitating research and analysis on the multiple aspects of economic status and food security with regular updates on the lighter set of indicators through monitoring and emergency surveys.
An additional important finding in the analysis is that a simple count of assets and housing characteristics is as good as a PCA-derived WI for differentiating household food security indicators. This is good news for quick assessments and for creating transparent, reproducible results.
Footnotes
Appendix A
Frequency of Households in Each Asset Count Quintile.
| Nepal | Malawi | Tanzania | Uganda | Madagascar | |
|---|---|---|---|---|---|
| 1 (poorest) | 16.4 | 16.5 | 20.7 | 22.0 | 27.8 |
| 2 | 25.4 | 24.4 | 21.3 | 11.7 | 13.8 |
| 3 | 21.5 | 19.4 | 17.4 | 26.2 | 24.5 |
| 4 | 18.6 | 18.9 | 20.2 | 20.6 | 20.7 |
| 5 (wealthiest) | 18.1 | 20.8 | 20.4 | 19.1 | 13.1 |
Acknowledgments
The authors are grateful to colleagues in World Food Programme for discussions and advice in the preparation of this analysis. In particular, the authors would like to thank Peter Horjus, Darryl Miller, and Aysha Towse for valuable comments and Katy Williams for editorial work. They are grateful for good comments from 2 anonymous reviewers. They would also like to thank the statistical offices in Nepal, Malawi, Tanzania, Uganda, and Madagascar for sharing their data.
Declaration of Conflicting Interests
The author(s) declared no potential conflicts of interest with respect to the research, authorship, and/or publication of this article.
Funding
The author(s) received no financial support for the research, authorship, and/or publication of this article.