
Abstract
Background:
The traditional Vietnamese diet carries the risk of micronutrient deficiencies, and a substantial part of children <11 years do not meet the Vietnamese recommended dietary allowance (RDA) for a range of nutrients. Dairy products are known for their high nutrient density and milk in particular for its provision of high-quality protein and relevant concentrations of calcium, magnesium, vitamin B2, vitamin B12, and pantothenic acid.
Objective:
The present study aimed to evaluate the contribution of dairy to the overall nutrient intakes in the diets of Vietnamese children and to gain insight into factors affecting dairy consumption.
Methods:
Food intake, including dairy, was assessed by a 24-hour recall in 2811 Vietnamese children clustered into 4 age-groups: 1.0 to 2.9, 3.0 to 5.9, 6.0 to 8.9, and 9.0 to 11.9 years, and dairy was categorized into 6 product groups based on available information in the Vietnamese food composition table.
Results:
Higher dairy intake was associated with significantly higher intakes (in % estimated average requirement and %RDA) of all assessed nutrients, and largest effects and strongest associations were found for vitamin B2, calcium, vitamin D, fat, vitamin B1, protein, vitamin A, and zinc. Age, area of residence, and wealth status influenced the consumption of dairy products. Furthermore, age also influenced nutrient intake adequacy, which was generally lower at older age, especially after the age of 6 years.
Conclusion:
The nutrient composition of the diet in especially Vietnamese school-aged children requires attention, and (fortified) dairy can play an important role in this.
Introduction
The traditional Vietnamese diet based on cereal, tuber, and vegetables carries the risk of micronutrient deficiencies. 1 Recent years have witnessed a change in the dietary habits of the Vietnamese people, with more consumption of meat, eggs, and milk as well as higher intakes of fat and sugar. 2 The National Nutrition Survey reported that the dietary iron intake was only 70%, and vitamin A was only 65% of the Vietnamese recommended dietary allowance (RDA), among children aged 2 to 5 years. 3 Results from the South East Asian Nutrition Surveys (SEANUTS) further confirmed that a substantial part of children <11 years did not meet the Vietnamese RDA for iron, vitamin A, vitamin B1, and vitamin C as well as for energy and protein. 4 Inadequate intake of energy and protein is partly attributable to predominantly rice diets, with poor intake of protein from animal sources. 5
It is recognized that Vietnam is facing the double burden of malnutrition, with both under- and overnutrition widely prevalent. 3,4 Both spectrums of malnutrition are known to increase the risk of chronic diseases later in life 6 and to affect development and cognitive performance early in life. 7 –9 Impaired development in early life is most often permanent and can affect future generations. 6 Therefore, prevention of malnutrition is expected to benefit population health, educational performance, and economic productivity, making investments in child nutrition a common strategy for economic development. 6,10 –12
In 2030, Vietnam aims to reduce child undernutrition below the level of public health significance and to limit the increase in the prevalence of overweight and obesity among preschool and school-aged children. 13 Approaches include behavior change and enhancing awareness of proper nutrition in order to ensure appropriate and balanced diets. Dietary guidelines were revised in 2007 and advocated the improvement in dietary diversity, including use of milk and dairy products in accordance to the age-group. 14 Although it is known that dairy consumption per capita and per household in Vietnam has increased during the last decade, 15,16 specific dairy consumption levels per age-group are not yet reported.
Dairy products are known for their high nutrient density 17 and milk in particular for its provision of high-quality protein, 18 essential and nonessential fatty acids carrying fat-soluble vitamins, 19,20 and low glycemic load. 21 Milk contains relevant concentrations of calcium, magnesium, vitamin B2, vitamin B12, and pantothenic acid and can therefore substantially contribute to the achievement of the RDA for these micronutrients. 18 Thus, milk consumption increases diet quality in terms of micronutrient intakes. 22 Socioeconomic and sociodemographic status are known to influence food consumption quality and quantity in Vietnam 23 ; however, their effect on dairy consumption in particular is not yet described. This study aims to evaluate the contribution of dairy to the overall nutrient intakes in the diets of Vietnamese preschool and school-aged children and to find factors affecting dairy consumption.
Materials and Methods
The study is part of the SEANUTS, a cross-sectional study carried out in 2011 in Vietnam, Indonesia, Thailand, and Malaysia for which the methodology has been described in detail elsewhere. 4,24 In Vietnam SEANUTS, a total of 2811 children, aged 1.0 to 11.9 years, were recruited from 3 regions in Vietnam, the north, the middle, and the south. Sociodemographic variables, dairy consumption, and nutrient intake were assessed in all participating children.
Sociodemographic Variables
Sociodemographic information of the children was obtained from parents or caregivers using interviewer-administered questionnaires. To estimate the household economic status, an index that incorporated household belongings and household income was used. Household possessions were converted into their financial values and summed together with parental income to produce a wealth index that was categorized into 5 levels: low, very low, middle, high, and very high. The education level of the mother was classified into 4 categories: “none,” “primary school,” “secondary or high school,” and “college or university.”
Dietary and Nutrient Intake
Food intake, including dairy, was assessed by a 24-hour recall questionnaire using standard food measures. Parents or caregivers provided information for children <8 years, and children aged 8 years and earlier completed the 1 day dietary intake interview themselves. Dairy products were categorized into the following 6 groups based on the information on dairy products available in the Vietnamese food composition table: milk powder (whole milk powder, infant and child formulae), sweetened condensed milk, fresh milk (Ultra High Temperature [UHT] plain and UHT flavored), yoghurt (plain and flavored), yoghurt beverage (flavored), and cheese (Appendix A). 25 Dairy intake is presented in grams per day. The Nutrisoft program developed by the National Institute of Nutrition, using the Vietnamese food composition table, 25 was used to estimate nutrient intake. The values were compared with the World Health Organization/Food and Agriculture Organization estimated average requirements (EAR) 26 and the Vietnamese RDA 27 to assess intake adequacy.
Statistical Analyses
Data were analyzed using the statistical package STATA/SE version 12.0. All analyses were performed on weighed data, using weight factors based on the population census 2011 (Bureau of Statistics). In all analysis, children were clustered into 4 age-groups, namely, 1.0 to 2.9, 3.0 to 5.9, 6.0 to 8.9, and 9.0 to 11.9 years. Analysis of covariance was used to compare mean differences in dairy product intake and median differences in nutrient intake and intake adequacy of multiple age-groups, after adjustment for age and sociodemographic factors. Multivariate linear regression analysis was performed to model the association between dairy use, sociodemographic variables, and nutrient intakes. Data are presented as mean and standard error (SE) or median and 95% confidence interval (CI). The level of significance was set at P < .05.
Results
Sociodemographic characteristics of the children are presented in Table 1. In total, 2811 children, aged 1.0 to 11.9 years, representing an estimated population of 19 496 105, participated in the study. The mean age of the children was 7.3 (0.3) years. Approximately 50% were boys, 75% resided in rural areas, and over 75% of the children were from low- to middle-income families. Majority (above 80%) of the mothers of recruited children had a secondary education level or higher.
Sociodemographic Characteristics of the Children Participating in the Study.a
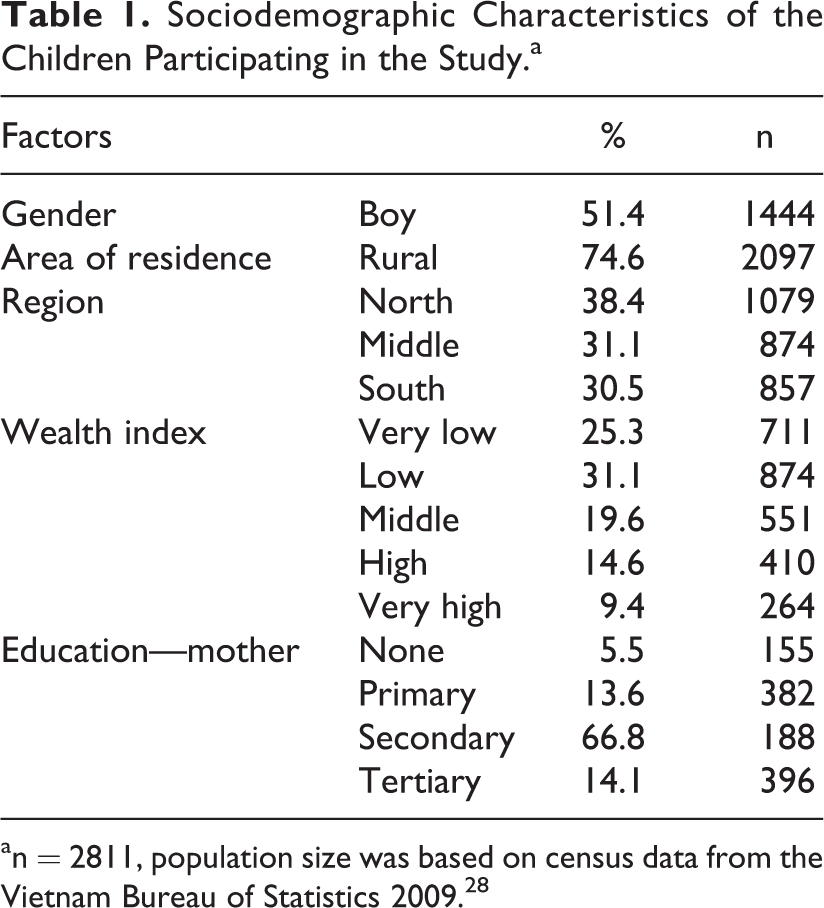
an = 2811, population size was based on census data from the Vietnam Bureau of Statistics 2009. 28
Intake of energy, iron, and vitamin B3 was significantly different among age-groups (Table 2). Intake of calcium, vitamin A, vitamin B2, and vitamin D tended to be lower at older ages, but differences were only significant among age-groups for vitamin D. Comparison of nutrient intakes with the EAR showed that the intake adequacy was generally lower at older age, especially after the age of 5 years. Compared to the Vietnamese RDA, a similar decreasing trend was observed.
Intake Levels of Macro- and Micronutrients in Different Age-Groups, Absolute and as Percentage of EAR and RDA.
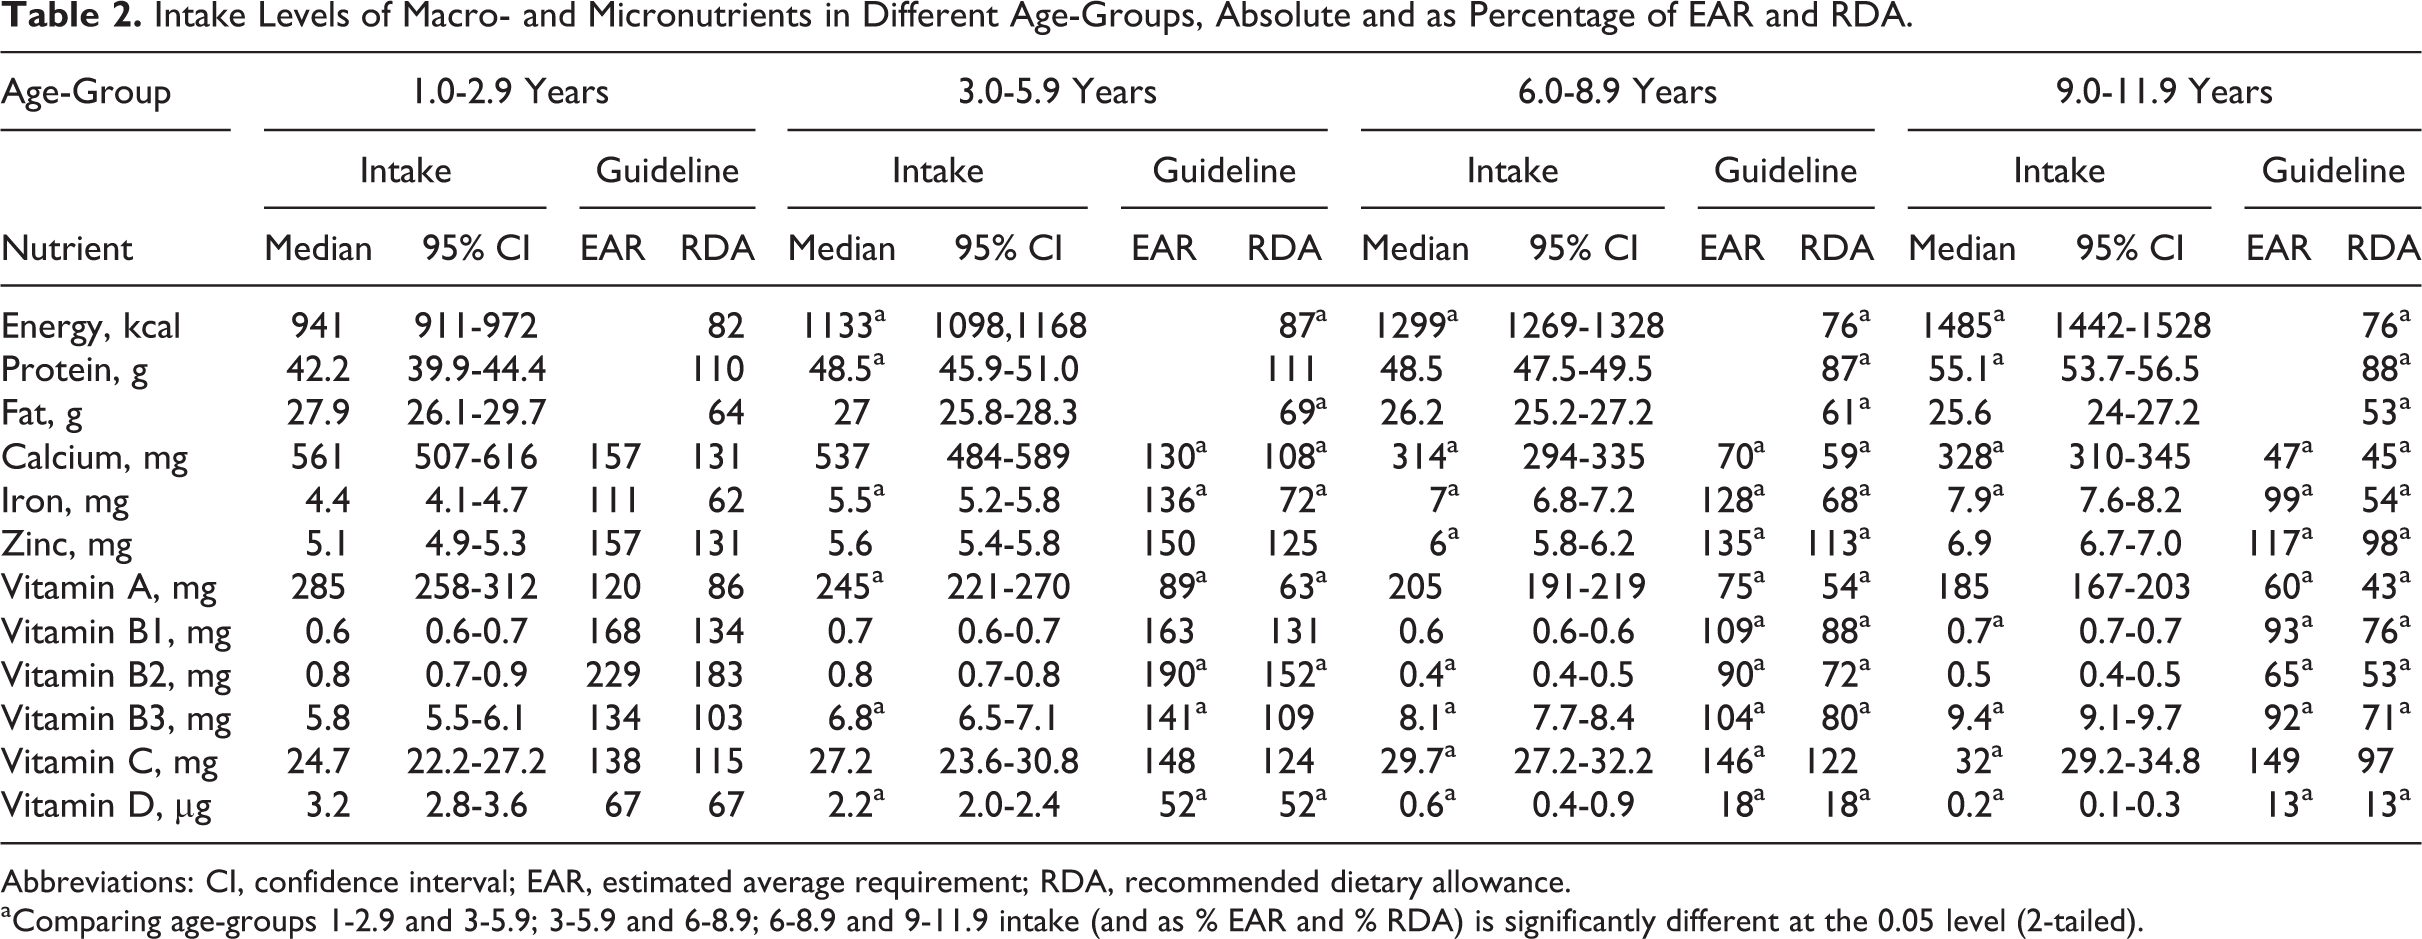
Abbreviations: CI, confidence interval; EAR, estimated average requirement; RDA, recommended dietary allowance.
aComparing age-groups 1-2.9 and 3-5.9; 3-5.9 and 6-8.9; 6-8.9 and 9-11.9 intake (and as % EAR and % RDA) is significantly different at the 0.05 level (2-tailed).
Table 3 presents the effect of sociodemographic variables and dairy intake on the adequacy of nutrient intake. Except for fat intake, age was negatively associated with the intakes (as %RDA) of all nutrients, with highest negative correlations observed for calcium, vitamin B1, and vitamin B2. Boys and children residing in urban areas had higher nutrient intakes (except vitamin C) than girls and their rural counterparts, although not always statistically significant. A higher educational level of the mother and a higher wealth factor were associated with higher intakes for most nutrients. The consumption of dairy had a positive effect for all nutrients, with the lowest effect for iron and the highest effect for vitamin B2.
The Effect of Sociodemographic Variables and Dairy Intake on Nutrient Intake (in % of RDA).
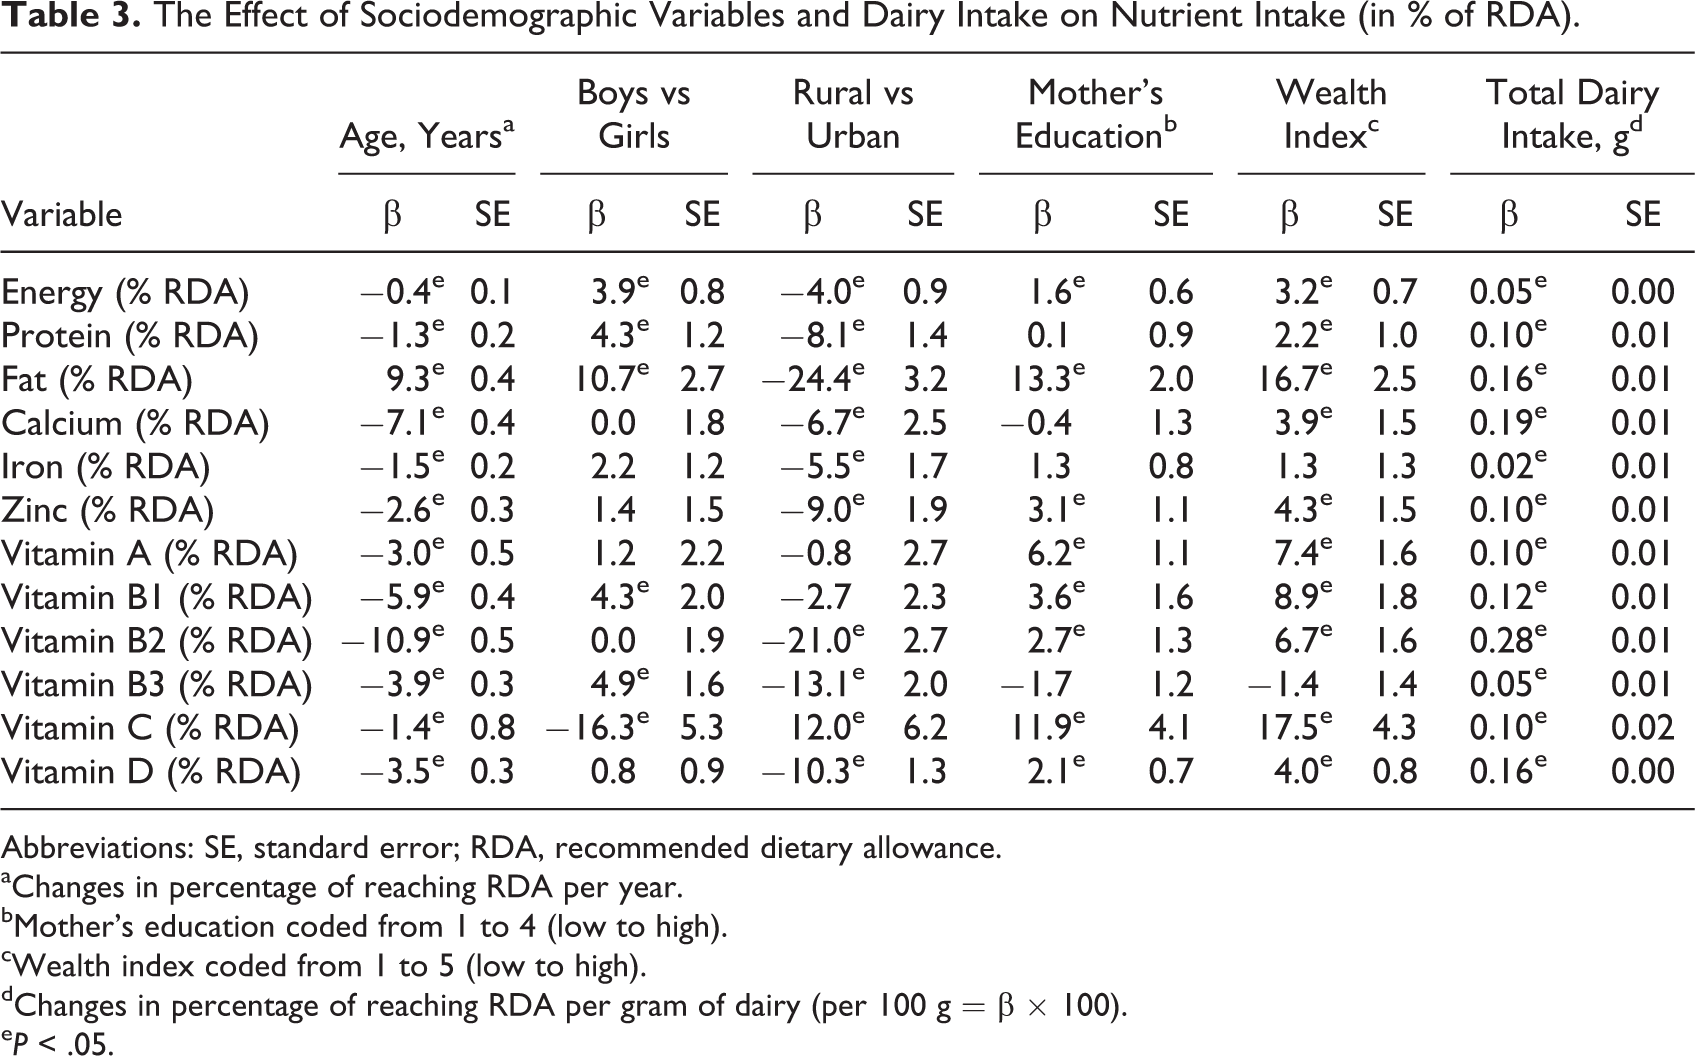
Abbreviations: SE, standard error; RDA, recommended dietary allowance.
aChanges in percentage of reaching RDA per year.
bMother’s education coded from 1 to 4 (low to high).
c Wealth index coded from 1 to 5 (low to high).
dChanges in percentage of reaching RDA per gram of dairy (per 100 g = β × 100).
e P < .05.
A higher percentage of dairy users met their nutrient requirements when compared to nondairy users (Table 4). Largest differences were observed for calcium, vitamin B2, and vitamin D. Percentage of dairy consumers was lower in older age-groups: 46% in the oldest children (9.0-11.9 years) versus 88% in the youngest children (1.0-2.9 years).
Median Nutrient Intakes as Percentage EAR and RDA in Dairy Users and Nondairy Users Per Age-Group.
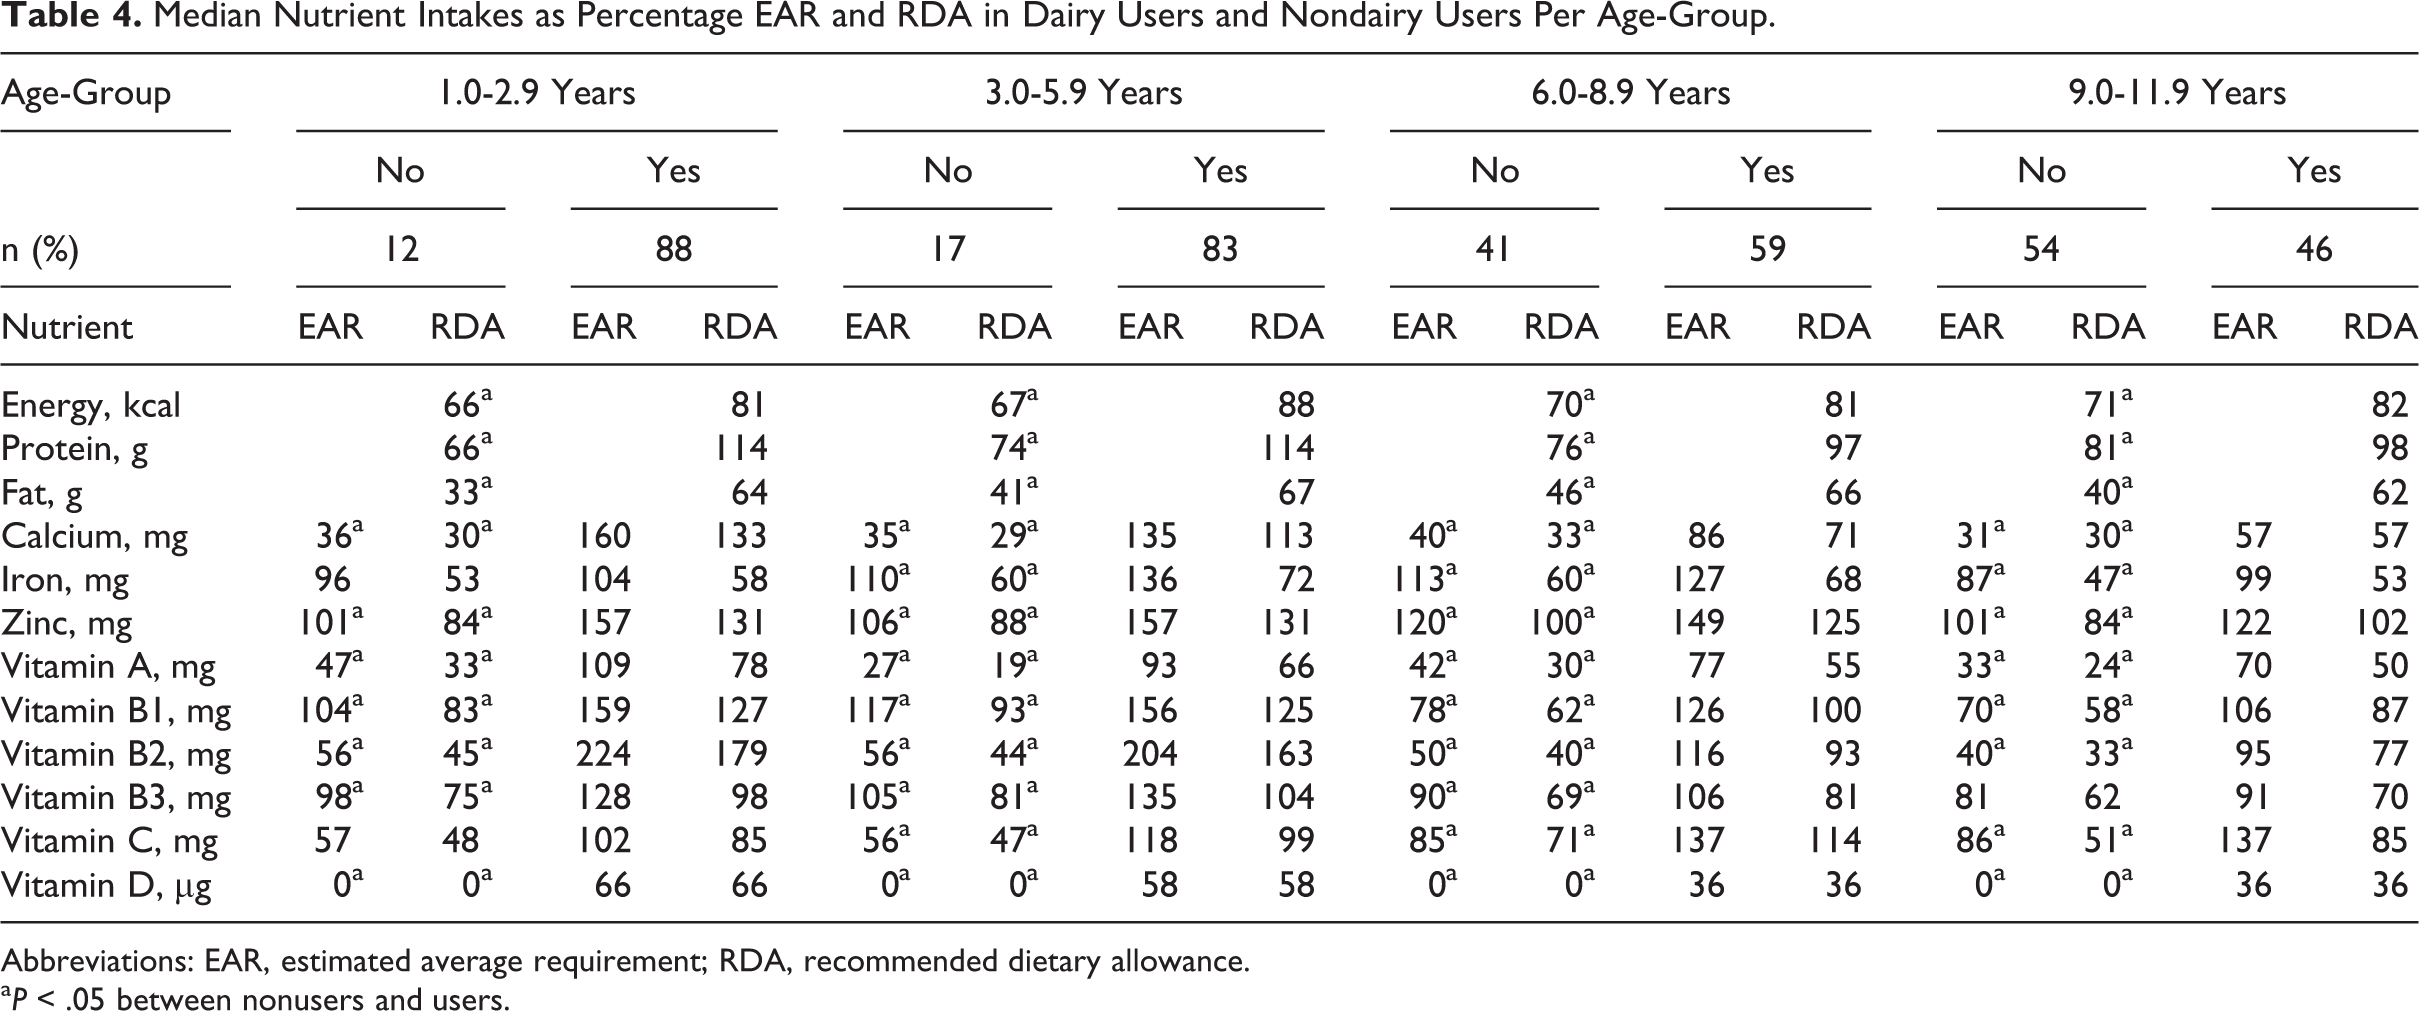
Abbreviations: EAR, estimated average requirement; RDA, recommended dietary allowance.
a P < .05 between nonusers and users.
Regression analysis showed that age was negatively associated with dairy intake (Table 5). Sex had no effect on intake of dairy products except for yoghurt beverage which was mainly consumed by girls. Rural children used fewer dairy products, especially milk powder, fresh milk, and yoghurt (and thus total dairy). Mother’s education did not have a significant effect on dairy consumption except for powder milk. In contrast, wealth was an important factor, with much lower intakes in middle- to low wealth classes compared to the higher income families. After correcting for age, sex, area of residence, and mother’s education, children from very poor and poor families consumed significantly less dairy than those from families with a reasonable wealth status, who in turn had lower dairy consumption that than children from well-off and rich families (Table 6).
The Effect of Sociodemographic Characteristics on the Intake of Various Dairy Products.
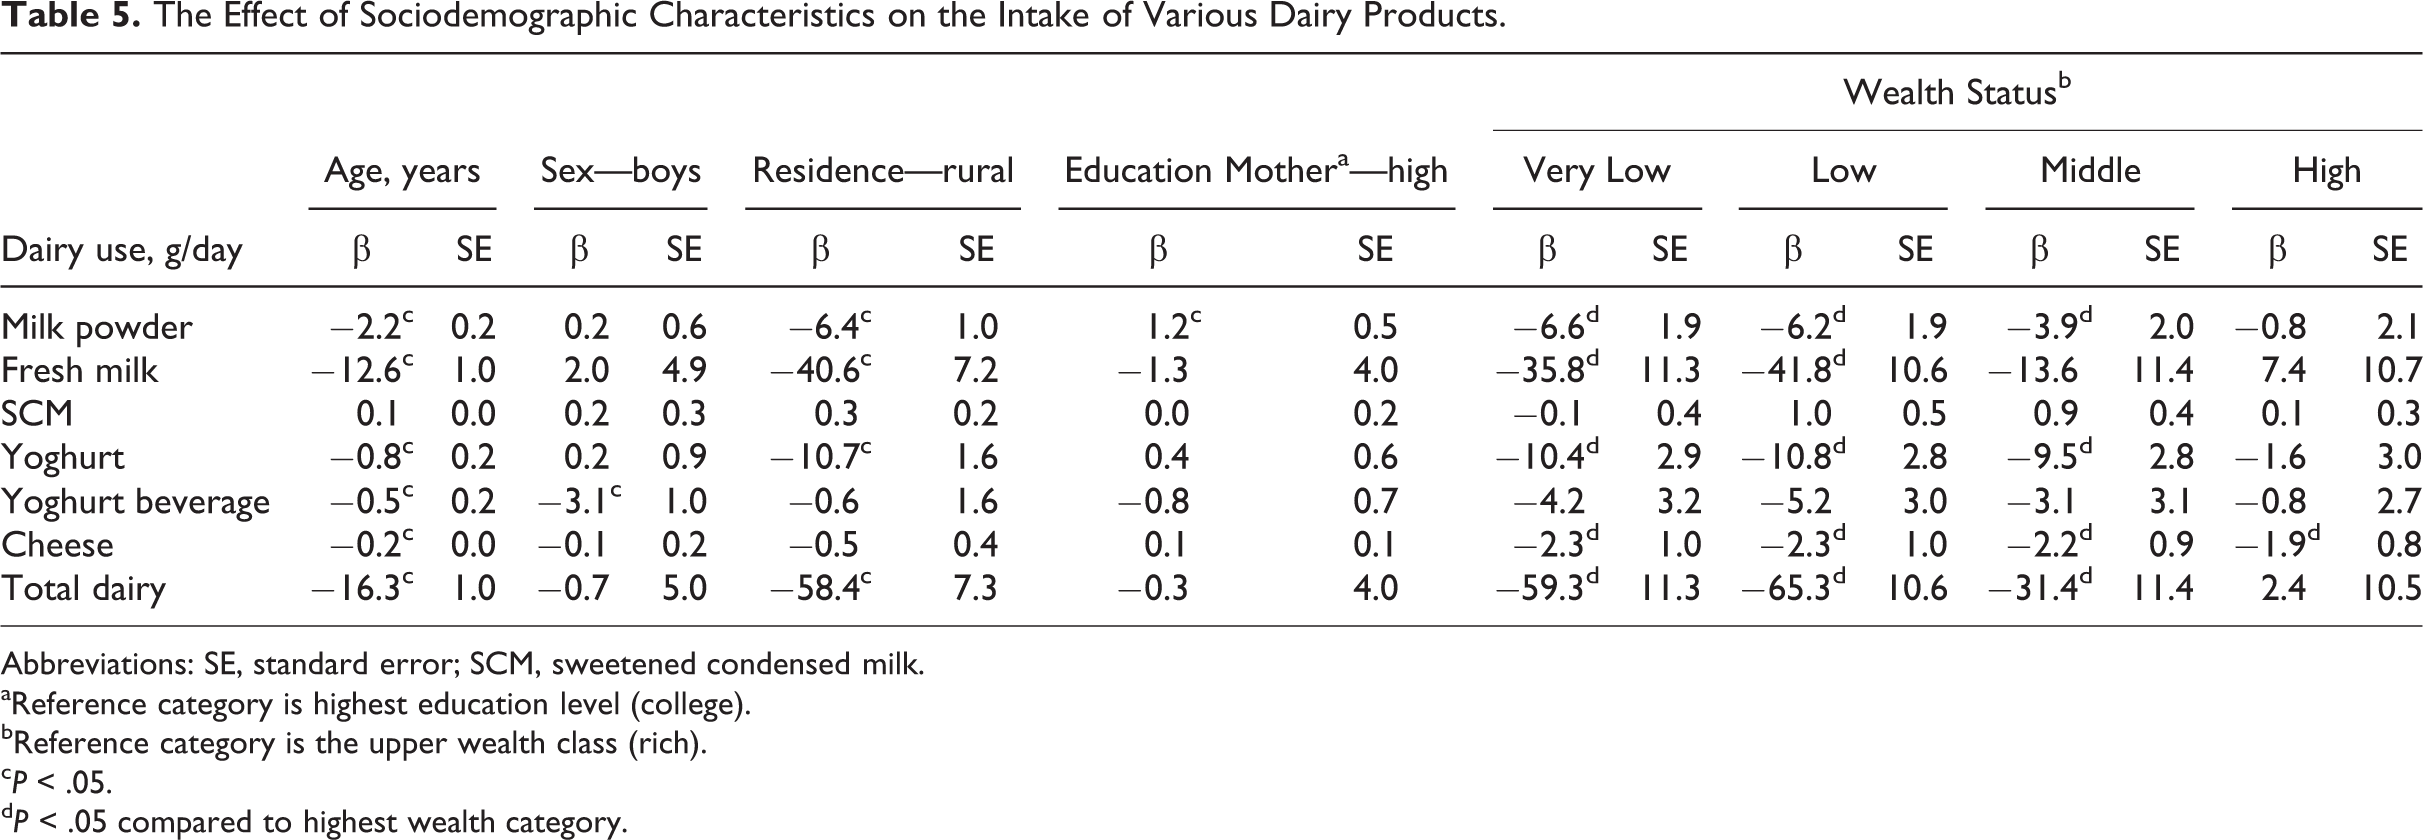
Abbreviations: SE, standard error; SCM, sweetened condensed milk.
aReference category is highest education level (college).
bReference category is the upper wealth class (rich).
c P < .05.
d P < .05 compared to highest wealth category.
Consumption of Dairy Products, by Wealth Group.a
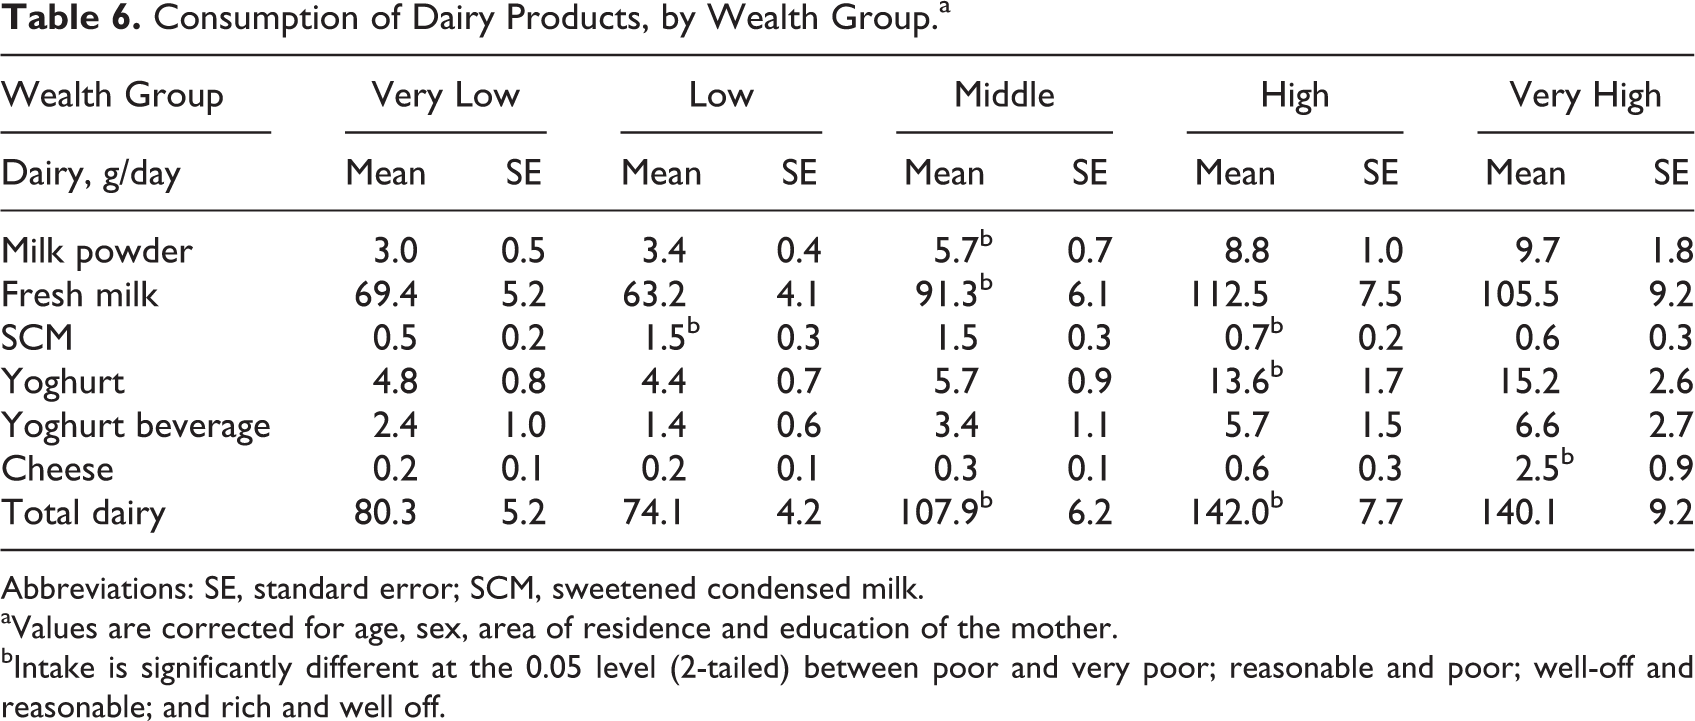
Abbreviations: SE, standard error; SCM, sweetened condensed milk.
aValues are corrected for age, sex, area of residence and education of the mother.
bIntake is significantly different at the 0.05 level (2-tailed) between poor and very poor; reasonable and poor; well-off and reasonable; and rich and well off.
Dairy consumption in urban and rural children in the 4 age-groups is listed in Table 7. The values are corrected for differences in sex, mother’s education, and wealth. Urban children consume substantially more dairy than rural children, and dairy intake was lower at older age, especially after the age of 5 years. Dairy contributed up to 28% of the total energy intake in the youngest age-group and was substantially lower in older age-groups with 17%, 5% and 3% of total energy intake deriving from dairy in the 3.0- to 5.9-year, 6.0- to 8.9-year, and 9.0- to 11.9-year-old children, respectively (data not shown).
Consumption of Dairy Products, by Age Group and by Area of Residence. a
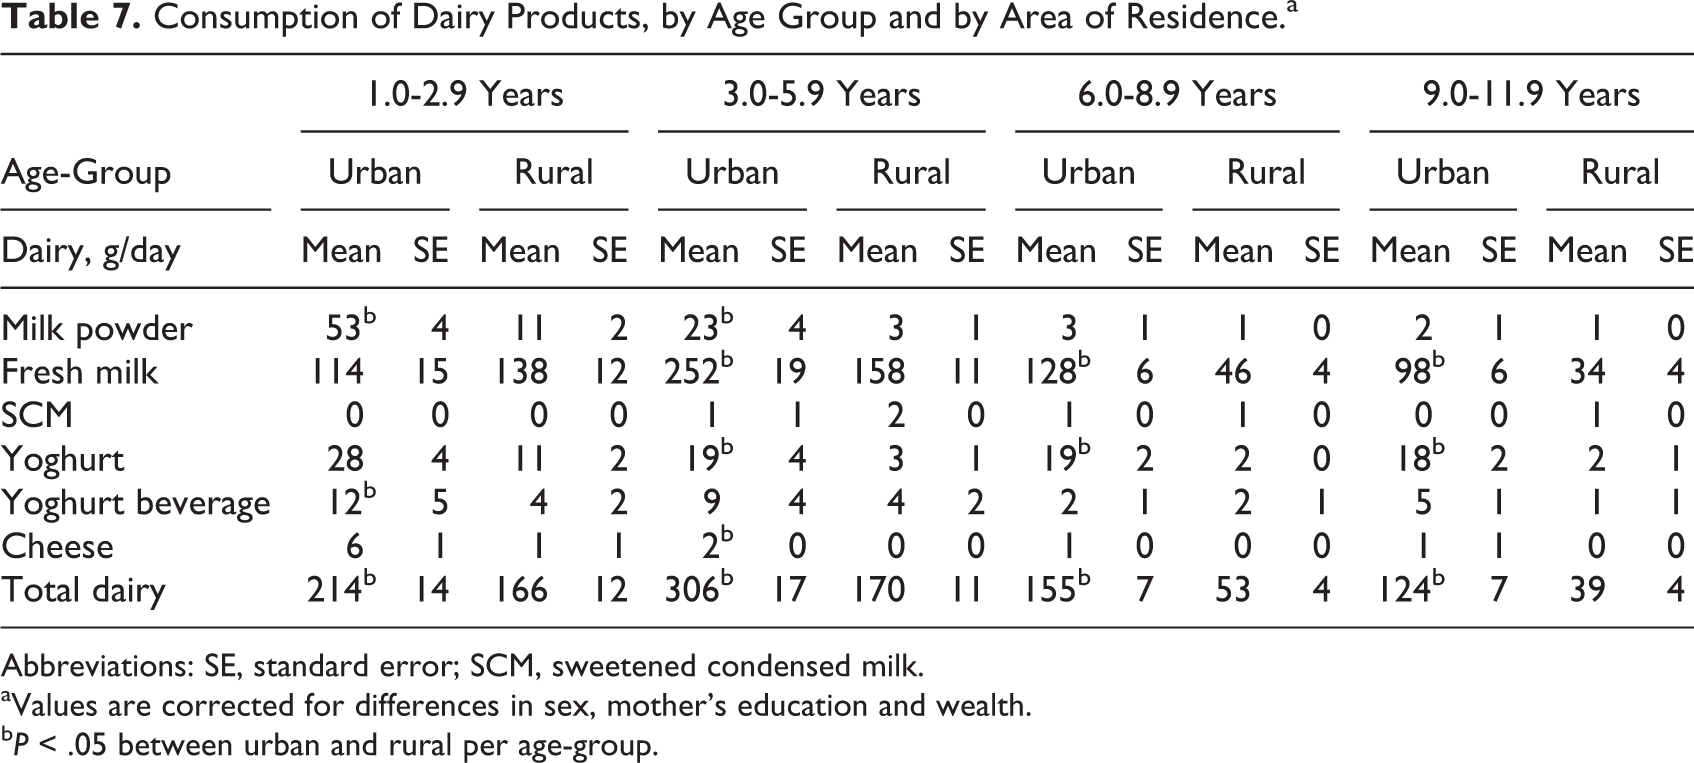
Abbreviations: SE, standard error; SCM, sweetened condensed milk.
aValues are corrected for differences in sex, mother’s education and wealth.
b P < .05 between urban and rural per age-group.
Discussion
This study shows that dairy can play an important role in the diet of Vietnamese preschool and school-aged children in order to meet their daily nutrient requirements. Consumption of 100 g of dairy contributed up to 28% RDA of assessed nutrients. Dairy consumption was lower at older age, especially in children older than 5 years, in children living in rural areas, and in children from poor to very poor families.
Intake of dairy-related nutrients such as protein, calcium, and the B-vitamins decreased from adequate intakes in preschool children to intakes below recommended levels in school-aged children. Since older children have higher nutrient requirements, fewer children over 5 years met the EAR than children below 5 years. Poorer diet quality among school-aged children compared to preschool children has also been observed in other countries in transition and nutrition assessments and strategies focusing mainly on young children might explain this finding. 8
In the current study, higher dairy intake was associated with significantly higher intakes of all assessed nutrients. Largest effects and strongest associations were found for vitamin B2, calcium, vitamin D, fat, vitamin B1, protein, vitamin A and zinc. These results are consistent with those from other studies. 29,30 It is known that dairy inherently has some of these nutrients (vitamin B2, calcium, fat, and protein) and can also serve as a good matrix for fortification of others. 18 As the overall intake of these nutrients is low compared to the daily nutrient requirements, dairy had a relatively large effect on the nutrient intake and thereby adds significantly to the improvement in the diet of children aged 1 to 11 years. Although this study shows a positive association between dairy use and total fat consumption, previous studies observed similar or lower fat intake in high milk users and highlighted that it is not correct to associate dairy-, and specifically, milk-rich diets with high-fat intakes. 29,31 It is suggested that consumption of dairy foods is associated with an overall better diet quality in children. 32 This might also explain positive and significant correlations found for nutrients that are naturally not, or in negligible levels, present in dairy.
This study indicates that 100 g of dairy per day can increase nutrient intake adequacy of assessed nutrients (except for energy, iron, and vitamin B3) with 10% to 28%. However, mean dairy intake in children from very-low- and low-wealth families and in school-aged children living in rural areas was below this amount. Higher dairy intake was observed in children from families with a higher wealth index, indicating that the poor, the rural poor in particular, are far more likely to have low dairy intakes. 30,33 Socioeconomic factors and culturally determined food preferences are known to affect food choices, 34,35 and urbanization is a well-known trigger of consumption of animal products, 33 sugars, and dietary diversification. 36 Availability and accessibility of dairy products (eg, milk powder and [drink] yoghurt) might further explain intake differences between urban and rural areas. 34,37 In contrast to other studies, 30,33 no consistent positive relation was found between education of the mother and dairy product intakes, except for milk powder. This might suggest that knowledge about the value of dairy is still inadequate, and thus the beneficial effects of dairy should be included in education programs.
Total dairy intake was substantially lower in older children, especially after the age of 5 years. A lack of knowledge and the low dairy intake levels observed in Vietnamese adults 23 might partly explain lower dairy intakes in older age-groups, viewing parental modeling as one of the environmental aspects. 33,38 There is also a trend in older children to substitute milk for sweetened carbonated drinks, 31,39 and economic factors could also play a role. Lactose intolerance should not be a limiting factor, since most people with presumed lactose intolerance or maldigestion can tolerate 12 to 15 g of lactose per consumption moment which is about 250 mL of milk. 40
Underreporting in dietary assessments is a known problem, 41 and this may be one of the limitations in this study. Second, the assessment was only focused on associations between nutrients and energy from dairy in general and not from specific dairy products. Milk and cheese have a different effect on nutrient intake, 29 which should be considered in daily dairy recommendations. For this study, in particular, it is important to note that the cheese consumption was low, and therefore, we do not expect it to have substantially influenced the nutrient intake. In addition, since the original study was not designed for assessing specific dairy item intakes, dairy products were categorized into 6 dairy groups, and nutrient contribution of total dairy was based on an average nutrient composition per dairy product group, in which flavored products are not included. 18 This report includes only a selection of nutrients of which some are predictive for the role of dairy in the diet. However, since milk is also relatively high in folate, 19 pantothenic acid and B12, and magnesium, 18 these nutrients should be taken into account to fully understand the potential contribution of milk to diet adequacy.
In conclusion, dairy can help Vietnamese children meet their daily nutrient requirements of all assessed nutrients. The observed low dairy intake levels confirm that the dietary pattern, especially in school-aged children requires attention and that increased intake from dairy fortified with iron and vitamin D should be considered. Age, area of residence, and wealth status influence the consumption of dairy products. It is recommended to develop cultural sensitive education messages that increase awareness of the role of dairy, 42,43 even for those with presumed lactose intolerance and to make the current Vietnamese dairy intake recommendation more specific. Increasing dairy intake, in combination with other foods such as fruits and vegetables, seems to be a good starting point to complete the nutrient intake of preschool and school-aged children.
Footnotes
Appendix A
Nutrient Composition of Included Dairy Products (per 100 g) as Used in the Nutrisoft Program
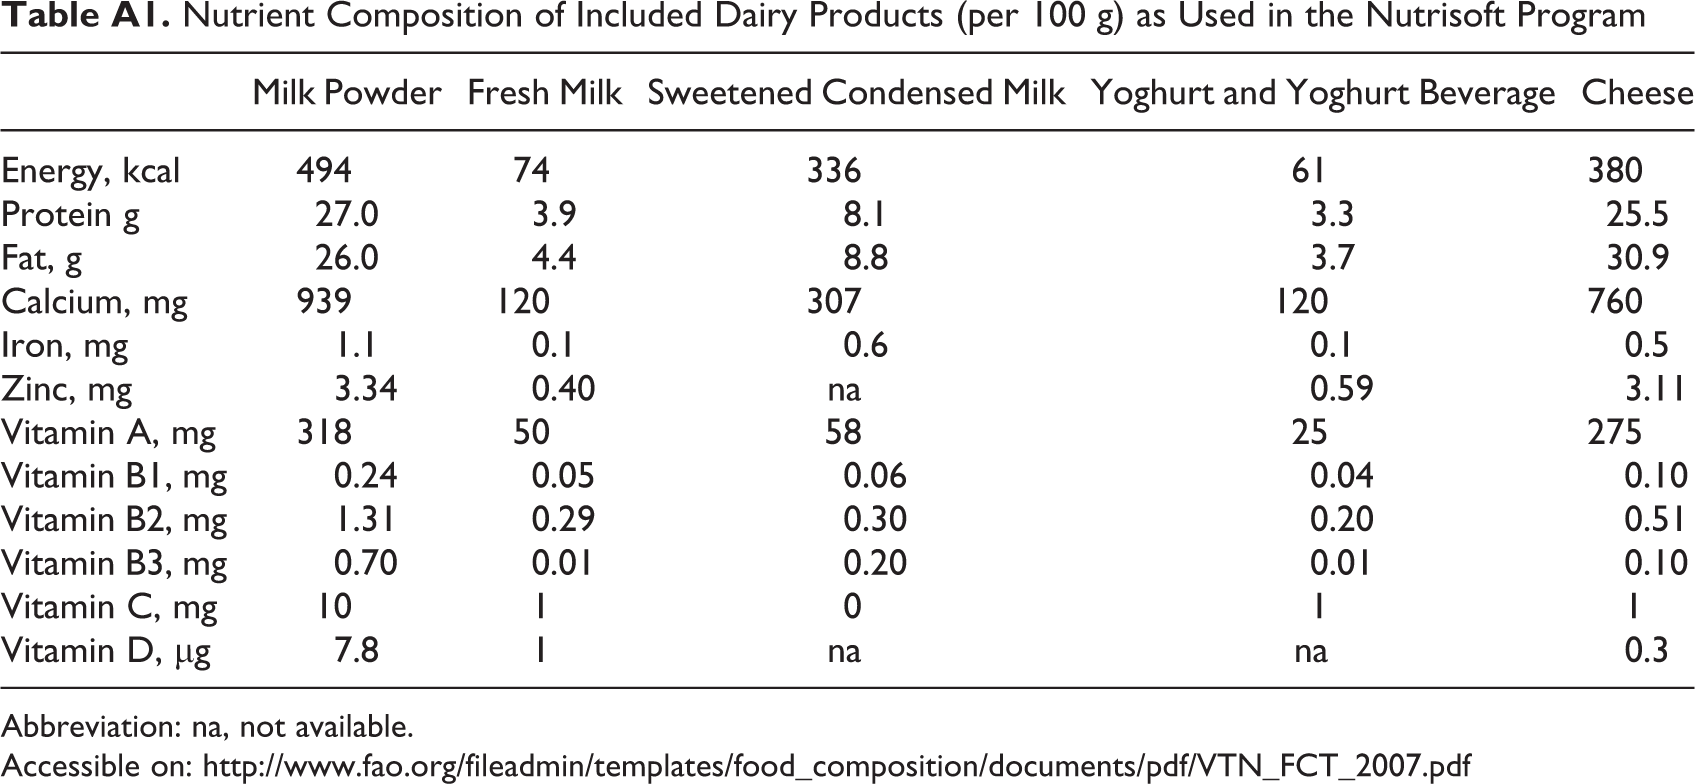
| Milk Powder | Fresh Milk | Sweetened Condensed Milk | Yoghurt and Yoghurt Beverage | Cheese | |
|---|---|---|---|---|---|
| Energy, kcal | 494 | 74 | 336 | 61 | 380 |
| Protein g | 27.0 | 3.9 | 8.1 | 3.3 | 25.5 |
| Fat, g | 26.0 | 4.4 | 8.8 | 3.7 | 30.9 |
| Calcium, mg | 939 | 120 | 307 | 120 | 760 |
| Iron, mg | 1.1 | 0.1 | 0.6 | 0.1 | 0.5 |
| Zinc, mg | 3.34 | 0.40 | na | 0.59 | 3.11 |
| Vitamin A, mg | 318 | 50 | 58 | 25 | 275 |
| Vitamin B1, mg | 0.24 | 0.05 | 0.06 | 0.04 | 0.10 |
| Vitamin B2, mg | 1.31 | 0.29 | 0.30 | 0.20 | 0.51 |
| Vitamin B3, mg | 0.70 | 0.01 | 0.20 | 0.01 | 0.10 |
| Vitamin C, mg | 10 | 1 | 0 | 1 | 1 |
| Vitamin D, μg | 7.8 | 1 | na | na | 0.3 |
Abbreviation: na, not available.
Acknowledgments
The authors thank the staff of the Department of Occupational and School Nutrition, the Department of Nutrition Surveillance and Policy and the Department of Community Nutrition, who participated in the data collection as members of the field team of the Vietnamese SEANUTS. They are also grateful to Dr Nguyen Thi Quynh Nga (Dutch Lady Vietnam) for her help with the logistics of the study, Dr Ilse Khouw (FrieslandCampina) and Dr Panam Parikh (FrieslandCampina) for supervising the project, and Dr Panam Parikh as well for critically reviewing the manuscript.
Authors’ Note
Anne Schaafsma was the project leader of SEANUTS and participated in writing of the study protocols as well as evaluation of the study results. Khanh Le Nguyen Bao, Paul Deurenberg, and Hop Le Thi designed and supervised the study. Bui Van Tuoc, Nguyen Dinh Dung, Van Anh Nguyen Do, and Nga Tran Thuy ensured the quality of the data and made a substantial contribution to the local implementation of the study. Nguyen Huu Chinh, Tran Thanh Do, and Paul Deurenberg assisted in the analysis and interpretation of the data. Minke R. Burgers made major contributions in writing this manuscript. All authors critically reviewed the manuscript, had access to all data at all times, and had primary responsibility for the final content of the manuscript. None of the authors or the research institutes has a conflict of interest. The results of the study will be used by FrieslandCampina, but it had no influence on the outcome of the study. FrieslandCampina provided funding for the SEANUTS, but it was not involved in the recruitment of the participants, cognitive performance testing and the final set of the results.
Declaration of Conflicting Interests
The author(s) declared no potential conflicts of interest with respect to the research, authorship, and/or publication of this article.
Funding
The author(s) disclosed receipt of the following financial support for the research, authorship, and/or publication of this article: The study was funded by FrieslandCampina and staff who participated in the data collection derived from the Department of Occupational and School Nutrition, the Department of Nutrition Surveillance and Policy and the Department of Community Nutrition. Study ID number and registration website: NTR2462—![]() .
.