
Abstract
Background:
The prevalence of stunting, thinness, overweight, and obesity among children differs by ethnicity. It is not known whether differences in body build across the ethnic groups influence the interpretation of nutritional parameters.
Objective:
To explore the differences in body build across the 5 main ethnic groups in Malaysia and to determine whether differences in body build have an impact on the interpretation of nutrition indicators.
Methods:
A total of 3227 children aged 2.0 to 12.9 years who participated in the South East Asian Nutrition Surveys (SEANUTS) in Malaysia were included in this analysis. Body weight, height, sitting height, wrist and knee breadths, and biceps and subscapular skinfolds were measured, and relative leg length, slenderness index, and sum of skinfolds were calculated. Z scores for height-for-age (HAZ) and body mass index-for-age (BAZ) were calculated using the World Health Organization (WHO) 2007 growth standards.
Results:
Differences in relative leg length and slenderness across the ethnic groups were correlated with HAZ and BAZ. Correction for differences in body build did, in some ethnic groups, have significant impact on the prevalence of stunting, thinness, overweight, and obesity, and the pattern of prevalence across ethnic groups changed.
Conclusion:
At the population level, corrections for body build had only minor and mostly nonsignificant effects on prevalence, but at an individual level, corrections for body build placed a substantial number of children in different height or weight categories. Whether these misclassifications warrant additional assessment of body build in clinical practice will need further investigation.
Introduction
Many countries in Southeast Asia, including Malaysia, suffer from the double burden of malnutrition. A recent country-wide Malaysian study 1 in children aged 0.5 to 12.9 years reported a prevalence of 8.3% stunting in urban children and 8.8% in rural children. The prevalence of overweight and obesity was 9.7% and 12.7% in urban and 6.0% and 9.9% in rural areas, respectively.
For the classification of stunting and weight status, namely, thinness, overweight, and obesity, Z scores for height-for-age (HAZ) and body mass index-for-age (BAZ) as proposed by World Health Organization (WHO) are normally used. 2,3 These standards are based on a large international data set, 4 including US data, but it is arguable whether those international standards are preferable over local references. 5 Local growth references, if available, may be more suitable as they do not “a priori” assume that every population or ethnic group has the same growth potential. However, standards such as the WHO standards have their value for international comparisons as these provide a common yard stick. 5
Growth, from birth till adulthood, is not a linear process. 6,7 Newborns have a relatively high trunk length compared to leg length, and during growth, the legs grow faster than the trunk. In children and adults, there are differences in relative (to height) leg length across ethnic groups, even though the variations within ethnic groups are large. 6 These differences may have an effect on the interpretation of international height standards 8 as well as relationships with body composition. 9 –11 One could raise the question of whether a child with relatively short legs can reach the full height of an international standard. There are also studies that connect relative leg length with the quality of childhood nutrition, 12,13 but conclusive evidence for this is lacking. Some studies suggest relative leg length as a marker for the risk of noncommunicable chronic diseases such as hypertension and coronary heart disease. 14,15
At present, the body mass index (BMI) is widely used as a weight corrected for height parameter. Body mass index is age dependent, 2,3,16 and for the classification of weight status of children, the WHO has developed the BAZ. Weight is the sum of various tissues, including skeletal, connective, and muscle tissues and adipose tissue. Not every individual has the same skeletal build (frame), and a person with a slender frame will not only have less bone mass but also have less connective tissue mass and less muscle mass. Thus, slender individuals have a lower BMI and a lower BAZ, independent of fat mass. 10,11 Also, a person with relatively short legs will have a higher BMI compared to a long-legged person of the same height, as the weight per cm is higher in the trunk (plus head plus arms) than in the legs. In adults, these effects can influence BMI values by up to 5 kg/m2. 17 These possible effects of relative leg length and slenderness on height and BMI warrant the study of their effects on the interpretation of HAZ and BAZ. This is especially crucial in a population consisting of different ethnic groups with differences in body build.
The Malaysian population consists of 5 main ethnic groups, namely, Malays, Chinese, Indians, Sarawak, and Sabah indigenous people (also known as “bumiputra”). 18 In neighboring Singapore, Indian adults are known to have relatively longer legs than their Chinese and Malays counterparts, and the Malays have stockier body build than the Indians and the Chinese. 19 To the best of our knowledge, information about body build is not known for the Malays, Sarawak, and Sabah bumiputra children in Malaysia. Also, recent prevalence of stunting, thinness, overweight, and obesity has not been published separately for these groups in Malaysia.
Thus, the aim of this article was to explore whether there are differences in body build across the 5 main ethnic groups in Malaysia and whether possible differences in body build have an impact on the interpretation of the nutritional parameters HAZ (stunting) and BAZ (thinness, overweight, and obesity).
Methods
Study Design
A total of 3542 children aged 0.5 to 12.9 years participated in the South East Asian Nutrition Surveys (SEANUTS) in Malaysia. Using stratified random sampling, these children were recruited from nurseries, kindergartens, and schools in 6 regions of Malaysia. 1 The list of kindergartens and schools was obtained from the Department of Social Welfare, the Department of Community Development, and the Ministry of Education, and permission to carry out data collection was granted by the relevant authorities. The study population comprised apparently healthy boys and girls from all main ethnic groups in Malaysia, living in either urban or rural areas. Details of the study protocol have been published elsewhere. 1,20
Of the 3542 children who participated in SEANUTS Malaysia, 99% (n = 3508) belonged to one of the 5 main ethnic groups in Malaysia: Malay, Chinese, Indian, Sarawak bumiputra, and Sabah bumiputra. In children younger than 2 years, sitting height was not measured. Furthermore, sitting height, knee breadth, or wrist breadth was missing or unrealistic in 78 children (from 1% in Indians to 3.3% in Malays); hence, data of 3227 children were used in the current statistical analyses. The 78 excluded children did not differ in HAZ or BAZ values but were younger (mean age difference, 1.5 years) and because of that had lower body weight and height.
Ethics Approval and Informed Consent
The study was conducted according to the guidelines of the Declaration of Helsinki. The study protocol was approved by the Medical Research Ethics Committee of the Universiti Kebangsaan Malaysia, and was registered in the Dutch Trial Registry (NTR2462). Parents or guardians of the children gave written, informed consent, and verbal consent was obtained from each child before measurements.
Demographic and Anthropometric Assessment
Structured questionnaires were used to obtain information on sociodemographic variables, including area of residence (urban or rural) and ethnic background of the parents (Malay, Chinese, Indian, Sarawak bumiputra, Sabah bumiputra, and “others”).
Weight was measured to the nearest 0.1 kg with a calibrated digital scale (Model 803; SECA, Hamburg, Germany) in light indoor clothing. Height was measured using a portable stadiometer (Model 213; SECA) to the nearest 0.1 cm, barefooted, heels together, feet spread at an angle of about 45°, and Frankfurt plane horizontal. Body mass index was calculated as weight/height squared (kg/m2). The HAZ and BAZ were calculated using the WHO growth standards. 2,3 Sitting height was measured with the child sitting on a flat stool with hard surface and otherwise following the same procedure as for the height measurement. The height of the stool was subtracted from the measurement. Leg length was calculated as height minus sitting height, and relative leg length (relleg, %) was calculated as 100 × leg length/height.
Biceps and subscapular skinfolds were measured to the nearest 0.2 mm in triplicate on the left side of the body using a Harpenden skinfold caliper (British Indicators, West Sussex, United Kingdom). Wrist breadth was measured to the nearest 0.1 cm with a Harpenden anthropometer (Holtain Ltd, Crymych, United Kingdom) at the left side over the distal ends of the radius and the ulna. Knee breadth was measured to the nearest 0.1 cm over the left femur condyles in a sitting position with the knee flexed at a 90° angle. Adequate pressure was applied to ensure minimal contribution of the soft tissue on the measured breadth. The slenderness index was calculated as height divided by sum of wrist and knee breadth (cm/cm) as a measure of frame size. 10 A higher index is indicative of a more slender body build or smaller body frame.
Statistical Analysis
Statistical analyses were done using SPSS for Windows (version 20.0.0; IBM Corporation, New York) and using weight factors based on the population census of Malaysia 2010. 21 Differences between groups were tested using analysis of covariance techniques after correction for possible confounders and subsequently using the “least significant difference” method in adjustments for multiple comparisons. Corrected values (for body build) of BAZ and HAZ were calculated using the regression coefficients for relative leg length or slenderness with BAZ and HAZ for the total population, respectively: HAZcorrected = HAZ + (47.14 − relleg) × 0.087 and BAZcorrected = BAZ + (10.60 − slender) × −0.712, where 47.14 and 10.60 are the weighted mean values of relative leg length and slenderness, respectively, and 0.087 and −0.712 are the regression coefficients. The prevalence of stunting, thinness, overweight, and obesity was calculated from (corrected) HAZ and (corrected) BAZ values using the cutoff points as suggested by WHO. 2,3 Differences in prevalence before and after correction were tested with nonparametric “related sample McNemar test.” Values are expressed as mean and standard error (SE). Level of significance was set at P < .05.
Results
The anthropometric characteristics of the children in the 5 ethnic groups are shown in Table 1. Chinese children were the heaviest, and together with the Indian children, were the tallest compared with other ethnic groups. There was no difference in age and BMI across the ethnic groups, and the groups did not differ in skinfold thickness, even after correcting for age, sex, and area of residence (urban/rural). Individual relative leg length ranged from 39.4% to 53.8%, where Chinese, Sarawak, and Sabah bumiputra children had the shortest legs and Indian children had the longest legs. Individual slenderness ranged from 7.83 (very stocky build) to 14.53 (very slender body build), where Indian children had the most slender body build and the Sabah bumiputra children the most stocky body build.
Anthropometric Characteristics of the Children.a,b
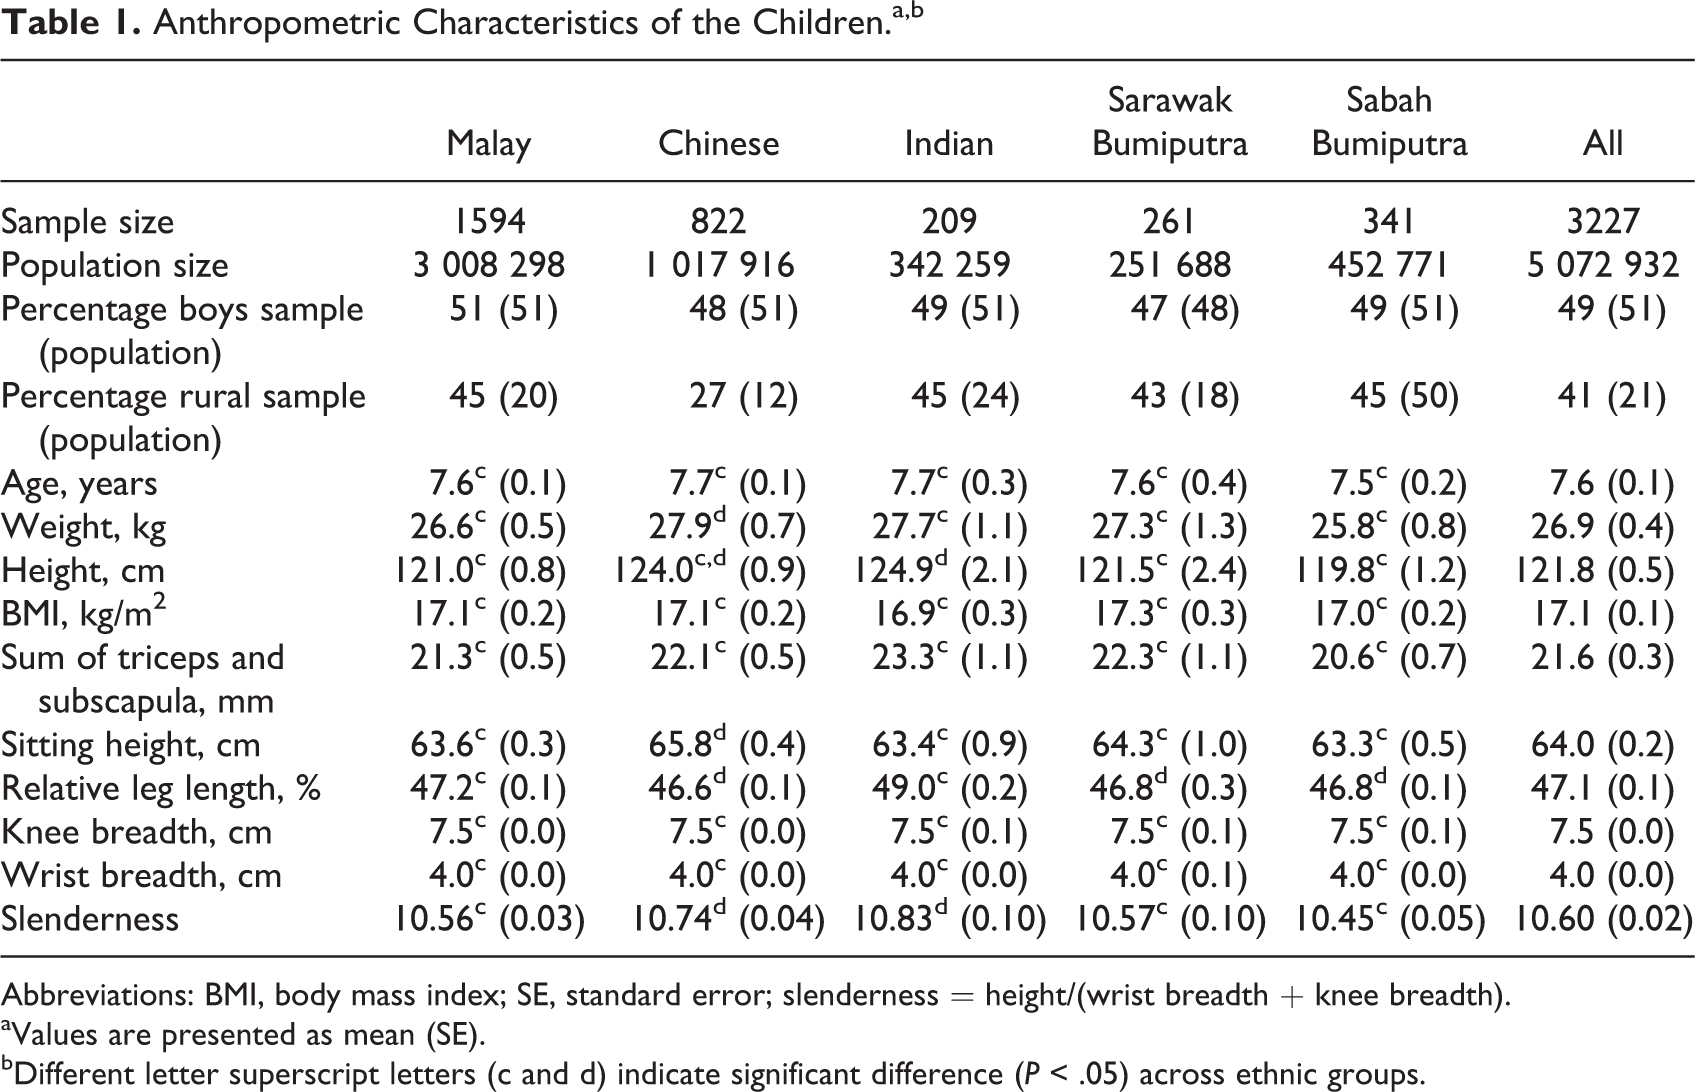
Abbreviations: BMI, body mass index; SE, standard error; slenderness = height/(wrist breadth + knee breadth).
aValues are presented as mean (SE).
bDifferent letter superscript letters (c and d) indicate significant difference (P < .05) across ethnic groups.
The relative leg length and slenderness was higher at older age (Figure 1). The slope of the relationship of relative leg length with age (taking sex and area of residence into account) was not different between the 5 ethnic groups (not shown). However, the intercept was 1.8 ± 0.2 percentage point higher for the Indian children, and it was lower for the Chinese (−0.6 ± 0.1), Sabah bumiputra (−0.4 ± 0.1), and Sarawak bumiputra children (−0.4 ± 0.2) as compared to the Malay children. Sex did not influence the slope, but urban children had 0.2 ± 0.1 percentage point higher relative leg length (all values P < .05). Comparatively, the relationship of the slenderness index with age was less steep, while the slope did not differ between the 5 ethnic groups (results not shown). Girls had a 0.45 ± 0.04 higher slenderness index than boys (P < .05). The slenderness index was 0.18 ± 0.04 (P < .05) higher in Chinese and 0.27 ± 0.07 (P < .05) higher in the Indian children compared to Malay children, after correcting for age, sex, and area of residence. Malays, Sarawak, and Sabah bumiputra children did not differ in slenderness. Because of the confounding effects of age, sex, and area of residence, these factors were corrected for in subsequent analyses.
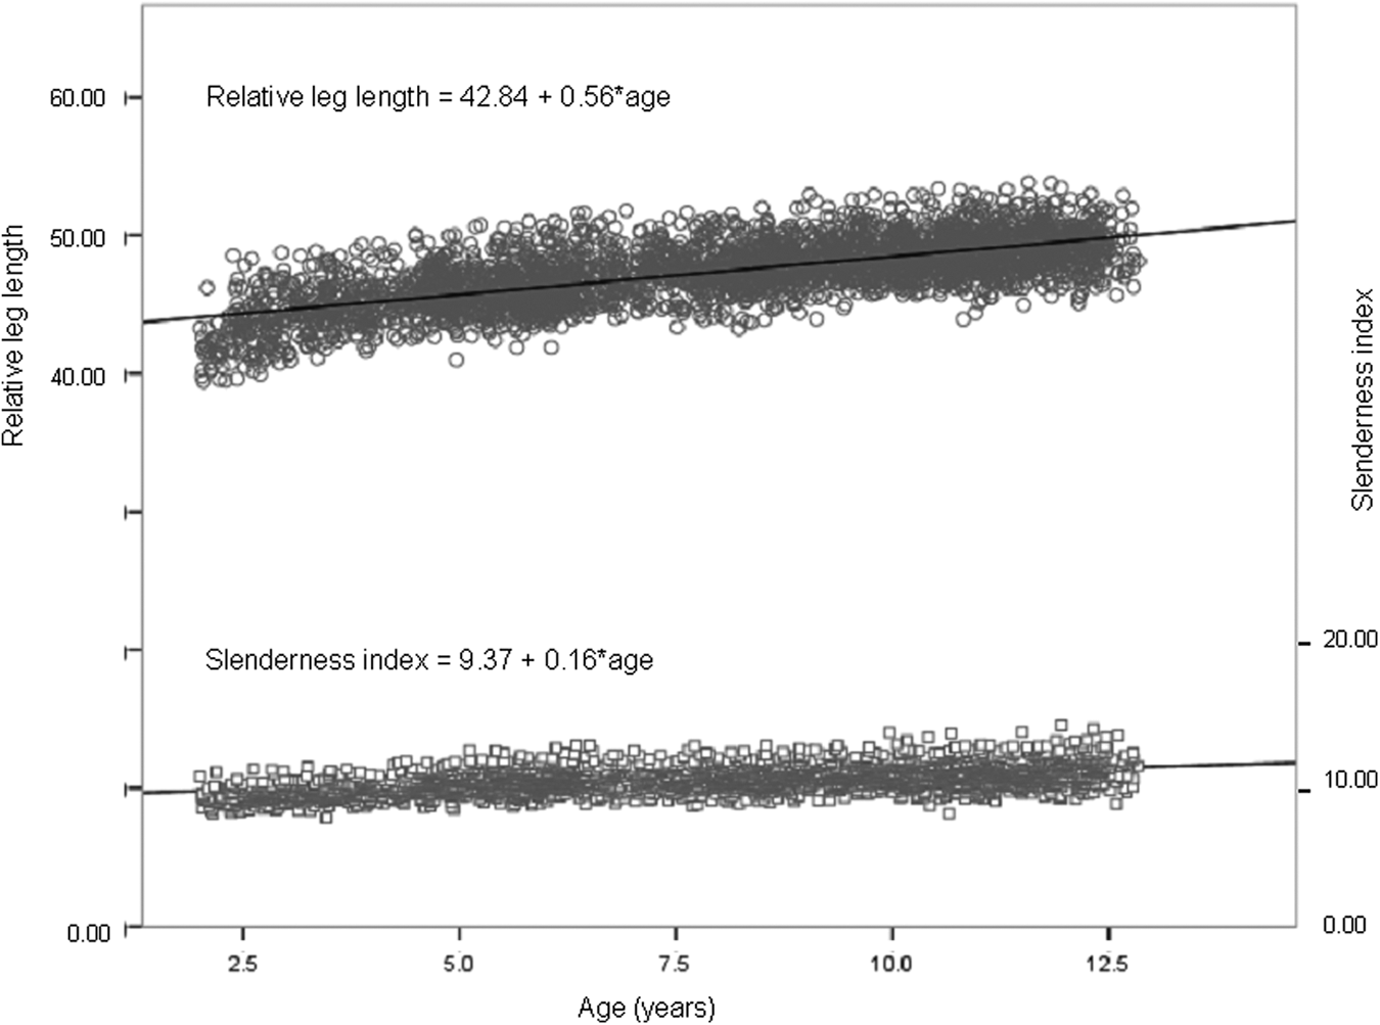
The relationship of slenderness index and relative leg length with age.
As seen in Table 2, relative leg length was inversely associated with BMI and BAZ and positively associated with HAZ. This means that children with shorter legs had higher BMI, higher BAZ, but lower HAZ values. Slenderness was negatively associated with BMI and BAZ. When comparing relative leg length and slenderness in stunted versus nonstunted children and in thin, normal-weight, overweight, and obese children (Table 3), stunted children were slightly stockier (not significant) and had shorter legs (P < .001). Thin children had a more slender body build than normal-weight children, and with increasing weight status, the slenderness index was lower. Relative leg lengths did not differ between thin, normal-weight, and overweight children, but obese Malays, Chinese, and Indian children had significantly shorter legs. Excluding the very obese children (BAZ > 3) did not change this finding.
Partial Correlation of BMI, BAZ, and HAZ With Relative Leg Length, Slenderness, and Sum of Skinfolds in Boys and Girls.a
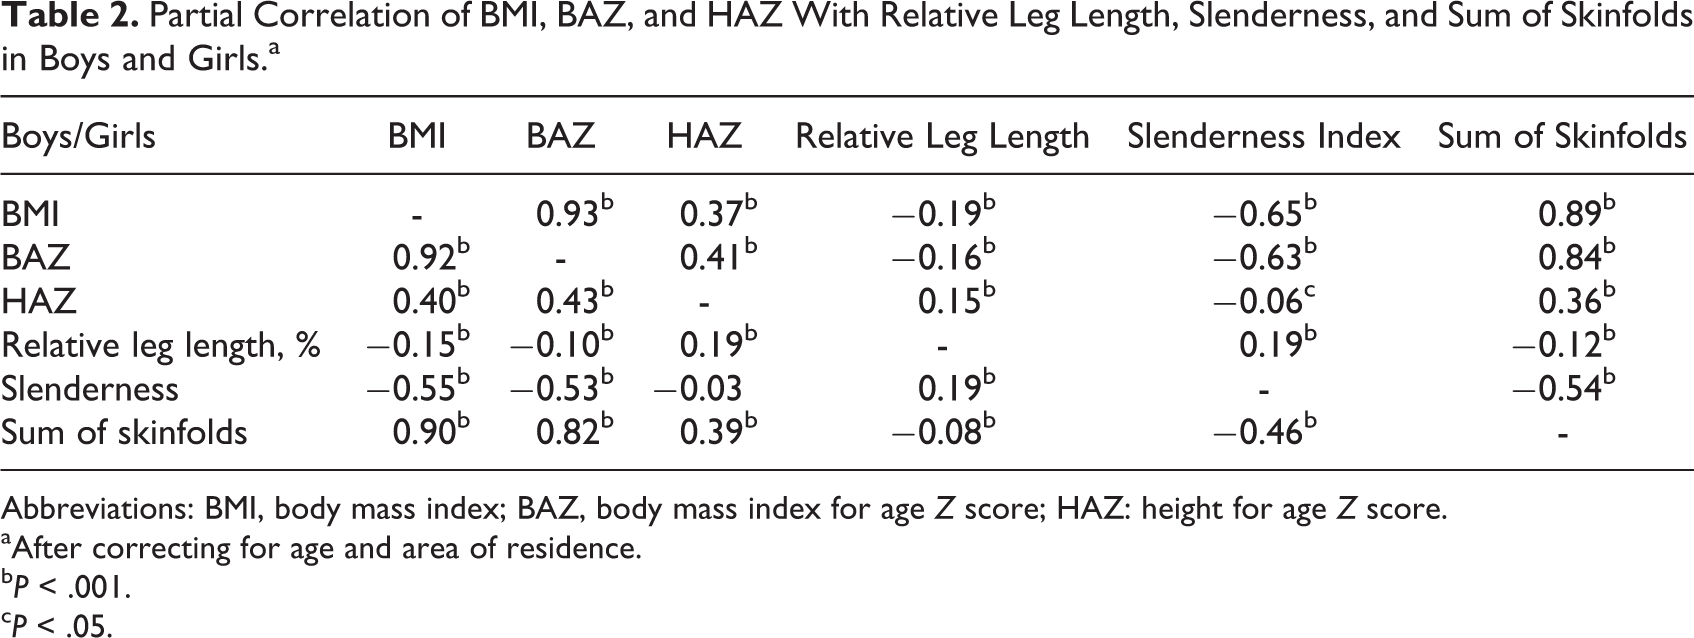
Abbreviations: BMI, body mass index; BAZ, body mass index for age Z score; HAZ: height for age Z score.
aAfter correcting for age and area of residence.
b P < .001.
c P < .05.
Relative Leg Length and Slenderness in Stunted Versus Nonstunted Children and in Thin, Normal-Weight, Overweight, and Obese Children.a
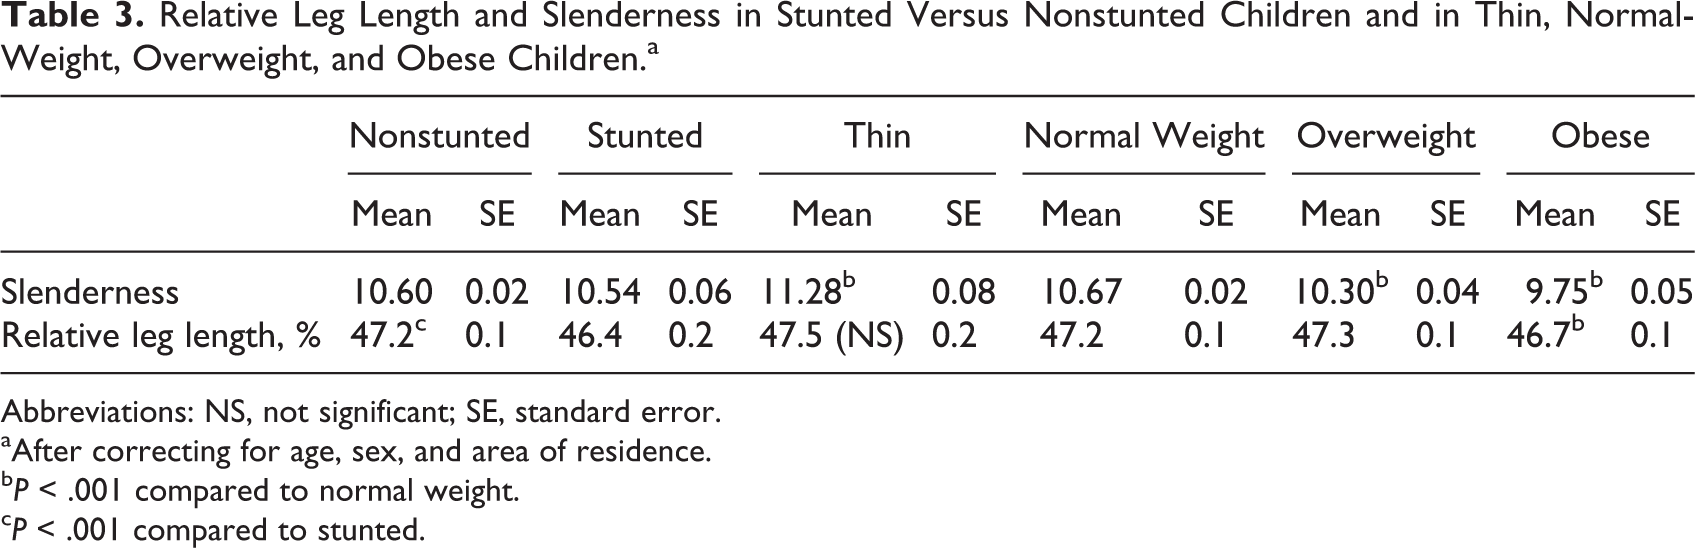
Abbreviations: NS, not significant; SE, standard error.
aAfter correcting for age, sex, and area of residence.
b P < .001 compared to normal weight.
c P < .001 compared to stunted.
Table 4 shows the HAZ and BAZ values for the 5 ethnic groups, with and without correction for body build in addition to correction for age, sex, and area of residence. Although the correction resulted in sometimes large differences in mean values, the differences did not reach statistical significance. However, note the differences in BMI, HAZ, or BAZ across the ethnic groups before and after correction. Without correction for body build, the Indian children had the lowest BAZ, but after correcting for their long relative leg lengths, their BAZ was highest. Likewise, their highest (among the ethnic groups) mean HAZ was substantially lowered after correcting for relative leg length. After correction for slenderness, the correlation of BAZ with the sum of triceps and subscapular skinfold was slightly higher compared to the uncorrected BAZ value (0.81 vs 0.77).
HAZ and BAZ Values in the 5 Ethnic Groups With and Without Correction for Body Build.a,b
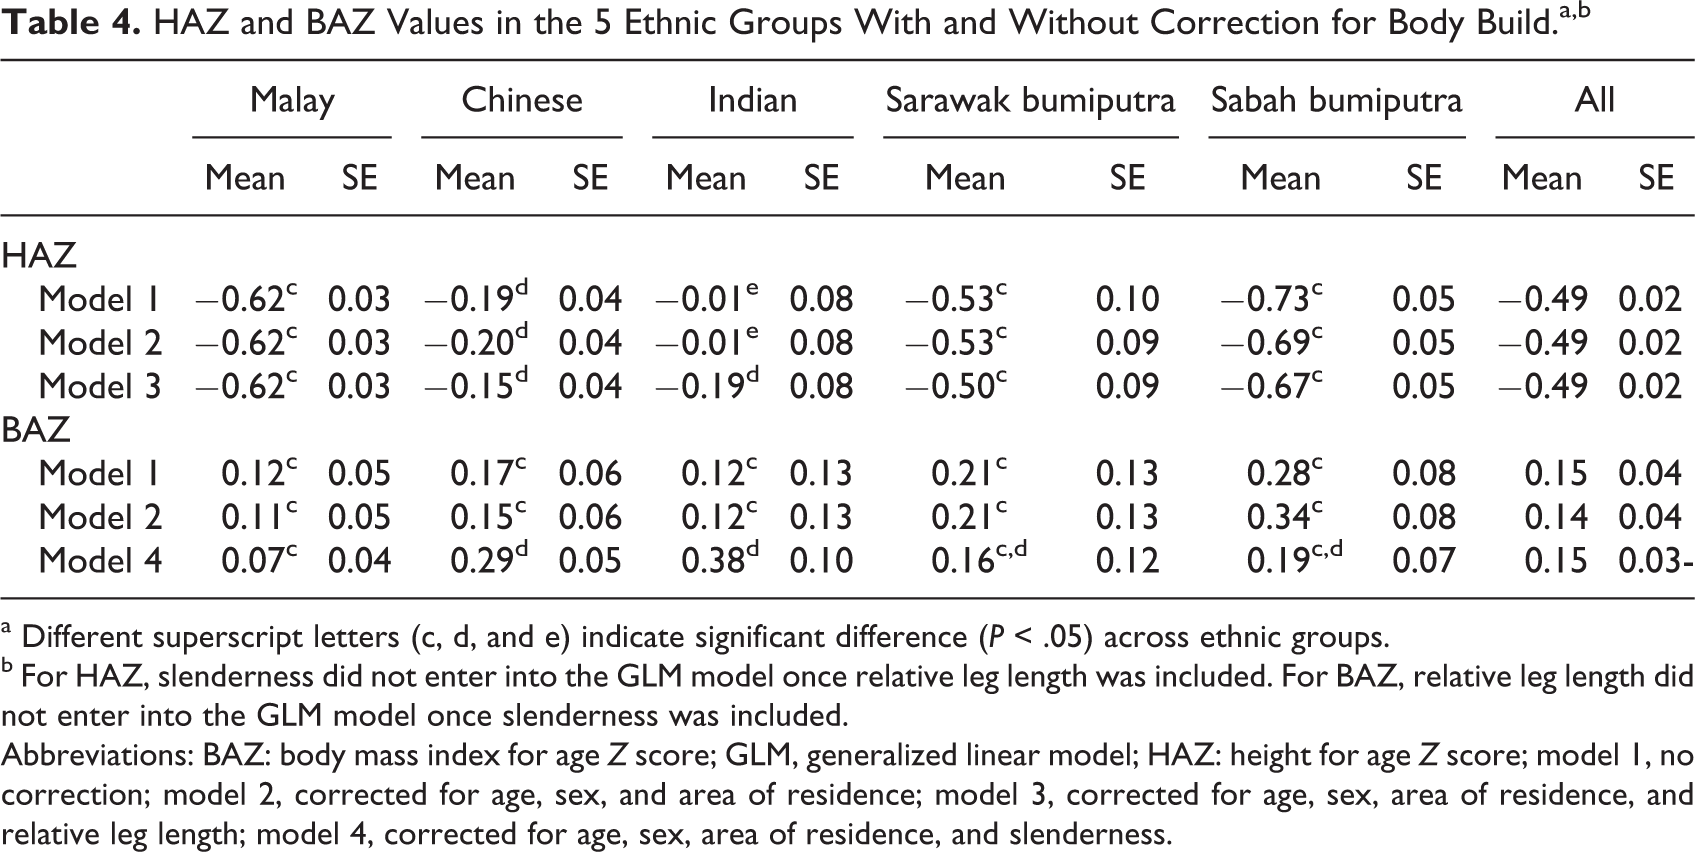
a Different superscript letters (c, d, and e) indicate significant difference (P < .05) across ethnic groups.
b For HAZ, slenderness did not enter into the GLM model once relative leg length was included. For BAZ, relative leg length did not enter into the GLM model once slenderness was included.
Abbreviations: BAZ: body mass index for age Z score; GLM, generalized linear model; HAZ: height for age Z score; model 1, no correction; model 2, corrected for age, sex, and area of residence; model 3, corrected for age, sex, area of residence, and relative leg length; model 4, corrected for age, sex, area of residence, and slenderness.
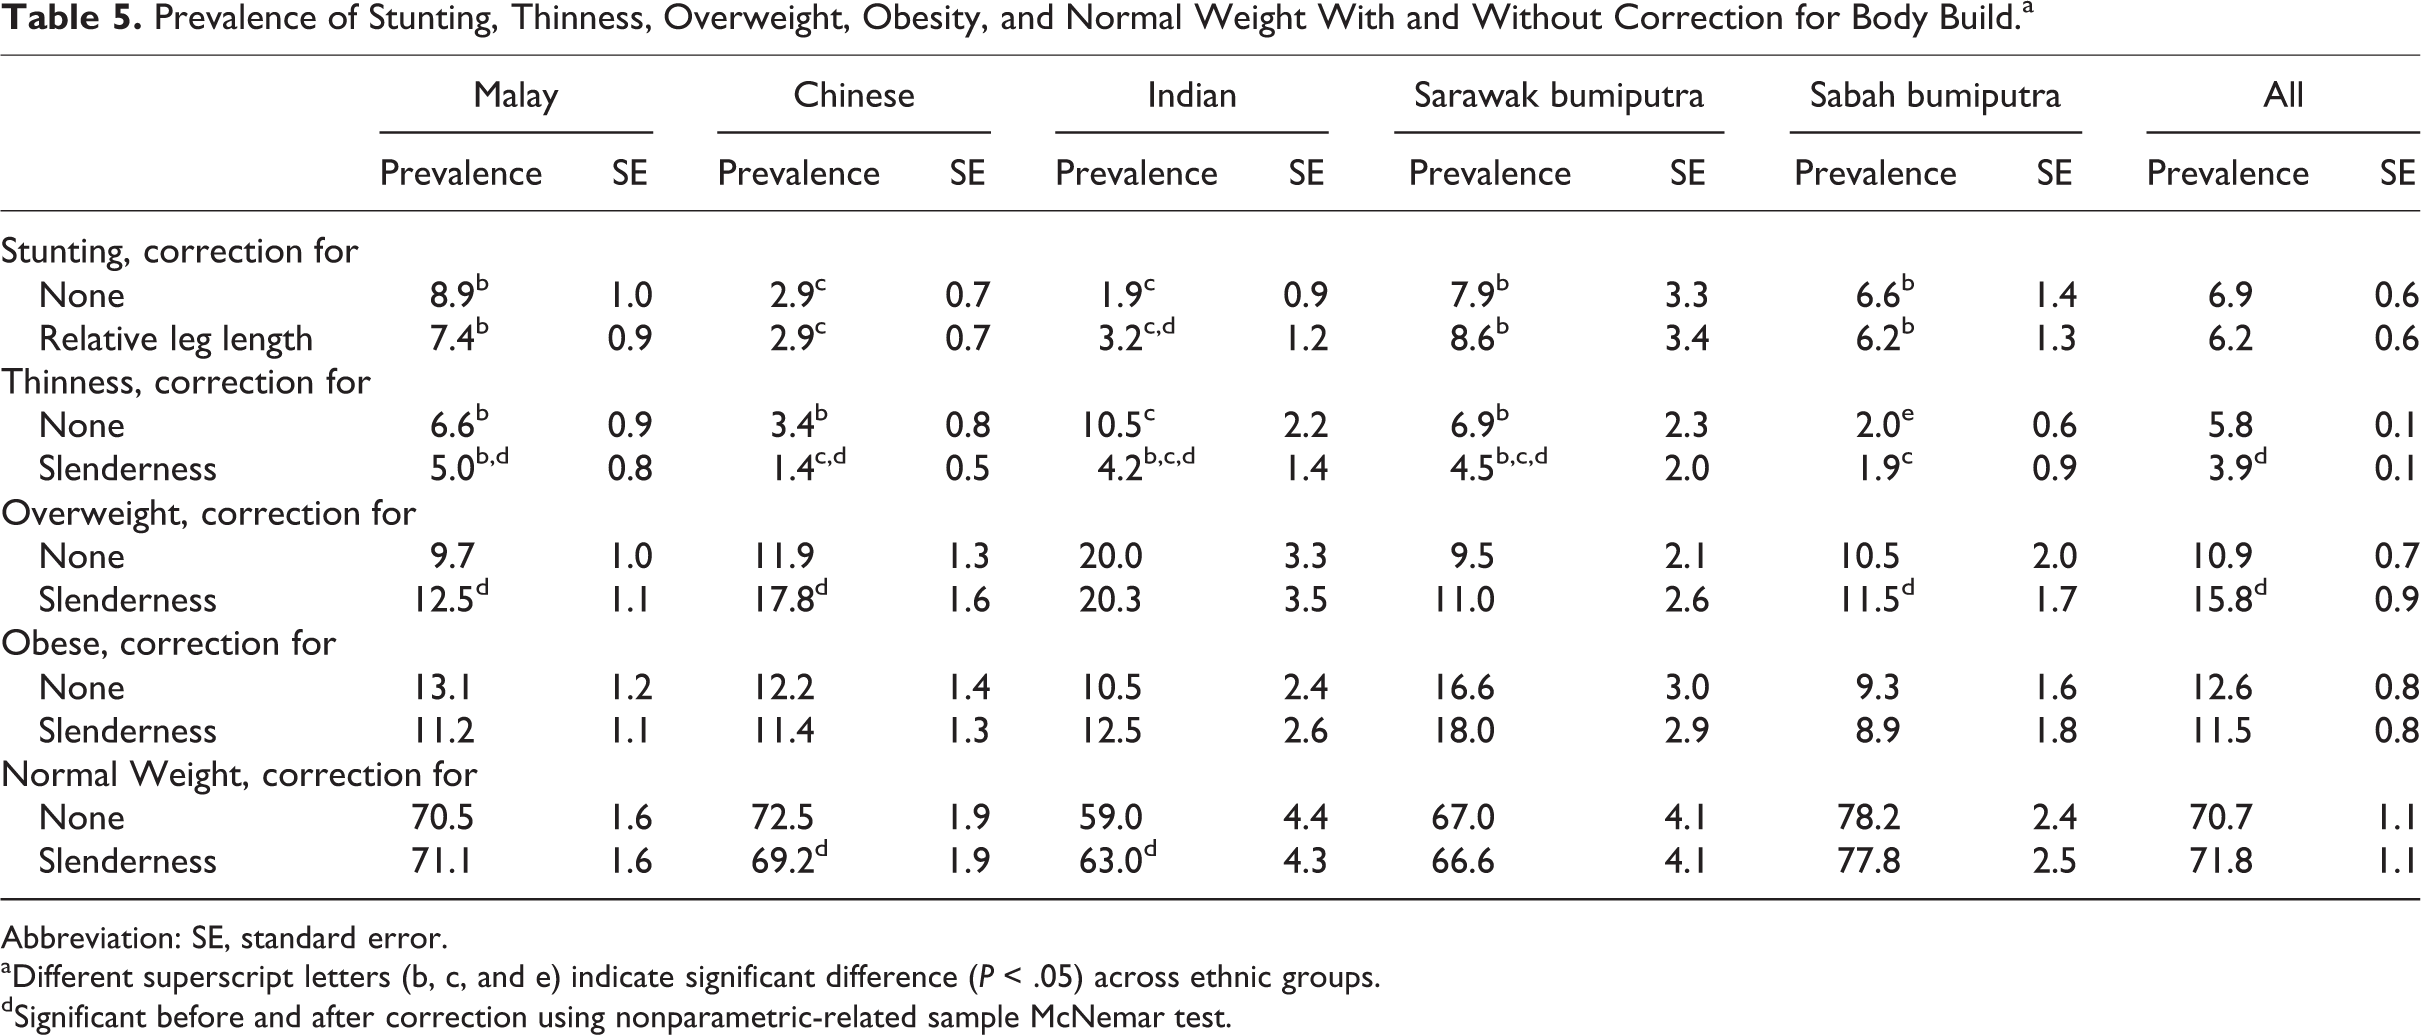
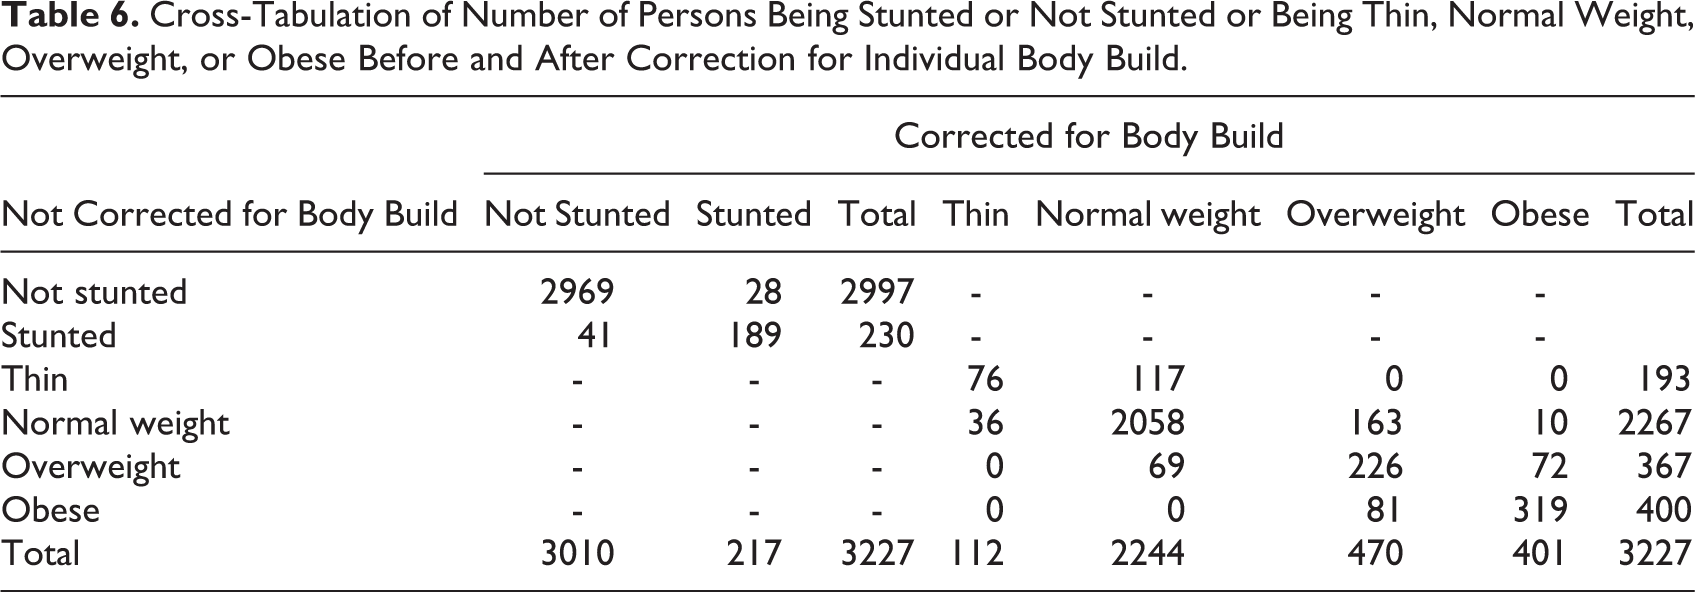
Table 5 provides the prevalence of stunting, thinness, overweight, and obesity in the 5 ethnic groups before and after correction for body build. Note that stunting was only corrected for relative leg length, whereas thinness, overweight, and obesity were only corrected for slenderness (as the second body build parameter did not enter into the model after the first parameter was included). Overall, correction for body build resulted in significant differences in only the prevalence of thinness and overweight. Across ethnic groups, the correction changed the prevalence of stunting in Indians; thinness in all ethnicities except Sabah bumiputras; overweight in all ethnicities except Indians and Sarawak bumiputras; and normal weight in the Chinese and Indians. Although the differences in prevalence before and after correcting for body build were sometimes substantial, not all were statistically significant. Only 10 children (of 2267) were grossly misclassified (Table 6) and were identified as obese, whereas they were classified as normal weight before correcting for body build. All of these 10 children were extremely slender with a slenderness index ranging from 12.30 to 14.04.
Prevalence of Stunting, Thinness, Overweight, Obesity, and Normal Weight With and Without Correction for Body Build.a
Abbreviation: SE, standard error.
aDifferent superscript letters (b, c, and e) indicate significant difference (P < .05) across ethnic groups.
dSignificant before and after correction using nonparametric-related sample McNemar test.
Cross-Tabulation of Number of Persons Being Stunted or Not Stunted or Being Thin, Normal Weight, Overweight, or Obese Before and After Correction for Individual Body Build.
Discussion
The SEANUTS Malaysia population was randomly selected from nurseries, kindergartens, and schools and can be regarded as representative of Malaysia. There are many ethnic groups in Malaysia, with Malays (50%), Chinese (25%), and Indians (10%) forming the majority. 18 In Sarawak and Sabah in East Malaysia (Borneo), there is a myriad of indigenous ethnic groups, some of them rather small in number. Thus, the children of Sarawak and Sabah bumiputra described in this article are actually a mix of various ethnic groups, with the Sarawak bumiputra mainly from the “Iban,” “Bidayuh,” and “Orang Ulu” lineage, and the Sabah bumiputra from the “Kadazan Dusun,” the “Bajau,” and the “Murut” lineage. 18
The 5 ethnic children populations in this study did not differ in age, but the Chinese and the Indians were respectively the heaviest and the tallest, even after correcting for sex and area of residence. The rural children had slightly but significantly lower body weight (1.0 ± 0.5 kg) and lower height (0.9 ± 0.3 cm; P < .05). Body mass index, however, did not differ across the ethnic groups and also not after correcting for age, sex, and area of residence. Malay children had the shortest legs, followed by Chinese, Sarawak, and Sabah bumiputra children. Indian children had the longest legs. Differences in relative leg lengths across ethnic groups are well known for a long time. 6,17 In Singapore, Malay and Chinese adults were reported to have shorter legs (and arms) than the Indians. 19 Among adolescents aged 12 to 18 years in Singapore, the Malays had the shorter legs followed by Chinese and Indians (unpublished results). Some publications suggest that relative leg length is an indicator for the quality of early childhood environment, including nutrition. 12 Not all studies, however, suggest this, 13,22 and the previously mentioned data from the affluent Singapore population 19 do not support this. It seems more likely that genetic factors are responsible for differences in relative leg length. 11,17 The Chinese and Indian children in this study also have the most slender body build (smallest frame). This result is also in accordance with the data from Singapore, 19 in which Indian adolescents and adults had a lower slenderness index and females had a higher slenderness than males. Slenderness will affect body weight (through skeletal mass, connective tissue mass, and muscle mass), and thus, slender children will have lower BMI and BAZ. Also, children with long legs will be taller, and thus, their BMI will be lower.10,17
Effects of body build on body composition 17 and on nutritional parameters 8,17 have been reported earlier and have previously resulted in corrections for body weight standards for frame size, based on elbow breadth. 23 Stunted children in this study also had significantly lower leg length, and thin children had a more slender body build than overweight and obese children. It can be argued that knee breadth and, to a lesser extent, wrist breadth are difficult to measure in obese children and are prone to overestimation due to the (thicker) layer of subcutaneous (fat) tissue, hence resulting in a lower slenderness index. However, the lower slenderness index in the obese group remained even after the very obese children (BAZ > 3) were excluded from the data analyses. It seems likely that the lower leg length in obese children is an artifact (perhaps due to the additional fat layer on the buttocks in obese children that increases the sitting height measurement, thus lowers the measurement of leg length), also because the correlation of BMI with relative leg length is not very high and the correlation with the sum of skinfolds is even lower, suggesting only a weak relationship between body fatness and relative leg length.
After correcting the HAZ value for relative leg length, HAZ values changed mainly in the Indians and Chinese who also had the longest and shortest legs, respectively. The changes were, however, not significant. Correcting BAZ values for slenderness resulted in higher values for the Chinese and the Indians and lower values in the Malay, Sarawak, and Sabah bumiputra children. In both cases, although the changes due to correction were not significant, they resulted in a change in the pattern of HAZ and BAZ values across the ethnic groups. This is in accordance to Norgan 24 who reported changes in BMI after correcting for body build of up to 5 kg/m2.
The actual HAZ and BAZ values were corrected for the effects of relative leg length and slenderness using the β of the regression between HAZ and leg length and BAZ and slenderness, respectively. As there is no reference value for relative leg length and slenderness, the mean of the total population was used (see formula in Methods). Correction for body build resulted in some significant changes in the prevalence of stunting, thinness, overweight, and obesity across the ethnic groups. The most obvious changes were in stunting and thinness for Indians and overweight for Chinese (Table 5). Given that these ethnic groups are the most “extreme” in body build, it is not surprising to note that these are also the most affected groups. Malina et al 8 have suggested earlier that differences in body build may be a reason to have ethnic-specific reference values for American blacks. The high prevalence of stunting and thinness in Indian preschoolers 25 using WHO standards may, at least partly, be due to their long legs. And, the effect of body build, including relative leg length, on body fatness has been shown in many multiethnic populations, from United States 26 to New Zealand. 10 Nonetheless, we opine that ethnic-specific growth charts may not be necessary at the population level, especially as comparisons between populations will be made more difficult when different growth charts are used.
Apart from population changes in prevalence, classification of individual children is also affected by corrections for body build. 24 After correction for relative leg length, 28 children who were previously not classified as stunted were grouped as stunted. Of the originally 230 stunted children, 41 appeared to be normal height after correction. Therefore, the cases of stunting reduced from 230 to 217 after correction for relative leg length. For weight classifications, most children moved maximally to an adjacent group, but 10 children (5 Malays, 2 Chinese, 1 Indian, 1 Sarawak bumiputra, and 1 Sabah bumiputra) who were previously in the normal-weight group ended up in the obese group after correction for body build. These are considerable numbers and might warrant closer attention, especially at the individual level. Whether this asks for additional measurements of body build in clinical practice and consequent corrections will require a thorough analyses of the pros and cons of such an exercise. Measuring additional body build parameters will require adequate training and comes at a cost. Perhaps, a good clinical assessment may be adequate to avoid categorizing children into a wrong group.
Conclusion
The aim of this study was to see whether there are differences in body build across the ethnic groups in Malaysia and whether possible differences result in (gross) misclassifications in either stunting or in being thin, overweight, or obese. The answer is 2-fold. On the population level, differences in body build across ethnic groups do not warrant any corrections as the changes in prevalence were small and were mostly not statistically significant. At an individual level, however, correcting for body build could result in rather big changes in HAZ and/or BAZ value, which may classify a child into another height or weight category. Based on these findings, correction for body build when classifying individual children according to anthropometric indices should be seriously considered in the clinical practice; however, practical issues such as training and logistics need to be considered as well.
Footnotes
Acknowledgments
The authors would like to thank all the participants and their parents, teachers, and schools for their full cooperation. The effort and dedication of the data collection team, enumerators, and all those involved in this project are also acknowledged. The authors also greatly appreciate Dr Ilse Tan Khouw (FrieslandCampina) for her role during data collection and data management and Dr Panam Parikh (FrieslandCampina) for her critical review of the manuscript.
Authors’ Note
BKP, AKN, and PD conceived and designed the study. PD analyzed the data. BKP, JEW, and PD interpreted the data and drafted the manuscript. All authors critically reviewed and approved the final version of the manuscript for publication. This study was conducted according to the guidelines laid down in the Declaration of Helsinki, and all procedures involving human subjects/patients were approved by the Medical Ethical Committees of the participating institutes. Written informed consent was obtained for all participants by their parents and/or caregivers. Any findings, opinions, conclusions or recommendations expressed in this publication are those of the authors and do not necessarily reflect the views of FrieslandCampina.
Declaration of Conflicting Interests
The author(s) declared no potential conflicts of interest with respect to the research, authorship, and/or publication of this article.
Funding
The author(s) disclosed receipt of the following financial support for the research, authorship, and/or publication of this article: The study was funded by FrieslandCampina (UKM-Dutch Lady Project Code: NN-072-2009; SEANUTS 2.0 Project Code: NN-2013-112), but it had no influence on the outcome of the study.