
Abstract
Background:
Detailed dietary intake data in low-income populations are needed for research and program evaluation. However, collection of such data by paper-based 24-hour recall imposes substantial demands for staff time and expertise, training, materials, and data entry.
Objective:
To describe our development and use of a tablet-based 24-hour recall tool for conducting dietary intake surveys in remote settings.
Methods:
We designed a 24-hour recall tool using Open Data Kit software on an Android tablet platform. The tool contains a list of local foods, questions on portion size, cooking method, ingredients, and food source and prompts to guide interviewers. We used this tool to interview caregivers on dietary intakes of children participating in an efficacy trial of provitamin A-biofortified maize conducted in Mkushi, a rural district in central Zambia. Participants were children aged 4 to 8 years not yet enrolled in school (n = 938). Dietary intake data were converted to nutrient intakes using local food composition and recipe tables.
Results:
We developed a tablet-based 24-hour recall tool and used it to collect dietary data among 928 children. The majority of foods consumed were maize, leafy vegetable, or small fish dishes. Median daily energy intake was 6416 kJ (1469 kcal).
Conclusions:
Food and nutrient intakes assessed using the tablet-based tool were consistent with those reported in prior research. The tool was easily used by interviewers without prior nutrition training or computing experience. Challenges remain to improve programming, but the tool is an innovation that enables efficient collection of 24-hour recall data in remote settings.
Introduction
Twenty-four-hour recalls are a frequently used method for collecting detailed dietary intake data in international nutrition research. However, this method is resource intensive, requiring substantial staff time, training, and expertise. New technologies may substantially reduce these demands, making 24-hour recall data more accessible. For example, tablets equipped with survey software can now be used to record data in the field, eliminating the need for paper forms and data entry. A number of computer- or Web-based programs have been designed for self- or interviewer-administered 24-hour recalls in high-income countries. 1 Mobile devices such as tablets and personal digital assistants have been shown to be effective, well-accepted, and cost-saving tools for direct entry of survey data, even in resource-poor settings. 2 –5 However, to our knowledge, tablets have not been used previously for the collection of detailed dietary intake data.
We developed a tablet-based 24-hour recall tool for use at our research site in Mkushi District, Central Province, Zambia. Mkushi is a rural, agricultural district, with high rates of poverty and food insecurity and low population density. The district has had limited prior exposure to research or development projects, and locally hired interviewing staff had no specialized training in nutrition. We planned to conduct interviews at participants’ homes, most of which were located 30 to 90 minutes from our office by motorcycle, with limited access to electricity and no Internet connectivity. We therefore required a data collection tool that could guide interviewers through a complex recall protocol with minimal training in nutrition and limited prior computer experience. It was also essential that this tool be available on a portable device, with long battery life and offline capabilities.
In this article, we describe the development and use of our tablet-based tool to conduct 24-hour dietary recalls in remote field settings. We present results of a dietary intake survey conducted in Zambia as an illustrative case, describe successes and challenges in tool development and use, and discuss future directions for this innovation in dietary data collection.
Methods
Study Context
This work was undertaken as part of a large-scale cluster randomized trial of provitamin A-biofortified maize (registered as NCT01695148 at clinicaltrials.gov). 6 We identified children aged ∼4 to 8 years not yet enrolled in school by a census of all households in villages or towns accessible by vehicle year-round. Households were grouped by proximity to form clusters of ∼15 to 30 children. Each cluster was randomly assigned to the treatment group (n = 25 clusters), which received daily meals containing provitamin A carotenoid-biofortified maize, the control group (n = 25 clusters), which received meals containing conventional white maize, or the nonintervened group (n = 14 clusters), which received an equivalent food package at the end of the trial. We enrolled 1226 children at baseline (August-September 2012) and collected data on household socioeconomic status and children’s diet, morbidity, height, and weight. Diet and morbidity surveys were repeated on a monthly basis until the end line assessment in March 2013, yielding up to seven 24-hour recalls per child. In this article, we present results of the baseline dietary survey only and exclude children who were enrolled after feeding had begun in their cluster. By applying this exclusion criterion, we describe the performance of the tablet-based tool in a free-living, nonintervened context, since participation in the intervention may have influenced nutrient intake estimates.
This study was conducted according to the guidelines laid down in the Declaration of Helsinki, and all procedures involving human subjects were approved by the Institutional Review Board of the Johns Hopkins Bloomberg School of Public Health (Baltimore, Maryland) and the Ethics Review Committee of the Tropical Disease Research Centre (Ndola, Zambia). Verbal informed consent was obtained from all participants, witnessed, and formally recorded.
Development of the 24-Hour Recall Tool
We selected Acer Iconia tablets (Acer Inc, Taipei, Taiwan) running the Android operating system version 3.2.1 (android.com) for data collection due to their low cost (∼US$200), durability, screen size, and GPS functionality. The 24-hour recall was programmed using Open Data Kit (ODK) version 1.1.7 (opendatakit.org), a free software for data collection forms. The tool was designed to walk interviewers through the recall protocol step-by-step, with prompts specific to each step and precoded response choices on each screen.
Local foods list and food identification framework
We generated a list of local foods by combining foods listed in recipe and food composition tables created by HarvestPlus, a Challenge Program of the Consultative Group for International Agricultural Research, for use in Mkushi with additional foods listed in the Zambian Food Composition Tables published by the National Food and Nutrition Commission. 7,8 Local fishes and wild or semicultivated vegetables and fruits were included in the food list based on inclusion in the food composition tables and discussion with local staff. Through group interviews with local staff, we refined the list to foods, preparation methods, and local names used in the study area. We then organized the list into a food identification framework based on local food consumption practices (Figure 1).
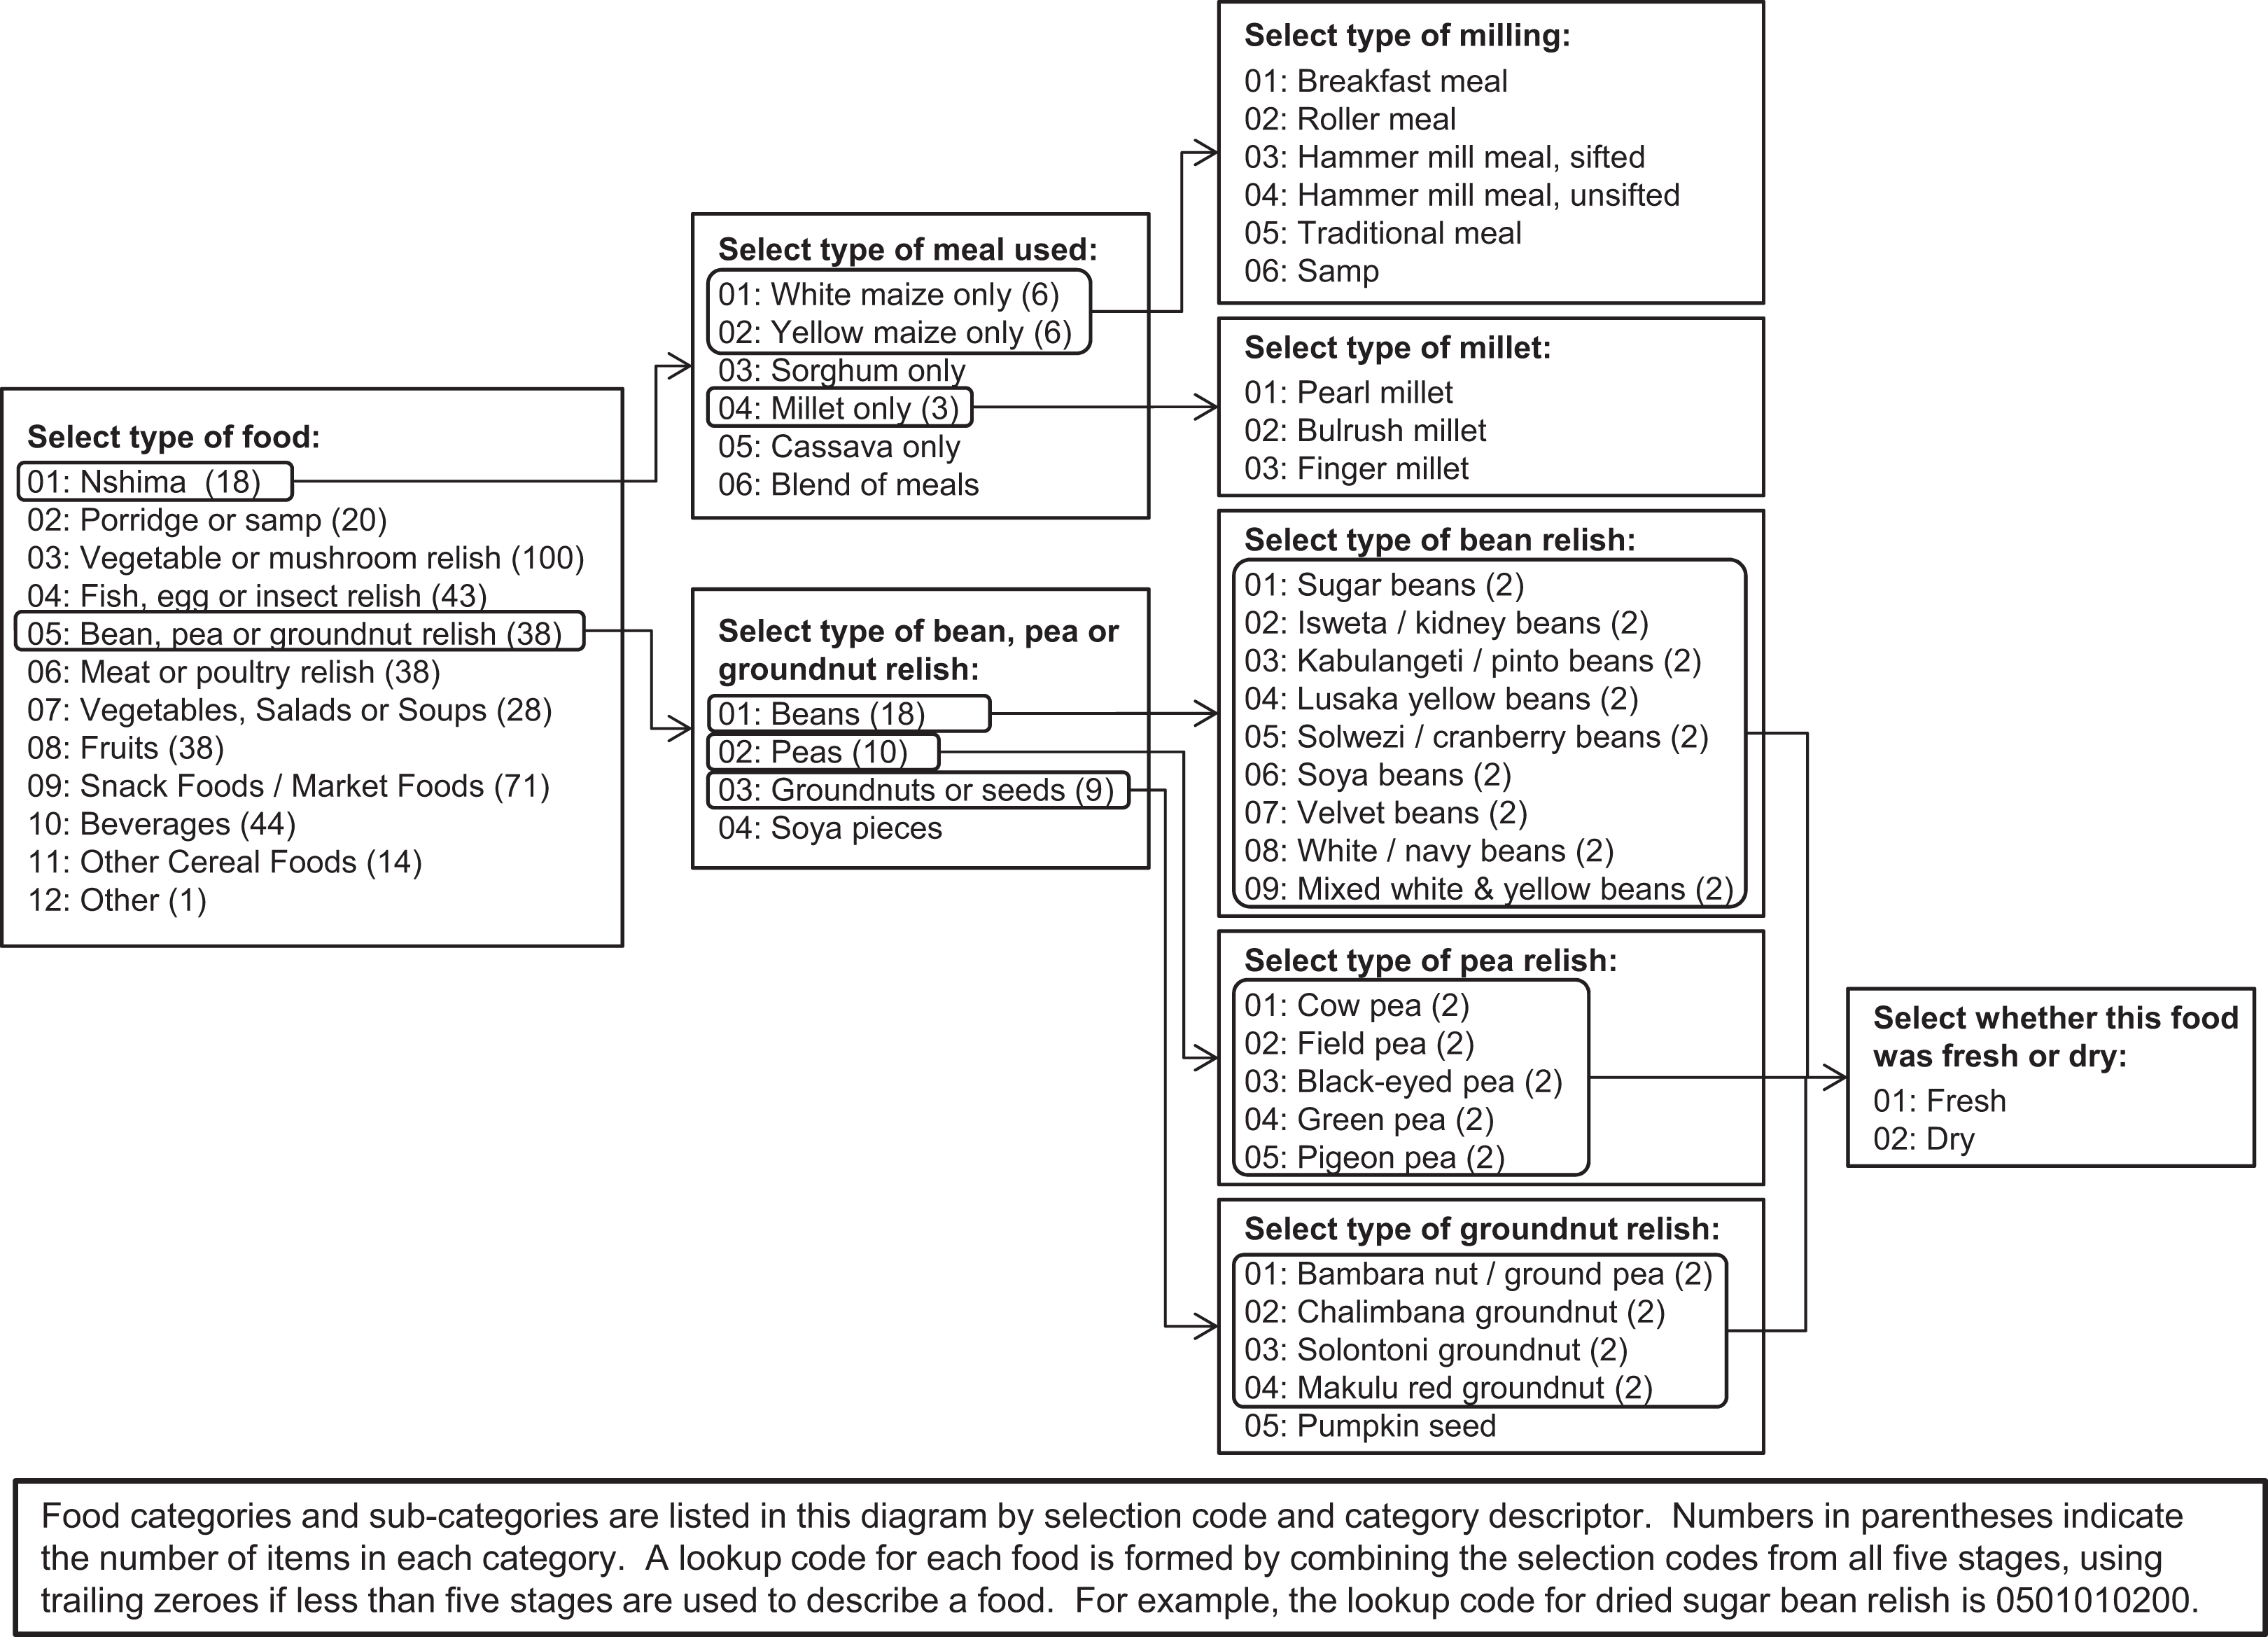
Illustration of the branching food identification framework used to program a preset list of local foods into a series of food identification questions in the tablet-based 24-hour recall tool.
The framework enabled each food to be recorded without use of scrolling on the tablet screen or using a searchable list (Figure 2A). We chose to avoid scrolling in order to speed data entry and prevent errors, and the current version of ODK did not support searchable lists. We programmed 1 question to correspond to each category or subcategory in the food selection framework, linking these using conditional logic to create branching food selection pathways. Using this strategy, all foods in the list could be uniquely identified in 2 to 5 rapid select questions on the tablet. For some foods, the final selection stage described the size, ripeness, or freshness of the food or its primary ingredient. An option to record “other” and then type a food description was available at each selection stage, if the food being recorded was not in the preprogrammed list. An option to record “don’t know” was also available when the respondent could not provide further detail.
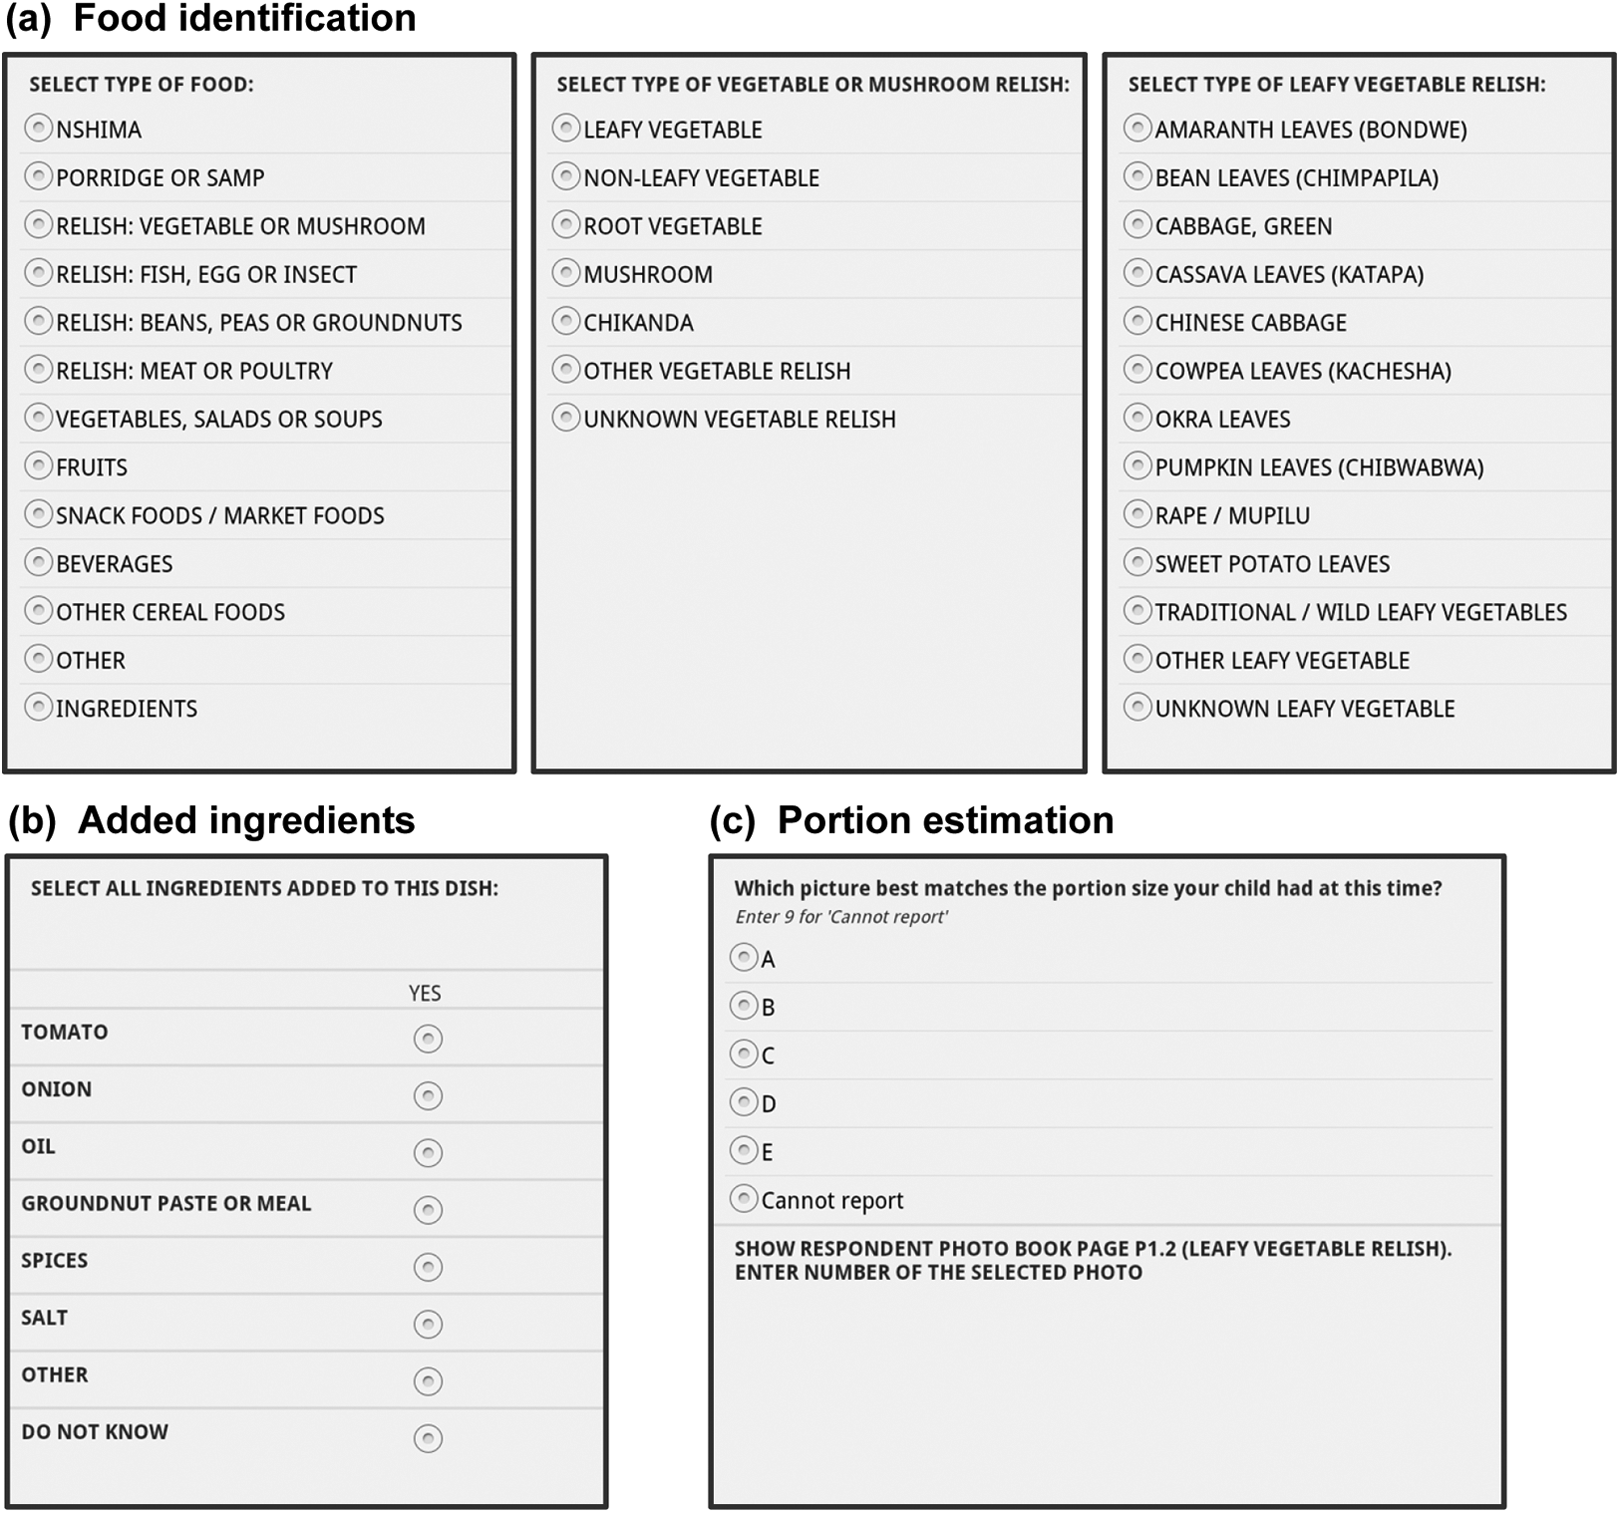
Screen shots from the tablet-based 24-hour recall tool showing examples of the series of food identification questions (A), questions on added ingredients (B), and portion size estimation (C).
Collection of additional food description data
For mixed dishes, the tablet prompted interviewers to ask and record the ingredients used in the preparation of the dish (Figure 2B). The tablet program displayed a list of likely ingredients matched to the food type, from which interviewers could select as many as were mentioned by respondents. We created each list of likely ingredients based on combinations from the recipe database or input from local staff. Each list of likely ingredients also included other and don’t know options, where the other option prompted interviewers to type in a description of the added ingredient for later recoding. A standard question recorded the cooking method for foods other than raw fruits or commercially prepared snacks.
To estimate the quantity consumed, the tablet displayed 1 of the 3 coding options depending on the type of food: (1) photographs of approximate portion sizes, (2) number of units, or (3) the width and length of the food item. For most foods, interviewers were prompted to show respondents a specific set of portion size photos marked A to E in an accompanying photo book, described subsequently. They then recorded the response in a variable corresponding to the photo book page for later link to gram weight estimates (Figure 2C). A final screen prompted interviewers to ask and record where the child obtained the food: from home, a neighbor, the market, and so on.
Tablet-based interview structure
The full set of food description questions was repeated for each food within a series of built-in prompts guiding interviewers to review the previous day sequentially with the caregiver and the child. Interviewers first asked about foods consumed when the child woke up in the morning, then about foods consumed midmorning, and so on through the day and night. The tablet then prompted interviewers to review a picture chart interview aid, described subsequently, to check for any missed foods and to do a final review of the day as a last check. At each stage in the interview process, the tablet displayed prompts to help interviewers guide respondents in recalling children’s activities and any foods consumed (eg, to consider the child’s activities or where the child went and what he or she might have eaten there). A final series of questions collected data on whether the child was ill, whether the day was a special occasion or market day, whether the child’s food intake was different for any other reason, and whether the child took any vitamin, mineral, or other supplements.
Interview aids
We used 2 visual aids in the 24-hour recall protocol. The first was a picture chart showing line drawings of 20 common local foods. Caregivers received these 2 days before the scheduled interview and were asked to place a tick mark next to each food the child consumed during the day prior to the recall. Interviewers reviewed charts with respondents to probe for any foods missed by the previous prompts. If any previously undescribed foods were identified during the picture chart review, these were recorded using the series of food description questions, discussed previously.
The second visual aid was a 13-page portion size booklet, each page showing 5 photos of a different type of dish (eg, nshima, leafy vegetable relish, bean relish, fruit drink, or groundnuts). The photos depicted a range of portion sizes plated on the same dish and photographed with a woman’s hands shown holding the plate as a visual reference for size. We recruited 6 local mothers with young children to guide the development of standard portion sizes. Using typically prepared foods from a local restaurant, we asked each mother to serve onto a plate the amount she perceived as a small portion for a 5- to 6-year-old child. We then weighed the portions. We repeated this procedure for medium and large portions of each food. To create the photo booklet page for each food, we weighed out and photographed 5 serving sizes representing the minimum portion, median small, medium, large portions, and maximum portion.
Survey Implementation
We had trained staff on tablet operation and use of ODK-based forms during an initial phase of mapping and census taking in the study area. As a result, interviewers were adept at tablet use prior to training on the dietary data collection. Training for the 24-hour recall lasted approximately 1 week, during which we covered recall interview techniques and all aspects of the tablet-based 24-hour recall form. Staff practiced interview techniques and tablet data entry using hypothetical examples and by interviewing each other. We concluded training with a drill for interviewers to collect data from mothers of young children in a neighborhood adjacent to our study area. The latter was supervised by research staff to check quality of the interview technique and data entry.
Two days prior to the interview, field supervisors visited households to inform caregivers of their upcoming interview. Supervisors provided the household with a picture chart, pencil, and standard-sized bowl, along with instructions for the use of these materials in noting children’s dietary intake on the subsequent day. Interviewers asked the primary caregiver of the participating child to recall the child’s food intakes, following the prompts and food description questions described previously. As often as possible, the child was present to respond to questions from the caregiver or the interviewer.
Interviewers traveled to scheduled visits by motorcycle, carrying tablets, portion size photo booklets, a small notepad, and pen in backpacks. Tablets could be held in hand or on the lap while conducting the interview, and screens were legible for use when conducting interviews outdoors. We randomly selected 10% of interviews each month for quality control. Senior staff observed these visits to ensure that interviewers adhered to the recall protocol. We also used time stamps embedded in the ODK questionnaire to calculate interview length. Interviewers who had 2 or more records with outlying interview times were flagged for additional supervision.
Data were uploaded from the tablets to a computer and a backup drive on a daily basis. Data were converted from the extensible markup language (.xml) format stored on the tablets to comma separated value (.csv) format using the ODK Briefcase software, a free program for uploading and organizing data collected in ODK without use of Internet-based data aggregation tools (http://opendatakit.org/use/briefcase/). Data in .csv format were cleaned and backed up to secure cloud storage. File formatting was done in Microsoft SQL Server 2012 (Microsoft Corporation, Redmond, Washington). All further data formatting and analysis was conducted in SAS 9.3 (SAS Institute Inc, Cary, North Carolina).
Calculation of Nutrient Intake Estimates
Recipe database
A set of standardized Zambian recipes developed by HarvestPlus was our primary source for data on ingredient proportions for mixed foods (unpublished). This database describes recipes as sets of ingredients whose proportions are expressed as the ratio of the ingredient uncooked weight to the recipe final weight. 8 Food composition data for use with these recipes retain the water, dry matter, and macronutrient contents from the raw food, and all micronutrients are scaled using nutrient retention factors to account for cooking losses.
For mixed foods lacking a recipe in the HarvestPlus database, we modified existing recipes or added new recipes through a separate data collection protocol. Where a mixed food differed from an existing recipe only in the main ingredient, we modified the recipe providing the closest match by substituting the key ingredient while retaining the original ingredient proportions. To create a modified recipe omitting one or more of the ingredients in the original recipe, we adjusted the fractions of the remaining ingredients such that the ratios between ingredients—including water added or lost in cooking—stayed consistent with the original recipe.
Due to differences in data collection, recipe data from HarvestPlus were unavailable for several types of recipes, for example, meat relishes and bread or rolls with spreads. Further, some combinations of ingredients were reported in the 24-hour recall data which were not included in the HarvestPlus recipe database. In order to create recipes for these items, we collected recipe data using a focus group of 6 women from our study area and a protocol similar to that described by Hotz et al. 8 For each recipe or mixed food item, the women used raw ingredients to demonstrate how much of each they would use to prepare the recipe. The weight of each ingredient was measured in grams. To estimate postcooking recipe weights, we applied yield factors to each ingredient and summed the resulting weights. 9 The recipe fractions for each ingredient, for each participant, were calculated as the raw weight divided by the postcooking recipe weight. We averaged the fractions for each ingredient across all participants to create the recipe.
Food composition database
Our primary source of food composition data was a table developed for Zambia by HarvestPlus (unpublished). For any foods not included in this database, we used data from the US Department of Agriculture (USDA) National Nutrient Database for Standard Reference Release 26, Zambia Food Composition Tables from the National Food and Nutrition Commission, Food and Agriculture Organization of the United Nations (FAO)/International Network of Food Data Systems (INFOODS) Food Composition Database for Biodiversity, Food Composition Tables for Mozambique, the FAO Food Composition Table For Use in Africa, or a Food Composition Table for Central and Eastern Uganda. 7,8,10 –13 We used the Zambia Food Composition Tables, Agroforestree database, FishBase, or searches of other sources to identify the scientific names of local foods in order to locate them in regional and global food composition tables. 7,14 –18 Where food composition data for a specific food were unavailable, we used data from the closest available matching food. For foods missing food composition data for some nutrients, values for those nutrients were imputed as the average among similar foods for which data were available. When food composition data for cooked foods were missing, we used nutrient retention factors to impute the nutrient contents of the cooked food based on the nutrient composition of the raw food. 19
Linking tablet data to recipe and food composition databases
In order to link the data as recorded on the tablet to recipe and food composition databases, we created a series of variables, each of which reduced a set of related tablet variables to a single code. Lookup codes combine data from the food identification questions and serve as a key between each recorded food and a unique item in the foods list. The variables marking which ingredients were added to the food, combined with the lookup code, connect each record to a unique recipe code in the recipes database and its associated food codes in the food composition table. Finally, the portion size estimates based on the photos, or number or size of food units consumed, were converted to gram weights.
Food and recipe coding
To form lookup codes, we linked the responses to the sequential food identification questions into a 10-digit code associated with a unique item in the preprogrammed list of foods (Figure 1). Formation of the lookup code matches the branching food selection framework programmed into the tablet. The first 2 digits are the response to the initial food selection question and indicate which food identification variable should supply the third and fourth digits, and so on, up to 10 digits for 5 food selection stages. For foods identified in fewer than 5 stages, trailing zeroes maintain consistent code length and format. Lookup codes for which the respondent could not recall specific food descriptors, such as whether a chicken drumstick was consumed skin-on, were recoded to the most commonly reported food in the same subcategory. Lookup codes for which the interviewer selected other and entered a description were reassigned to a matching, existing code or assigned a new code.
Lookup codes for unmixed food items were associated directly with a food code for a unique entry in the food composition table. For mixed foods, we matched each record to the unique code in the recipe database with the same combination of lookup code and added ingredient variables. In turn, the recipe code linked each record to a database listing the individual ingredients with their food codes and proportions in the recipe. For example, the combination of the lookup code for cabbage relish and added ingredient variables for tomato, onion, and oil is uniquely associated with the recipe code 9180860, which links to an entry in the recipe database containing the food codes for oil and cooked cabbage, tomatoes, and onions and their proportions in the recipe. When respondents did not know the ingredients used in a mixed dish, the records were recoded to the most commonly reported recipe with the same lookup code.
Portion size estimation
We combined the tablet variables containing portion size data into a single portion code. For foods estimated by portion size photos, each portion code is associated with the gram weight of the food shown in the corresponding photo. We adjusted for any difference in density between the food recorded and the food shown in the photo to arrive at a final gram weight estimate. To make this adjustment, we used data from the FAO/INFOODS density database, food composition tables, or data collected for this purpose at the study site. 10,20 For foods such as fruit or bread slices which were recorded as the number of pieces consumed, we multiplied the number of pieces by the estimated gram weight of a single piece. The estimates of gram weight per piece are based on data from the USDA National Nutrient Database for Standard Reference, locally collected food weights, or additional references. 10 For the small number of foods estimated by length and width in centimeters (eg, raw sugar cane), the portion gram weight is estimated according to cylindrical volume and an estimate of density. When respondents could not report the amount consumed, we estimated portion size as the median reported portion size among all other records of the same food. Finally, for mixed foods, we estimated the gram weight of each ingredient by multiplying the total portion weight by its recipe fraction.
Statistical Methods
To describe dietary patterns in terms of foods consumed, we calculated the number of times each lookup code appeared at baseline, aggregating similar foods. For nutrient intake estimates, we multiplied the nutrient contents per gram from the food composition table by the estimated gram weight of each ingredient or unmixed food consumed. We summed each nutrient across all foods consumed by each child and then generated descriptive statistics on the distribution of total intakes of each nutrient across all children.
Results
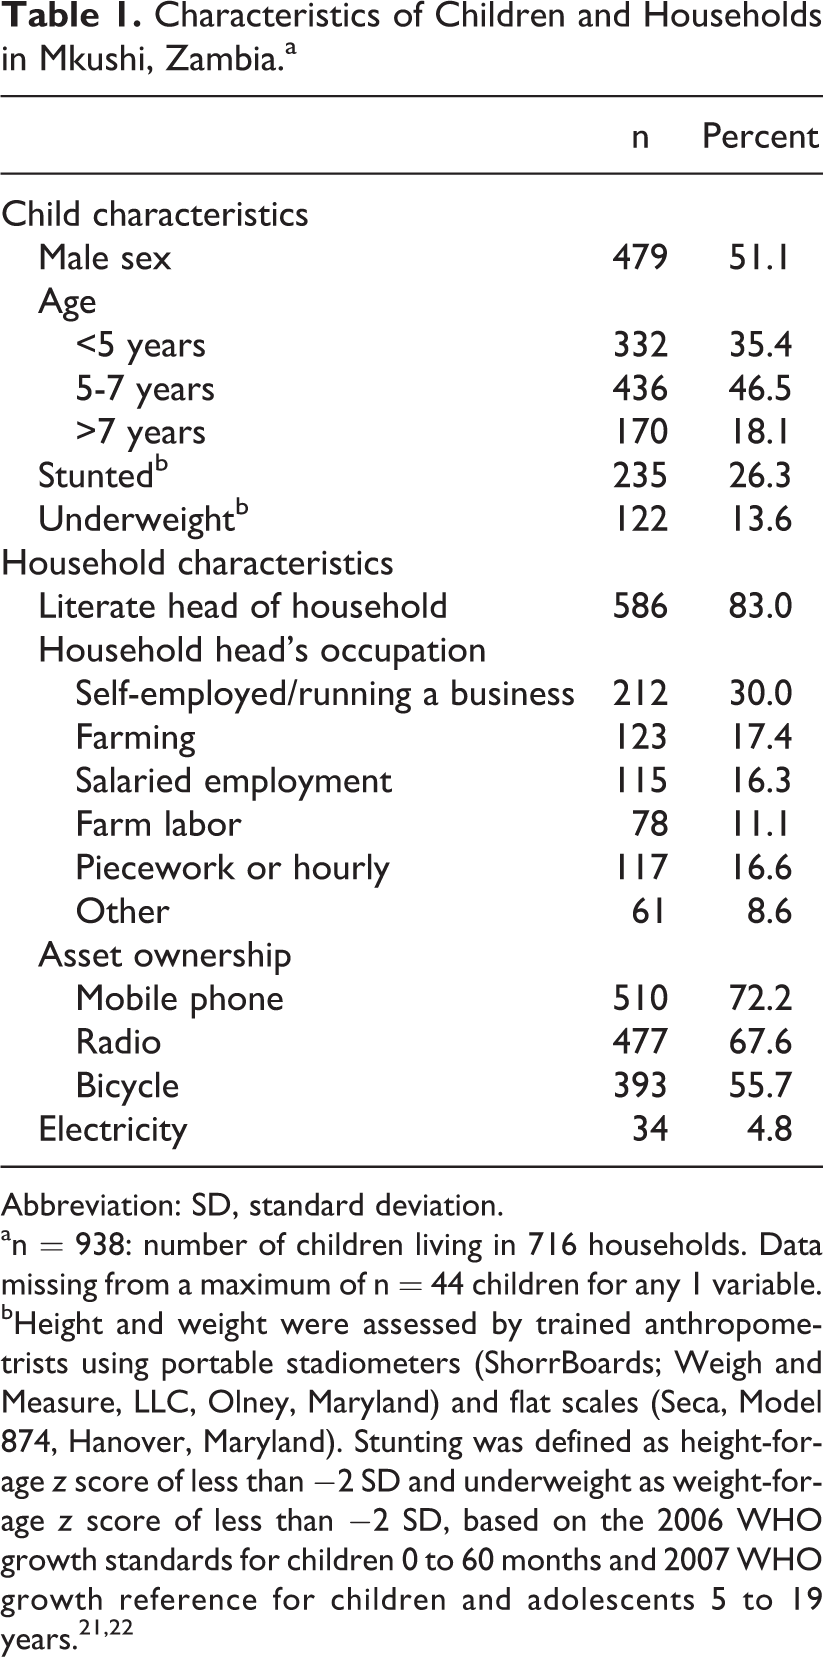
Of the 1226 children enrolled in the trial, n = 938 were enrolled prior to the start of the feeding intervention and are included in the present analysis. Of these, the tablet-based 24-hour recall was completed among 928 children. The average age at baseline was 5.7 years (standard deviation [SD]: 1.2), and 51% were male (Table 1). The prevalence of stunting was 26% and that of underweight was 14%. Socioeconomic descriptors of participating households are presented in Table 1.
Characteristics of Children and Households in Mkushi, Zambia.a
Abbreviation: SD, standard deviation.
an = 938: number of children living in 716 households. Data missing from a maximum of n = 44 children for any 1 variable.
bHeight and weight were assessed by trained anthropometrists using portable stadiometers (ShorrBoards; Weigh and Measure, LLC, Olney, Maryland) and flat scales (Seca, Model 874, Hanover, Maryland). Stunting was defined as height-for-age z score of less than −2 SD and underweight as weight-for-age z score of less than −2 SD, based on the 2006 WHO growth standards for children 0 to 60 months and 2007 WHO growth reference for children and adolescents 5 to 19 years. 21,22
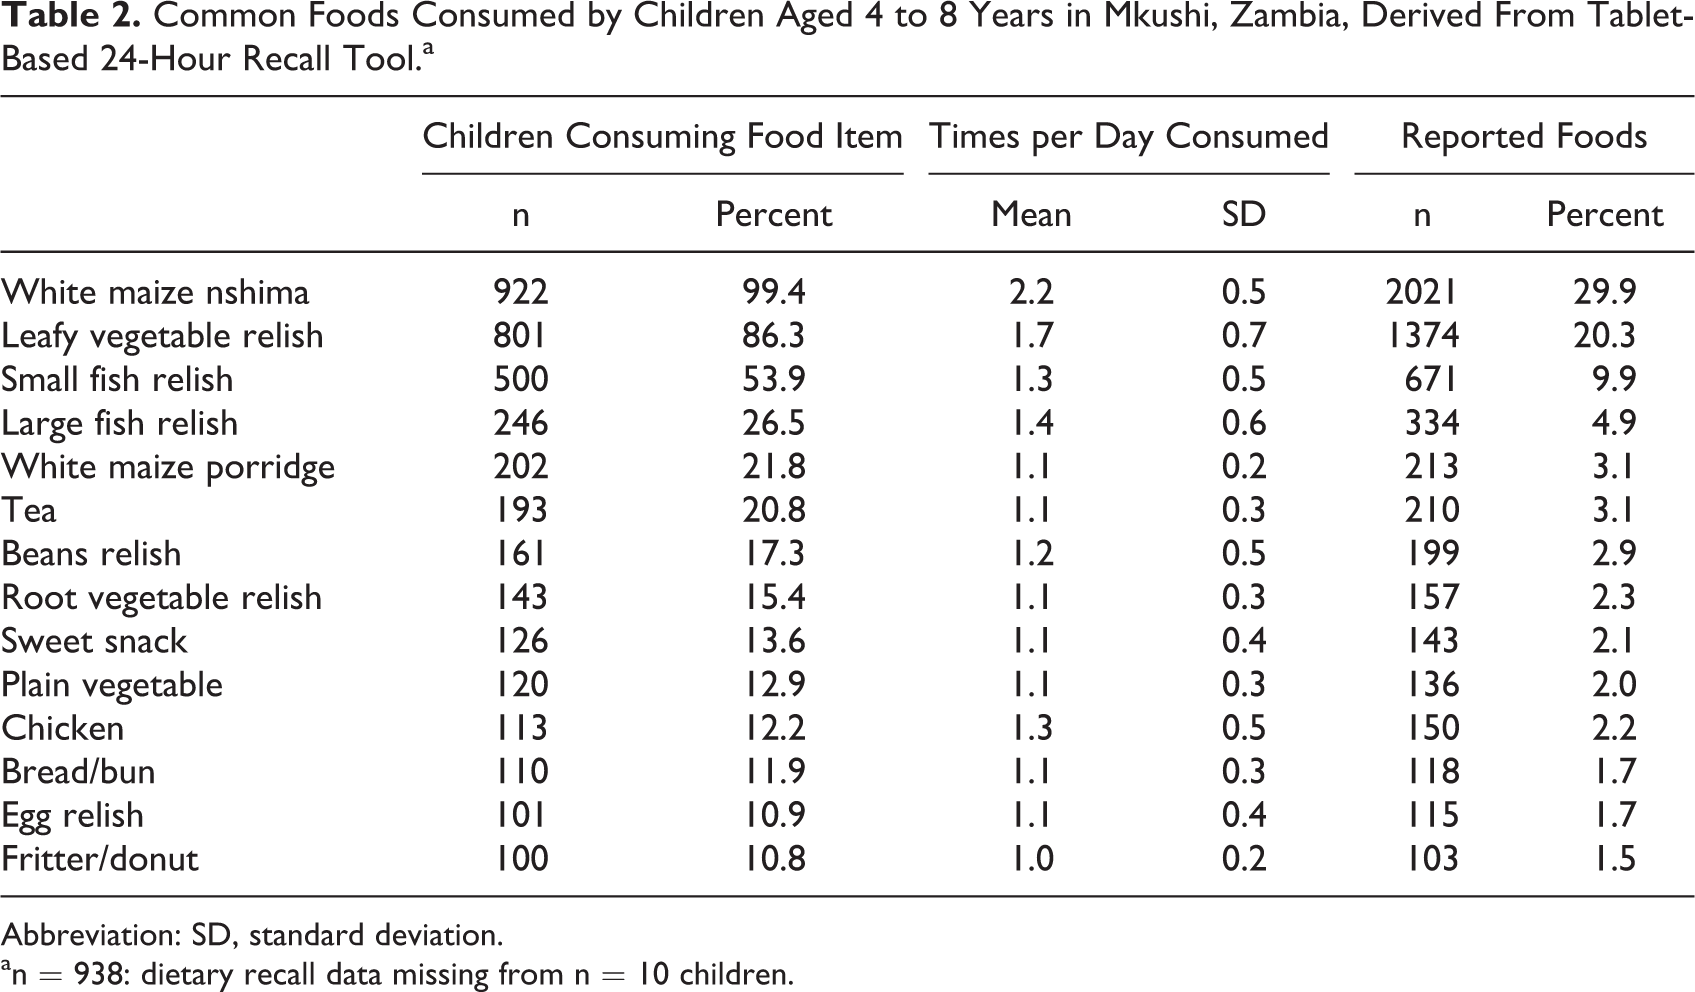
Fourteen categories of foods were consumed by at least 100 children during the baseline 24-hour recall period (Table 2). Each of the remaining categories of foods made up 5% or less of the total number of foods reported and was consumed by less than 10% of the included children. The staple dish, white maize nshima, accounts for 30% of all foods recorded and was consumed by 99% (n = 922) of the children. Among these children, white maize nshima was consumed an average of 2.2 times per day. Leafy vegetable relish and small fish relish make up the next 30% of foods recorded. Leafy vegetable relish was consumed by 86% (n = 801) of the children, and 54% (n = 500) consumed small fish relish.
Common Foods Consumed by Children Aged 4 to 8 Years in Mkushi, Zambia, Derived From Tablet-Based 24-Hour Recall Tool.a
Abbreviation: SD, standard deviation.
an = 938: dietary recall data missing from n = 10 children.
The median energy intake over the previous 24 hours was 6146 kJ (1469 kcal; Table 3). Across age and sex groups, median energy intake ranged from 93% to 117% of the estimated energy requirement. 23 Median daily intakes for most micronutrients exceeded the estimated average requirement (EAR). 24 –27 The median intake of calcium, 263 mg, was well below the EAR for this age group of 800 mg/day. 28 The median intake of folate was 117 μg, compared to the EAR of 160 μg/d. 26
Energy and Nutrient Intakes of Children Aged 4 to 8 Years in Mkushi, Zambia, Derived From Tablet-Based 24-Hour Dietary Recall Tool.a
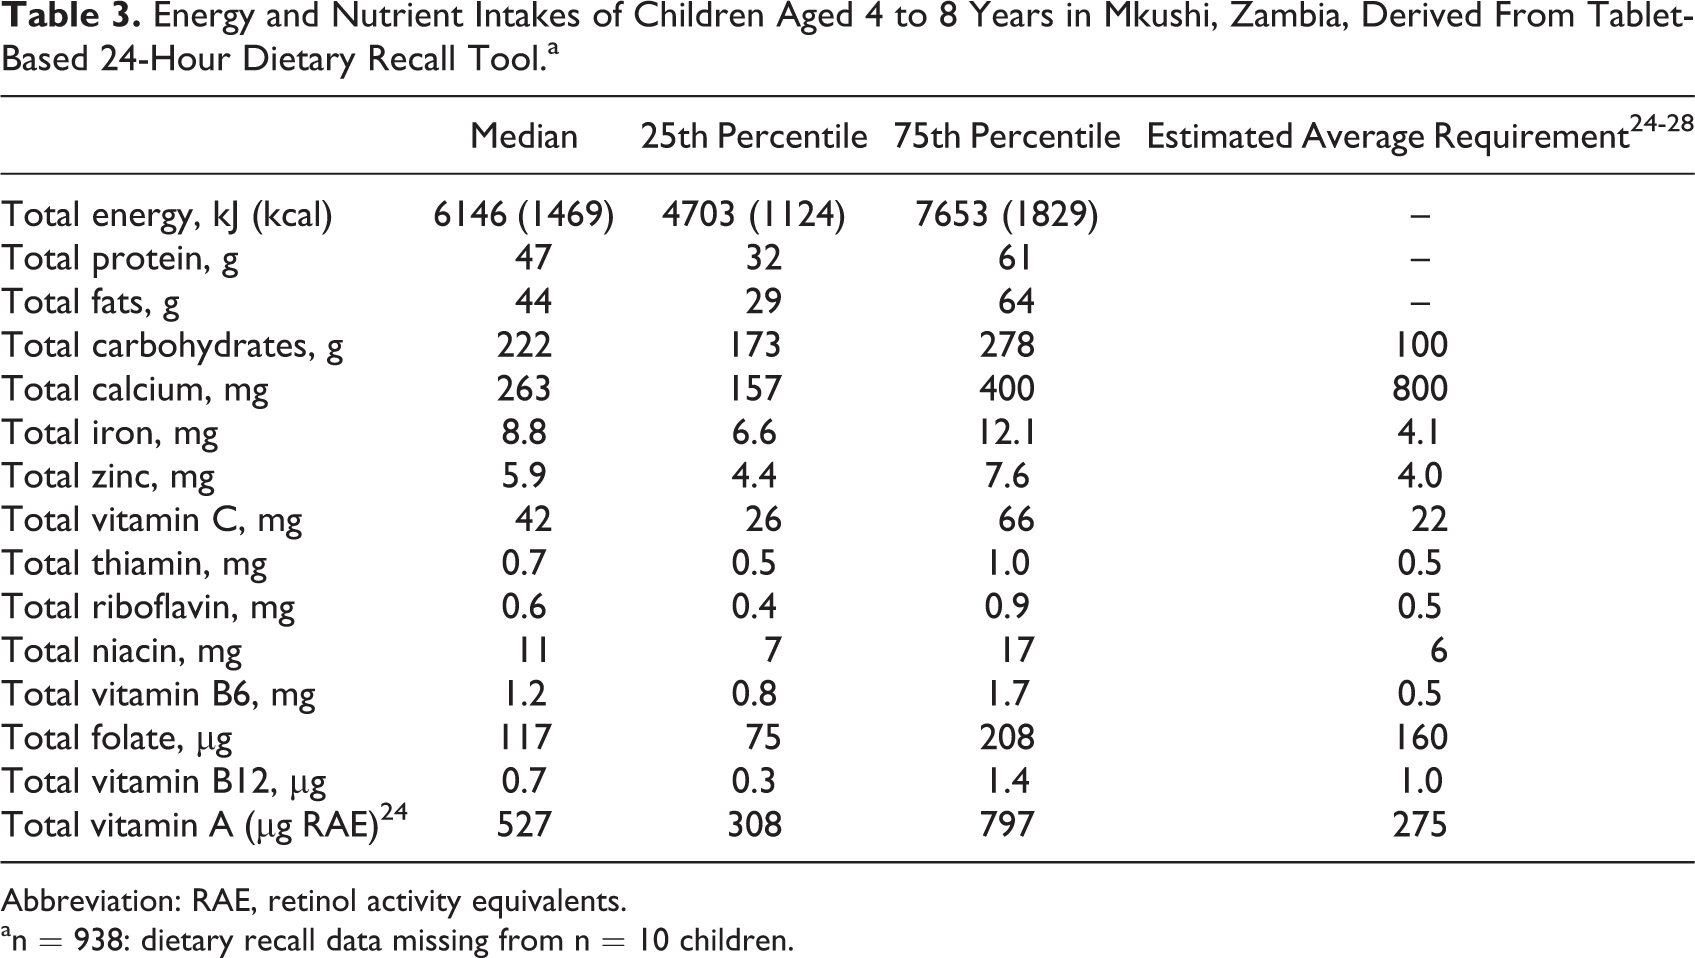
Abbreviation: RAE, retinol activity equivalents.
an = 938: dietary recall data missing from n = 10 children.
Of 6777 records of foods consumed by the included children, 21 foods were incompletely described because the respondents did not know one or more descriptive details. For 262 food records, the option to record a description for a food not found in the precoded food list was used. Of these other foods, 101 foods were local foods not included in the precoded list. In the remaining cases, the interviewer did not locate the item in the precoded list or did not know the English name. For 5 foods, the recipe was unknown to the respondent. Portion sizes were unknown for 116 foods and missing for 44 foods.
Discussion
In this article, we have described the development and use of a tablet-based tool to collect 24-hour dietary recalls in a resource-limited setting. This tool, created in the ODK survey software on the Android platform, is, to our knowledge, the first use of tablet computers for detailed dietary intake data collection. Estimates of energy intakes from our baseline assessment of 4- to 8-year-old children are consistent with the estimated energy requirements for boys and girls in this age range. 23 Our findings are also in line with data collected in the same area in 2009 using a paper-based multipass method, showing a monotonous diet composed primarily of maize-based porridge and a limited range of side dishes containing leafy green vegetables or small fish. 29
Previous tools that allow interviewers to simultaneously conduct a 24-hour recall and enter the data provided by respondents have been Windows-based software packages run on a desktop or laptop computer. 1 The Automated Multiple-Pass Method (AMPM) and Post-Interview Processing System software developed by the USDA, Nutrition Data System Research (NDSR) package by the University of Minnesota, and the EPIC-SOFT program developed for use in the European Prospective Inquiry into Cancer and Nutrition are examples of computer-based, interviewer-administered 24-hour recall tools. 30 –32 Related tools have also been developed for conducting 24-hour recall among upper primary school children and adolescents. 33 Tools have largely focused on North American or European populations. One recent exception is the New Interactive Nutrition Assistant–Diet in India Study of Health (NINA-DISH) program developed for a nationally representative survey of dietary intakes among Indian adults. 34 All of the above-mentioned tools guide interviewers and support direct data entry. They also calculate nutrient intakes from the recorded data, but in order to do so, they require the computing power and memory of a personal computer and currently cannot be run on the more portable tablet devices.
A second set of tools for dietary intake data collection are the self-administered, often Web-based programs such as the Automated Self-Administered 24-Hour Recall (ASA24) developed by the US National Cancer Institute, Oxford WebQ dietary recall program for use in the United Kingdom, and the Computer-Assisted Personal Interview System which was developed for use in Korea and includes a 24-hour recall. 35 –37 Like the computer-based tools, these Web-based, self-administered tools have been adapted for use by older children and adolescents. 38,39 This group of tools offers tremendous advantages to researchers studying diet among populations where most potential respondents have the computer access and skills needed for independently completing a 24-hour recall. However, this is not the case in many low-income countries.
Several studies have demonstrated the promise of using mobile data collection in low-income countries or remote settings. Reported benefits include reduced data entry errors 3 ; improved adherence to protocol, reduced rate of omitted data fields, reduced typographical errors, and faster data checking time 4 ; and high data completeness and faster data checking and processing. 5 Common observations include cost savings, particularly in large surveys where the cumulative costs of printing and data entry are greater than the one-time cost of purchasing tablets. 3 –5 Although we did not do a cost comparison, the total number of survey forms completed using tablets in our study, including the 24-hour recall and most other data collection, far outnumbered the point at which paper forms would exceed tablet-related costs. A second common observation is the need for technical expertise. Our study employed 1 full-time and 2 part-time information technology (IT) specialists to support forms development, design and use of the data management system, data checks, and cleaning. A final common observation is the general acceptability of tablets or personal digital assistants among both study staff and respondents. Our experience matches those described by other authors that field staff quickly mastered tablet use despite lack of prior experience, and respondents were accepting of the technology. 3,5
The tablet-based 24-hour recall tool we developed was designed to fill a need that was not met by existing tools or mobile device-based surveys. Detailed dietary data are needed to address public health problems such as micronutrient inadequacy, potential exposure to toxins, and food insecurity. The use of an interviewer-administered, tablet-based tool meets that need and offers several advantages. Using 1 set of 30 tablets, we collected data monthly among 1226 children over a study period of 7 months, in a remote setting where interviewers traveled extensively by motorcycle to reach participants’ homes. We did not experience reliability problems with general tablet operability or with the ODK survey software nor did we have instances of data loss due to lack of battery power or tablet malfunction. Issues such as freezing screens were found to be the result of operator error, quickly addressed through retraining. The tablet and minimal supporting equipment fit in small, messenger-style packs for easy transport, and the tablet allowed interviewers to work indoors or outdoors. The tablets were inexpensive (∼US$200), and the ODK survey software is available free of charge. Tablet battery life was sufficient for a full day of field work in most cases. In the event of low battery power, backup tablets and battery chargers were available from interviewer team leaders. Data collection and transfer did not require an Internet connection or cellular reception. Finally, using mobile devices for data collection has been shown to reduce data recording errors through the addition of range checks, required fields, and conditioned ordering of questions which prevents skip logic errors. 40 Through the use of required fields and conditioned ordering of questions, our data had low rates of missing or unknown values.
We encountered several challenges in developing a tool for conducting repeated 24-hour recalls in rural Zambia. Limitations in the current version of ODK software shaped our data collection tool, and use of tablets for all types of data collection requires the time and expertise of skilled IT staff. Particularly for the 24-hour recall tool, programming is made challenging by the conditional logic needed to create the correct ordering of food identification questions. Although our tool could be used as a template for future 24-hour recalls in other settings, the ODK program and food identification framework would need to be rewritten to accommodate a different local foods list. We were unable to record a list of foods consumed in the day and add detailed information to it, as is done in other 24-hour recall programs. All information on each food need to be collected together in a series of questions. This method of data collection, however, provided an advantage: breaking the traditional table into a series of questions enabled the addition of prompts to support interview quality and collection of all relevant details about each food. Future updates to our tool would be to integrate an initial quick list stage into the interview protocol using new features in ODK. The quick listing of all foods respondents remember consuming during the previous day is an important feature of other 24-hour recall programs using the multipass method developed as part of AMPM. 41 Another desired addition to this tool would be the collection of household recipes. A final key challenge, identifying food composition data for local foods, is common to dietary assessments in diverse settings. We combined available data from many different sources to arrive at estimates of nutrient contents, food weights, and nutrient retention factors, yet for some traditional and local foods, complete data were simply unavailable.
Conclusion
Tablet-based programming technology has advanced to the point that conducting 24-hour recall interviews in remote settings using tablets is not only feasible but also will make dietary data easier and more affordable to collect. Critical next steps include a validation study of the tablet-based tool, developing recall tools that are readily adaptable to different contexts, improving the availability and quality of food composition data, and linking dietary data collected on tablets to analysis software. These advances will enable efficient collection and analysis of high-quality dietary intake data for research as well as program or intervention assessment.
Footnotes
Acknowledgments
The authors thank Keith P. West, Jr. at Johns Hopkins University for his guidance on this work. The authors also thank HarvestPlus—particularly Mourad Moursi, Fabiana Moura, and Abdelrahman Lubowa—for providing the food composition tables, recipe database, and feedback. The authors acknowledge the contributions of our field staff in Zambia and both Lauren Tanz and Lee Wu at Johns Hopkins University and are grateful to the families in Mkushi District for their participation. A Harry D. Kruse Publication Award in Human Nutrition is gratefully acknowledged.
Authors’ Note
B.L.C. designed the tool, linked data with dietary databases, performed the statistical analysis, drafted the manuscript, contributed to conception and design, and contributed to analysis and interpretation. S.A.T. advised on dietary data linkages, assisted in the analysis, edited the manuscript, contributed to analysis and interpretation, and critically revised the manuscript. B.D. programmed the tablets and generated data files for analysis, contributed to design, contributed to acquisition, and critically revised the manuscript. W.S. managed field work, contributed to acquisition, and critically revised the manuscript. R.K. provided scientific guidance, contributed to the manuscript, and critically revised the manuscript. A.C.P. wrote the trial protocol, oversaw field implementation, edited the manuscript, contributed to conception and design, contributed to acquisition and interpretation, and critically revised the manuscript. All authors read and approved the final manuscript and agree to be accountable for all aspects of work ensuring integrity and accuracy. The views expressed do not necessarily reflect those of HarvestPlus. HarvestPlus had no role in the design, analysis, or writing of this article.
Declaration of Conflicting Interests
The author(s) declared no potential conflicts of interest with respect to the research, authorship, and/or publication of this article.
Funding
The author(s) disclosed receipt of the following financial support for the research, authorship, and/or publication of this article: This work was funded by HarvestPlus Challenge Grant #8251, with support from the UK Department for International Development. Additional support was provided by the Sight and Life Global Nutrition Research Institute at Johns Hopkins University.