
Abstract
Background:
A national mandatory food fortification program, fortifying wheat flour and maize meal with various micronutrients, was introduced in South Africa in 2003 to address micronutrient deficiencies.
Objective:
This study aimed to determine vitamin A, iron, and zinc content of raw maize meal and wheat flour bread sampled at household level from 2 urban and 2 rural areas in South Africa and to compare with the regulatory minimum requirements.
Methods:
Maize meal (250 g) and/or supermarket/local shop bread (3 inner slices) were collected from 50 randomly selected households from each study area. Maize meal samples were reduced to 10 composite samples per area. Bread samples were composited similarly; 1 composite sample consisted of 15 intact slices. Overall, 8 composite samples were obtained for both brown and white bread. The Southern African Grain Laboratory analyzed the samples for vitamin A, iron, and zinc.
Results:
Mean content of maize meal (100 g) represented ratios of 0.56 to 0.98 of the minimum fortification requirement for vitamin A, 0.76 to 1.08 for iron, and 0.89 to 1.00 for zinc; brown bread (100 g) represented ratios of 0.57, 1.97, and 1.67 of the minimum requirement for vitamin A, iron, and zinc, respectively, and white bread (100 g) represented ratios of 0.89, 2.22, and 2.07 for vitamin A, iron, and zinc, respectively.
Conclusion:
The variation in vitamin A, iron, and zinc content in maize meal and the higher than required iron and zinc content in wheat bread needs to be investigated in further studies.
Introduction
Fortification of staple foods is a globally accepted strategy to address micronutrient malnutrition in nutritionally vulnerable populations. In South Africa, a mandatory national food fortification program was introduced in 2003 based on the findings of 2 national surveys 1,2 and consequent recommendations regarding fortification of food staples. Currently, the 2 most commonly eaten staple foods in the country, that is, wheat flour (bread) and maize meal, are fortified by addition of a fortification mix containing vitamin A as “protected, stabilized retinyl plamitate” (1786 µg retinol equivalents [RE] per kg wheat flour; 2085 µg RE per kg maize meal), iron (35 mg electrolytic iron per kg for both wheat flour and maize meal), zinc (15 mg zinc oxide per kg for both wheat flour and maize meal) as well as other micronutrients. 3 These amounts (per 200 g raw flour; approximately 8 slices of bread) were based on the nutritional goal of providing a person aged 10 years and older with the following percentages of the recommended dietary allowance (RDA): 31% for vitamin A (RDA, 800 µg RE/d), 50% for iron (RDA, 14 mg/d), and 20% for zinc (RDA, 15 mg/d) 3,4 and took into account a retention of 70% for vitamin A in wheat flour and 60% in maize meal and a retention of 100% for iron and zinc in wheat flour/maize meal.
Little information exists about the success of the mandatory food fortification program post the 2003 implementation. Secondary data analyses of previously published food intake data and theoretical calculations showed that substituting the unfortified wheat flour bread and maize meal in the diet with the chemically analyzed fortified equivalents significantly improved the micronutrient content of the diet of adults and children. 5,6
There are 2 studies that sourced maize meal and/or white bread flour samples at the retail outlet level to assess the vitamin A content in these samples as presented to the public. Pretorius and Schönfeldt 7 analyzed 9 different brands of fortified white maize meal (total of 62 samples) they collected from supermarkets in the Tshwane-metropole during July 2005 to November 2008 and reported the mean vitamin A content to range from 19 µg RE/100 g (brand with lowest content) to 261 µg RE/100 g (brand with highest content). Eight of the 9 brands had lower vitamin A content than the regulatory minimum requirement of 187.7 µg RE/100g. 3 A more recent study determined the vitamin A content of 145 maize meal and 46 white bread flour samples collected from retail outlets covering all 9 provinces in South Africa between November 2010 and March 2011. 8 The mean vitamin A content was not reported, but the majority (> 85%) of both maize meal and white bread flour samples had vitamin A content below the minimum statutory fortification requirements, 187.7 µg RE/100 g for maize and 161 µg RE/100 g for white bread flour. Iron content was not quantified, but a qualitative test showed iron to be present in 83% of maize meal and in 85% of white bread flour samples. Both of these studies sampled at retail level, and no information is available on the micronutrient content of the fortified staples at household level.
As part of a larger study that determined the vitamin A status of preschool children in 4 different geographical areas in South Africa, 9 we sampled uncooked fortified maize meal and fortified wheat flour bread at the household level from each of the 4 geographical areas and determined the vitamin A, iron, and zinc content of these samples. The aim was to compare the chemically analyzed content with the regulatory minimum requirements (summarized in Table 1) as stipulated by the regulations relating to the fortification of certain foodstuffs. 3
Vitamin A, Iron, and Zinc Fortification Standards for Uncooked Maize Meal, Brown, and White Wheat Flour Bread in South Africa.a
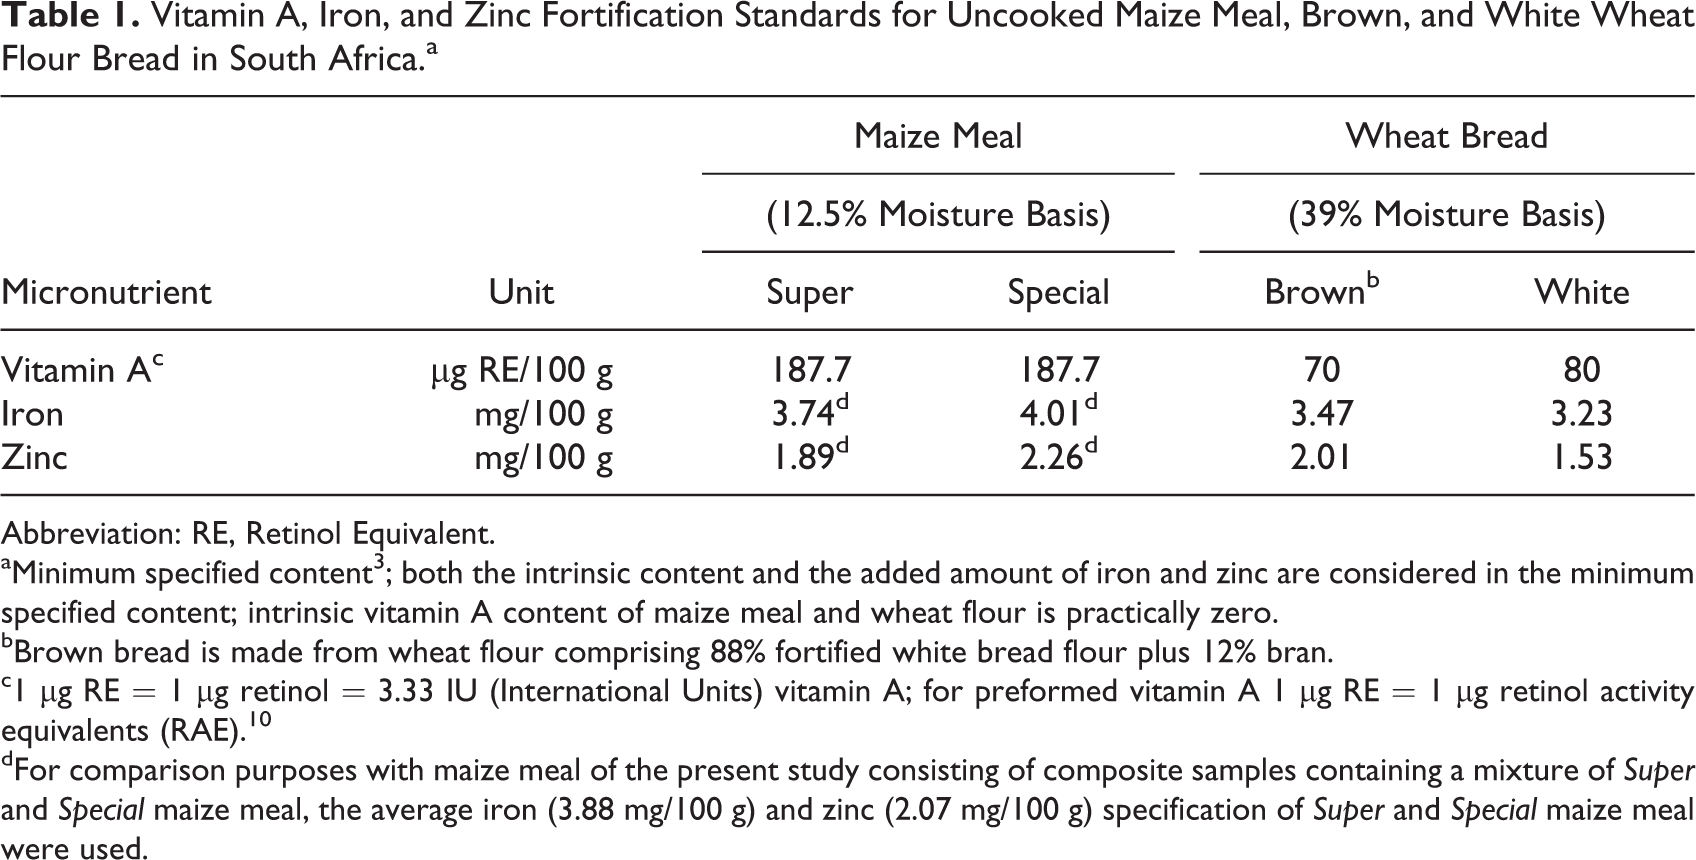
Abbreviation: RE, Retinol Equivalent.
aMinimum specified content 3 ; both the intrinsic content and the added amount of iron and zinc are considered in the minimum specified content; intrinsic vitamin A content of maize meal and wheat flour is practically zero.
bBrown bread is made from wheat flour comprising 88% fortified white bread flour plus 12% bran.
c1 µg RE = 1 µg retinol = 3.33 IU (International Units) vitamin A; for preformed vitamin A 1 µg RE = 1 µg retinol activity equivalents (RAE). 10
dFor comparison purposes with maize meal of the present study consisting of composite samples containing a mixture of Super and Special maize meal, the average iron (3.88 mg/100 g) and zinc (2.07 mg/100 g) specification of Super and Special maize meal were used.
Materials and Methods
Study Population
The study population and purposely selected geographical areas, based on known distinct eating patterns, have been described for the main study. 9 Briefly, the study population resided in 2 rural areas, one in the KwaZulu-Natal (KZN) Province and one in the Limpopo Province (LP), and in 2 urban areas, one a metropolitan coastal region of the Western Cape (WC) Province and the other an urban area in the Northern Cape (NC) Province. According to consumption patterns (based on 24-hour recall data collected during a national survey in 1999), maize is the staple predominantly consumed in both KZN and LP, while white bread is the staple most often consumed in WC. In NC, both maize and bread (brown and white) are consumed. 2
Collection of Maize Meal and Bread Samples
Each study area was divided into 5 sections using an area map. Food sample collection in each of the study areas was done on 3 consecutive days from randomly selected households in randomly selected streets within each section. The assumption was made that most households would have maize meal but not necessarily also bread. Thus, in each section, food was sampled until 10 maize meal samples were obtained, regardless of the number of bread samples obtained, before moving on to the next section. Food sampling was concluded when 50 maize meal samples were collected for each study area. A fieldworker, who accompanied a study researcher during the food sampling process, was recruited from the local community. The field worker was trained to (1) introduce and explain the purpose for sampling maize meal and bread at household level and (2) administer a short food sampling questionnaire recording, for example, the date of sampling, brand name of the food, package size, and when and where the food was bought. To each household willing to provide a maize meal and/or bread sample, a 500 g packet of maize meal and/or half a loaf of bread was donated to compensate for the food sampled.
Maize meal was sampled in 250-mL polypropylene jars with screw caps and compacted to exclude air as much as possible (no void volume between maize meal and lid). Three inner slices of an available brown or white loaf of bread were put in a Zip Seal Glad freezer bag and sealed airtight. All bread samples were stored at −20°C, and maize meal samples were kept at ambient temperature for the duration of the fieldwork (3 days).
On the last day of food sampling, in each study area, the 50 maize meal samples were reduced to 10 composite samples. The samples were ranked in order of collection for each of the 5 sections. Each composite sample was prepared by randomly selecting 1 sample (regardless of brand name) from each of the 5 sections. These 5 samples were then homogenized by thoroughly mixing them in a bowl, after which a clean polypropylene jar was filled and the contents compacted. This process was repeated 10 times so as to constitute the 10 composite maize meal samples.
After completion of the fieldwork, the composite maize meal samples (kept at ambient temperature) and frozen bread samples (in sealed containers containing ice-packs) were transported to the laboratory of the South African Medical Research Council in Cape Town where the bread samples were kept at −20°C. Within 2 weeks, composite bread samples were prepared as described for the maize meal samples except that brown and white bread were composited separately (because of different fortification standards; Table 1), and the bread slices were kept intact; one composite bread sample consisted of 15 slices. Care was taken throughout the food sampling schedule and sample transportation to protect the food samples from direct sunlight.
The composited maize meal (ambient temperature) and composited frozen bread samples (shipped on dry ice) were sent by courier to the laboratory of the Southern African Grain Laboratory (SAGL) in Pretoria for determination of vitamin A, iron, zinc, and moisture content.
Analyses of Micronutrients
The SAGL, a South African National Accreditation System accredited laboratory, was contracted to do all the analyses, and SAGL also analyzed the maize meal and bread flour samples for the study of Yusufali et al. 8
A loaf of brown and white wheat flour bread were purchased on the same day food sampling commenced in each geographical area. The purchased bread was analyzed fresh, and the remainder of the bread was then frozen at −20°C and concomitantly analyzed with the frozen bread samples of this study. This was done as an internal control measure to verify or exclude changes that may have occurred with the nutrients in question during the period the sampled bread was frozen. Frozen bread samples were allowed to thaw completely at room temperature before analysis commenced.
For each type and set of determinations, SAGL included appropriate in-house quality control reference samples. The moisture content of maize meal was determined by measuring the weight loss of a portion of between 2 and 3 g of the individual composite samples using the AACCI Method 44-15.02. 11 Each composite bread sample (15 slices) was cut into half, and the moisture content determined as the difference between the original mass of the 15 halved slices of bread and the dry solid mass after drying in a hot air oven at 105°C for 6 hours. 12 The other 15 halved slices was homogenized and portions used for determining the vitamin A, iron, and zinc content. Vitamin A in 5 g portions of the test samples was determined as retinol (fortificant in maize meal and wheat flour is retinyl palmitate) by reverse-phase high-performance liquid chromatography using the SAGL In-House Method No. 001 developed from published methods. 13 –15 Iron and zinc were determined in 0.5 g digested portions of the test samples by flame atomic absorption spectrometry using the SAGL In-House Method No. 10 developed from published methods. 16,17
Data Analysis
The chemically analyzed micronutrient content was entered into Microsoft Office Excel 2007 and the means and standard deviations calculated. Mean vitamin A, iron, and zinc content per 100 g product are expressed according to the specified moisture basis per legislation for maize meal (12.5%) and for wheat flour bread (39%). The analyzed nutrient content is also expressed as a ratio of the legislative minimum required content (analyzed/minimum requirement).
Ethical considerations
The Ethics Committee of the Medical Research Council of South Africa approved the study (EC10-020). The relevant provincial departments of Health were informed. Local councilors and community leaders gave permission to do the study.
Results
The number of food samples collected and the number of composite samples prepared for analysis by food type and study area are shown in Table 2. A complete set of composite maize meal samples (10 per study area) was obtained. As expected, fewer composite bread samples were obtained per study area. The urban WC study area produced the most composite bread samples, 9 in total (6 white and 3 brown), while the other areas produced a total of either 2 or 3 composite bread samples.
Number of Food Samples Collected and Number of Composite Samples Prepared.
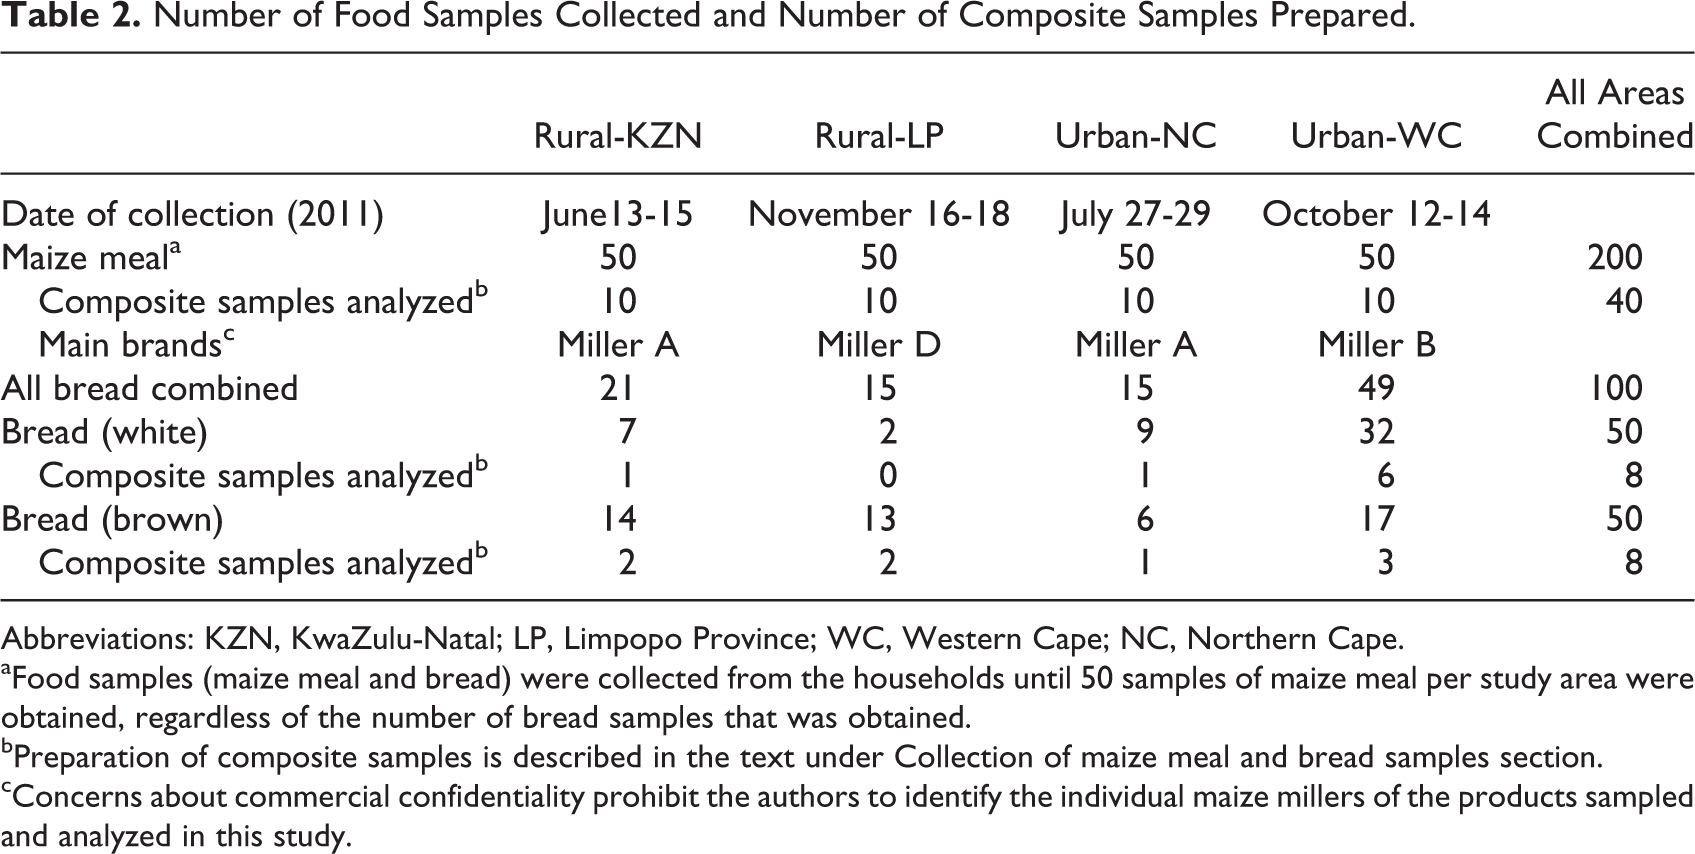
Abbreviations: KZN, KwaZulu-Natal; LP, Limpopo Province; WC, Western Cape; NC, Northern Cape.
aFood samples (maize meal and bread) were collected from the households until 50 samples of maize meal per study area were obtained, regardless of the number of bread samples that was obtained.
bPreparation of composite samples is described in the text under Collection of maize meal and bread samples section.
cConcerns about commercial confidentiality prohibit the authors to identify the individual maize millers of the products sampled and analyzed in this study.
For 80% of the samples in the urban WC study area, the maize meal was bought from a supermarket. In urban NC and rural KZN areas, 94% and 96% of the samples, respectively, were from maize meal bought from either a supermarket or a local or spaza shop, while in the rural LP area 98% of the maize meal sampled was bought from a local or spaza shop. A spaza shop is an informal convenience shop operated from a household. In the urban WC area, the most popular packaging size ranged from 500 g to 5 kg, while in the urban NC area, it ranged from 500 g to 12.5 kg. In the rural KZN area, the most popular packaging size was 10 or 12.5 kg, and to a lesser extent 25 kg, while in the rural LP area, it was 50 or 80 kg and to a lesser extent 25 kg. For the total sample, the “best before date” has elapsed for 5.5% of the sample, while this information was not available for 48.5% of the samples. Nearly, all the samples were from maize meal that was bought within the last 2 months. Brand names from miller A had the highest representation in households in urban NC and rural KZN (90% and 60%, respectively); 90% of the maize meal samples from households in urban WC were from miller B; and maize meal from miller D had 80% representation in households in rural LP. Overall, 134 (67%) of the maize meal samples collected represented millers A and B that produce a considerable portion of the market share of white maize meal in South Africa. Where the packaging of the maize meal was available (n = 187, 93.5%), the fortification logo was on the packaging for all maize meal samples collected. Concerns about commercial confidentiality prohibit the authors to identify the individual maize millers of the products sampled and analyzed in this study.
Of the total of 21 bread samples obtained in rural KZN, more brown (n = 14; 66.7%) than white bread (n = 7; 33.3%) were obtained, and of the bread sampled, all white and most brown bread (86%) were bought from either a local or spaza shop. From each of the rural LP and urban NC areas, only a total of 15 bread samples could be obtained, with 50% to 55.5% of white bread and 92% to 100% of brown bread being bought from either a local or a spaza shop. The most bread samples (n = 49), of which 32 (65.3%) were white and 17 (34.7%) were brown, were obtained in the urban WC area, with approximately 75% of the bread being bought from a local or spaza shop. For the total number of bread sampled (n = 100), 90% of the households bought the bread on either the day of sampling or the previous day. For 18% of both the total number of white and brown bread samples collected, the fortification logo was not printed on the packaging.
The selected micronutrient content of the analyzed composite samples (mean and standard deviation) as well as the micronutrient content expressed as a ratio of the fortification standards (analyzed/minimum requirement) for uncooked fortified maize meal, and the fortified wheat flour bread sampled at households from the 4 study areas are presented in Table 3. The mean vitamin A content (µg retinol activity equivalents; RAE) of maize meal from the different areas ranged from 106 µg RAE/100 g (urban WC) to 183 µg RAE/100 g (urban NC). Mean of all samples combined was 138 µg RAE/100 g. The vitamin A content of 5 composites (varying between 190 and 272 µg RAE/100 g) met or exceeded the regulatory requirement of 187.7 µg RAE/100 g. Expressed as a ratio of the fortification standard (analyzed/minimum requirement), the mean vitamin A content in maize meal across the areas ranged from 0.56 to 0.98, and overall was 0.73. The mean iron and zinc content of maize meal from the different areas ranged from 3.0 mg/100 g (rural LP) to 4.2 mg/100 g (urban NC) and from 1.8 mg/100 g (urban WC) to 2.1 mg/100 g (urban NC), respectively. Mean of all samples combined was 3.5 and 1.9 mg/100 g for iron and zinc, respectively. The iron content of 13 composites (varying between 3.94 and 4.89 mg/100 g) met or exceeded the regulatory requirement of 3.88 mg/100 g. With regard to the zinc content, 12 composites (varying between 2.07 and 2.41 mg/100 g) met or exceeded the regulatory requirement of 2.07 mg/100 g. Expressed as a ratio of the fortification standard (analyzed/minimum requirement), the mean iron and zinc content across the areas ranged from 0.76 to 1.08 (overall 0.90) and 0.85 to 1.00 (overall 0.91), respectively, for iron and zinc.
Micronutrient Content of Uncooked Fortified Maize Meal (12.5% Moisture Basis) and Wheat Bread (39% Moisture Basis) at Household Level From Different Geographical Areas in South Africa.a
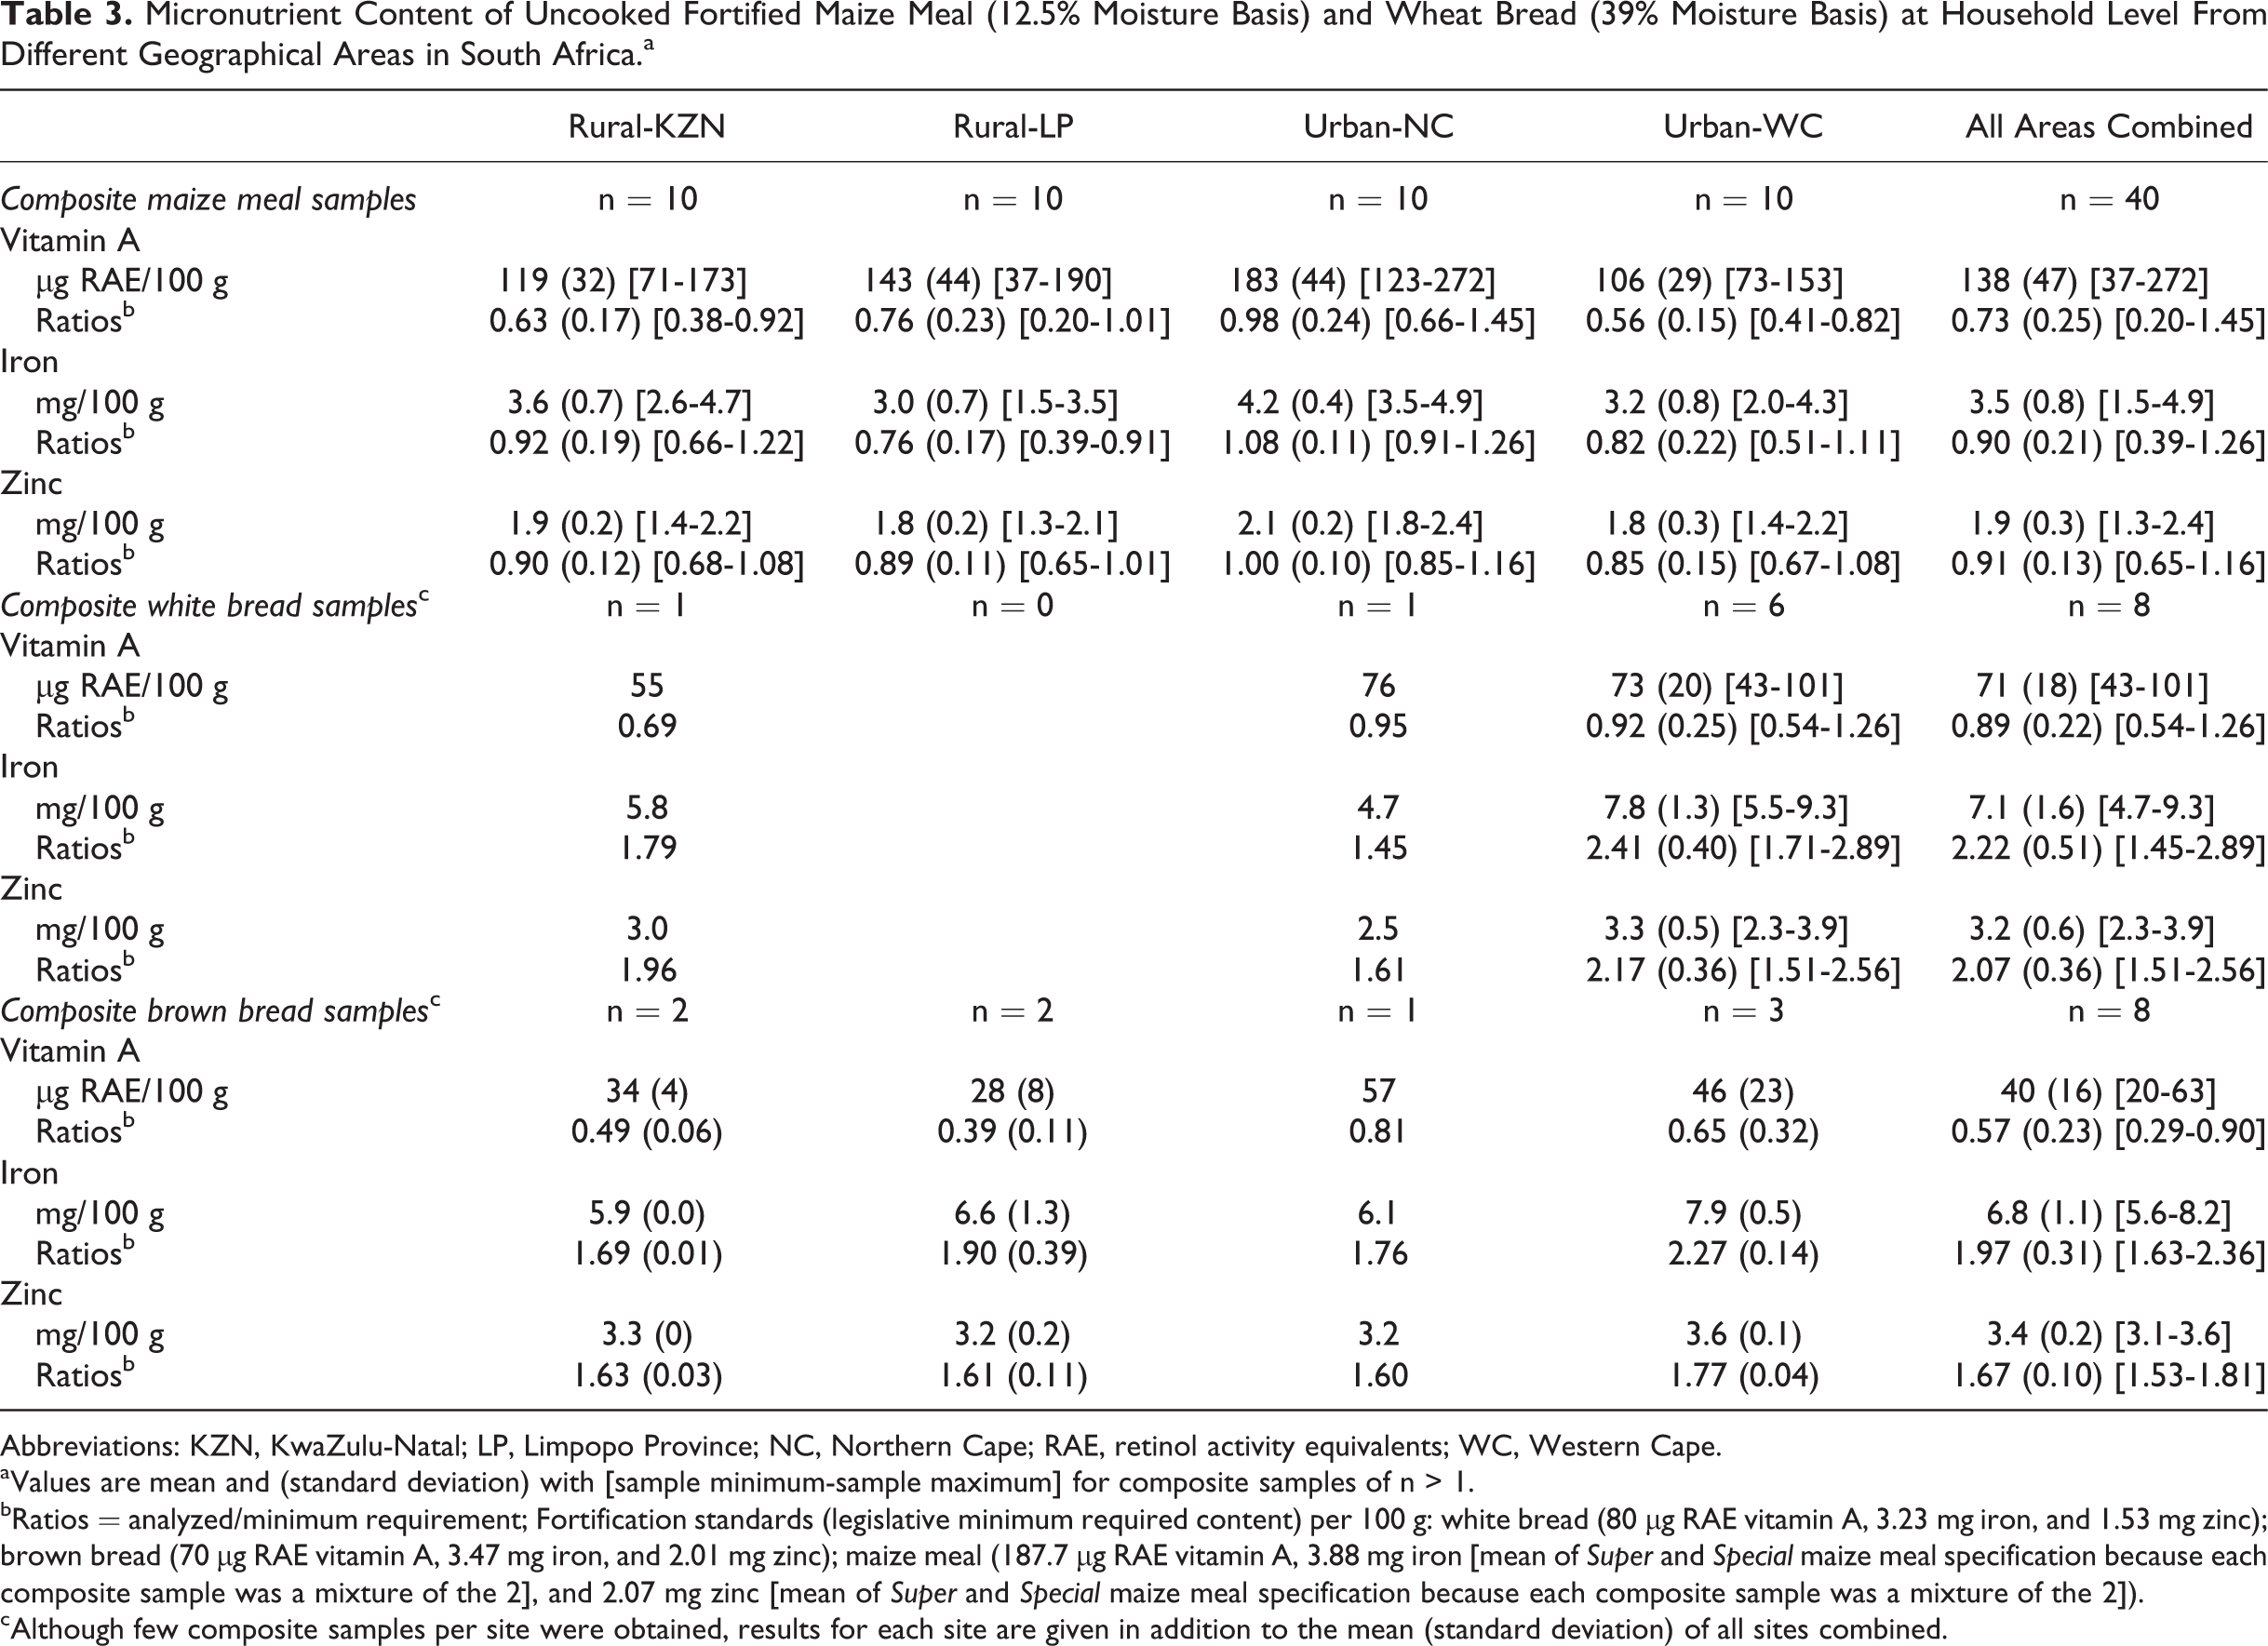
Abbreviations: KZN, KwaZulu-Natal; LP, Limpopo Province; NC, Northern Cape; RAE, retinol activity equivalents; WC, Western Cape.
aValues are mean and (standard deviation) with [sample minimum-sample maximum] for composite samples of n > 1.
bRatios = analyzed/minimum requirement; Fortification standards (legislative minimum required content) per 100 g: white bread (80 μg RAE vitamin A, 3.23 mg iron, and 1.53 mg zinc); brown bread (70 μg RAE vitamin A, 3.47 mg iron, and 2.01 mg zinc); maize meal (187.7 μg RAE vitamin A, 3.88 mg iron [mean of Super and Special maize meal specification because each composite sample was a mixture of the 2], and 2.07 mg zinc [mean of Super and Special maize meal specification because each composite sample was a mixture of the 2]).
cAlthough few composite samples per site were obtained, results for each site are given in addition to the mean (standard deviation) of all sites combined.
The results for the selected micronutrient content of the fortified wheat flour white and brown bread sampled are presented in Table 3. The results will be described using the mean of the composite samples for all areas combined (brown bread, n = 8; white bread, n = 8), as there are too few composite samples to describe the results per area. As expected, because the minimum requirements differ, the mean vitamin A content of white bread was higher (71 µg RAE/100 g; ranging from 43 to 101 µg RAE/100 g) than for brown bread (40 µg RAE/100 g; ranging from 20 to 63 µg RAE/100 g) representing a ratio of 0.89 and 0.57, respectively, of the regulatory requirement of 80 µg RAE/100 g for white bread and 70 µg RAE/100 g for brown bread. Two of the white bread composite samples, and none of the brown bread composite samples (vitamin A ratios varying between 0.29 and 0.90), exceeded the regulatory requirement for vitamin A. The mean iron and zinc content of white bread were 7.1 mg/100 g (ranging from 4.7 to 9.3 mg/100 g) and 3.2 mg/100 g (ranging from 2.3 to 3.9 mg/100 g) representing a ratio of 2.22 and 2.07, respectively, of the regulatory requirement of 3.23 mg/100 g for iron and 1.53 mg/100 g for zinc. In terms of the iron content, each of the 8 composite white bread samples exceeded the regulatory requirement and 5 composites exceeded a ratio of 2.00 (varying between 2.30 and 2.89) of the requirement for iron. Similarly, each of the 8 composite white bread samples exceeded the regulatory requirement for zinc, and the same 5 composites, as was found for iron content, exceeded a ratio of 2.00 (varying between 2.09 and 2.56) of the requirement. For brown bread, the mean iron and zinc contents were 6.8 mg/100 g (ranging from 5.6 to 8.2 mg/100 g) and 3.4 mg/100 g (ranging from 3.1 to 3.6 mg/100 g) representing a ratio of 1.97 and 1.67, respectively, of the regulatory requirement of 3.47 mg/100 g for iron and 2.01 mg/100 g for zinc. For both iron and zinc, each of the 8 composite brown bread samples exceeded the regulatory requirement, and 4 composites exceeded a ratio of 2.00 (varying between 2.12 and 2.36) of the requirement for iron.
Discussion
This is the first study, to our knowledge, that determined the vitamin A, iron, and zinc content of uncooked fortified maize meal and of fortified wheat flour bread available for consumption under real-life situations sampled from households in 4 different areas in South Africa. Although our results are not representative on a national basis, but rather representative of four different areas from 4 provinces at one point in time, it nevertheless adds important and useful information to a very limited pool of data with regard to the effectiveness of the fortification program. We do not regard the regulatory minimum requirements (summarized in Table 1) as stipulated by the regulations relating to the fortification of certain foodstuffs 3 as the “golden standard set in stone” but use it purely as a reference to show what has been achieved, with regard to the vitamin A, iron, and zinc content, in the fortified products at household level.
In terms of maize meal at the household level, the mean vitamin A content (per 100 g) represented ratios of 0.56 (urban WC), 0.63 (rural KZN), 0.76 (rural LP), 0.98 (urban NC), and overall 0.73 of the fortification standard. The mean iron content represented ratios of 0.76 (rural LP), 0.82 (urban WC), 0.92 (rural KZN), 1.08 (urban NC), and overall 0.90 of the fortification standard. The mean zinc content had ratios of 0.85 (urban WC), 0.89 (rural LP), 0.90 (rural KZN), 1.00 (urban NC), and overall 0.91 of the fortification standard. Although the micronutrient content was corrected and expressed according to the specified moisture basis of 12.5% for maize meal, per legislation, it can be deducted that the true moisture content of the maize samples had a negligible effect on our corrected results. The mean moisture content of the composite maize meal samples did not differ between the 4 areas, and the overall mean (n = 40) was 13.3% (results not shown). The low vitamin A content, lower than the statutory minimum requirement, found in the majority of the composite maize meal samples of our study is similar to the low vitamin A content found in maize meal samples sourced from retail outlets by others. 7,8 The overall mean of our study (138 µg RAE/100 g; varying between 37 and 272 µg RAE) is similar than the calculated mean (136 µg RAE/100 g; varying between 19 and 261 µg RAE) of the 9 brands analyzed by Pretorius and Schönfeldt, 7 and we assume that the mean vitamin A content of the 145 maize meal samples analyzed by Yusufali et al 8 estimated from the graphical display of their reported results would be similar. This could be a concern because the results is in contrast to the objective of the national staple food fortification program of South Africa which is to ensure that the South African population receive specific quantities of selected micronutrients through consumption of certain staple foods.
Pretorius and Schönfeldt 7 argued that possible reasons for the low vitamin A content and the large variation within the same brand and between brands could be as a result of substandard premixes, inadequate mixing (heterogeneous distribution) of the fortification premix into the maize meal, segregation of the fortificant and the maize meal, and storage losses or poor quality control by the milling companies. On the other hand, Yusufali et al 8 found a strong correlation between the nicotinamide (relatively stable compound) and vitamin A content in maize meal samples (less so for bread flour) of their study and argued that losses of vitamin A (stability) or incorrect composition of premix (ratio of vitamin A and nicotinamide in the premix) are not significant. Instead, their results suggested that most of the variation in values for both vitamins could rather be attributed to insufficient addition of the fortification premix to the maize meal and wheat flour at the mills. Only premixes from registered suppliers whose premix quality is monitored may, according to the regulations, be used for fortification of maize meal and bread flour in South Africa. 3 This is, however, by definition not an absolute guarantee of consistent premix quality. Unfortunately, we did not analyze the fortification premix and unfortified products.
Our results of the household level maize meal samples also suggest variation or inconsistent addition of the fortification premix dosages at the mills because overall and within the same composite sample, only 10% (n = 4) of the 40 composite maize meal samples had vitamin A, iron, and zinc content above the statutory minimum requirement while for 60% (n = 24) of the composite samples, the content of all 3 micronutrients were lower than the statutory minimum requirement. The remainder of the composite samples (n = 12, 30%) were lower in either only 1 or in 2 of the 3 micronutrients. We did not analyze individual brand names, and although from a cost constraint point of view we analyzed composite samples (1 composite sample comprised a homogenized mixture of 5 samples irrespective of brand), our results nevertheless represent a true reflection of the micronutrient content of maize meal at household level. Maize meal samples from the urban WC area had the lowest mean vitamin A content and had brand name representivity of 90% from miller B. Maize meal samples from urban NC had the highest mean vitamin A, iron, and zinc content with 90% representivity from miller A. This suggests that, at some of the millers, inadequate quantities of the premix are added and/or that the distribution of the added premix in the maize meal is not homogeneous. Yusufali et al 8 provided several scenarios for improvement of which 1 solution is for the maize millers to improve the control of the fortification premix addition in order to increase the minimum level of micronutrients and to result in a more uniform addition and mixing process.
It is important to note, bearing in mind the fact that the intrinsic vitamin A content in unfortified maize meal is practically zero, the majority of the population is already receiving the benefit of additional vitamin A intake from fortified maize meal. Considering Super and Special maize meal combined and assuming a calculated average 7,18,19 vitamin A retention (about 49%) in soft porridge, the overall mean vitamin A content in our study translates to 77 µg RAE/100 g on a dry weight basis, providing 28% of the estimated average requirement (EAR; 275 µg RAE per day 10 ) for 4- to 8-year-old children, and it is about two-thirds of the original nutritional goal of 31% of the RDA of 800 µg RAE/d for individuals older than 10 years set by the regulation per 200 g maize meal. The overall mean iron and zinc contents of maize meal of the present study translate to 85% and 47% of the EAR of 4.1 and 4.0 mg/d, respectively, for children aged 4- to 8-year old. 10 Subtracting a calculated average intrinsic 3,19 iron and zinc contents from the overall means of our study and assuming the remainder (2.62 mg iron/100 g and 0.97 mg zinc/100 g) is as a result of the fortification, it represents 37% and 13% compared to the original nutritional goal set by the regulation per 200 g maize meal for iron (50% of the RDA of 14 mg iron/d) and zinc (20% of the RDA of 15 mg zinc/d), respectively, for individuals older than 10 years.
With regard to the micronutrient content of white and brown wheat flour bread, our study has a limitation because too few samples per area were collected (Table 2) in order to interpret the results per area. However, the overall mean micronutrient content of 8 composite samples (all areas combined) each for white and brown bread provides important information on the vitamin A, iron, and zinc content at household level. For white bread, the mean vitamin A content (per 100 g) of the 8 composite household level samples represented a ratio of 0.89, and both the mean iron and zinc contents were more than 2-fold the regulatory minimum requirements. The overall mean vitamin A, iron, and zinc content in brown bread (per 100 g) had ratios of, respectively, 0.57, 1.97, and 1.67 of the regulatory requirements. Based on the overall mean, our results show that only 100 g of white bread (about 3 slices) and brown bread (about 2.5 slices) can provide approximately 100% of the nutritional goal set by the national fortification program for iron (7 mg/d) and zinc (3 mg/d), but only 16% (brown bread) and 28% (white bread) of the nutritional goal (250 µg RAE/day) set for vitamin A. However, similar to unfortified maize meal, the intrinsic vitamin A content in unfortified wheat flour bread is practically zero, and the benefit of additional vitamin A intake from fortified wheat flour bread is evident. The reasons for the excess iron and zinc and the suboptimal vitamin A content in the bread are not clear, and further studies are needed to investigate the excess iron and zinc as well as the stability of vitamin A in bread. It should be noted that the intrinsic content of iron and zinc per 100 g unfortified white and brown bread considered by the regulation 3 is in the same range as that reported for both white (1.7 mg iron; 1.03 mg zinc 20 ) and brown (1.9 mg 20 and 1.64 mg 21 iron; 1.4 mg zinc 20 ) bread and thus probably do not contribute to the higher iron and zinc content obtained in our study as would have been expected from wheat flour with higher intrinsic content of these 2 nutrients. The monitoring of iron content is especially important, as continued intake of too much iron could be harmful in subsections of the population that eat excessive amounts of bread and may have a genetic predisposition for iron overload. 22
Currently, apart from the 2 studies that quantified the vitamin A content in maize meal at the retail level, 7,8 the only other available data in South Africa on the vitamin A, iron, and zinc content of fortified maize meal and white and brown fortified wheat flour bread are provided in the South African Food Composition Database (SAFOODS). 23 The nutrient content provided in SAFOODS 23 for uncooked fortified maize meal and maize meal products as well as for fortified wheat flour and therefore fortified white and brown bread was obtained by 2 studies, 19,20 conducted under “small-scale” controlled conditions and were designed to specifically obtain chemically analyzed reference nutrient values that could serve as a guideline for the food industry, with reference to the national fortification program. Corrected for moisture content (12.5%), the vitamin A, iron, and zinc content per 100 g uncooked Super (fat percentage less than 2) maize meal represent ratios of, respectively, 0.98, 0.69, and 1.09 of the regulatory minimum requirements. For uncooked Special (fat percentage between 2 and 3) maize meal, it is, respectively, 1.24, 0.72, and 1.28 of the regulatory minimum requirements for vitamin A, iron, and zinc. 23 The vitamin A, iron, and zinc content (per 100 g) of fortified white wheat flour bread provided by SAFOODS 23 are, respectively, 1.36, 1.11, and 1.41 of the regulatory minimum requirements; and for brown wheat flour bread, it is, respectively, 1.20, 1.18, and 2.23, of the regulatory minimum requirements for vitamin A, iron, and zinc.
The results of our study, together with the results of the limited number of other available studies, 7,8,19,20 show that fortifying raw maize meal and wheat flour according to the national fortification guidelines is inherently problematic. Further studies are needed to investigate the quality/micronutrient content of the fortification premix, stability of vitamin A, possible contamination during the baking process as well as the current intrinsic nutrient content of the unfortified products/flours. The process constraints faced by millers in order to ensure that regulatory requirements for the micronutrients in the fortified products are met also needs to be investigated. The large variation in vitamin A, iron, and zinc content reported for maize meal and wheat flour bread could have an impact on the results and conclusions of dietary surveys in South Africa, particularly as maize meal porridge and bread are staple foods that are frequently consumed in significant amounts by a large majority of the population.
Conclusion
The goal of the South African national staple food fortification program is to ensure that the population receive specific quantities of selected vitamins and minerals through consumption of certain staple foods, that is, maize meal and wheat flour bread as a strategy to control micronutrient deficiencies. Results of the chemically analyzed raw fortified maize meal samples collected at household level in the present study indicate that in most composite samples variation or inconsistent addition of the fortification premix dosages probably occurs at some of the mills. However, the fortified wheat flour bread results suggest vitamin A instability and a large excess of iron and zinc that needs to be investigated in further studies.
Furthermore, irrespective of the challenges the industry are faced with, it needs to be appropriately addressed and solved in a government–industry partnership manner in order to strengthen the national staple food fortification program in reaching its intended goal. Our results show that food fortification is a reality in South Africa and that the population is receiving the benefit of higher micronutrient intakes through consumption of maize meal and wheat flour bread. Procedures, despite probable limited resources, which should be in place in order to ensure the success of the fortification program include inter alia efficient monitoring, evaluation, regulation, and quality assurance of fortification premixes as well as the method of premix addition to maize meal and wheat flour at the mills to ensure consistent homogeneity. Nevertheless, our study adds to the limited pool of information that exists regarding the effectiveness of South Africa’s food fortification program.
Footnotes
Authors’ Note
Paul J van Jaarsveld conceptualized and designed the food collection study; was responsible for food sampling, data collection, and analysis; and drafted the manuscript. Mieke Faber initiated, conceptualized, and designed the study; was responsible for data analysis and for academic input in writing of the manuscript. Martha E van Stuijvenberg contributed to academic input in writing of the manuscript. All authors read and approved the final manuscript. PJvJ, MF and MEvS were previously affiliated with the Nutritional Intervention Research Unit, currently with the Non-Communicable Diseases Research Unit of the South African Medical Research Council.
Acknowledgments
The authors thank the households who supplied the food samples for the study as well as the community liaison officers and fieldworkers who assisted with sample and data collection.
Declaration of Conflicting Interests
The author(s) declared no potential conflicts of interest with respect to the research, authorship, and/or publication of this article.
Funding
The author(s) received no financial support for the research, authorship, and/or publication of this article: This work was supported by a grant from SIGHT AND LIFE, Basel Switzerland, supplemented by the South African Medical Research Council. The authors declare that they have no competing interests.