
Abstract
Background:
Household Consumption and Expenditures Surveys (HCES) are potential sources of data on dietary patterns for planning fortification programs, but they rarely have been compared with individual-level dietary assessment methods.
Objective:
To compare apparent consumption of fortifiable foods estimated from the Third Cameroon Household Survey (ECAM3) with the results of a national dietary survey using food frequency questionnaire (FFQ) and 24-hour recall (24HR) methods among women aged 15 to 49 years and children aged 12 to 59 months.
Methods:
We estimated coverage and frequency of consumption in the previous week (ECAM3 and FFQ) and coverage and amount consumed on the previous day (ECAM3 and 24HR) of refined vegetable oil, wheat flour, sugar, and bouillon cubes.
Results:
Coverage in the past week as measured by the ECAM3 and FFQ, respectively, was 64% vs. 54% for oil, 60% vs. 92% for flour, 69% vs. 78% for sugar, and 85% vs. 96% for bouillon cubes. The different methods identified similar patterns of coverage among subgroups for oil, but patterns for other foods were variable. Frequency of consumption and previous-day coverage were lower with the ECAM3 than with the FFQ and 24HR, likely reflecting infrequent acquisition relative to intake. For women, the mean amounts consumed on the previous day (among consumers) were 43 vs. 29 g of oil, 71 vs. 83 g of flour, 42 vs. 32 g of sugar, and 5.0 vs. 2.4 g of bouillon cubes (ECAM and 24HR, respectively).
Conclusions:
HCES provide useful information on patterns of food access but inadequate information on individual consumption amounts to estimate appropriate food fortification levels.
Keywords
Introduction
Development, monitoring, and evaluation of food fortification programs require information on both micronutrient status and dietary intakes of the target populations (i.e., those most at risk for micronutrient deficiencies) 1,2 . First, data on the prevalence of micronutrient deficiencies, inadequate micronutrient intakes, or both are necessary to justify the need for public health programs to increase micronutrient intake. Once the need for a food fortification program is established, several types of dietary intake data can inform program design. Selection of appropriate food vehicles requires information on the proportion of the population that consumes potentially fortifiable foods, particularly among population subgroups (e.g., geographic or socioeconomic groups) at risk for micronutrient deficiency, as well as assessment of the frequency of consumption or some other measure of whether the food is regularly consumed. Finally, to determine appropriate fortification levels, information on total dietary intake of foods and nutrients is needed to establish appropriate fortification levels by modeling the potential contribution of fortified foods to nutrient intake adequacy (and risk of excessive intakes, where applicable).
Various methods are available for collecting these data, but there are often tradeoffs between the cost of data collection and the quality of the data, its level of detail, or both 2,3 . Large-scale dietary surveys using methods such as 24-hour dietary recalls (24HR), which yield individual-level information on both food and nutrient intakes, are rarely conducted due to the financial and technical resources required, particularly if they are implemented as stand-alone surveys. Therefore, alternative methods are needed to obtain information on dietary intake patterns in areas where large dietary surveys are not feasible or are repeated infrequently.
Household Consumption and Expenditures Surveys (HCES) have received increased consideration for planning and monitoring fortification programs because these surveys are routinely conducted in most countries and include information on household food acquisition 4,5 . The surveys have the advantages of being conducted regularly (approximately every 3 to 10 years, depending on the country) and generally enrolling large samples that are nationally representative and regionally disaggregated. 5 Thus, HCES can be used to estimate the consumption of fortified or potentially fortifiable foods, without the need for independent dietary surveys. However, HCES were not developed specifically for assessment of dietary intake (instead, the main objectives relate to economic indices), so their suitability for this application is uncertain 2,6,7 .
In this paper, we compare results from the most recent HCES in Cameroon, the Third Cameroon Household Survey (Enquête Camerounaise Auprès des Ménages, ECAM3) conducted in 2007 8 , with the results of a national dietary survey conducted in 2009, which included both a food frequency questionnaire (FFQ) and a 24HR 9,10 . The objectives of this analysis were to compare the consumption of selected potentially fortifiable foods (refined vegetable oil, wheat flour, sugar, and bouillon cubes) among women of reproductive age (15–49 years) and children 12 to 59 months, as measured by three methods: ECAM3, FFQ, and 24HR. These four foods were identified by the National Fortification Steering Committee in Cameroon as potential candidates for fortification, based on expected coverage, technical feasibility, and likely cost. Specifically, we calculated the coverage (the percentage of households or individuals that reported consuming the selected foods), the frequency of consumption (among consumers), and the amount consumed (among consumers) within a specific time period. We compared these outcomes at the national level and also examined patterns of consumption according to potential risk factors for micronutrient deficiency, such as geographic region, urban or rural location, and socioeconomic status. In addition, we examined several methodological issues that may affect the comparability of the results of the two surveys, including food list categories, application of the Adult Male Equivalent (AME) method, and measurement of foods prepared away from home (FPAH). Finally, we considered the respective policy implications of the two sets of results for selection of food vehicles for fortification and calculation of fortification levels (with the latter assuming that only data on consumption of fortifiable foods, but not total nutrient intakes, were available).
Methods
Both surveys were conducted in the same season (September to December) and used the same census base for sampling (Cameroon Central Office of Census and Population Studies, 2005; the most recent available census at the time of each survey). However, as summarized in Table 1, there are a number of important methodological differences among the three data sources.
Characteristics of Three Data Collection Methods: Cameroon 2007 HCES/ECAM3, Food Frequency Questionnaire (FFQ), and 24-hour Recall (24HR).
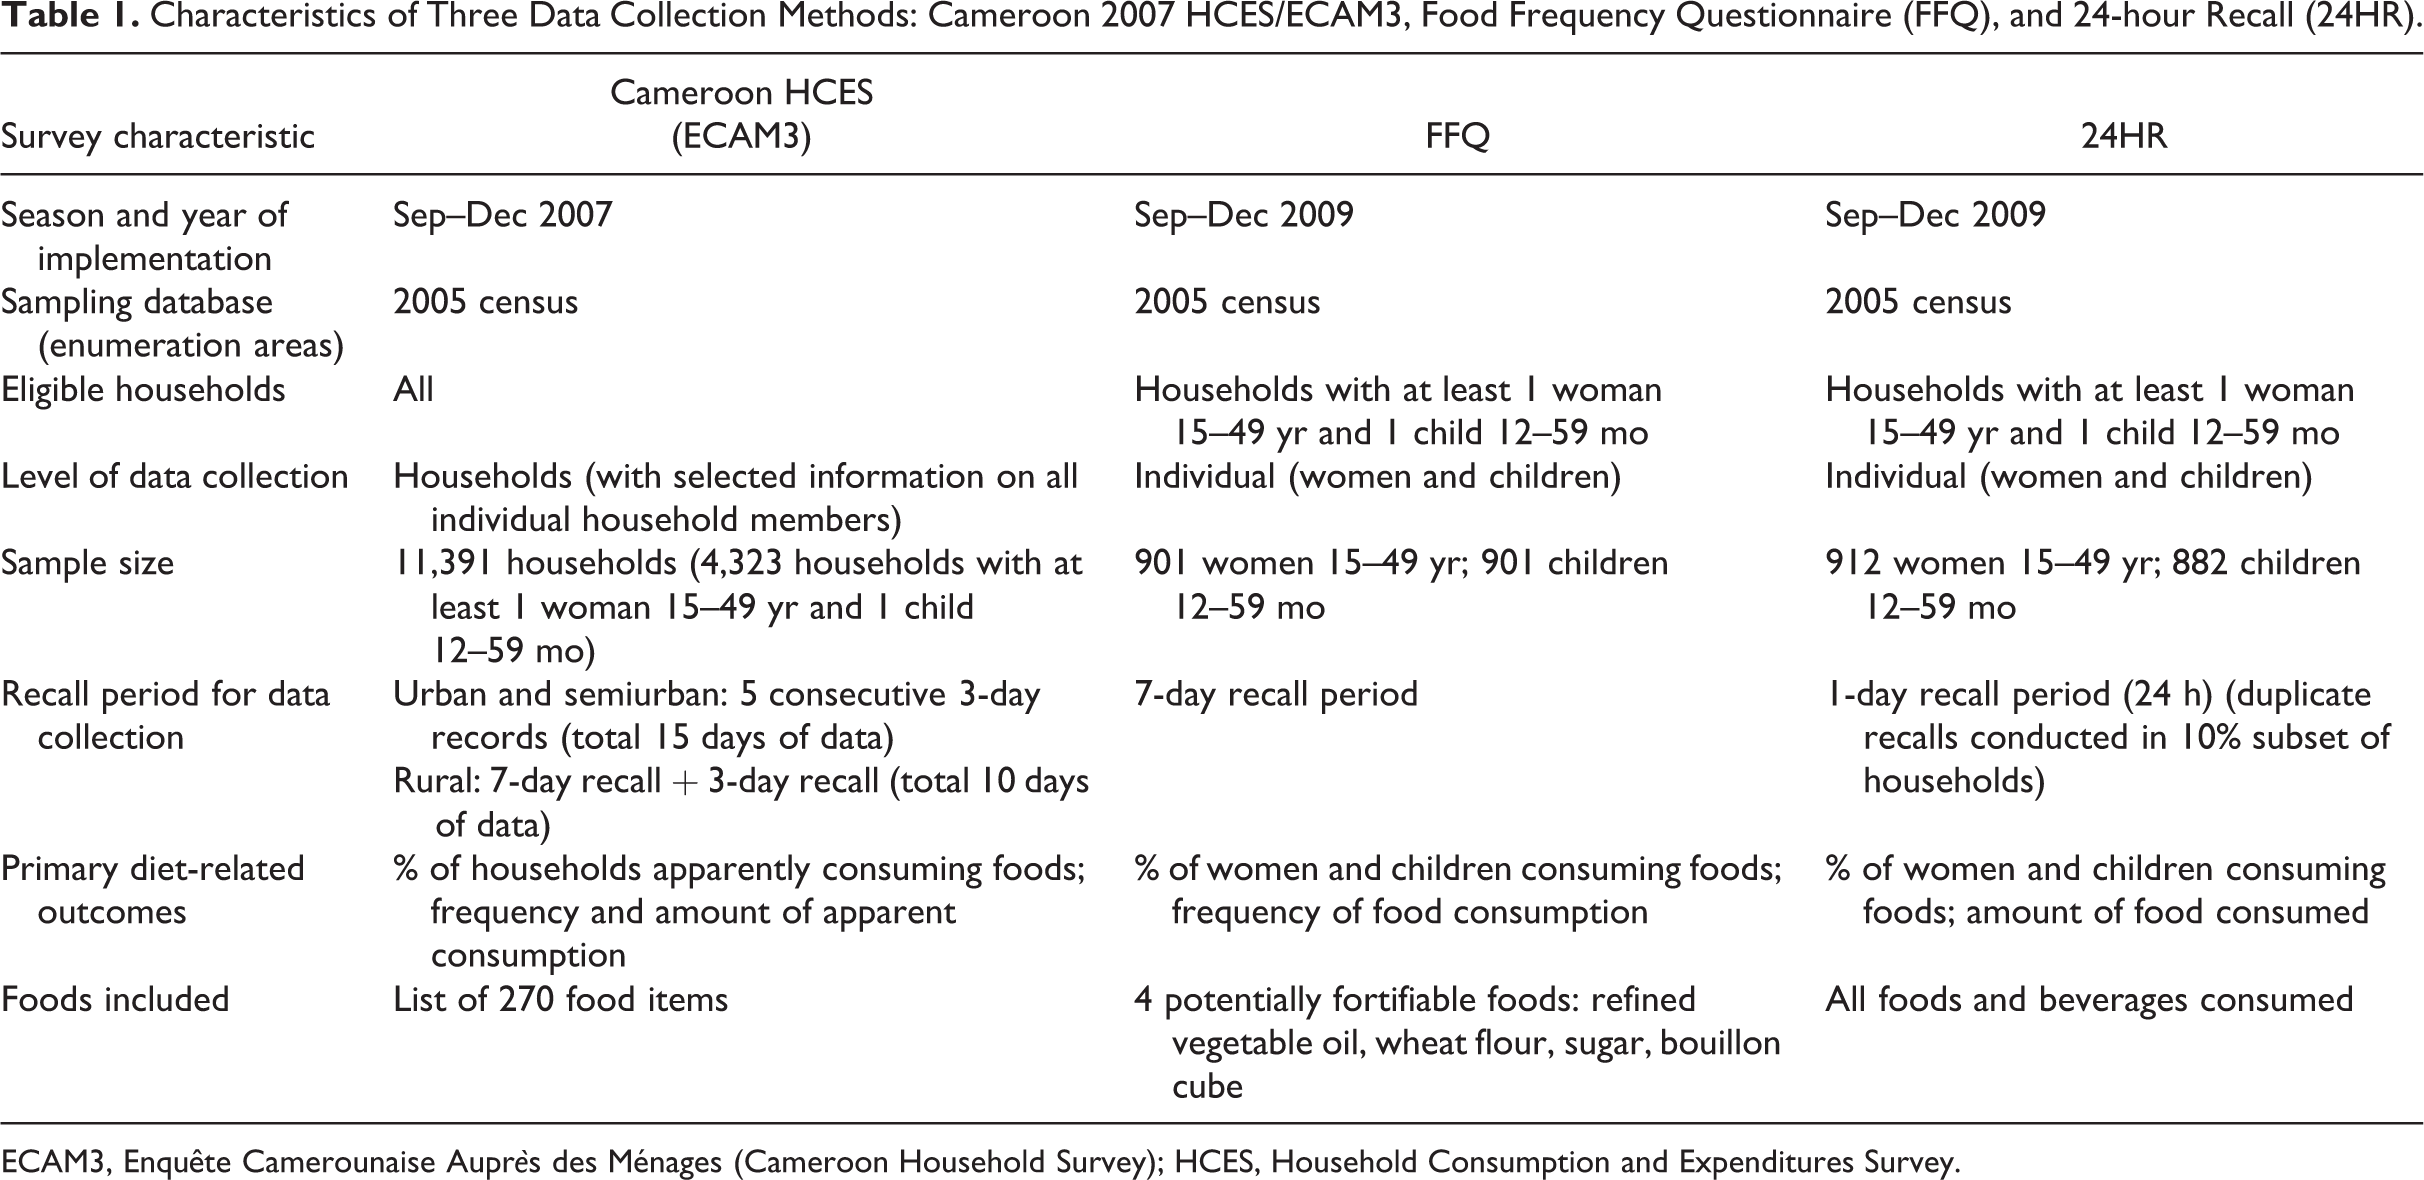
ECAM3, Enquête Camerounaise Auprès des Ménages (Cameroon Household Survey); HCES, Household Consumption and Expenditures Survey.
ECAM3
The ECAM3 is a household survey that was conducted to assess the current levels and determinants of poverty, as well as trends over time nationally and at the regional level in Cameroon. 8 This was a nationally representative, multistage cluster survey, which included all households (n = 11,391), regardless of whether a woman of reproductive age or a child aged 12 to 59 months was present. The country was divided into 32 geographic strata; each of the 10 provinces was divided into urban, semiurban, and rural strata (for a total of 30 strata); finally, the two major urban areas, Yaoundé and Douala, were each considered a separate stratum. 11
A variable number of clusters was selected per stratum (based on expected variability in the main survey outcomes), using the proportional-to-population-size method (range, 35 to 1,621 clusters per stratum). Within each cluster, 18 households were randomly selected following enumeration of households in the cluster, except in Yaoundé and Douala, where 12 households per cluster were selected. In addition, a larger number of households per cluster was selected in a specific subset of clusters that had previously taken part in a pilot survey, for the purpose of evaluating changes within clusters over time. Households were classified as poor or nonpoor according to the poverty level established by the National Institute of Statistics of Cameroon.
The survey module used for this analysis (section 15) consists of a recall or diary (see below) of all household expenditures and acquisitions (food and nonfood items) within a specific time period, including purchases, gifts, production by the household, and consumption of household stocks. Due to logistical and practical considerations (e.g., road conditions, literacy rates, etc.), data collection methods were different for urban, semiurban, and rural strata.
In the rural areas, households were visited twice over a period of 4 days. On the first visit, a 7-day recall of household expenditures and acquisitions was conducted. On the second visit (3 days later), a 3-day recall of expenditures and acquisitions was conducted. Daily data were disaggregated for the second recall period (i.e., separate results for days 1, 2, and 3 of the period), but not for the first recall period.
In the urban and semiurban areas, households were visited six times over a period of 18 days (approximately every 3 days). At the first visit, the household was given a notebook (expense diary) to record the purchases by every member of the household, as well as gifts and items consumed from stocks or acquired by other means. This notebook was collected and replaced with a new notebook at each of the following four visits, and the final notebook was collected at the sixth visit. These records are disaggregated into 15 separate days of data.
In both urban and rural areas, all household acquisitions (food or nonfood) in the specified time period were recorded. Foods were coded as one of 270 different food items (including categories for “other”). The food categories represented primarily “as purchased” foods, such as flour, oil, and raw meat or vegetables, but selected composite food items in forms that could be directly consumed were also recorded (e.g., bread, biscuits, and beverages). The quantities of each food item were recorded in household units (cups, bowls, etc. each qualified as small, medium, or large, if applicable) and in the monetary value of the amount of food acquired (e.g., the quantity of beans purchased for 200 CFA francs).
It is important to note that the ECAM3 survey collected household-level data on food acquisition from various sources but did not assess actual intake of foods by individuals or the collective members of the household. To reflect the difference of the HCES from the FFQ and 24HR methods, we refer to “apparent consumption,” rather than consumption, to report estimated dietary intake data from the ECAM3 survey.
Dietary Survey
The methods of the dietary survey have been described in detail elsewhere 9,10 . Briefly, this was a nationally representative, multistage, cluster survey of households in which there was at least one child aged 12 to 59 months and one woman of reproductive age (15–49 years)(n = 1,002 households total). The country was divided into three geographic strata: the North region, consisting of the three northernmost provinces (North, Extreme North, and Adamaoua); the South region, which consisted of the seven remaining provinces, with the exception of the two largest urban areas; and Yaoundé and Douala, which were combined to form the third stratum. Within each stratum, 30 clusters were selected according to the proportionate-to-population-size method, and approximately 10 households per cluster were selected using a random start point and systematic selection of adjacent households. Information on household demographic and socioeconomic characteristics was collected, as well as anthropometric measures and selected biomarkers of nutritional status for individual women and children; these results have been reported separately 9,10 . Variables related to socioeconomic status (housing materials and possessions, education and occupation of the index woman and the head of the household, and sources of water, lighting, cooking fuel, and waste disposal) were combined into a single score using factor analysis. This score was dichotomized at the median to identify poor and nonpoor households, consistent with the two-group classification used by the ECAM3.
Each household was visited twice. On the first day, informed consent was obtained from the index woman, and a 24HR was conducted in a randomly selected subgroup of approximately 10% of households on the first visit. 9 During the second visit (2 days later), the 24HR was conducted in all households, including a duplicate 24HR (for a different day) in the 10% subset that had already been studied. Details of the dietary data collection by 24HR have been reported previously. 12
The FFQ was also completed on the second data collection day (n = 901 households). The FFQ was a modified version of the Fortification Rapid Assessment Tool (FRAT) 13 and included questions regarding each food item in separate preparations (e.g., sugar in tea or coffee, sugar in biscuits, etc.). The respondents were asked how many days in the previous week they had consumed each of the foods, and how many times they had consumed each food on the last day on which the food was consumed. These values (days per week and times per day) were combined to calculate the number of times per week that the foods were consumed.
Ethical Approval
Data from the ECAM3 were provided for secondary analysis by the National Institute of Statistics of Cameroon. The dietary survey was approved by the National Ethics Committee of Cameroon and the Human Subjects Committee of the Institutional Review Board of the University of California, Davis. Oral informed consent was obtained from each index woman for herself and her child to participate, with permission from the head of the household.
Data Analysis
Data were analyzed with SAS, versions 9.3 and 9.4. For both datasets, the SAS survey analysis procedures (e.g., PROC SURVEYMEANS, PROC SURVEYFREQ, etc.) and appropriate weighting factors were used to account for the sampling designs.
As mentioned above, the dietary survey was conducted only in households in which there was a woman aged 15 to 49 years and a child aged 12 to 59 months, whereas the ECAM3 was conducted in all households, regardless of demographic composition. In the ECAM3 dataset, we found that households with at least one woman of reproductive age and one child aged 12 to 59 months were more likely than other households to be poor (40% vs. 21%), to live in a rural area (65% vs. 61%), and to have a male head of the household (81% vs. 69%) (p < .01 for all comparisons). In addition, coverage and frequency of consumption of the target foods were generally greater for households with a woman of reproductive age and a child aged 12 to 59 months. Because of these differences, we restricted the comparison of the ECAM3 with the dietary survey to households in the ECAM3 survey with at least one woman aged 15 to 49 years and one child aged 12 to 59 months (n = 4,363 with previous-week acquisition data, and n = 4,288 with previous-day acquisition data; almost all households had both previous-week and previous-day data).
Because of the nature of the dietary data collected, we analyzed data for two separate time periods. We defined a 7-day period for comparison of FFQ and ECAM3 data and a 1-day period for comparison of 24HR and ECAM3 data. Because the ECAM3 survey had more available days of data than the dietary survey, we attempted to match the data collection periods as closely as possible. For the 7-day comparison period, the ECAM3 data used were from the first 7-day recall period for rural areas (identical to the 7-day recall period used by the FFQ) and the first 7 days of household acquisition records from the urban and semiurban areas. For comparison of the ECAM3 with the 24HR data, we chose the day of data collection representing the day prior to the second visit to the household (i.e., the third day of the 3-day recall for rural areas and the third day of the first 3-day record in urban areas). This choice is consistent with the 24HR data collection method, which included an initial recruitment and preparation visit followed by a second visit for data collection. Thus, for all data sources, the question asked by the interviewer was “What did you consume or acquire yesterday?”
As much as possible, the foods included and excluded from fortifiable food calculations were consistent between surveys. Only industrially processed oils were considered in the calculations of fortifiable refined vegetable oil; groundnut oil and red palm oil (which are mainly processed at the local level and were not candidates for fortification) were excluded. Pasta and semolina products were excluded from wheat flour calculations, and imported biscuits or cookies were excluded from both flour and sugar calculations because these products were not included in the proposed fortification plan. Bread, biscuits, and other baked items that are produced domestically were included. Finally, sugar in industrially produced drinks (e.g., sodas and juices) was excluded, but sugar in locally made or artisanal drinks was included.
For both surveys, the recorded amounts of each food item were converted to grams using conversion factors collected in the field during the dietary survey and, in some cases, from food composition tables. 14 The amount of fortifiable food equivalents in mixed dishes (e.g., the average number of grams of sugar per 100 g of biscuit) was then calculated using recipe data collected in the field, data from manufacturers, and food composition tables. 14
To obtain estimates of individual apparent consumption from ECAM3 household-level data, we applied the Adult Male Equivalent (AME) method, which assumes that the distribution of foods in the household is proportional to the individual’s share of total household energy requirements (based on age and sex and assuming moderate physical activity) 15,16 . Energy requirements for each age- and sex-specific group were expressed as a proportion of the requirement for a male ≥ 18 years of age. The AMEs for the target groups in this study (women aged 15–49 years and children aged 12–59 months) were as follows. For females: 12 to 23 months, 0.28; 24 to 35 months, 0.34; 36 to 47 months, 0.38; 48 to 59 months, 0.41; 15 to 17 years, 0.82; 18 to 30 years, 0.79; and 31 to 49 years, 0.77. For males: 12 to 23 months, 0.31; 24 to 35 months, 0.37; 36 to 47 months, 0.41; and 48 to 59 months, 0.44. The amount of each fortifiable food apparently consumed by women and children was estimated by multiplying the total household apparent food consumption by the ratio of the age- and sex-specific AME to the total number of household AMEs. For example, if the household consisted of one male and one female, each 25 years of age, and one female child 40 months of age, the total number of AMEs would be 1.0 + 0.79 + 0.38 = 2.17. If the household total apparent consumption of oil was 15 g, the woman’s estimated consumption would be 15 g * (0.79/2.17) = 5.5 g.
To estimate the amount of foods apparently consumed, we excluded seven households with acquisition of refined oil greater than 10 kg, one household with acquisition of wheat flour greater than 10 kg, four households with acquisition of sugar greater than 5 kg, and four households with acquisition of bouillon cubes greater than 5 kg, based on examination of histograms. Because some high values would be expected resulting from periodic acquisition of large amounts of staple foods, we applied this conservative approach, rather than the rule of thumb of Q3 + (3*IQR) of individual apparent consumption 17 , which would exclude 97, 50, 117, and 415 households for acquisition of oil, flour, sugar, and bouillon cubes, respectively. No households were excluded from the 24HR and FFQ results.
Coverage of a target food was defined as the proportion of individuals (FFQ and 24HR) or households (ECAM3) that reported consuming a food in a specific time period (previous 1 or 7 days). Coverage measured as individual consumption (24HR) or household apparent consumption was defined as > 1 g of oil, wheat flour, or sugar and any nonzero amount of bouillon cubes (in the ECAM3, defining coverage by applying these cutoffs to the woman or child’s AME, rather than at the household level, did not change the results; data not shown).
Frequency of consumption and apparent consumption (measured in times per week) were calculated only among individuals or households that reported consuming or acquiring the food in the specified time period. Likewise, the amounts of foods consumed (24HR) or apparently consumed (ECAM3) were also calculated only among consumers.
Coverage of fortifiable foods among risk groups (within each survey) was compared by logistic regression (PROC SURVEYLOGISTIC). Frequency of apparent consumption among risk groups within the ECAM3 was compared by the Kruskall-Wallis test (PROC NPAR1WAY). Frequency of consumption as measured by the FFQ and the amount of foods consumed or apparently consumed were compared among risk groups by linear regression analysis (PROC SURVEYREG), following transformation to achieve a normal distribution. Results for subpopulations were estimated by domain analysis.
Because differential reporting of consumption of foods outside the home represents a possible source of discrepancies between household survey data and individual intake data, we reanalyzed the 24HR data to examine the contribution of FPAH to fortifiable food intake. During the 24HR, respondents were asked whether each food item was prepared at home or away from home (the location of consumption of the food was not specified). We calculated the proportion of women and children who consumed fortifiable FPAH in the previous day, and, among respondents who consumed FPAH, we calculated the amount of food and the proportion of total fortifiable food equivalents contributed by FPAH.
Results
Coverage in Previous Week
For refined vegetable oil, sugar, and bouillon cubes, national coverage estimates for the previous week as measured by the ECAM3 and the FFQ were generally within approximately 10% (Table 2). However, the estimated coverage of wheat flour was more than 30 percentage points greater according to the FFQ than that according to the ECAM3 (92%–94% vs. 60%).
Percent of Households (ECAM3) or Individuals (FFQ) Who Apparently Consumed or Consumed Fortifiable Foods in the Previous Week, Nationally and by Subgroup.
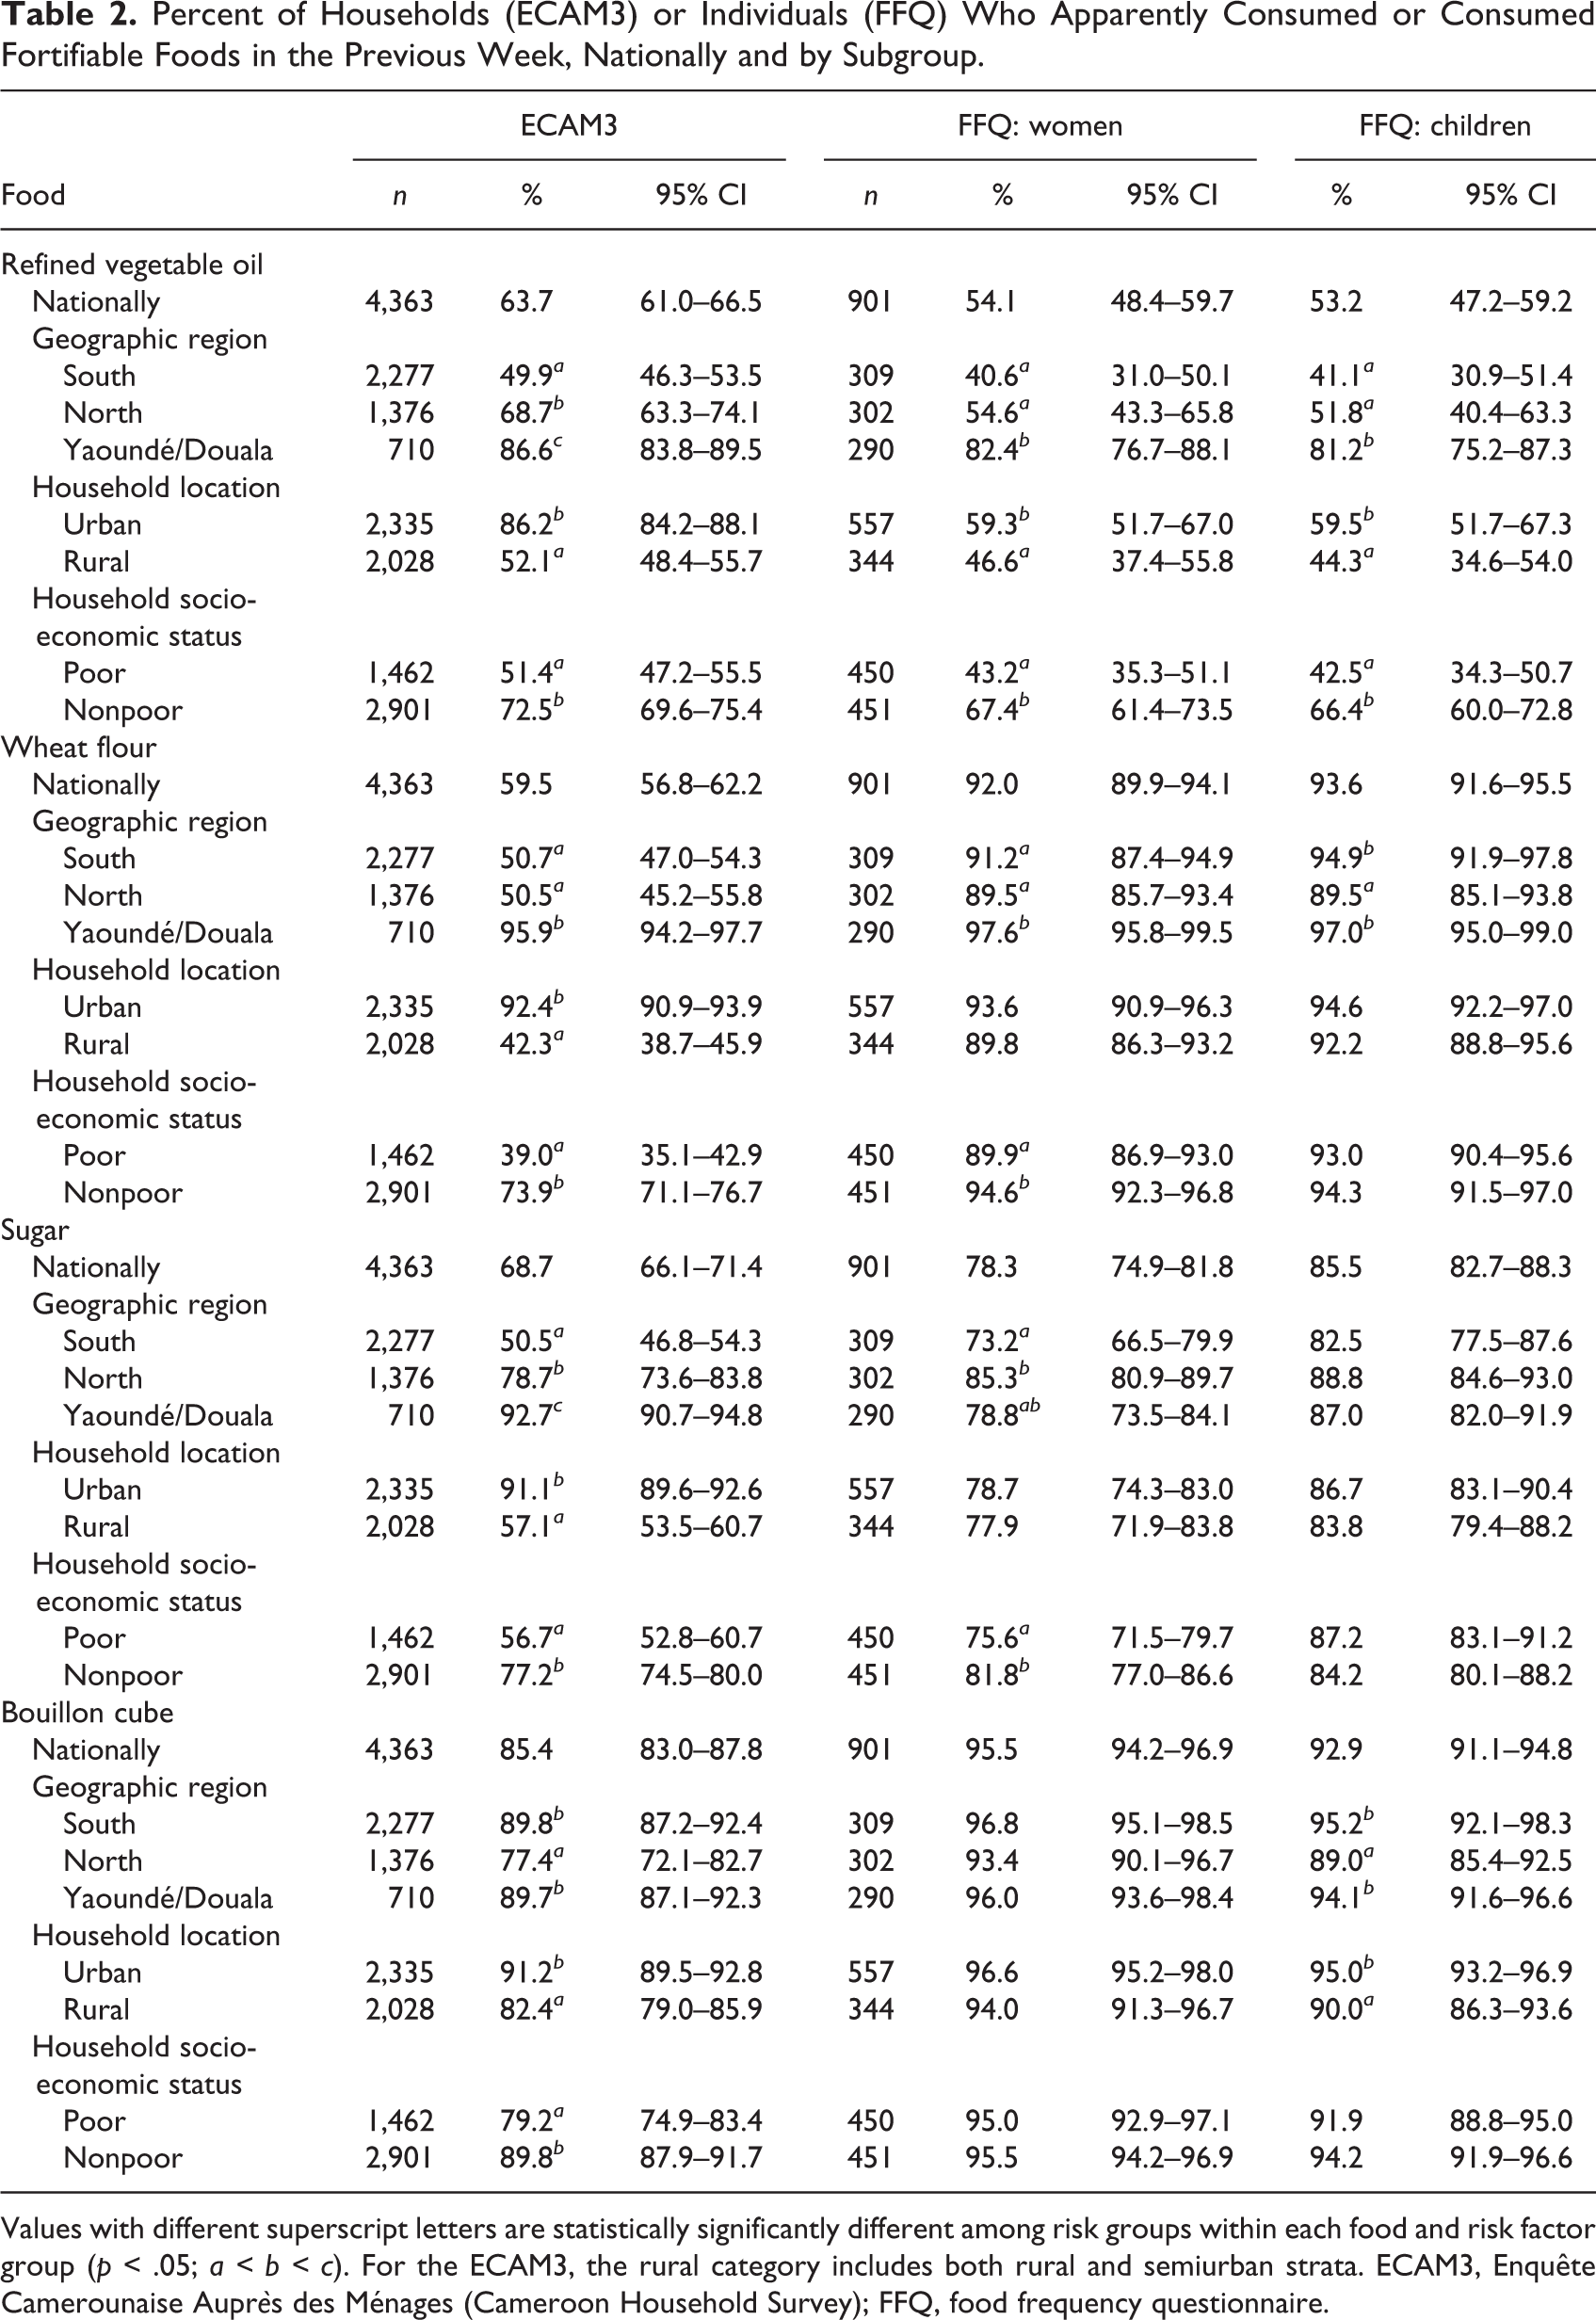
Values with different superscript letters are statistically significantly different among risk groups within each food and risk factor group (p < .05; a < b < c). For the ECAM3, the rural category includes both rural and semiurban strata. ECAM3, Enquête Camerounaise Auprès des Ménages (Cameroon Household Survey); FFQ, food frequency questionnaire.
The patterns of coverage by stratum (defined as the regional stratum from the dietary study: North, South, and Yaoundé/Douala), urban or rural location, and socioeconomic status were consistent between the ECAM3 and FFQ for refined vegetable oil: both surveys identified participants who were nonpoor and who were living in Yaoundé/Douala and in urban areas in general as being more likely to consume refined vegetable oil. Coverage of wheat flour in Yaoundé/Douala was very similar between surveys; however, flour coverage in the South and North, in rural areas, and among poor households was 40 to 50 percentage points greater according to the FFQ, possibly due to underreporting of flour-containing FPAH by women and children, as discussed below. In addition, the ECAM3 suggested greater differences in coverage of sugar and bouillon cubes by region, urban or rural location, and socioeconomic status than were observed with the use of the FFQ.
Frequency of Consumption in Previous Week
The frequency of apparent consumption of all four fortifiable foods in the previous week (among consumers), as measured by the ECAM3, was consistently lower than the frequency of consumption measured by the FFQ, for both women and children (Table 3). The difference was largest for bouillon cubes; on average, the frequency of consumption of bouillon cubes in the previous week was approximately four or five times greater as measured by the FFQ than as measured by the ECAM3.
Weekly Frequency of Apparent Consumption or Consumption of Fortifiable Foods Among Households or Individuals, According to the ECAM3 and FFQ.
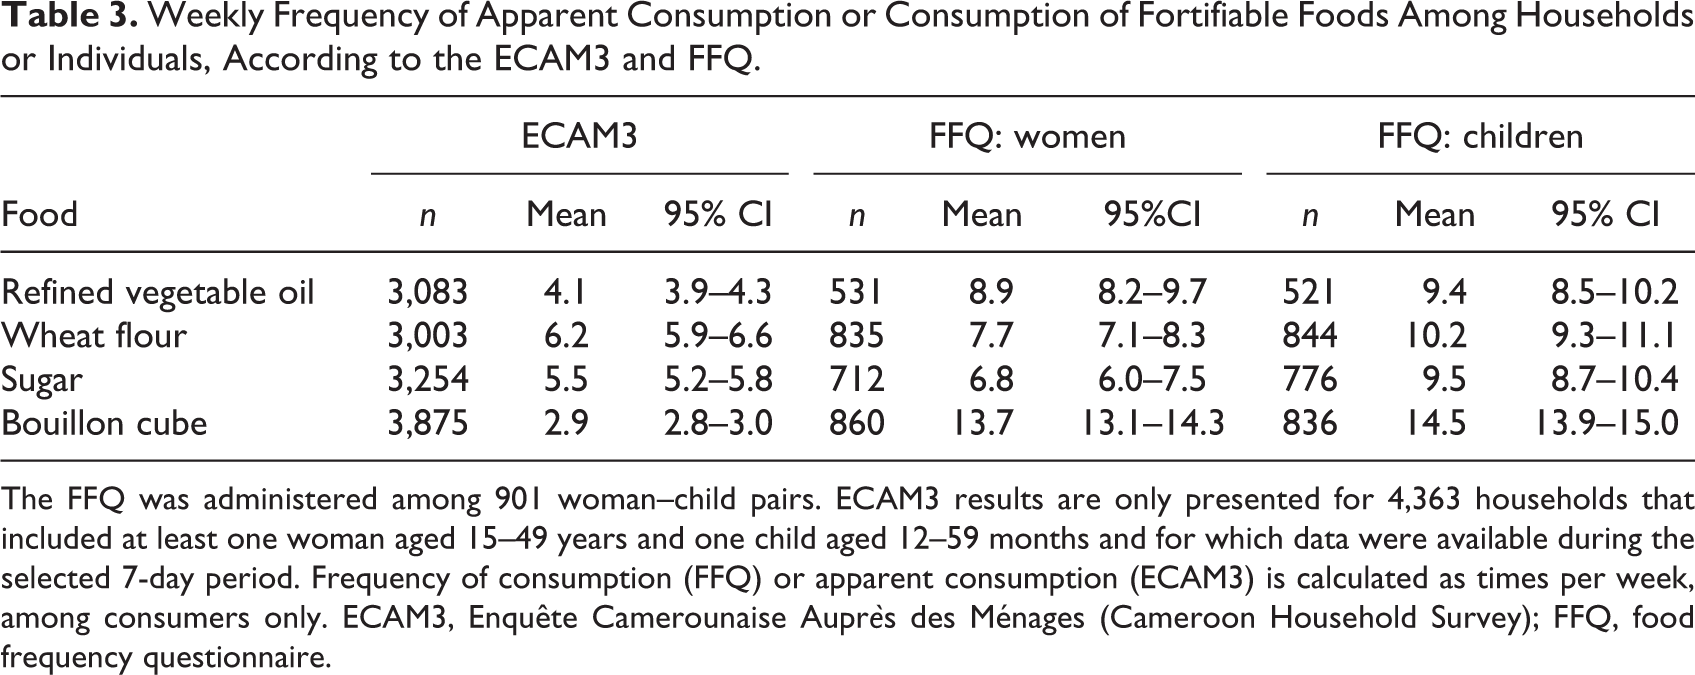
The FFQ was administered among 901 woman–child pairs. ECAM3 results are only presented for 4,363 households that included at least one woman aged 15–49 years and one child aged 12–59 months and for which data were available during the selected 7-day period. Frequency of consumption (FFQ) or apparent consumption (ECAM3) is calculated as times per week, among consumers only. ECAM3, Enquête Camerounaise Auprès des Ménages (Cameroon Household Survey); FFQ, food frequency questionnaire.
Coverage on Previous Day
The proportion of households that consumed each food on the previous day was also lower according to the ECAM3 than according to the 24HR for all foods (Table 4). For refined vegetable oil, wheat flour, and sugar, coverage was 28% to 36% according to the ECAM3 and 48% to 62% according to the 24HR. For bouillon cubes, previous-day coverage ranged from 33% (households according to ECAM3) to 93% (women according to 24HR) and 88% (children according to 24HR).
Percentage (95% Confidence Interval) of Households or Individuals Who Apparently Consumed or Consumed Fortifiable Foods on the Previous Day, According to the ECAM3 or 24HR.
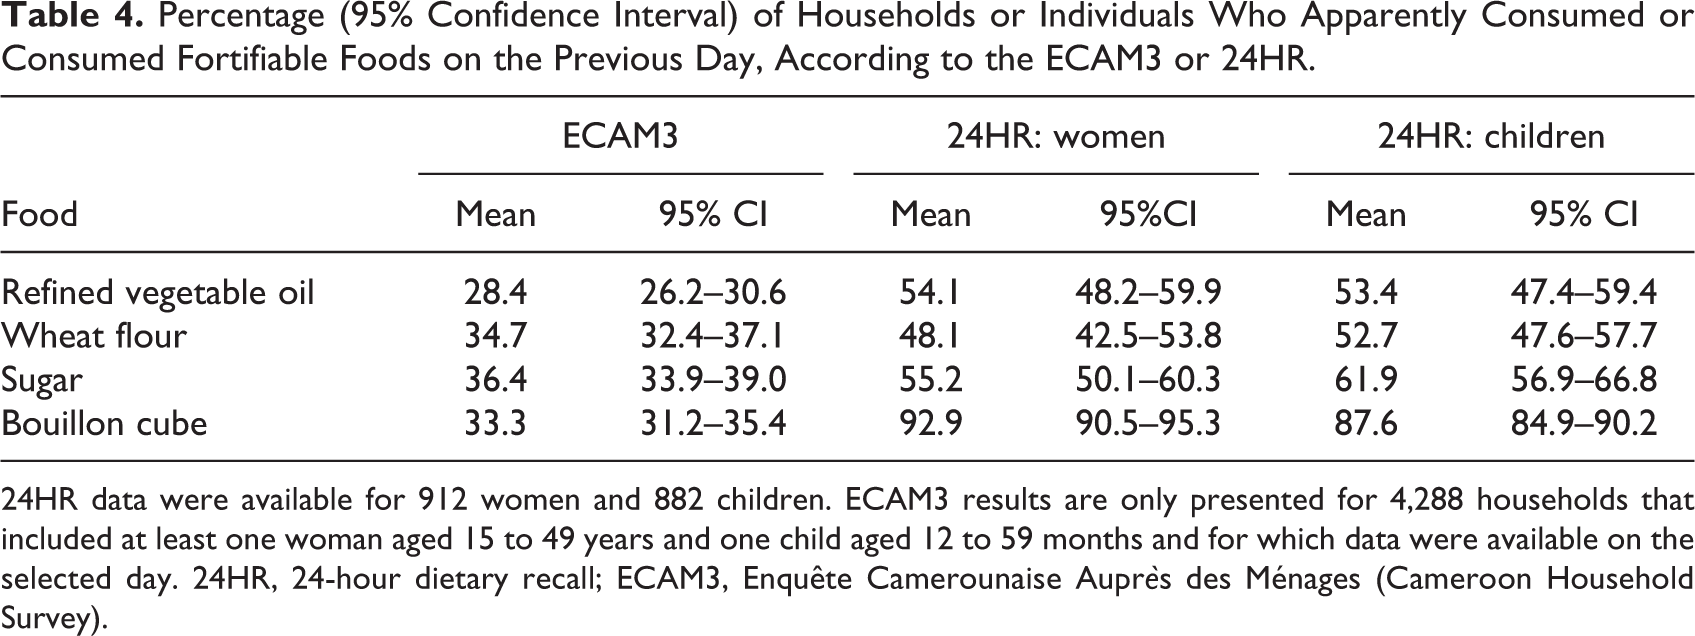
24HR data were available for 912 women and 882 children. ECAM3 results are only presented for 4,288 households that included at least one woman aged 15 to 49 years and one child aged 12 to 59 months and for which data were available on the selected day. 24HR, 24-hour dietary recall; ECAM3, Enquête Camerounaise Auprès des Ménages (Cameroon Household Survey).
Amount Consumed on Previous Day
The difference between the amount consumed on the previous day (among consumers) as estimated by the ECAM3 and the 24HR depended on the food and the target group examined (women or children) (Tables 5 and 6). The comparison also depended on whether the medians or the means were examined; in many cases, the median values for the ECAM3 and the 24HR were more similar, likely because of the larger variation in distribution of food intakes in the ECAM3 compared with the 24HR.
Amounts of Fortifiable Foods Apparently Consumed (ECAM3) or Consumed (24HR), Among Women Who Consumed the Selected Foods on the Previous Day, Nationally by Subgroup.
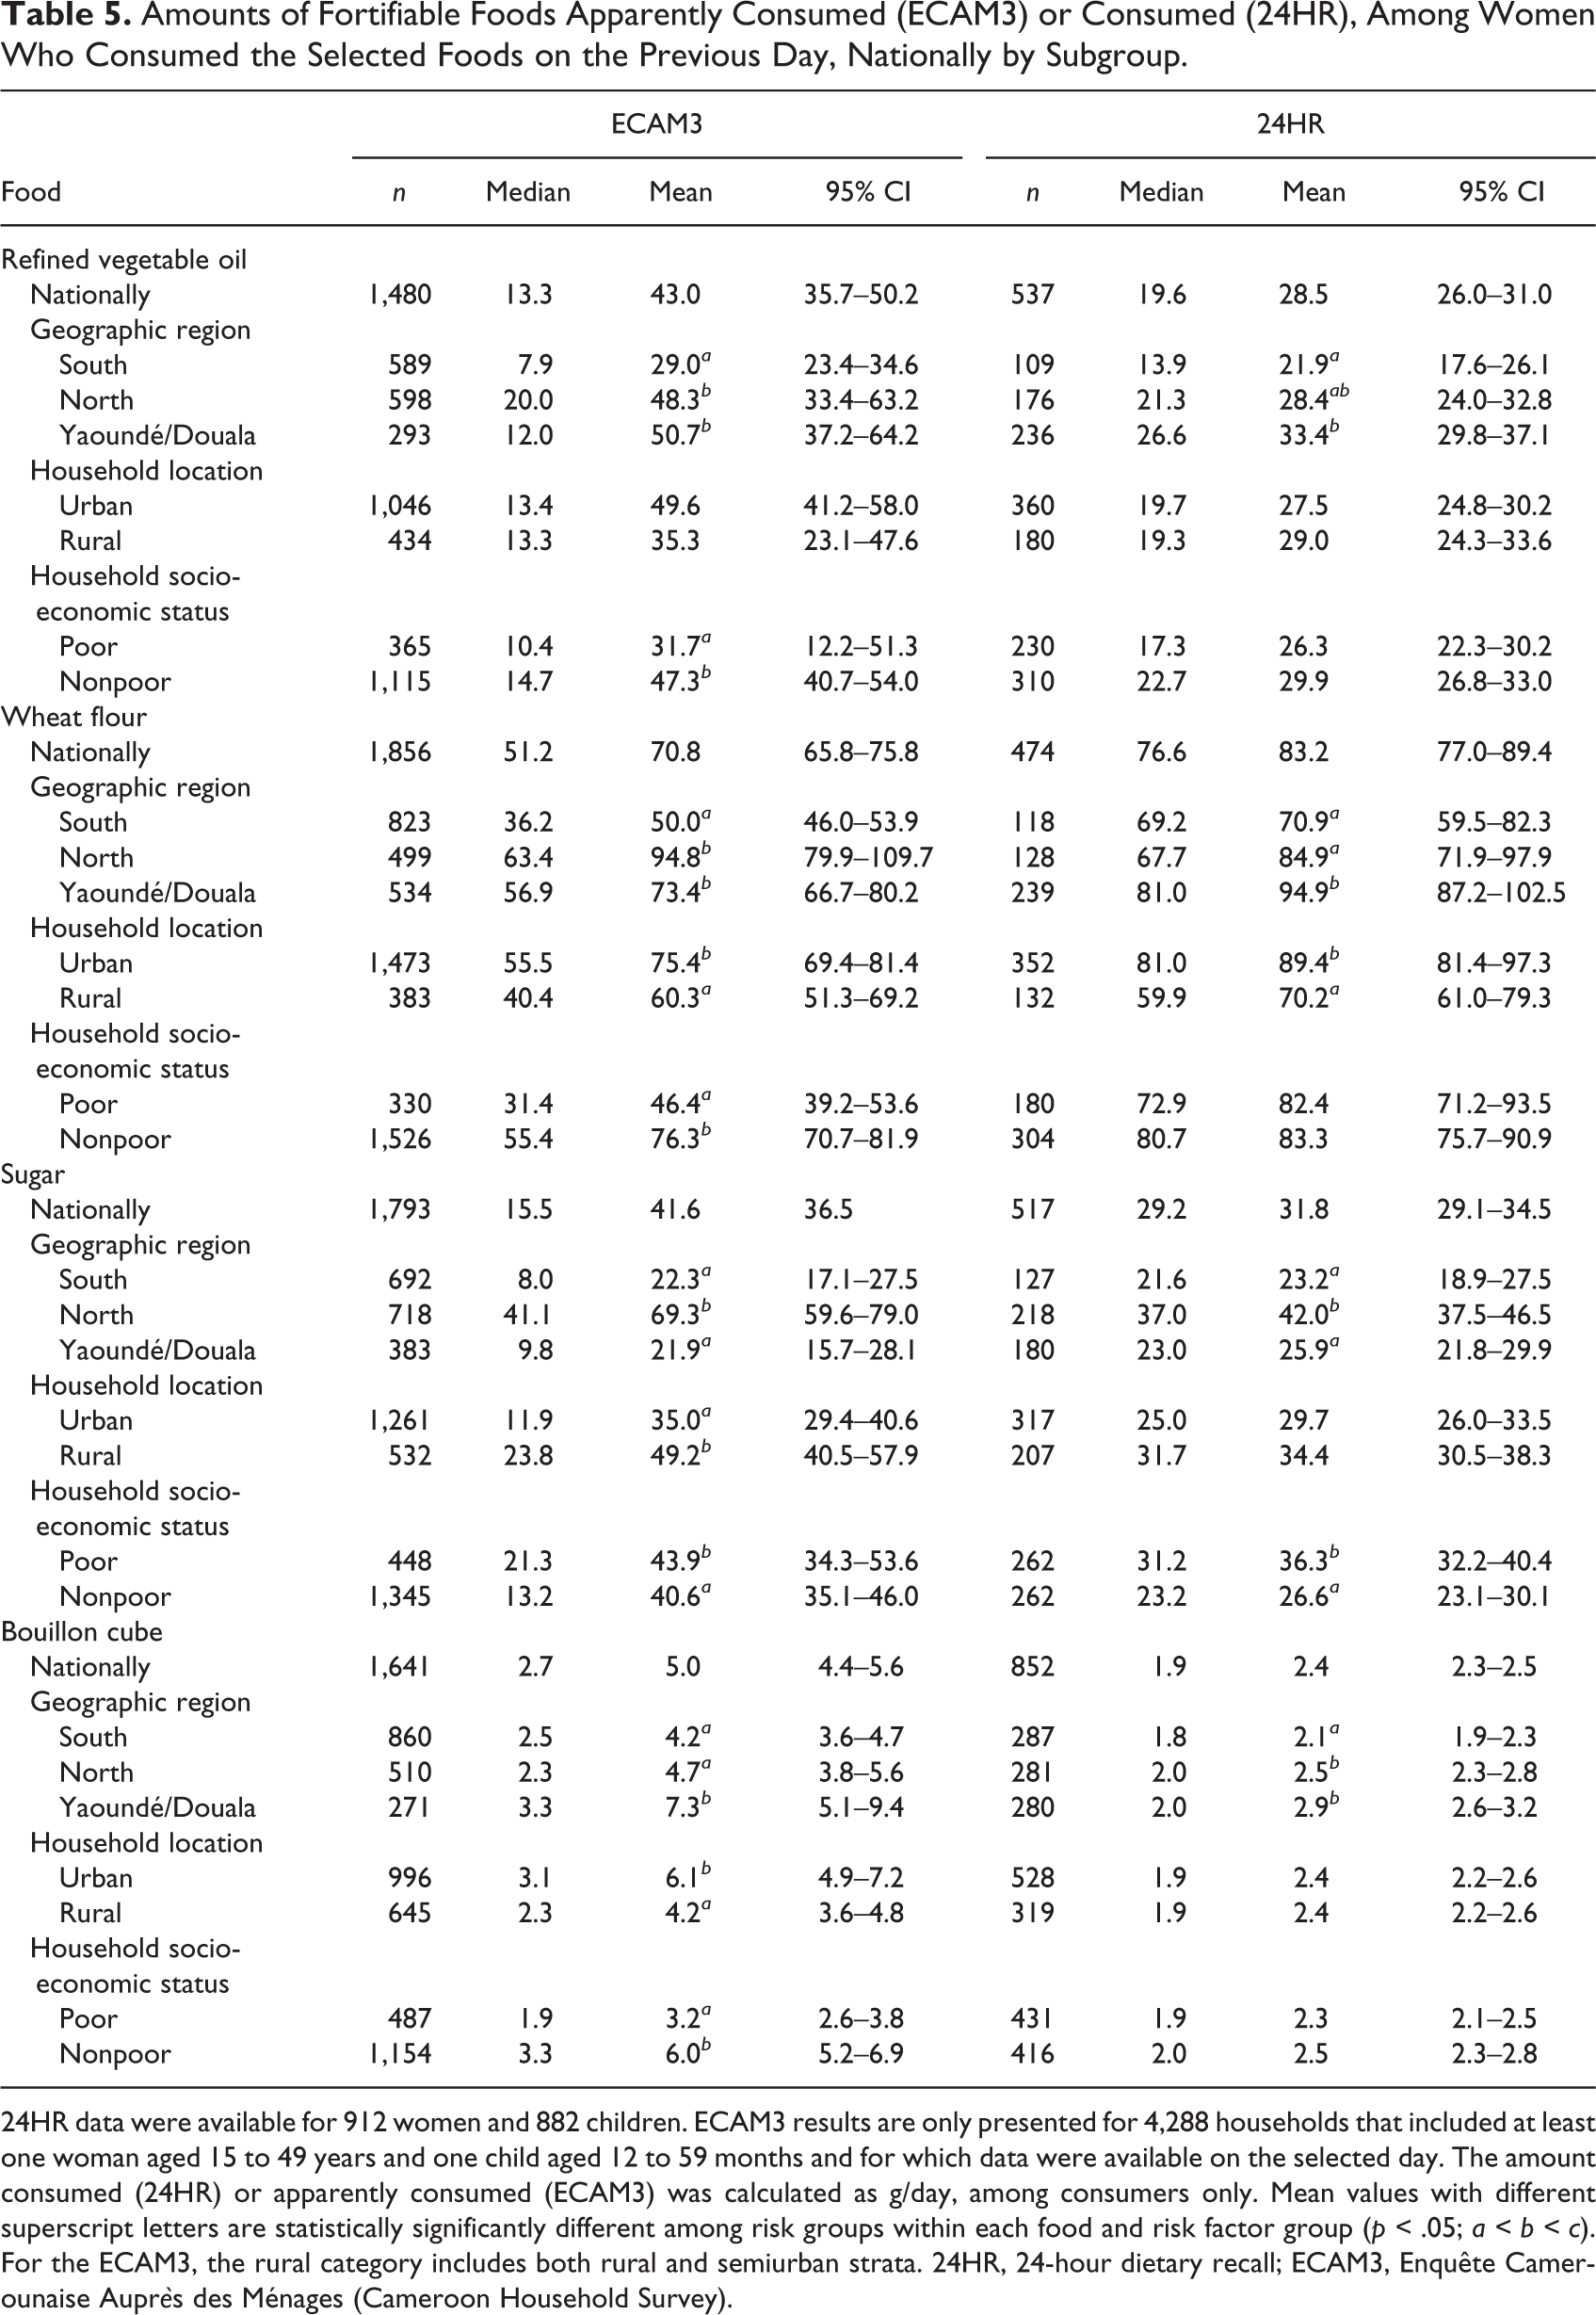
24HR data were available for 912 women and 882 children. ECAM3 results are only presented for 4,288 households that included at least one woman aged 15 to 49 years and one child aged 12 to 59 months and for which data were available on the selected day. The amount consumed (24HR) or apparently consumed (ECAM3) was calculated as g/day, among consumers only. Mean values with different superscript letters are statistically significantly different among risk groups within each food and risk factor group (p < .05; a < b < c). For the ECAM3, the rural category includes both rural and semiurban strata. 24HR, 24-hour dietary recall; ECAM3, Enquête Camerounaise Auprès des Ménages (Cameroon Household Survey).
Median and Mean (95% Confidence Interval) Amounts of Fortifiable Foods Apparently Consumed or Consumed by Children Who Consumed the Selected Foods on the Previous Day, According to the ECAM3 or 24 Hour Dietary Recall Methods.
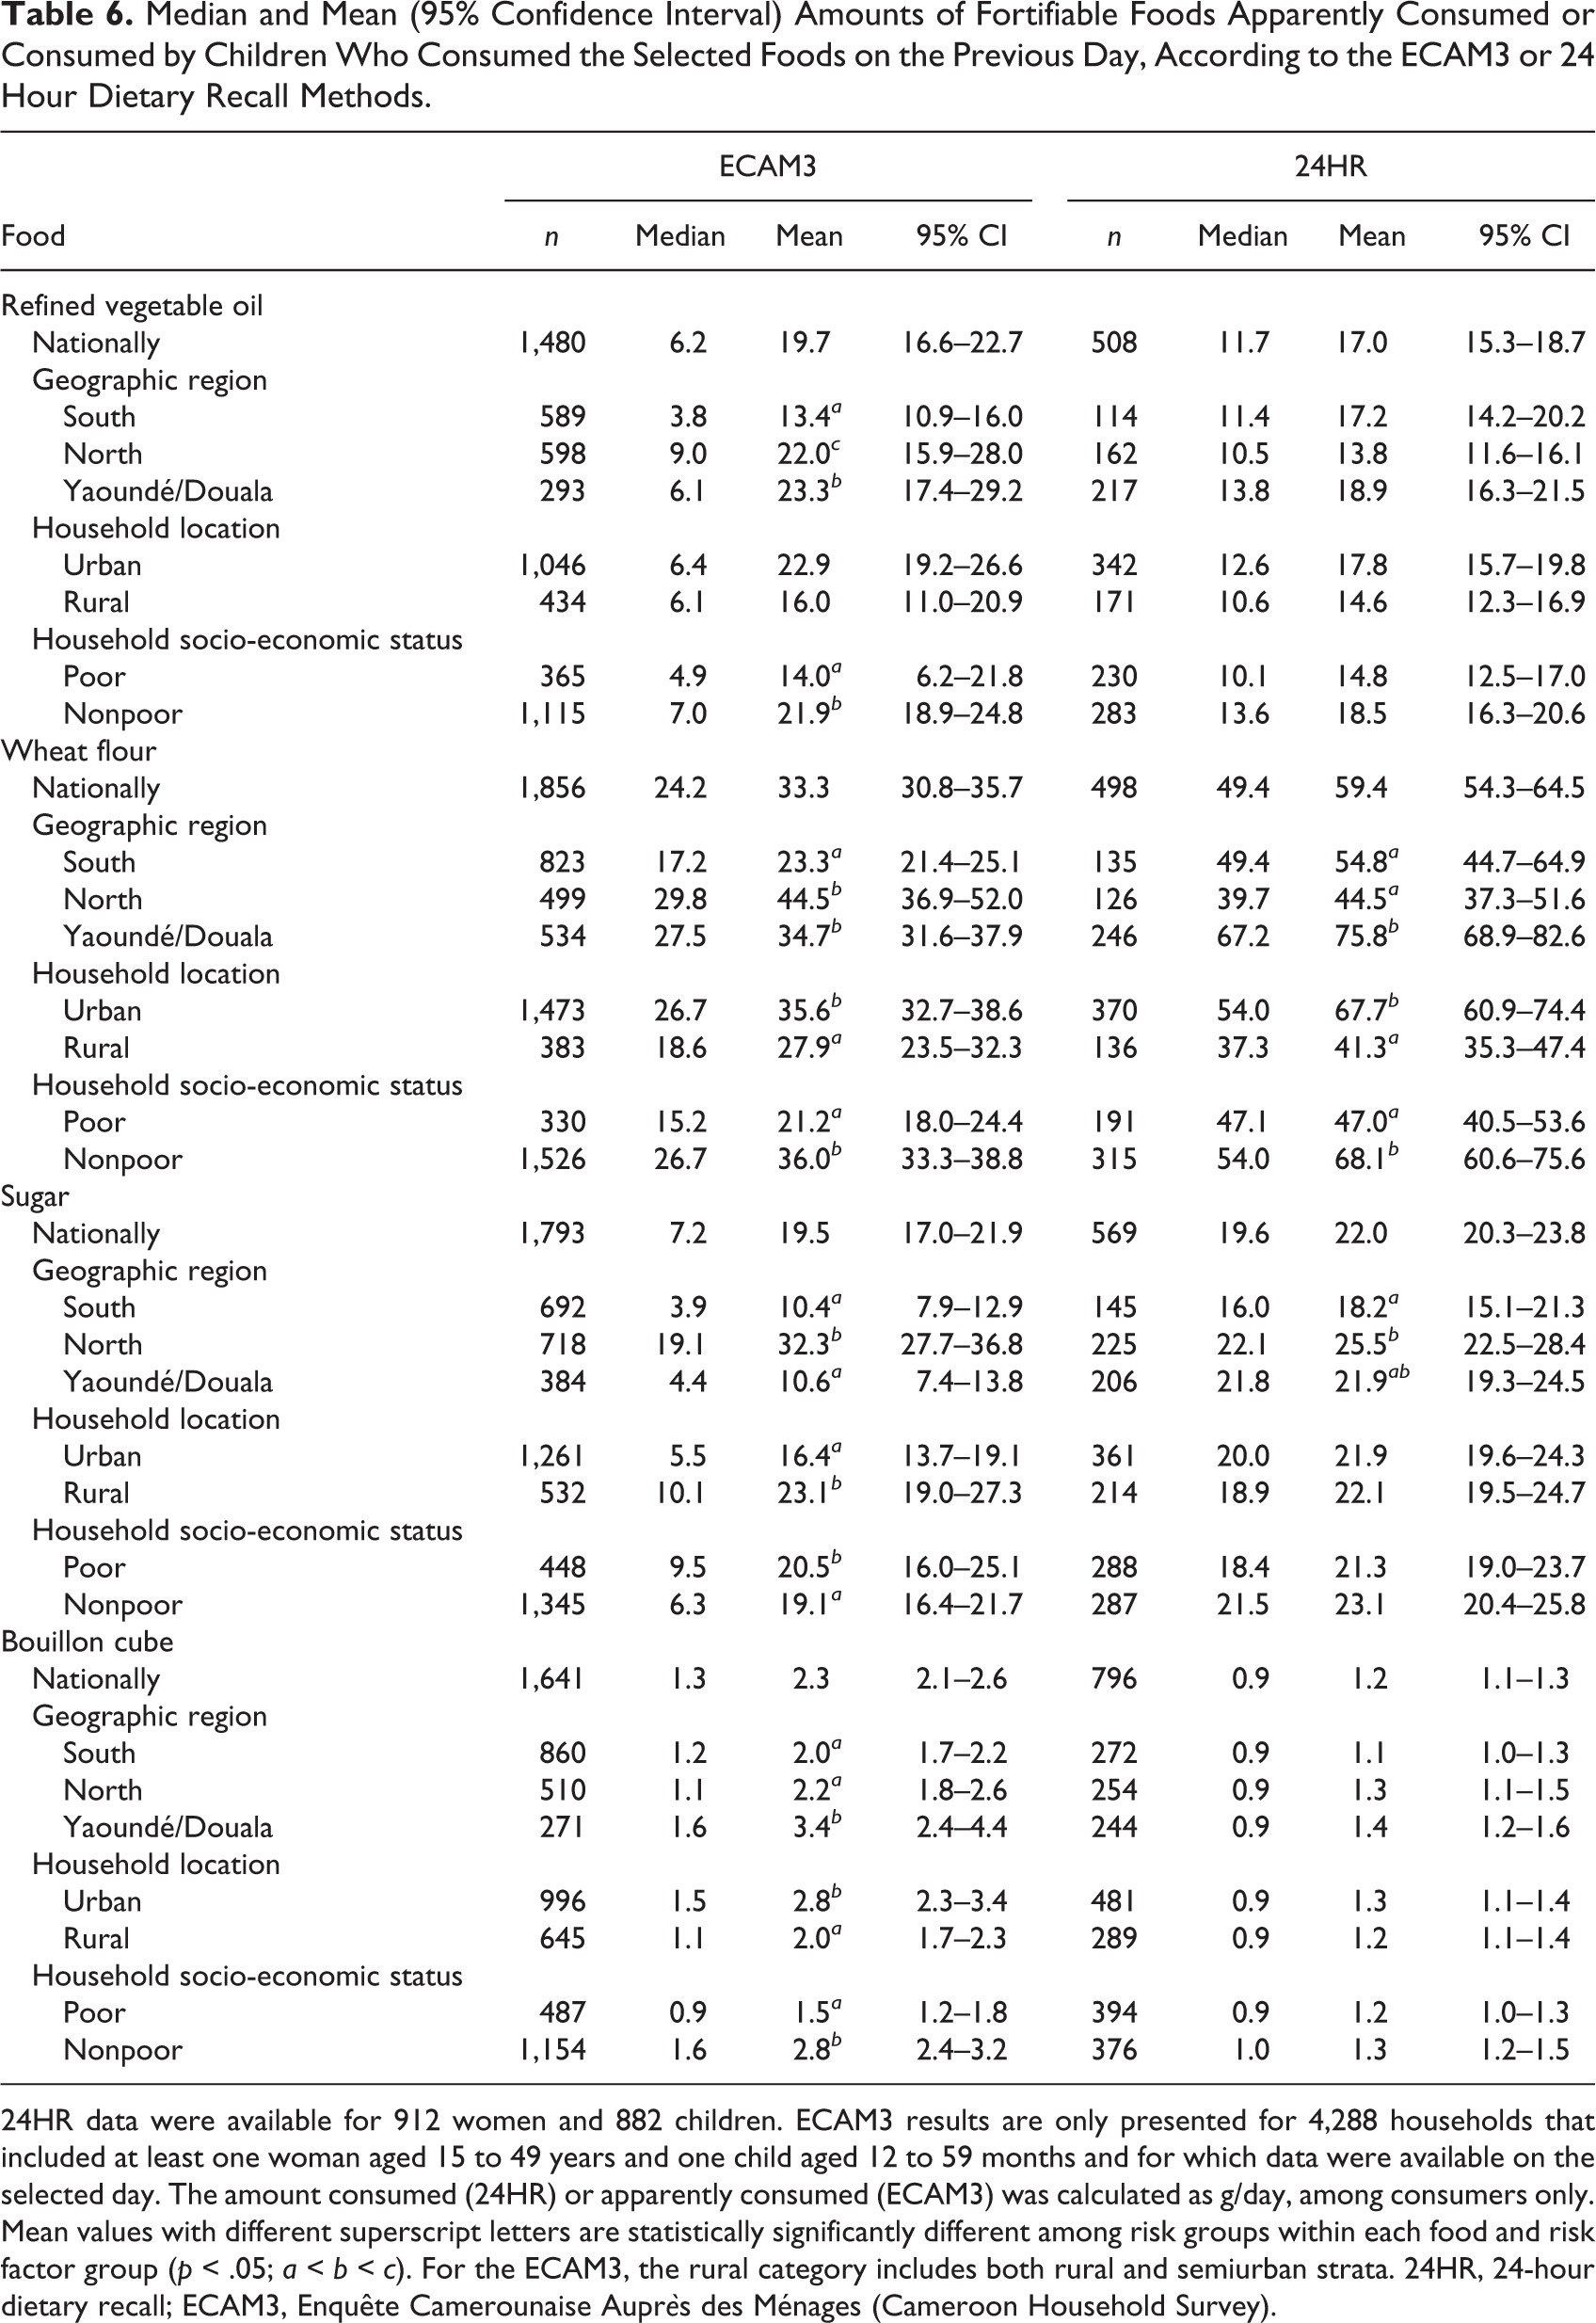
24HR data were available for 912 women and 882 children. ECAM3 results are only presented for 4,288 households that included at least one woman aged 15 to 49 years and one child aged 12 to 59 months and for which data were available on the selected day. The amount consumed (24HR) or apparently consumed (ECAM3) was calculated as g/day, among consumers only. Mean values with different superscript letters are statistically significantly different among risk groups within each food and risk factor group (p < .05; a < b < c). For the ECAM3, the rural category includes both rural and semiurban strata. 24HR, 24-hour dietary recall; ECAM3, Enquête Camerounaise Auprès des Ménages (Cameroon Household Survey).
For refined vegetable oil, the ECAM3 medians were generally lower than the 24HR values, but the means were higher. Estimates of wheat flour consumption according to the ECAM3 (median and mean) were lower than the 24HR values overall; however, the amount consumed in the North region was very similar between surveys. For sugar, national ECAM3 medians were lower and means were higher than 24HR values for women, but this differed by region, with much higher ECAM3 estimates in the North region. Among children, ECAM3 values were consistently lower, except in the North. In contrast, estimates of bouillon cube intake were consistently higher according to the ECAM3 than according to the 24HR.
Patterns of consumption of refined vegetable oil and wheat flour by urban vs. rural and poor vs. nonpoor households were similar between surveys, but regional patterns differed. Both surveys, however, indicated that sugar consumption was greatest in the North region and that bouillon cube consumption was greatest in Yaoundé/Douala.
Methodological Factors
The sources of fortifiable foods in each survey reflect the differing data collection methods for the ECAM3 (household-level food acquisition) and the 24HR and FFQ (individual-level intake). With the exception of wheat flour, the main items contributing to fortifiable food equivalents in the ECAM3 were commodity or raw food items as purchased by the household (pure cooking oil, sugar, or bouillon cubes). In contrast, for the dietary survey, the fortifiable foods were reportedly consumed mainly as components of mixed dishes. For wheat flour, the two main sources of wheat flour equivalents (bread and beignets) were the same among all data sources. In the FFQ, approximately 70% of women consumed beignets and approximately 62% consumed bread in the past week; in contrast, household acquisition of beignets and bread in the past week was 43% and 33% in the ECAM3, suggesting that the difference was due to differential reporting of consumption of these foods rather than the level of detail of the food list (i.e., the ability to record specific types of food items).
The ratio of children’s intake to women’s intake, calculated from the ECAM3 data using the AME method, was approximately 0.47 (Table 7). In the 24HR data, the ratio of mean consumption by children to mean consumption by women was similar for bouillon cubes (0.50), but not for oil (0.60), wheat flour (0.71), or sugar (0.69).
Amounts of Fortifiable Foods Apparently Consumed (ECAM3) or Consumed (24HR), Among Women Who Consumed the Selected Foods on the Previous Day, Nationally and by Subgroup.
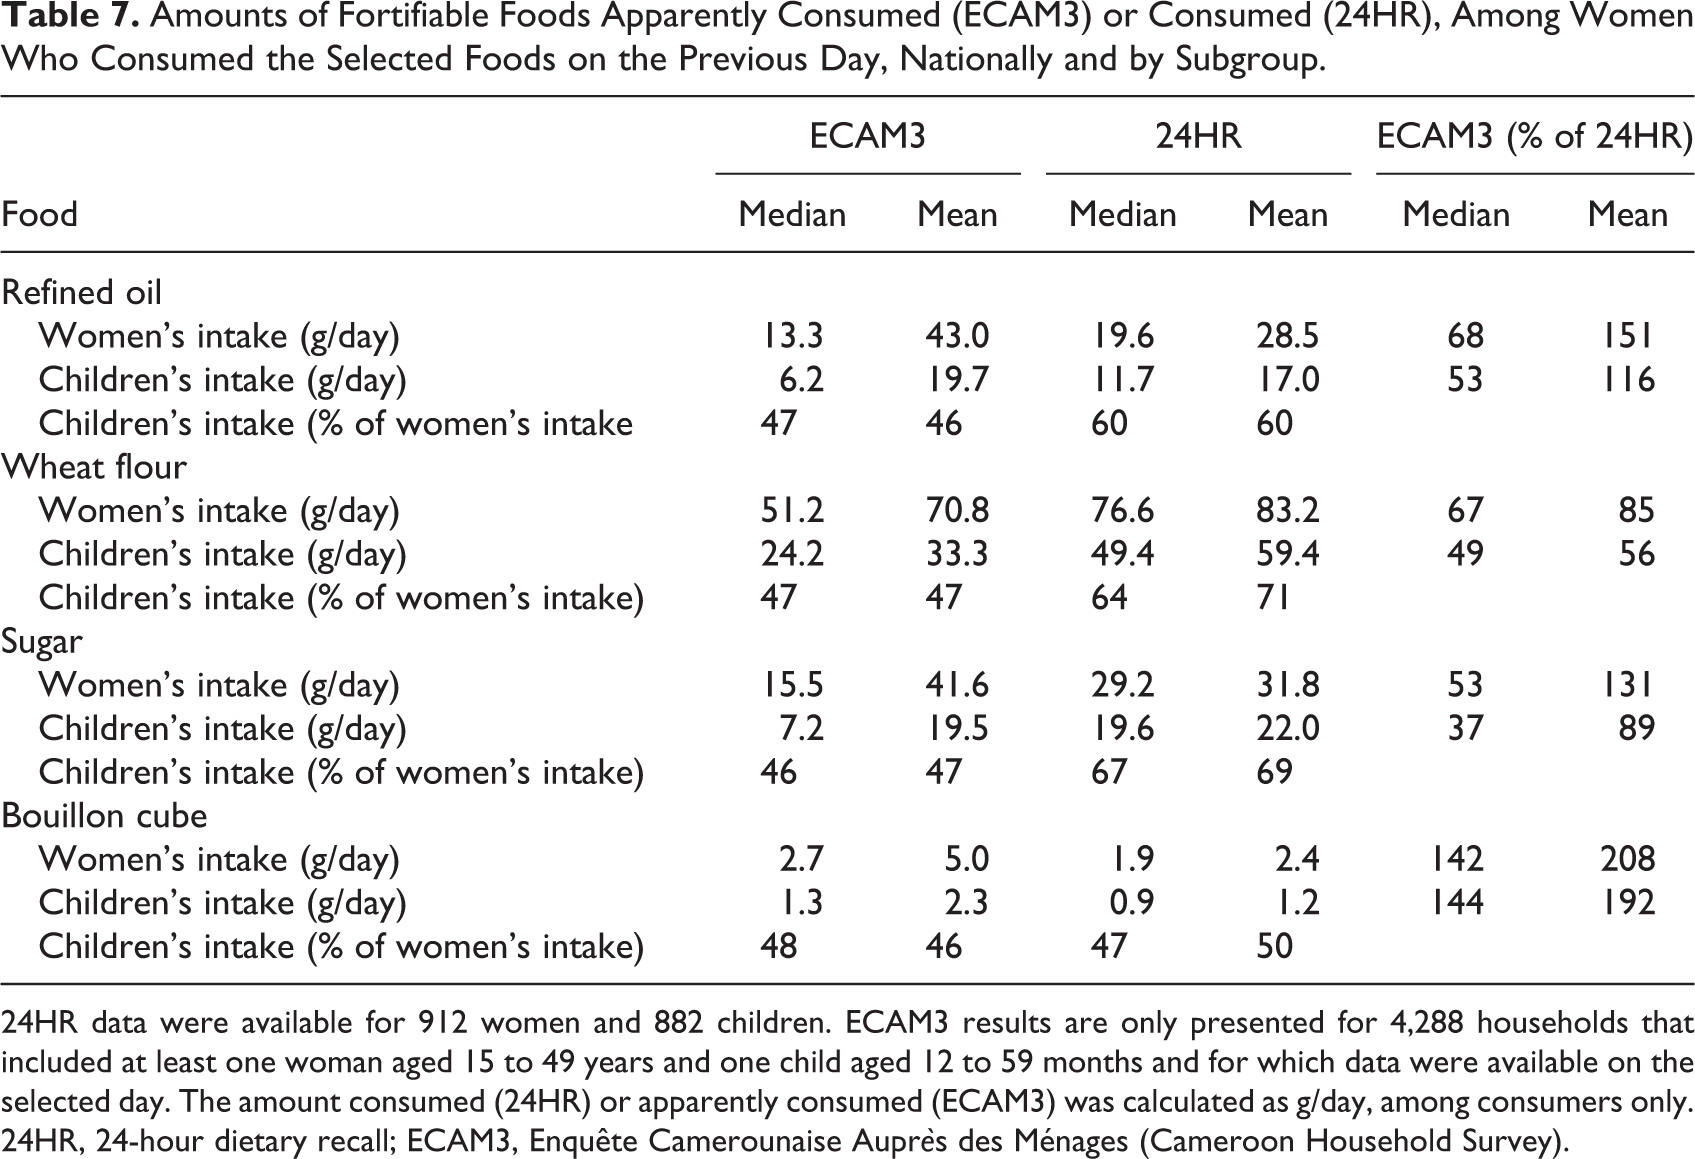
24HR data were available for 912 women and 882 children. ECAM3 results are only presented for 4,288 households that included at least one woman aged 15 to 49 years and one child aged 12 to 59 months and for which data were available on the selected day. The amount consumed (24HR) or apparently consumed (ECAM3) was calculated as g/day, among consumers only. 24HR, 24-hour dietary recall; ECAM3, Enquête Camerounaise Auprès des Ménages (Cameroon Household Survey).
With the 24HR data, we also examined the contribution of FPAH to fortifiable food intakes (Table 8). Among women and children who consumed fortifiable foods, the proportion of consumers who consumed at least one food item that was prepared away from home ranged from 35% for bouillon cubes to 67% for wheat flour. Moreover, among those who obtained at least one item away from home, the contribution of FPAH to total fortifiable food intake was large (ranging from 56% of bouillon cube consumption to 96% of wheat flour consumption).
Consumption of Fortifiable Foods Prepared Away From Home (FPAH) by Women and Children, as Measured by 24-hour Dietary Recall (24HR).
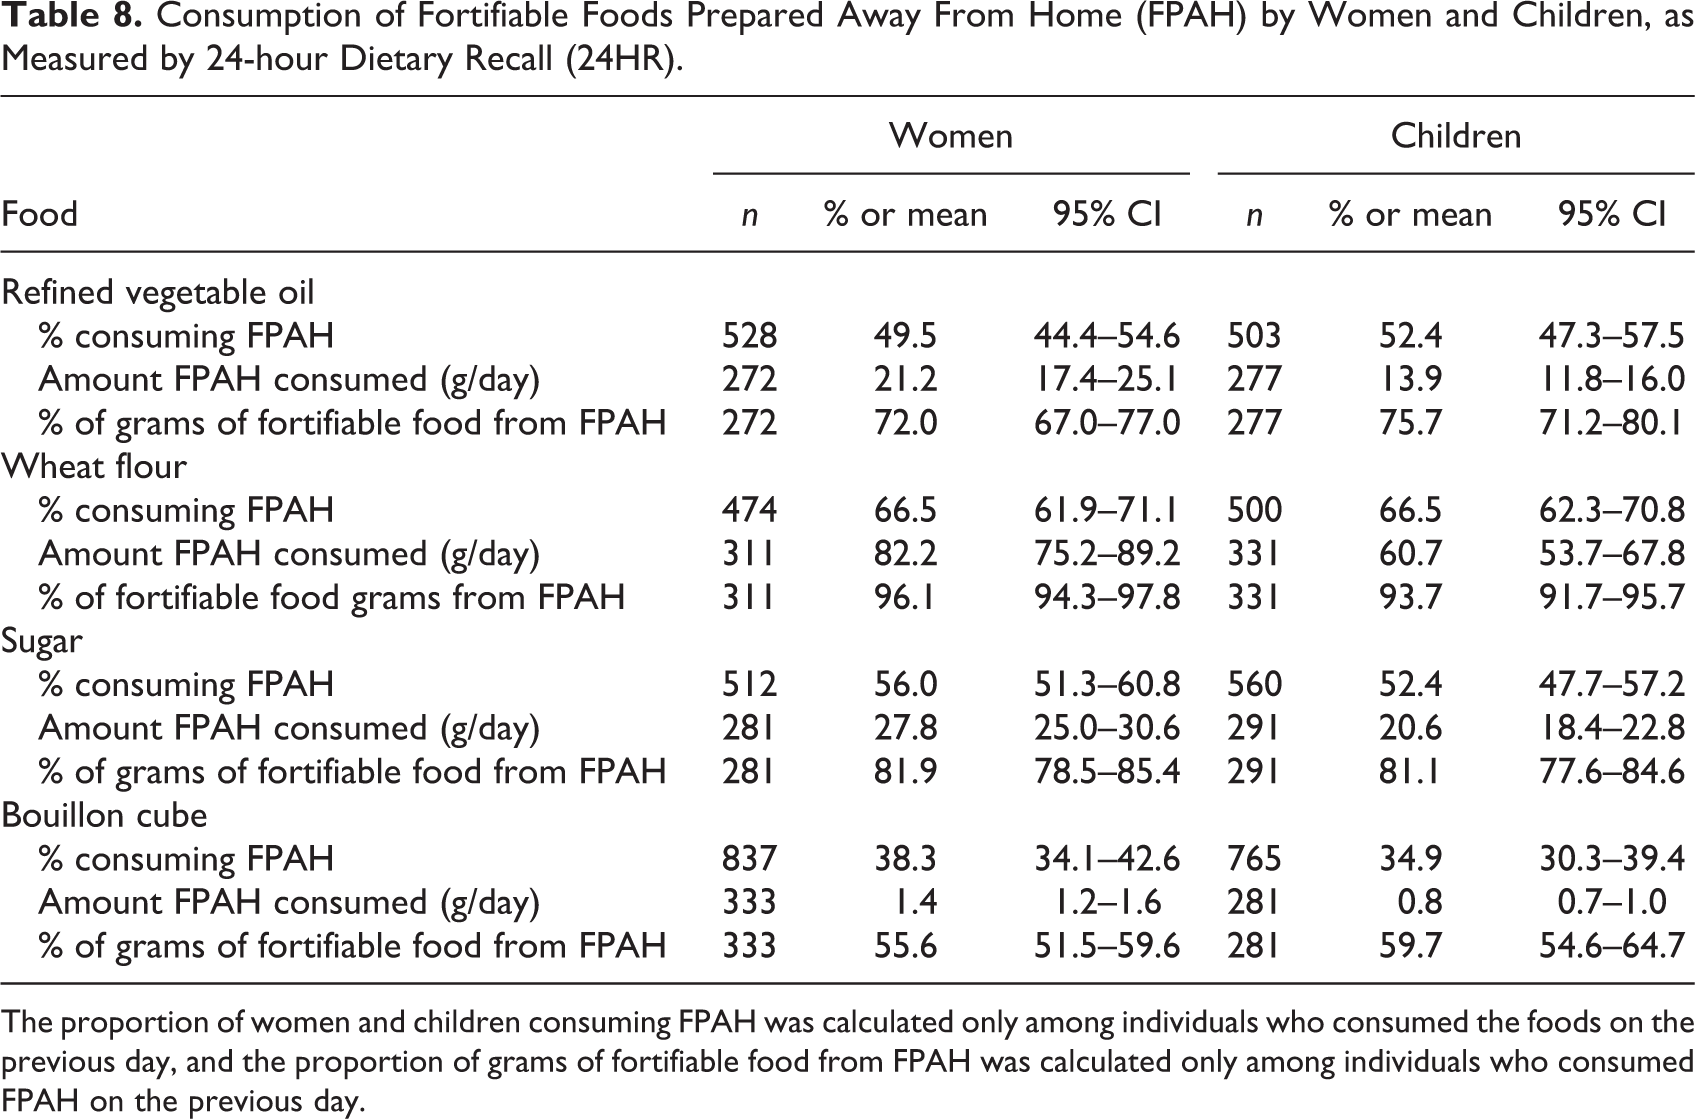
The proportion of women and children consuming FPAH was calculated only among individuals who consumed the foods on the previous day, and the proportion of grams of fortifiable food from FPAH was calculated only among individuals who consumed FPAH on the previous day.
Policy Conclusions
Because these two surveys employed different methodologies and different sample populations, some variation in the results should be expected. However, an important question is whether the results of the two surveys suggest the same policy actions. Prior to the availability of dietary results, the National Food Fortification Steering Committee elected to fortify cooking oil with vitamin A and wheat flour with minerals and selected vitamins, based on expected coverage of these food vehicles as well as technical feasibility and cost. Thus, we considered the policy implications of each survey in the context of a planned cooking oil and wheat flour fortification program.
The two primary policy-related conclusions based on food vehicle coverage estimated by the FFQ were that refined vegetable oil would cover only half the target population, so an additional vehicle should be fortified with vitamin A (if feasible) to achieve coverage greater than 80%; and that fortification of flour with minerals and selected vitamins would cover over 90% of the population, so a second food vehicle for minerals and vitamins would be unnecessary. 9 The fortification recommendations for vitamin A are similar for the ECAM3: because vegetable oil coverage during the previous week is less than 60%, fortification of a second vehicle in addition to oil would be necessary to increase the proportion of the population covered to more than 70% (if sugar or wheat flour were fortified in addition to oil) or more than 90% (if bouillon cubes were also fortified). In contrast, the ECAM3 results suggest that a second vehicle would also be necessary for delivery of minerals and vitamins, because reported wheat flour coverage during the previous week was less than 60%.
The extent to which the amounts of fortifiable foods consumed would suggest similar fortification levels for vitamin A in oil differs between women and children. For women, a greater mean intake of refined oil according to the ECAM3 would suggest a lower fortification level compared with that according to the 24HR, assuming equal dietary intake of vitamin A from other sources. However, the fortification levels would be almost identical if they were set using mean oil intakes among children from the ECAM3 or 24HR. For wheat flour, the lower estimates of the amount consumed in the ECAM3 suggest that higher fortification levels are necessary compared with those calculated using the 24HR. However, if flour fortification levels were set using the categories of wheat flour intake recently defined by the World Health Organization (WHO) 18 , the results for women and children in the ECAM3 and for children only in the 24HR would classify the amount of flour consumed similarly (e.g., < 75 g wheat flour); thus, the fortification levels would be the same. The mean wheat flour intake of 83 g among women in the 24HR, however, would suggest a lower fortification level (for flour intakes of 75–150 g/day), so the choice would depend on whether women or children are considered the primary target of the fortification program.
In the absence of an existing fortification plan, the coverage estimates according to the FFQ suggest that bouillon cubes, wheat flour, or both would be the most promising vehicle(s) for fortification, because coverage in the previous week was greater than 90% for both foods. In contrast, according to the ECAM3, fortification of bouillon cubes alone, but not of wheat flour alone, would achieve suitable coverage of the target groups.
Discussion
We compared the use of an HCES, the ECAM3, with a national survey using individual-level dietary assessment methods (FFQ and 24HR) to assess the consumption of fortifiable foods for the purpose of planning a national food fortification program in Cameroon. In general, the proportion of respondents who reported consuming the selected foods in the previous week was similar between the two surveys, but wheat flour coverage in the previous week was much lower according to the ECAM3 than according to the FFQ. The relative coverage of fortifiable foods among risk groups, such as those defined by geographic region and socioeconomic status, was similar between the two surveys for some foods, but not others. In particular, both surveys indicated that refined oil consumption was greatest in Yaoundé and Douala. However, the ECAM3 suggested larger differences in wheat flour and sugar coverage by region than were observed using the FFQ.
We found that the frequency of apparent consumption measured by the ECAM3 was much lower than the frequency of consumption measured by the FFQ, particularly for bouillon cubes. Likewise, the proportion of households apparently consuming each food on the previous day was consistently lower in the ECAM3 compared with the 24HR. These relationships likely reflect the type of data collected by the two surveys: that is, the ECAM3 collects information on household acquisition –– mainly purchases –– rather than individual intake, and foods are likely to be purchased less frequently than they are consumed because purchased food may be consumed over multiple days. Thus, frequency of consumption or acquisition is probably not the best indicator for comparing these two datasets, although this indicator is useful for assessing whether fortifiable foods are consumed often enough to increase long-term nutrient intake. The amounts of fortifiable foods consumed on the previous day were similar between the ECAM3 and the 24HR for some foods, although the relationships differed by risk group and population group (women vs. children). Notably, the mean apparent consumption of bouillon cubes according to the ECAM3 was approximately twice as great as that estimated from the 24HR.
Limitations
A limitation of this analysis is that we did not include comparisons of total nutrient intakes. This information would be necessary to estimate nutrient adequacy of the diet (and risk of excessive intakes) prior to fortification and to conduct a full comparison of the fortification levels that would be indicated by each survey by simulating the effects of different fortification levels on the prevalence of inadequate and excessive micronutrient intakes. However, in practice, the amounts of fortifiable foods consumed (or available in the food supply) are often the only information considered in establishing fortification levels; thus, the comparison of fortifiable food intake alone still provides some insight into whether the policy conclusions would be similar for the two surveys.
In addition, large-scale food fortification is one of many available interventions to increase micronutrient intakes, and decisions regarding which programs to implement require consideration of multiple factors. For example, some fortification vehicles may be considered undesirable because of concerns regarding adverse health effects of excessive consumption (e.g., of sugar, oil, or bouillon cubes, which can contain approximately 25% sodium by weight). However, fortification programs generally rely on existing consumption patterns, without the need to promote consumption of specific foods; fortification levels can be adjusted as necessary to accommodate changes in consumption of the food vehicle. Valid and reliable data on food consumption patterns, including changes over time, are necessary to guide these adjustments and for policymakers to make informed choices among potential nutrition programs.
Possible Explanations for Differences Between Survey Results
There are a number of potential explanations for the differences observed in the results of the two surveys. Our objective was to examine differences due to the two data collection methods (household expenditures survey vs. individual dietary survey). However, there were also differences between the two surveys in target populations, survey design, and year of implementation of the surveys. A true validation of an HCES tool for estimating individual dietary intake would require administering the HCES and individual-level dietary assessment within the same household during a similar time period (as in the study in Uganda discussed below). It should also be noted that the 24HR and FFQ have a number of limitations and should not be considered as gold standards for measurement of food intake. Nevertheless, these methods serve as a reasonable reference against which to compare food consumption as estimated by the HCES, especially because they provide individual-level information.
We attempted to make the datasets as comparable as possible by matching the food categories, target populations (i.e., women and young children), and data collection schedules and carefully considering the definition of a “consumer” of fortifiable foods. The two studies used the same census data for sampling and were conducted in the same season (September to December), minimizing any differences due to these factors. In addition, for both surveys, we used conversion factors that were collected in the field during the dietary survey to convert quantities of food from volume and price units into grams; these local conversion factors are typically not available during secondary analysis of HCES data, so further discrepancies might be expected if values from other settings were used instead. We explored Food and Agriculture Organization (FAO) Food Balance Sheets for the respective survey years (2007 and 2009) to assess whether actual changes in food consumption accounted for some of the differences in fortifiable food intake as measured by the two surveys, but differences in national food availability did not explain the observed differences between the results of the ECAM3 and the dietary survey (data not shown). For these reasons, we believe that comparison of data from the two surveys allows some inferences about differences between the two data collection methods.
Potential explanations for the differences in results due to the data collection methods (household survey vs. individual dietary interview) include different food lists, issues related to frequency of acquisition vs. consumption, measurement of FPAH, and application of the AME method to estimate individual intakes from household data. With all methods, difficulty experienced by the respondent in recalling the types and amounts of foods consumed may also contribute to the variation in results.
Food lists
Although some HCES instruments may include food lists that are not sufficiently detailed to separate fortifiable and nonfortifiable foods, the ECAM3 is fairly detailed in that it differentiates between crude and refined oils and between imported and locally produced wheat products. However, some prepared foods are not included in the ECAM3, and others are included in the ECAM3 but categorized differently than they are in the FFQ. For example, sauces and mixed dishes were the most important contributors to the amount of refined oil intake in the 24HR. This source will also be captured by the ECAM3 if the dishes are prepared with oil acquired by the household during the same time period. However, mixed dishes prepared outside the home (e.g., at a restaurant or family member’s home) are not specifically included in the ECAM3 food list, which may explain why the amounts of oil consumed are lower according to the ECAM3 than the 24HR. Possible modifications of the HCES to improve estimates of refined oil intake could include adding categories for restaurant meals to the weekly recall and diary and asking respondents to specify, where possible, the type of oil used in mixed dishes, including fried foods.
The FFQ, but not the ECAM3, asked specifically about sugar consumed in porridges and sugar added to tea or coffee. Excluding sugar in porridge from the FFQ results decreased sugar coverage by only 2%, but excluding sugar added to tea or coffee decreased sugar coverage from 78% to 55% for women and from 86% to 68% for children, suggesting that differences in reporting sugar added to these beverages may explain the slightly greater sugar coverage in the FFQ compared with the ECAM3. Similarly, because mixed dishes (such as sauces) procured outside the home are not included in the ECAM3, this source of bouillon cube intake may be underestimated. Probing specifically for beverages and sugar added to beverages and adding food list categories such as “sauces or foods containing bouillon cube” might help to capture consumption of sugar and bouillon cubes in the HCES.
Frequency of acquisition vs. consumption
One challenge to interpreting HCES data for dietary assessment purposes is that food acquisition may not equal food consumption, particularly when the reference time period is short. 19 If a food is purchased in bulk and consumed over a period of several days or weeks, the apparent consumption during a short time period will be overestimated if food acquisition occurs during the reference period and underestimated if acquisition does not occur during the reference period and any consumption from stocks is not adequately reported. Coverage estimates for the two surveys were generally closer when the comparison period was 1 week rather than 1 day. For example, bouillon cube coverage in the previous day (approximately 33%) was very low relative to the 24HR, but the 1-week coverage was similar to that measured by the FFQ.
Of the fortifiable foods assessed in the ECAM3, 91% of items were purchased, 4% were reportedly gathered or collected, and only 2.5% were consumed from stocks. Thus, either these four foods are not commonly consumed as stocks from home, or this source is underreported by the household survey; the latter possibility has been noted elsewhere. 20 Thus, the lower coverage of some foods reported according to the ECAM3 vs. the FFQ and 24HR could be due in part to home consumption of previously acquired foods that was not recorded by the ECAM3. Similarly, because the amounts consumed were calculated only among consumers, if the proportion of “apparent consumers” on the previous day was low due to infrequent acquisition, then the mean amount “apparently consumed” per day would be inflated (for example, if the 33% of households who acquired bouillon cubes on the recalled day were acquiring a 2- or 3-day supply). This likely explains why the amount of bouillon cubes consumed according to the ECAM3 was greater than the estimated consumption from the 24HR.
A longer period of observation would be expected to yield a more accurate picture of habitual consumption patterns; this is an advantage of the HCES and FFQ for assessing dietary patterns to select food vehicles that are frequently consumed (although if data are collected by recall, a longer recall period may make it difficult to obtain data in enough detail to derive nutrient intakes and calculate the prevalence of inadequacy).
Foods prepared away from home (FPAH)
As discussed for recipes containing oil and bouillon cube, underreporting of foods prepared (and consumed) away from home could also contribute to the lower estimated amount apparently consumed for some foods according to the ECAM3. The expense diary (used in urban and semiurban households only) is usually given only to a few members of the household, so foods or snacks purchased outside the home by household members who did not carry an expense diary (or who were not included in the recall interview in rural areas) could have been omitted. There is evidence from other countries that failure to adequately measure foods consumed away from home affects food consumption estimates and that provision of multiple diaries increases reported household consumption 21,22 . The 24HR results indicate that a large proportion of respondents consumed fortifiable food equivalents as FPAH, particularly for wheat flour (for which coverage was notably lower according to the ECAM3 than according to the FFQ). Thus, underreporting of FPAH may account for some cases of lower coverage or amounts apparently consumed according to the ECAM3 than according to the 24HR.
AME method
To estimate individual consumption from household acquisition data, we applied the most common approach, the AME, which assumes that food distribution within a household is proportional to the individual’s share of total household energy requirements. 16 A recent review concluded that this assumption of “equitable distribution” is reasonable for energy intake but noted the paucity of data on this topic. 23 However, consumption of specific foods by different members of a household is not necessarily proportional to energy requirements, particularly for young children. Although we did not have 24HR data for all household members, the ratios of children’s to women’s intakes suggest that intrahousehold distribution of selected foods may differ depending on the type of food: for example, compared with women, children consumed proportionally more wheat flour, sugar, and refined oil than bouillon cube. However, for some fortifiable foods (e.g., bouillon cube, which is mixed into the main household dishes), intrahousehold distribution may reflect the distribution of energy requirements. An analysis of the 2011–2012 Bangladesh Integrated Household Survey, which included 24HR recalls from all household members, found that, for individuals over 3 years of age, individual nutrient intake was very similar to the apparent consumption that would be predicted by applying the AME method to the household’s total consumption. 24 Similar studies in other contexts are needed to adequately address the issue of intrahousehold distribution of nutrients as well as specific foods.
Related Literature
Few empirical comparisons of HCES and dietary assessment methods are available. In a validation study in 2008, investigators administered single 24HR dietary recalls as well as a HCES questionnaire to 957 households in three regions of Uganda and estimated consumption of fortifiable foods by women aged 15 to 49 years and children aged 24 to 59 months. 25 The results were also compared with those estimated using the 2006 national HCES. Although the coverage of fortifiable foods and amounts consumed varied among the data sources, the HCES and 24HR identified similar patterns of consumption among the three regions. The investigators also compared estimates of dietary nutrient density calculated from the 24HR and the 2006 HCES and found no significant differences in median nutrient intakes for the majority of comparisons of nutrient intake by region and population subgroup (women or children). 26 However, the HCES under- or overestimated nutrient intake density for certain nutrients and subgroups.
A second study compared results from a published study of observed-weighed food records with analysis of HCES for two rural districts of Bangladesh. 27 Coverage of oil, wheat flour, and sugar was similar between the two surveys, and rankings of coverage of the different food vehicles were the same. The amount of each food consumed or apparently consumed differed, but the two data sources yielded similar recommendations for fortification levels.
Improving the Use of HCES for Fortification Program Planning
Despite the limitations of this comparison, the results yield some suggestions for improving the use of HCES for fortification program planning. Detailed suggestions for tailoring HCES for nutrition applications (some of which overlap with the ideas below) have been given elsewhere 6,19 . Possible modifications of HCES questionnaires to improve estimates of fortifiable food intake include adding categories for specific sources of fortifiable foods (e.g., oil or bouillon cube in restaurant meals, sugar in beverages, etc.) to the questionnaires; asking respondents to specify, where possible, details about the type of food used in the preparation (e.g., the type of oil used in frying); and including specific questions on foods consumed away from home by all household members. Providing expense diaries to more household members or adding specific questions for foods (especially those prepared outside the home) that are likely to be consumed preferentially by target individuals, such as children, may also improve estimates of individual intake.
Beyond changes to the questionnaire, adjustments to the interview protocol used by survey enumerators, such as probing for snacks or foods consumed outside the home, may also elicit more detailed responses.
A final set of considerations relates to analysis of HCES data for nutrition programming. Analyzing data at the household level (rather than attempting to estimate individual apparent intakes) would provide useful information on household-level access to foods and nutrients, without the uncertainty of applying assumptions regarding intrahousehold distribution of these indicators. Analysts should also consider the reference time period for data analysis, which may differ depending on whether the objective is comparison with traditional individual dietary assessment methods (such as 1-week FFQ or 24HR) or some other time period that is considered nutritionally important. For selection of food vehicles, a longer time period would be preferable to identify households that typically consume a product, but a shorter time period, some measure of frequency of consumption, or both are necessary to assess how many households are frequent consumers (and thus most likely to benefit from fortification).
Conclusions
HCES provide an alternative source of data on food intake that avoids the cost, time, and technical capacity required to implement a stand-alone survey of dietary intake at the national level. The few empirical comparisons between HCES and other methods of dietary assessment have shown that there are still important differences in the results of the various methods. However, the general patterns of consumption, and thus the policy implications of the results for selecting fortification vehicles, are often similar 25 -27 . Thus, HCES should be considered for use in fortification program planning (e.g., selection of fortification vehicles) when detailed assessment of individual-level dietary intake is not feasible. HCES may provide insight for setting fortification levels when no other data are available, but their validity for estimating food and nutrient consumption of individuals needs further examination. Adaptations such as inquiring specifically about mixed dishes and foods consumed outside the home may improve the ability of HCES instruments to capture fortifiable food intake of women and young children. Additional research is necessary to improve the assessment of dietary intakes for nutrition program planning.
Footnotes
Acknowledgments
The authors gratefully acknowledge the National Institute of Statistics of Cameroon and Olivier Dupriez (World Bank) for providing access to the ECAM3 database, Janet M. Peerson (University of California Davis) for advice on statistical analysis, Martin Nankap and Alex Ndjebayi (Helen Keller International Cameroon) for supervision of the fieldwork for the dietary survey, and John Fiedler (International Food Policy Research Institute/SPRING [Strengthening Partnerships, Results, and Innovations in Nutrition Globally]) for useful comments on the preliminary results.
Authors’ Contributions
Both authors designed the study, wrote the paper, and read and approved the final version. Reina Engle-Stone supervised the fieldwork for the dietary survey and analyzed the data.
Declaration of Conflicting Interests
The author(s) declared no potential conflicts of interest with respect to the research, authorship, and/or publication of this article.
Funding
The author(s) disclosed receipt of the following financial support for the research, authorship, and/or publication of this article: The data collection and analysis for the dietary survey were supported by the Michael and Susan Dell Foundation, Sight and Life, and UNICEF.