
Abstract
Background:
A large number of illnesses, afflicting one-third of the world’s population, have been attributed to zinc deficiency. Inadequate dietary intake of bioavailable forms of zinc is considered the most frequent cause of zinc deficiency, which is most common in arid regions of developing countries.
Objective:
To employ a modeling approach in a test population to analyze how best to eliminate zinc deficiency using different plausible dietary scenarios.
Methods:
A comprehensive database was built upon food consumption patterns of two population groups residing in a village and a suburb in semiarid central Iran near Isfahan city. A database was created on zinc and phytic acid concentrations of different foods and ingredients consumed by the study populations. A zinc intake model was constructed and parameterized accounting for bioavailability and model input uncertainties.
Results:
The zinc intake of about one-third of both study populations, which did not differ significantly in their rates of zinc deficiency, was below the Estimated Average Requirement (EAR) for zinc. Scenario analyses predicted that at the current rate of food consumption, it would take up to 60 years for 97.5% of the population to meet their zinc EARs. Fortification of wheat flour and biofortification of wheat grains would result in 93% and 88% of the population, respectively, achieving their EARs in 15 years.
Conclusions:
The modeled results suggest that fortification and biofortification are the most effective and sustainable strategies to combat zinc deficiency. The methodology developed in this study is general and is shown to be a useful tool for the analysis of possible future trends and intervention scenarios.
Introduction
Because of the multitude of basic biochemical functions of zinc in the cells of the human body, there is a broad range of physiological signs of zinc deficiency. These signs vary depending on the severity of the condition. Organ systems known to be affected clinically by zinc deficiency include the epidermal, gastrointestinal, central nervous, immune, skeletal, and reproductive systems. 1
Zinc deficiency in humans was first detected in Iran in 1961. 2 Since then, many surveys based on laboratory and clinical tests, including zinc supplementation trials, have reported the prevalence of zinc deficiency in human populations worldwide. 3 Zinc deficiency is especially prevalent in developing countries, where populations depend on plant-based foods with low concentrations of bioavailable zinc and have insufficient dietary intake of zinc from animal products. 4 Bioavailable zinc refers to the fraction of zinc intake that is absorbed from the digestive tract and thus is available for physiological functions. 5 The bioavailability of zinc is dependent on dietary composition, in particular on the proportion of high-phytate foods in the diet. Phytic acid is the principal dietary factor known to impair zinc bioavailability. 5 -7 It is present in high concentrations in cereal grains and legume seeds, but not in animal foods. 8 The molar ratio of phytic acid to zinc in meals or diets provides a useful measure of zinc bioavailability. At high ratios (i.e., above 18:1 according to the International Zinc Consultative Group (IZiNCG) 9 ), zinc absorption from food is low (Table 1). Zinc deficiency can be exacerbated in arid regions, where zinc uptake by crops is often affected by the low availability of zinc in the soil. 10
Values of the Zinc Bioavailability Index k Used in This Study.a
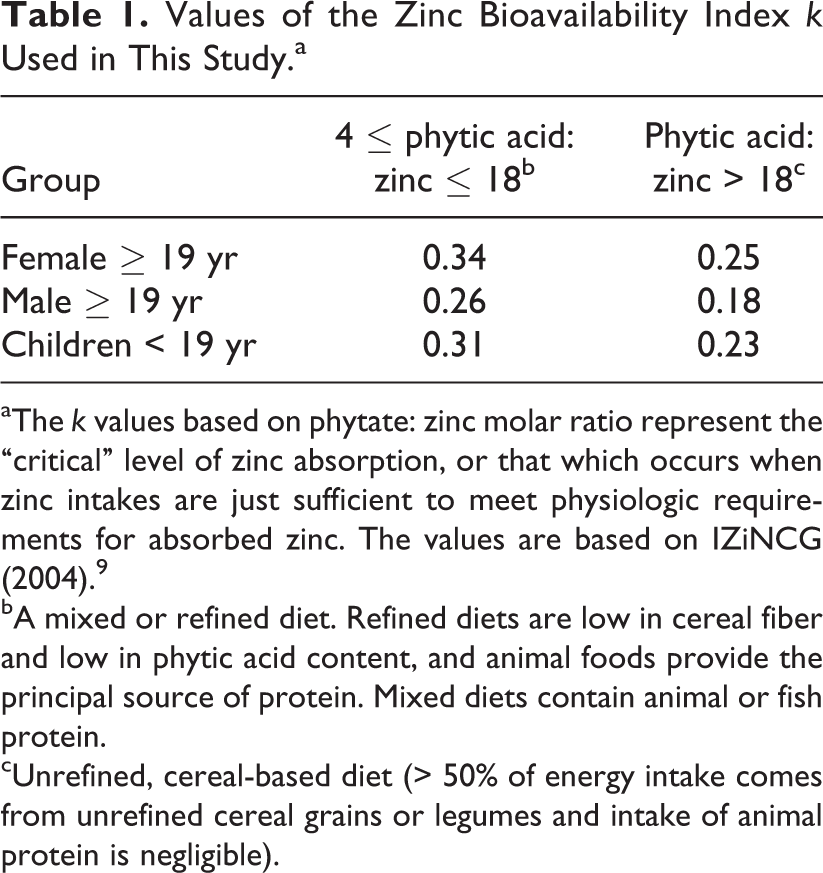
aThe k values based on phytate: zinc molar ratio represent the “critical” level of zinc absorption, or that which occurs when zinc intakes are just sufficient to meet physiologic requirements for absorbed zinc. The values are based on IZiNCG (2004). 9
bA mixed or refined diet. Refined diets are low in cereal fiber and low in phytic acid content, and animal foods provide the principal source of protein. Mixed diets contain animal or fish protein.
cUnrefined, cereal-based diet (> 50% of energy intake comes from unrefined cereal grains or legumes and intake of animal protein is negligible).
Foods with naturally high contents of absorbable micronutrients are considered the best means of preventing micronutrient deficiencies. 11 In communities where such foods are less available, micronutrient intake can be increased by the traditional interventions of fortifying staple foods or condiments or by consuming supplements at pharmacological doses. 1 Foliar application of zinc in rice was found to be a practical and useful approach to improve bioavailable zinc in polished rice. 12 This recent alternative intervention is known as “biofortification” of edible parts of crop plants. 13 The choice of intervention depends upon the availability of resources, technical feasibility, and societal factors.
Models designed to predict the outcome of different food consumption scenarios on zinc intake could be helpful tools in evaluating policies or intervention strategies. To the best of our knowledge, models to relate trace element intake with food consumption have been used only recently. Examples include the estimation of fluoride intake from food and drinks in young children in Ethiopia 14 and the use of a zinc intake model to provide the best estimate of the prevalence of inadequate zinc intake using global and regional nutrient composition databases. 15 Such investigations are particularly important in arid regions of the developing world, where people are at a higher risk for zinc deficiency. For a case study, we selected a semiarid region in central Iran where cereals are the staple food.
Taking into account uncertainties, such as those related to database and those related to food consumption and nutrient concentrations, is essential to establish upper and lower limits of zinc intake. Values for nutrient intakes are never constant and vary depending on many factors. Concentrations of zinc and phytic acid in crop plants vary with soil and climate conditions as well as with cultivation practices. 9 Zinc levels in animal foods mainly depend on the animal’s species, age, sex, and feeding regime. 16 -18 There are also notable differences in the concentration of zinc between different meat cuts. 19 The zinc and phytic acid concentrations in the final diets also depend on food processing and meal preparation procedures. In this study, we tried to account for these uncertainties. Variations in the zinc and phytic acid concentrations of consumed foods and ingredients were the main sources of uncertainty in our analysis.
The objective of this study was to develop a zinc intake model describing the intake of bioavailable zinc from different food sources by different population groups, considering the existing uncertainties; and to evaluate the potential use of the model to perform scenario analyses of possible future dietary trends and intervention strategies to abate zinc deficiency.
Materials and Methods
Location and Food Consumption Data
Two study sites were surveyed for food consumption data: a village and a suburban town. Our criteria for selecting the village (Rooran, population 2,000) were accessibility and a typical rural lifestyle based on agriculture and self-production of rice and wheat. The criteria for selecting the suburban community (Khomeini Shahr, population 200,000) were an urban lifestyle with a population consuming mostly the same products as the city of Isfahan. Written consent was obtained from all adult participants (over 18 years) and from the parents of children, together with oral consent from the children. In addition, permission to conduct the survey was obtained from the respective health centers for both communities. The protocol was reviewed and approved by the Ethics Committees of ETH Zurich and the Research Affairs office of Isfahan University of Technology.
The surveys included 24 households with a total of 91 individuals in the suburb and 28 households with 100 individuals in the village. The households were selected randomly from these communities. The surveys were performed during the summer in the rural community and during the winter in the suburban community to cover seasonal variability. Food accessibility, however, was checked in winter for the rural area. Using the method of 3-day-weighed-food records 20 , all food intakes were recorded for each participant on three consecutive days, including two weekdays and one weekend day, during which the households were asked to maintain their usual food habits. We weighed the total food prepared for consumption, the proportions consumed by individual household members, and the uneaten remains. Further details of the surveys are presented elsewhere. 21
Zinc and Phytic Acid Concentrations of the Food Items Consumed in the Meals
The concentration of zinc in dairy products, chicken, and red meat and the concentration of zinc and phytic acid in bread and rice were determined from the analysis of food samples collected during the dietary surveys. 21 These foods were the major sources of zinc in the diet. For food items that had not been sampled and analyzed, such as snacks, fruits and vegetables, tea and other beverages, and preserved foods, we used published food composition tables, including those of the US Department of Agriculture (http://www.nutrisurvey.de/), the Food and Agriculture Organization (FAO), Germany, Egypt, Kenya, India, and Mexico (http://www.nutrisurvey.de/), and phytic acid data reported by IZiNCG. 9 Published food composition data were used to determine the distribution of the zinc and phytic acid concentrations of ingredients for which the number of samples was too small in our surveys (Table 2). In the case of red meat, the probability distribution covers the variability in zinc concentration of different cuts and in different types of red meat, including lamb, mutton, veal, and beef. These variables were found to be log normally distributed, as determined by a Kolmogorov-Smirnov goodness-of-fit test.
Parameters (Means and Standard Deviations) of the Log-normal Probability Distributions Used in This Study to Model the Uncertainty in Food Zinc Concentrations (mg/100 g).a
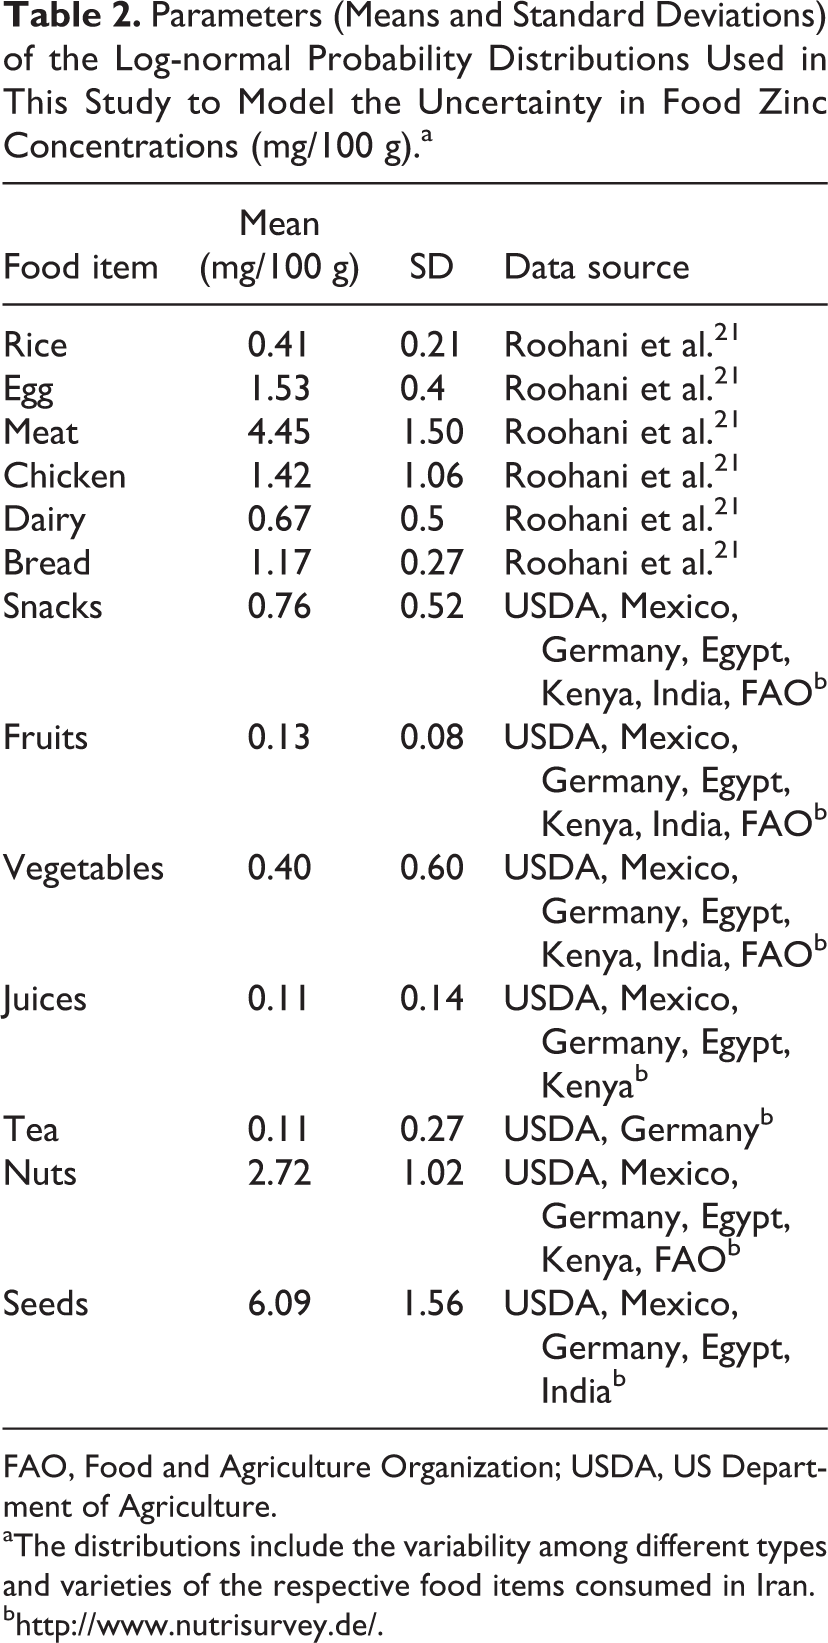
FAO, Food and Agriculture Organization; USDA, US Department of Agriculture.
aThe distributions include the variability among different types and varieties of the respective food items consumed in Iran.
Zinc Model
The total average intake of zinc and phytic acid for each age/sex group g and meal m is calculated as
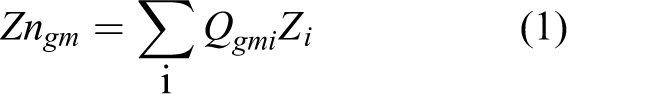
and

where i is a food item in the meal m, Zi
is the concentration of zinc, Pi
is the concentration of phytic acid, and
The model assumes that all food items consumed during a meal are well mixed in the intestine, that no carryover occurs from one meal to the next, and that the bioavailability of zinc is a fraction of the total zinc intake determined by the overall phytic acid: zinc molar ratio in the meal. The intake of bioavailable zinc (BZn) in group g for meal m is then calculated as:

The bioavailability coefficient kgm is calculated based on the phytic acid: zinc molar ratio as described by IZiNCG in Table 1.
The average daily intakes of total zinc, phytic acid, and bioavailable zinc are then calculated by averaging over all meals consumed by age/sex group g over a period D:
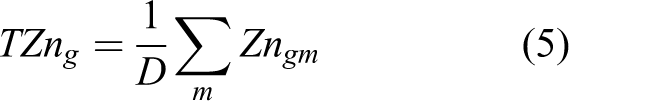

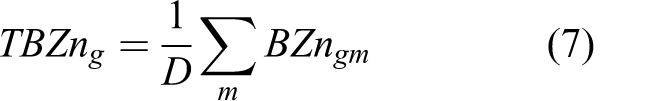
Since we used the 3-day-weighed-food record in our surveys, the average is calculated over a period of 3 days (D = 3).
Model Uncertainty
In order to account for uncertainties caused by inadequate knowledge of both food consumption and variability of zinc concentration in different parts of, for example, meat cuts, the zinc and phytic acid concentrations of the ingredients were treated as random variables (i.e., described by a distribution). In this study, we used a common practice of assuming log-normal distributions to describe their probability density functions 22 (Table 2). A Kolmogorov-Smirnov goodness-of-fit test on the available database did not reject the hypothesis of log-normality.
Latin hypercube sampling 23 was used to propagate the uncertainty of the respective input parameters. In the present study, 500 equally probable sets of realizations of the random input parameters are used in each simulation to estimate the probability distribution of the computed zinc intake rates. The 2.5% (lower bound) and 97.5% (upper bound) quantiles are used to quantify the 95% prediction uncertainty (95PPU) interval.
Model Parameterization
In the scenarios presented here, the parameters Q, Z, and P (equations 1 and 2) were determined for the two population groups. The target populations were then grouped by age and sex in accordance with the classifications of the EARs. The EAR values are the zinc intake rates at which half of the respective populations meet their requirement. 9 IZiNCG 9 , the US Institute of Medicine (IOM) 24 , and the World Health Organization (WHO) 25 have published different EAR values for zinc. We used those of IZiNCG, because they are almost as conservative as those of IOM, differentiate between types of diets, and while not being unrealistically high, allow us to see the effectiveness of different dietary scenarios on zinc intake and the risk of zinc deficiency.
Sensitivity Analysis
We performed a sensitivity analysis to identify the importance of different food items for zinc intake. In our survey, bread, dairy products, rice, red meat, and poultry constituted 46% of the total food consumed and provided about 80% of the zinc intake. Therefore, the quantities of bread, rice, chicken, red meat, and dairy consumed were varied one at a time by ± 5% and ± 10% to examine their influence on calculated zinc intake.
Scenario Analysis
The scenario analysis was based on the meal composition and consumption data collected in the two surveys together with the FAO averages of per capita food consumption in the past 20 years for Iran. Given that we found only a few differences in the dietary patterns of the two communities and that these did not lead to significant differences in the rates of zinc and phytic acid intake, we pooled the data of the two surveys together.
There was good agreement between the FAO averages of per capita food consumption in the past 20 years and our survey results (Figure 1A). Also, our sample populations were very similar in their distributions by age and sex groups to the total population of Iran, as reported by the US Census Bureau in 2009 (Figure 1B). For these reasons, we assumed that the average annual rates of increase or decrease in the consumption of bread, dairy, rice, red meat, and poultry in the past two decades for the whole country would hold for our study population. These assumptions led to the definition of baseline scenario B.
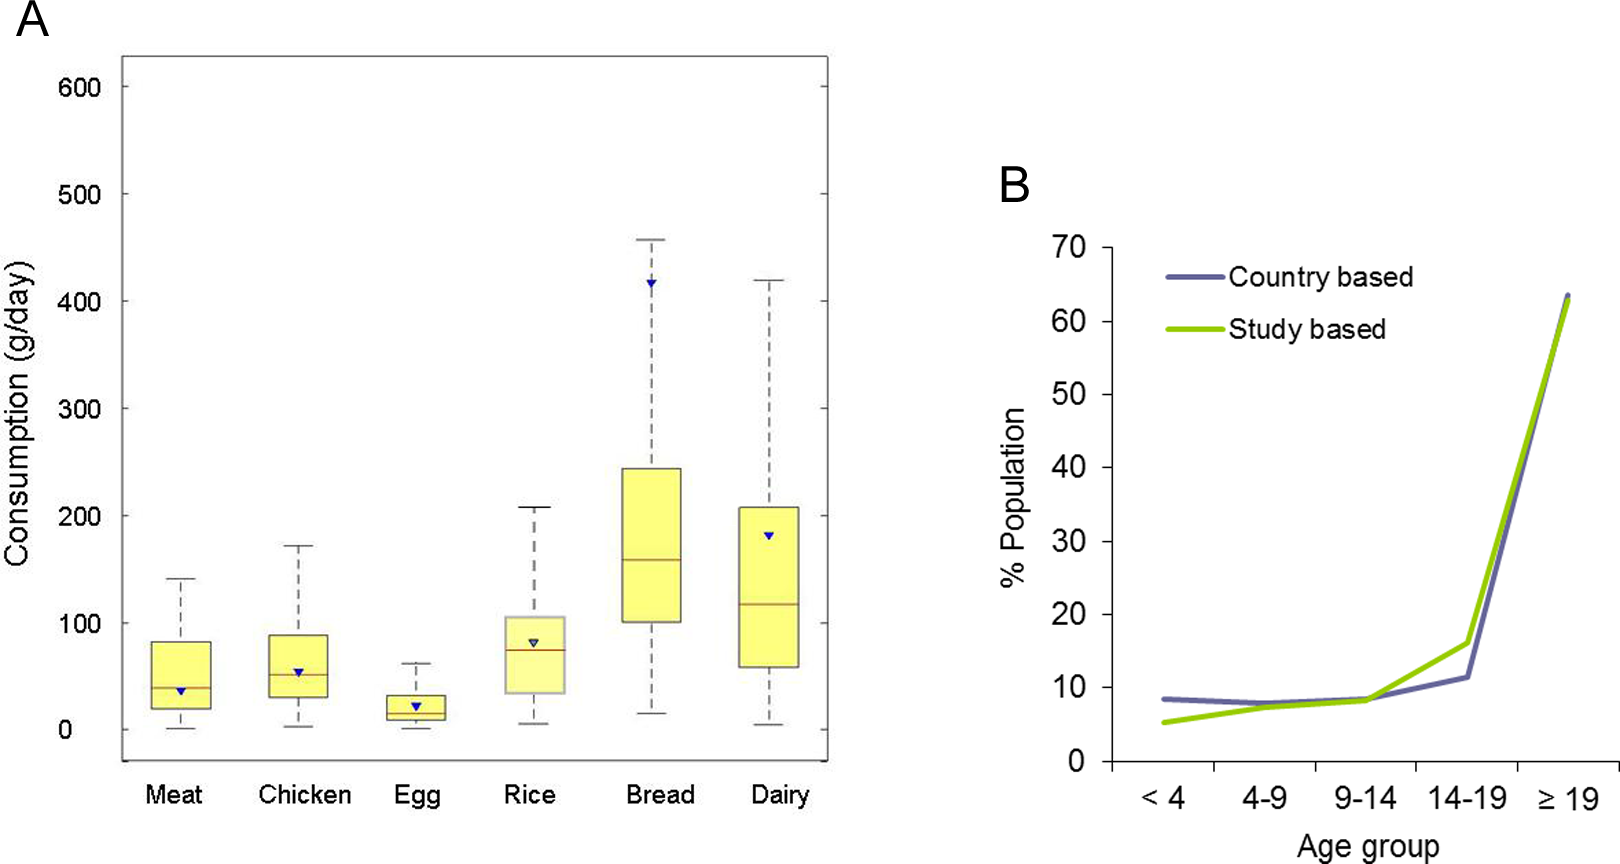
(A) Comparison of the consumption of major foods (red meat, chicken, egg, rice, bread, and dairy) found in this study (boxplots) with average consumptions estimated by FAO in 2007 (triangles) for the population of Iran. No value was given for bread in the FAO food balance sheets. The consumption of wheat reported by FAO, which includes bread, is much larger than that of bread alone. (B) The population distribution by age groups of the study population was similar to that of the total Iranian population as reported by the US Census Bureau (2009).
For the baseline scenario, we followed the past trend of food intake in the country and projected it to the next 15 years (Table 3). The annual rate of change in egg consumption was maintained at a 4% increase from year to year in all scenarios, while the consumption of other food groups not mentioned here was assumed to be constant due to their negligible influence on the dietary zinc intake of the study population.
Nutrition Scenarios Analyzed in This Study.
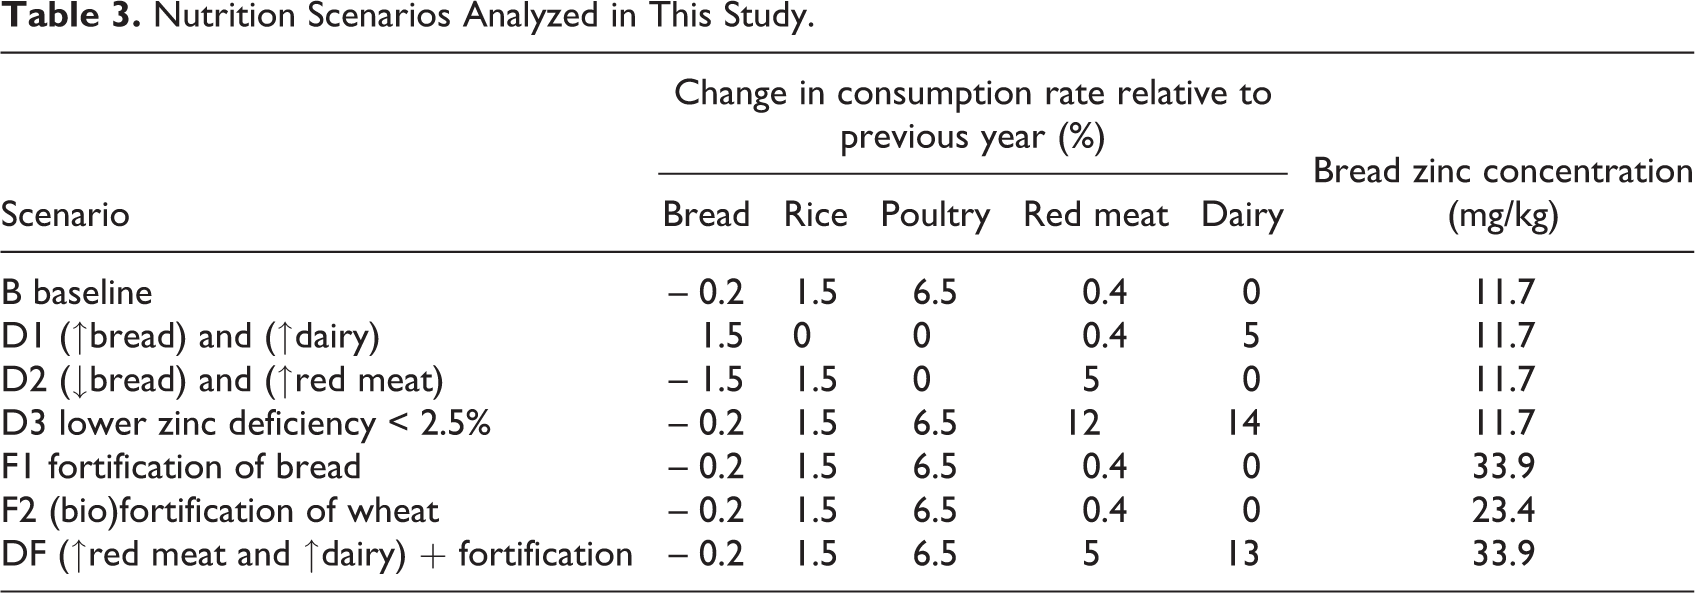
Based on baseline scenario B, three plausible “dietary diversification scenarios” were defined. In scenario D1, we evaluated the effects of increasing the average annual change in bread consumption from –0.2% in the previous two decades to 1.5% and the average annual change in dairy consumption from zero to an annual increase of 5%, while the rates of increase in the consumption of rice and poultry were set to zero (Table 3). In scenario D2, we assumed that the consumption of bread would decrease by 1.5% while that of red meat would increase to 5%, but the rate of change of poultry consumption was again set to zero (Table 3). In scenario D3, the past trends of annual changes were kept the same as in the baseline scenario for the consumption of bread, rice, and poultry, while they were increased for dairy and red meat so that 97.5% of the population would meet their EARs in the next 15 years.
Furthermore, we defined a flour fortification (F1) and a wheat biofortification (F2) scenario in which the dietary consumption rates were kept the same as in the baseline scenario. In scenario F1, the average zinc concentration of bread consumed by the study population was increased from 11.7 to 33.9 mg/kg of fresh weight, based on a previous study 26 where the zinc concentration of wheat flour was increased by 30 mg/kg using zinc sulfate as the fortificant. In scenario F2, the zinc concentration of bread was only doubled (from 11.7 to 23.4 mg/kg). This scenario covers the potential increase in bread zinc that was achieved by biofortification. 27
The final scenario (DF) was a combination of the diversification (D3) and flour fortification (F1) scenarios. The aim was to see the impact of fortification on the increases in red meat and dairy consumption that were required to achieve 97.5% zinc sufficiency in scenario D3.
Results
Sensitivity and Uncertainty Analysis
Seasonal variations did not seem to have a strong effect, as indicated by the fact that the surveys were performed during the summer in the rural community and during the winter in the suburban communities and the consumption patterns were fairly similar. Food availability did not differ between the two communities in the winter. Milk and other dairy products in the village came from local sources as well as from the city (similar to egg and chicken), while meat was always locally available. There were greenhouses that were active during the winter for the production of vegetables, and rice was produced and consumed locally and was available throughout the year.
The sensitivity analysis revealed that bread had the largest effect on total zinc intake, followed by dairy, rice, and red meat (Figure 2A). In Figure 2B the total intake of zinc from bread and rice is compared with that of bioavailable zinc. The ratio between bioavailable and total zinc was lower in bread than in rice, suggesting a larger inhibitory effect of phytic acid on zinc bioavailability in bread due to its higher phytic acid concentration.
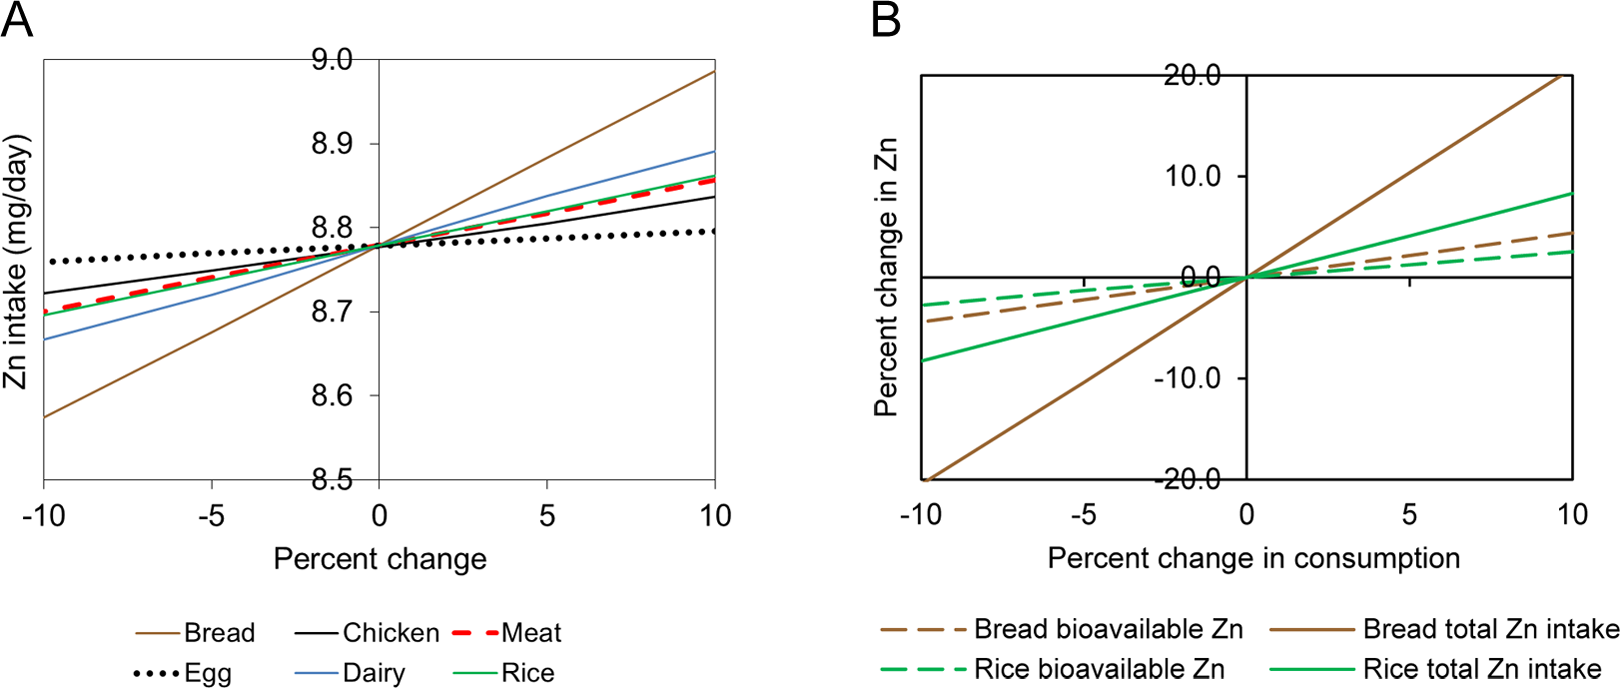
(A) Sensitivity of zinc intake to variations in the consumption of different food groups. (B) Changes in the intake of total and bioavailable zinc as a function of bread and rice consumption.
The effects of propagating the uncertainty in zinc concentration on zinc intake are shown in Figure 3. There was a close agreement between the cumulative distributions of measured and predicted medians of zinc and phytic acid intakes. The average difference between predicted and measured medians was around 3% for zinc and 15% for phytic acid. From these results we concluded that 500 Latin hypercube simulations were sufficient to produce adequate simulations of dietary zinc and phytic acid intakes. The narrow 95PPU bands bracketing the experimental data show that uncertainty due to analytical errors and true variability in the zinc and phytic acid concentrations of the consumed food was small.
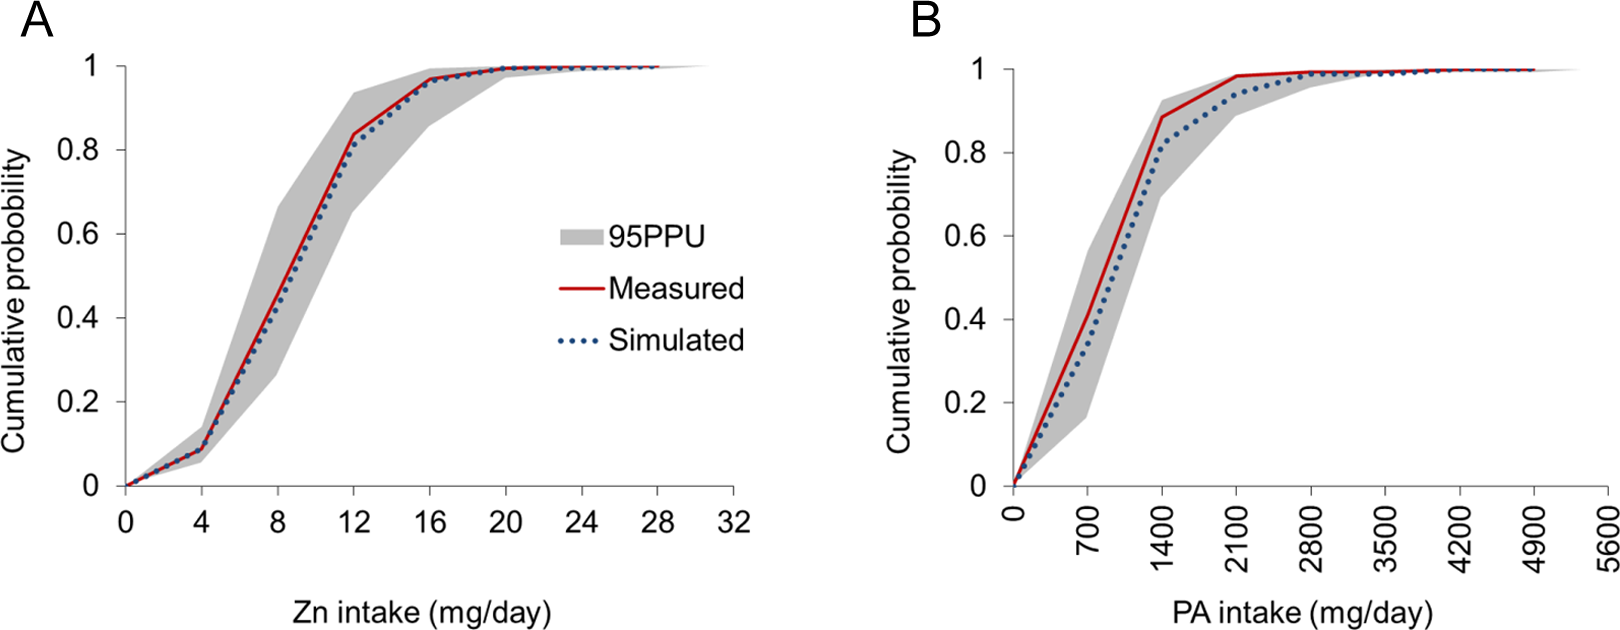
Measured and simulated zinc intake (A) and phytic acid intake (B) in the study population. The shaded region shows the 95% prediction uncertainty (95PPU) interval.
As can be seen in Figure 4A, the proportion of bioavailable zinc averaged between one-half and one-third of total zinc intake in the various population groups. The ratio between bioavailable and total zinc intake showed a decreasing trend with increasing age, in line with an increasing average phytic acid: zinc molar ratio (Figure 4B). The upper uncertainty bounds of the phytic acid: zinc molar ratios were below the threshold of 18:1 in all age/sex groups except that from 14 to 19 years. These results reflect a predominance of mixed diets (defined in Table 1) in most population groups. The lower uncertainty level of the total zinc intake is far above the EAR thresholds for all age/sex groups except for males and females aged 14 to 18 years and males aged 19 years or older, for whom the EAR is within the uncertainty band. Figure 4B shows that these age/sex groups also have the highest risk of zinc deficiency. The rate of zinc deficiency across all age/sex groups was 31% (95% CI, 28% to 35%). The highest rate was found among adult males and the lowest among children aged 9 to 14, who had no zinc deficiency. The latter was the only group for which the estimated prevalence of inadequate zinc intake did not exceed the 25% threshold considered critical for public health concern. 9
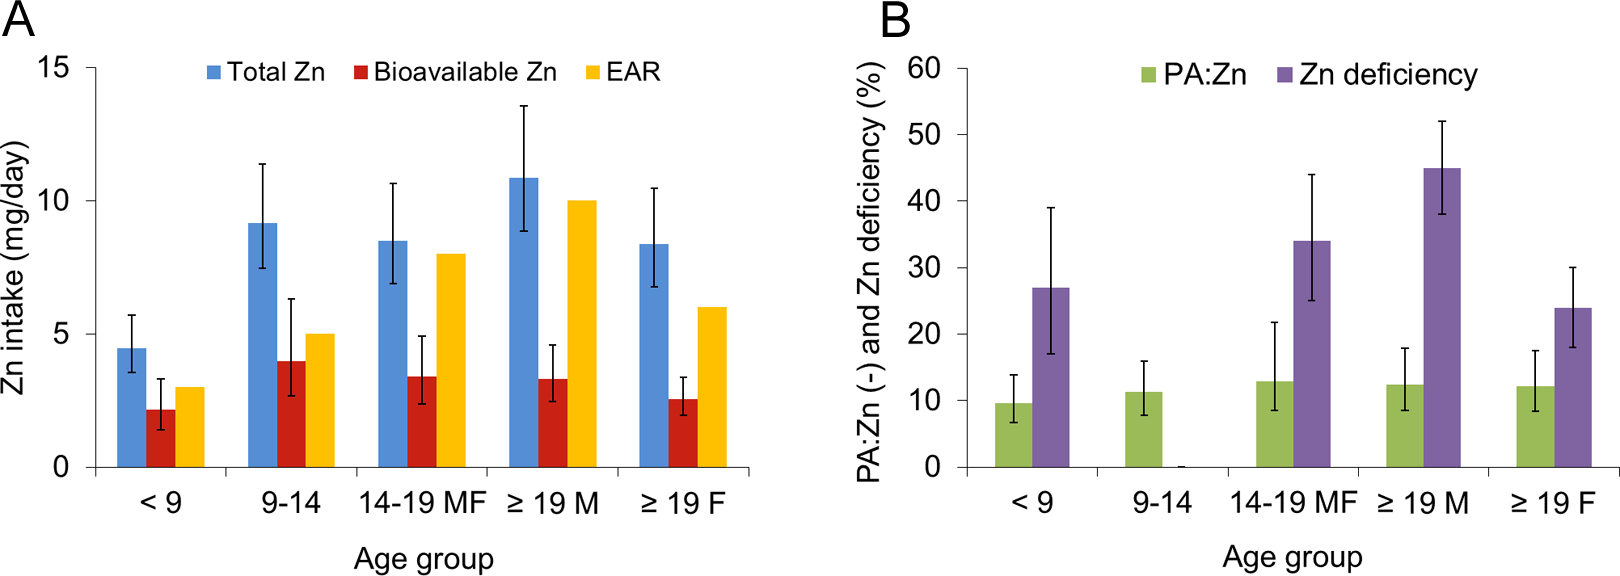
Median values and ranges (intervals between 2.5% and 97.5% quantiles) of (A) individual daily intake of total and bioavailable zinc and the Estimated Average Requirements (EAR) of different age/sex groups, and (B) average phytic acid: zinc (PA: Zn) molar ratio and prevalence of zinc deficiency in the different age/sex groups of the study population, based on 500 Monte Carlo simulation runs to account for uncertainty in the zinc concentration of the consumed food items. The phytic acid: zinc ratios for different age groups from left to right are 9.6%, 11.3%, 12.9%, 12.4%, and 12.2%.
Scenario Analysis
The scenario analysis shows that if the present trend in dietary changes continued (scenario B), the risk of zinc deficiency in the study population would decrease to below 25% after 12 years (Figure 5); however, it would take about 60 years to reach 2.5%. If consumption of dairy and bread (instead of rice and poultry) increased, as in scenario D1, the time required for the average population risk of zinc deficiency to fall to 25% would decrease to 7 years, and it would take up to 15 years to reduce it to 20% (Figure 5).
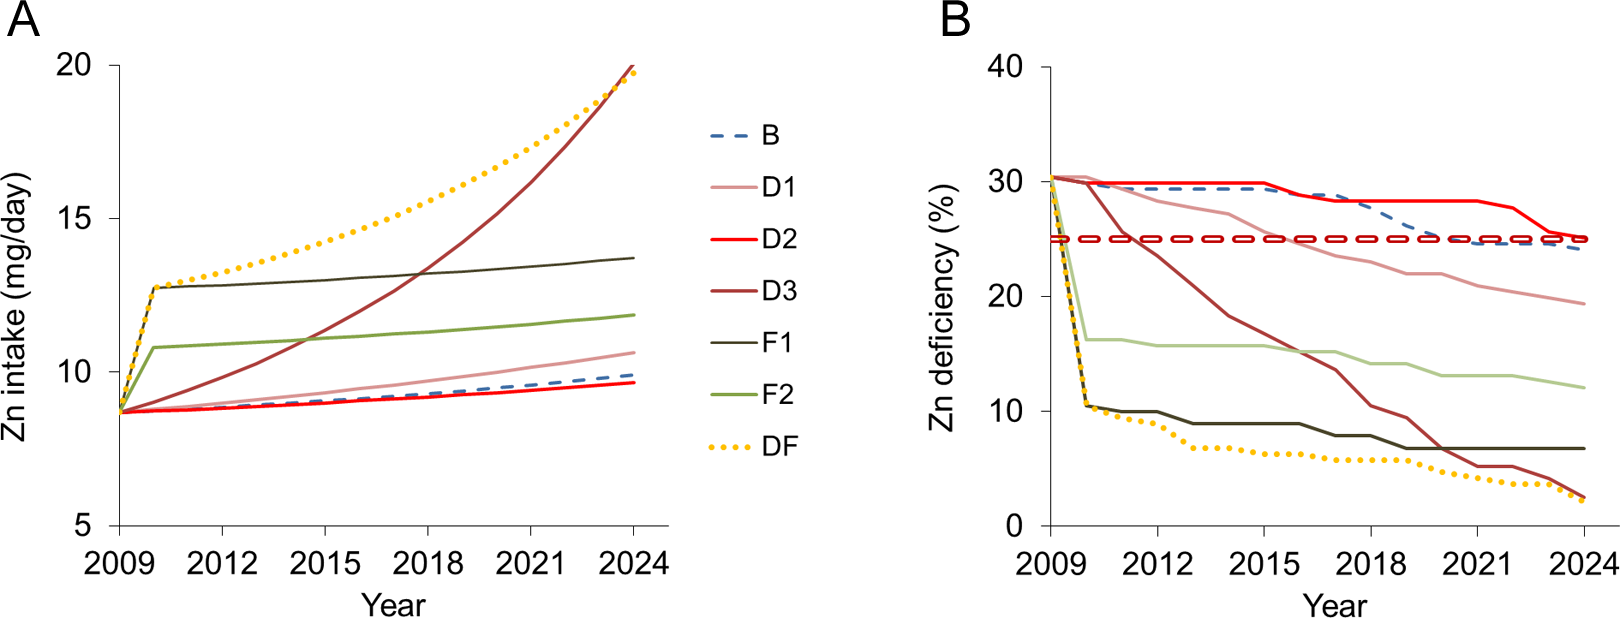
Predicted total zinc intake (A) and zinc deficiency (B) in the study population over the 15-year period from 2009 to 2024 for the food consumption scenarios defined in Table 3. The 25% line indicates the threshold for inadequate zinc intake considered a public health concern by the International Zinc Consultative Group (IZiNCG). 9
The important role of bread as a dietary zinc source is particularly well illustrated by scenario D2. In this scenario, an increase in red meat and rice consumption does not compensate for the decrease in bread and poultry consumption. In scenario D3, we found that the consumption of red meat and dairy had to increase by 12% and 14%, respectively, to reach the EARs of 97.5% of the population.
Implementing zinc fortification of wheat flour or biofortification of wheat grains immediately decreased the risk of zinc deficiency in the study population from 30% to 10% in scenarios F1 and DF and to 16% in scenario F2. Thereafter, zinc intake rates would further increase gradually according to the assumed rates of changes in the diets. If the past trends continued, as assumed in scenarios F1 and F2, the risk of zinc deficiency would decrease to 7% and 12% within 15 years, respectively. The DF scenario illustrates that by implementing fortification, a 2.5% prevalence of inadequate zinc intake could be reached within 15 years, with substantially lower increase in red meat consumption than in scenario D3.
Interventions such as zinc fortification of flour have to take into account that excessive rates of zinc intake can lead to adverse health effects. Figure 6 shows that the zinc intake rates predicted to be reached within 15 years are well below the critical limits for adolescents and adults in all scenarios. For the age group from 9 to 14 years, the range within-group variability (including uncertainty in food zinc concentration) extends beyond all three upper limits of zinc intake for scenarios D3 and DF, whereas for younger children, only the WHO limit of safe zinc intake would not be exceeded.
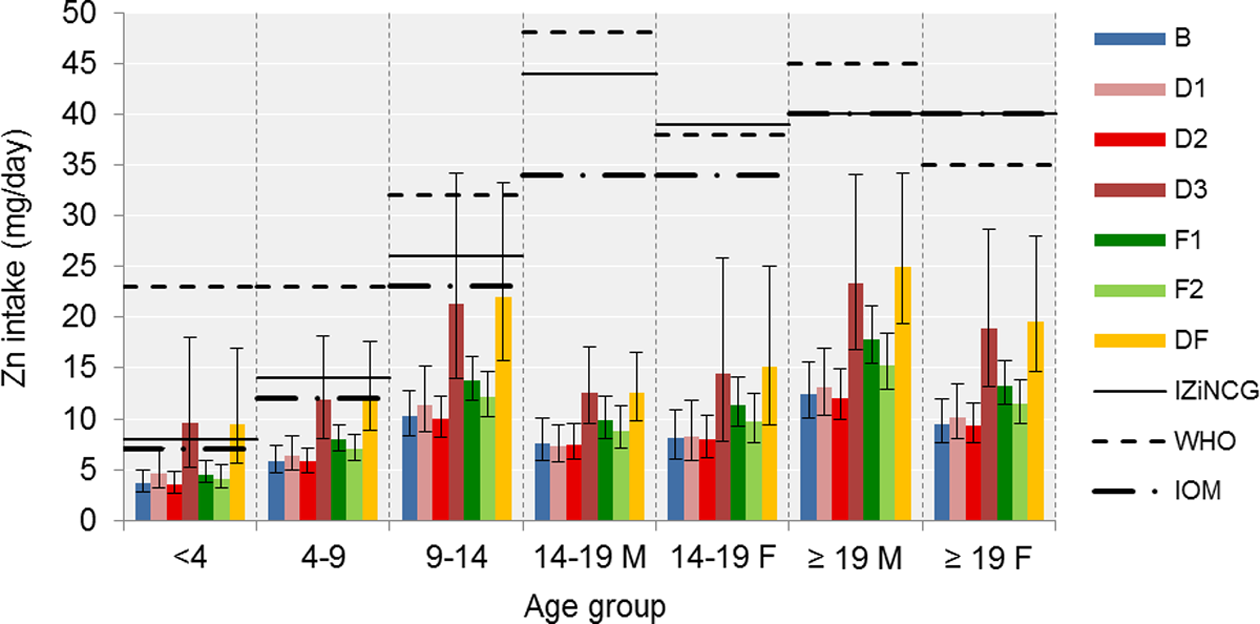
Expected zinc intake rates (group means and 95% ranges of within-group variability) in the different age/sex groups distinguished in the study population after 15 years for the seven scenarios defined in Table 3. Also shown are the upper limits of safe intakes by the International Zinc Consultative Group (IZiNCG), the Institute of Medicine (IOM), and the World Health Organization (WHO).
Discussion and Conclusions
Data published by the FAO 28 show that per capita consumption of poultry, fish, and fruits and vegetables has strongly increased for the whole country of Iran in recent years, while consumption of red meat, dairy products, and rice has remained rather stable, and consumption of wheat, although it is still the main staple, has started to decrease over the past decade. Based on the zinc concentrations found in these items in our survey, we estimated that these changes have led to an increase in average daily per capita zinc intake from around 7 to 12 mg.
Baseline scenario B shows that the current trend of consumption is barely sufficient to decrease the prevalence of inadequate zinc intake to below 25%. Consumption of dairy products has remained rather stable and has even shifted to a decreasing pattern in some regions during the past few years, especially among children and adolescents. 29 Scenario D1 reflects a change toward a healthier consumption pattern associated with higher intakes of dairy. 29 Because dairy products are still popular among Iranians, the assumption of a 5% increase is quite feasible. The increased consumption of bread shows that its high phytic acid content would not impair the zinc status of the population if they ate more bread in the future.
Scenario D2 showed a situation in which meat consumption shifted from white to red and the consumption of staple food from bread to rice. Such a trend could result from increased economic wealth and prosperity of the population and promotion of cattle husbandry and beef production in Iran. However, this scenario did not contribute to the zinc intake of the population and did not effectively reduce zinc deficiency as compared with baseline.
Scenario D3 indicated that sharp increases had to be made in the consumption of red meat and dairy in order to bring zinc deficiency to the low level of less than 2.5% in the population. However, this scenario proved to be rather unrealistic, because increasing red meat consumption by 12% each year is neither affordable nor healthy for most households. Considering an increase in white meat instead of red meat is also unrealistic, for two reasons. First, the sensitivity analysis shows that zinc intake is less sensitive to white than to red meat, meaning that consumption of white meat has to increase by about 35% to achieve the same level of zinc adequacy as that obtained with red meat. Second, consumption of white meat has been increasing sharply over the past years and there may not be more room for further increase. Considering the results of the sensitivity analysis, these scenarios confirmed that despite its lower zinc concentration, bread has a larger effect on total zinc intake than red meat because of its higher consumption, followed by dairy and rice. Bread is consumed in stable and predictable amounts by a large proportion of the population.
Considering that wheat had a significant effect on the intake of zinc, fortification of flour was the most practical and effective intervention to achieve a rapid and substantial improvement in the zinc status of the Iranian population. Following WHO guidelines for food fortification 19,30 , the fortificant would be added to the flour, which is centrally produced, processed, and then distributed to the bakeries via local distribution networks, as in our study sites. Thus it is accessible to most of the population living in different parts of the country. Conventional fortification could also be supplemented or even replaced by biofortification. This is another way to enrich the grains of staple crops, such as wheat and rice, with essential micronutrient elements, such as zinc, using genetic (e.g., breeding) or agronomic (e.g., fertilization) methods. 31 -35 Furthermore, using agricultural biodiversity to reinforce dietary diversity can help situate biofortification within the larger context of sustainable food-based approaches. 36
When discussing the scenarios analyzed here, it should be noted that they were chosen to reflect Iranian habitual diets and the results of possible future trends, and also to illustrate the potential use of such models. But independently of the choice of scenarios, there are some general assumptions implicitly underlying the approach taken here that require discussion.
The first of these assumptions is that the food consumption data collected in the survey are indicative of the average zinc intake rates in the study population over longer periods of time. This is justified because the zinc status of the human population, and thus the risk of zinc deficiency, do not vary substantially over periods of a few days or weeks. The fact that the average food consumption rates of our study population were comparable to those published by FAO for the entire Iranian population indicates that the 3-day-weighed-food records also gave a good indication of the foods consumed on average by the study population over longer time periods.
Secondly, we assume that the same trends in food consumption equally apply to all subgroups in the population, regardless of social or economic status. For example, meat consumption may increase more rapidly among affluent sectors of society, while people in low-income groups may consume more bread. However, in the absence of more detailed data, this is considered a plausible first approach. But a more detailed study of recent trends in the dietary habits of the Iranian population and their variability among population groups, accounting for the influence of socioeconomic and other factors, would certainly be a warranted sequel to this study.
This paper is a contribution to the growing literature that considers the challenges of zinc deficiency to public health. It illustrates how the model can be used to predict the outcome of different scenarios of food consumption trends and interventions in combating zinc deficiency. Consideration of parameter uncertainty, as also concluded by others 15 , is crucial, as demonstrated by the wide ranges of uncertainty in the estimates of the risk of zinc deficiency in the study population. The procedure developed here is generic and can be applied to any location and any element to identify the implications of different policies before their implementation.
Footnotes
Authors’ Contributions
Nazanin Abbaspour carried out the experiment and wrote the paper; Manouchehr Amini helped with the statistical analysis; Richard Hurrell and Rainer Schulin guided the project and edited the paper.
Declaration of Conflicting Interests
The author(s) declared no potential conflicts of interest with respect to the research, authorship, and/or publication of this article.
Funding
The author(s) disclosed receipt of the following financial support for the research, authorship, and/or publication of this article: This study was supported by the ETH North South Centre through a program funded by the Swiss Federal Agency of Development and Cooperation (SDC).