
Abstract
Background:
Amid mounting pressure to reduce health care spending, strategies for identifying and eliminating unwarranted variation in costs have garnered significant attention. Previous studies have characterized intersurgeon variation in costs for common orthopaedic procedures, but such variation remains unexplored in the context of hip arthroscopic surgery.
Purpose:
To (1) characterize variation in the cost of hip arthroscopic surgery between surgeons using time-driven activity-based costing (TDABC) and (2) identify patient characteristics, intraoperative findings, and operative procedures underlying such intersurgeon variation in costs.
Study Design:
Cohort study; Level of evidence, 3.
Methods:
Employing TDABC, the authors determined the intraoperative cost of 890 outpatient hip arthroscopic surgery cases performed by 5 surgeons at 4 surgery centers from 2015 to 2022. All costs were calculated in United States dollars. Costs were normalized to protect the confidentiality of internal hospital cost data. Surgeon-specific mean costs were calculated with and without adjustment for patient characteristics, surgical personnel, operative factors, and surgery center. Finally, to elucidate the sources of surgeon-driven cost variation, the authors estimated the proportion of variation attributable to different cost subcategories, including labor, implant/allograft, and other supply costs.
Results:
The intraoperative cost per patient ranged from 38.2 to 212.8 normalized cost units (mean, 100.0 ± 26.5), with a 1.6-fold variation in the mean cost between the highest and lowest cost surgeons. Operating surgeon alone explained 53.4% of the observed variation in costs. Controlling for case-specific features significantly improved the explanatory power to 91.8% (P < .001), but the adjusted variation in costs between surgeons remained essentially unchanged (decreased by <3%). Each of the 5 surgeons generated costs that deviated significantly from those predicted based on case-specific factors, with mean surgeon deviations ranging from −5.0% to 21.8% (P < .001 for all). Drivers of cost variation differed substantially between surgeons but generally stemmed from labor or other supply costs rather than implant/allograft costs.
Conclusion:
The cost of outpatient hip arthroscopic surgery varied widely between surgeons; the cause of this deviation was multifactorial and surgeon specific. While within-surgeon cost variation was effectively explained by patient and operative characteristics, most between-surgeon variability remained unexplained by observable factors. These insights may support individual surgeons in cost reduction efforts and, more importantly, may enable the alignment of reimbursement rates with costs.
Keywords
As health care costs continue to rise without simultaneous improvements in quality, value-based health care has emerged as a promising framework for improving patient outcomes, reducing costs, and alleviating inequities.30,46,47 This health care delivery model centers around maximizing value, defined as health outcomes relative to costs, and has received growing attention within orthopaedics.7,8,42 One compelling strategy for advancing this goal is identifying and eliminating unwarranted variation in costs between surgeons and organizations. For example, several previous studies have identified significant intersurgeon variation in costs for common orthopaedic procedures, revealing opportunities to refine care pathways, control costs, and enhance value.20,29,52
Despite the growing use of hip arthroscopic surgery for treating labral tears and femoroacetabular impingement, factors underlying variation in its cost remain poorly understood.18,59 While some variation in the cost of hip arthroscopic surgery is justified based on patient-specific factors, case complexity, and surgeon preference, other variation is likely unnecessary and could be reduced without compromising patient outcomes.2,22,56 Unfortunately, most surgeons currently receive no financial data to inform clinical decision-making, hindering efforts to improve value. 44 Sharing operating room costs with surgeons on a patient-specific basis could catalyze important discussions regarding which cost drivers are clinically justified, promoting value-based care.58,60 Furthermore, as providers are increasingly held accountable for the financial implications of their clinical decisions, improved cost transparency would help surgeons navigate evolving bundled reimbursement structures.
Insights arising from economic analyses are only as valid as the cost estimates from which they are derived, but many studies have used flawed costing systems based on hospital reimbursements, relative value units, and cost-to-charge ratios.25,27 Addressing the limitations of traditional costing methodologies, time-driven activity-based costing (TDABC) is an accurate accounting method that determines costs by integrating resource expenditures with per-unit costs on a case-specific basis.26,31,32,39 Thus, the purposes of this study were to (1) characterize variation in the cost of hip arthroscopic surgery between surgeons using TDABC and (2) identify patient characteristics, intraoperative findings, and operative procedures underlying such intersurgeon variation in costs. We hypothesized that there would be wide variation (>1.5-fold) in the mean cost of hip arthroscopic surgery between surgeons and that more than 50% of this intersurgeon variation would be explained by differences in operative technique and patient selection.
Methods
Study Population and Study Design
After obtaining institutional review board approval (Mass General Brigham No. 2022P002843), we used CareMeasurement software (Avant-garde Health) to retrospectively review all outpatient hip arthroscopic surgery cases performed within a single large urban health care system between June 2015 and November 2022. To ensure a more homogeneous sample, cases were included in our analysis if the patient was aged ≥18 years, underwent hip arthroscopic surgery to address labral tears, and received care from a surgeon who performed ≥20 hip arthroscopic surgery cases during the study period. This arbitrary cutoff of 20 surgical procedures was employed to avoid overfitting and ensure statistical robustness while capturing as much intersurgeon variation as possible. Of note, this cutoff resulted in the exclusion of 2 surgeons who performed 5 and 6 surgical procedures, respectively, over the study period.3,37 The characteristics and annual case volumes of included surgeons are presented in Appendix Table A1 (available in the online version of this article). Cases were excluded if they contained inconsistent time stamps (eg, “wheeled out of operating room” before “wound closure”) or clear anomalies in supply costs.
Data Collection
Patient characteristics and surgical details were manually extracted from electronic health records. Patient characteristics included age, body mass index (BMI), sex, race, ethnicity, and American Society of Anesthesiologists (ASA) classification. Surgical details included previous hip surgery, intraoperative findings (labral tear size, Beck classification of labral damage), procedures performed (osteoplasty type, labral procedure, capsular management, etc), surgeon, and surgery center. 4 Case-specific, staff-entered time stamps and consumable purchase prices were extracted from electronic health records using CareMeasurement software. Per-minute labor costs (ie, capacity cost rates) were determined on a personnel-specific basis by Avant-garde Health using institutional salary averages.
Time-Driven Activity-Based Costing
TDABC was performed as described previously, 11 informed by guidelines established by Kaplan and Anderson 26 and other experts.12,13,28,39,53 Fundamentally, the TDABC methodology calculates costs by measuring the duration of each step of the care pathway, multiplying these durations by the per-unit cost of the associated activity, and summing these labor costs with supply costs to determine the total cost. Thus, the first step in conducting this analysis is constructing process maps that capture relevant steps of the care pathway. Given our goal of exploring variation in costs between surgeons, we focused our analysis on intraoperative costs (see Appendix Table A2, available online), as they represent a significant proportion of total procedure costs (ie, ≥91%) and are directly influenced by surgeon decision-making and technique.1,11
Process maps were informed by interviews with relevant clinical and administrative personnel, consultations with experts in the field of health technology assessment at Avant-garde Health, and direct observation of a representative sample of surgical cases by the study team (M.C.D. and N.J.C.). Next, the duration of each step of the process map was calculated using case-specific time stamps and subsequently multiplied by capacity cost rates to generate personnel-specific labor costs on a case-specific basis. These individual labor costs were then summed to generate total labor costs. Similarly, the quantity and purchase prices of consumables (eg, implants, sutures, dressings) were aggregated to calculate total supply costs. Labor and supply costs were combined to calculate total costs on a patient-specific basis. Cases with total costs in the upper (≥95th) and lower (≤5th) percentiles were manually reviewed for anomalies in time stamps and supply costs; cases demonstrating unreconcilable discrepancies were excluded.
Borrowing from previous literature, we focused our analysis on direct personnel labor and supply costs, as assigning indirect (eg, human resources, billing) and hospital structural (eg, rent, utilities, equipment) costs with the same degree of granularity would entail extensive modeling and introduce a significant number of confounders.14,15,38 Moreover, differences in indirect and structural costs are unlikely to vary between surgeons, and any measured variation would likely be driven by randomness rather than surgeon preference and technique; thus, we elected to omit these indirect costs from our analysis.
Statistical Analysis
All costs were calculated in United States dollars. To protect the confidentiality of internal cost data, costs were then multiplied by an undisclosed constant to set the study mean for total costs to 100; this normalization preserved relative values and had no impact on subsequent statistical analysis. Descriptive statistics for continuous and categorical variables were reported as means with standard deviations and frequencies with percentages, respectively. Comparisons between surgeons were performed using the chi-square or Fisher exact test for categorical variables and an unpaired t test or 1-way analysis of variance for continuous variables, as appropriate. For comparisons of cost variables between surgeons, P values were adjusted for multiple comparisons using the Holm-Bonferroni method to control for family-wise errors. 21 Associations between operative volume and costs were assessed using the Pearson correlation coefficient (r).
Multivariable modeling was performed to calculate the adjusted mean cost per physician, controlling for patient characteristics, surgical personnel, operative factors, and surgery center. Specifically, linear mixed-effects models were used to account for the nested structure of cases within surgeons and surgery centers.9,55 First, an “empty” model containing only the surgeon (as a random intercept) and no other predictors was employed to quantify the proportion of cost variation attributable to the surgeon alone. Next, to isolate the relationship between surgeon and cost, 2 additional models were used: one including all relevant control variables plus the surgeon and one otherwise identical model lacking the surgeon. The difference in cost estimates generated by these models represents surgeon-driven cost variation that is not explained by procedural or patient factors. For example, if the model not including the surgeon estimates a given case to cost 110 units (based on patient age, sex, procedure type, etc) and the model including the surgeon estimates the same case to cost 120 units, the surgeon associated with that case is estimated to cost 10 units “above average.” This comparison was repeated for all cases, and adjusted differences were averaged by the surgeon, yielding an adjusted mean difference for each surgeon (relative to the “average” surgeon in this study). Finally, to further clarify the source of intersurgeon cost variation, this same approach was repeated for each of the 4 cost subcategories (ie, labor costs, total supply costs, implant/allograft costs, and other supply costs). The proportion of cost variation attributable to each cost subcategory was presented for each surgeon as a percentage of his or her total adjusted mean difference. For example, continuing the hypothetical example from above in which a given surgeon generates a cost of 10 units “above average” for a specific case, consider the scenario in which 7 of these cost units are driven by a longer procedure time (ie, labor costs) and 3 of these cost units stem from an additional suture anchor (ie, supply costs). This suggests that 70% of the cost deviation for this case is driven by labor costs while 30% is driven by supply costs. By repeating this calculation for all cases and averaging percentages by surgeon, the proportion of cost variation attributable to each cost subcategory can be determined for each surgeon. Of note, a negative percentage suggests that a specific cost subcategory deviates in a direction opposite than that of the adjusted mean difference (eg, a surgeon may generate higher than average total costs, attributable to significantly elevated labor costs but relatively low supply costs; the supply cost subcategory percentage would be negative in this case, while the labor cost subcategory percentage would be >100%). P values for fixed effects in these multivariable mixed-effects models were not adjusted for multiple comparisons, as these analyses were performed to estimate adjusted effects while controlling for confounders rather than to evaluate multiple independent hypotheses. In this context, P values were interpreted conditionally within the model, with the primary focus placed on effect sizes, confidence intervals, and model fit metrics.9,16,55 Lastly, given that primary analyses revealed surgeon D to be a relative outlier regarding operative time, sensitivity analyses were performed to characterize the extent of intersurgeon cost variation in the absence of surgeon D.
Model variables were selected based on unadjusted analyses, previous literature, and clinical relevance. Capsular management and surgical volume were not included because of multicollinearity/singularities. 55 Marginal (R2m) and conditional (R2c) coefficients of determination were calculated using the method of Nakagawa et al. 40 All analyses were performed using R (Version 4.2.1), and P < .05 was considered to be significant.
Results
Participant Characteristics
Of the 1036 patients screened for this study, 890 met inclusion criteria. Cases were performed by 5 surgeons (labeled A-E) operating at 4 surgery centers (labeled 1-4) within a single large urban health care system (Figure 1). This sample included 515 women (57.9%) and 375 men (42.1%) with a mean age of 37.1 ± 12.7 years and a mean BMI of 26.6 ± 4.7 kg/m2. Most patients were White (90.6%), not Hispanic (93.4%), and ASA class ≤2 (96.2%). Additional patient characteristics, intraoperative findings, and operative procedures are presented in Table 1; these factors, stratified by surgeon, are reported in Appendix Tables A3 and A4 (available online).

Flowchart detailing the patient selection process.
Characteristics of Study Population (n = 890) a

Data are presented as mean ± SD or No. (%). ASA, American Society of Anesthesiologists; BMAC, bone marrow aspirate concentrate; BMI, body mass index.
Cost Composition and Intersurgeon Variation
The normalized intraoperative cost per patient ranged from 38.2 to 212.8 (mean, 100.0 ± 26.5), with a 1.9-fold variation in costs between patients in the 10th and 90th percentiles. On average, labor costs accounted for 46.8% of intraoperative costs, and supply costs comprised the remaining 53.2% (17.2% implant/allograft costs; 36.1% other/disposables costs). Additionally, we identified a 1.6-fold variation in the mean intraoperative cost between the highest and lowest cost surgeons, with 2.2- and 1.5-fold variations in mean labor and supply costs, respectively (Table 2). Of note, the extent of intersurgeon cost variation remained robust on sensitivity analyses with the omission of surgeon D, a relative outlier regarding operative time (Appendix A1). There was no significant correlation between surgeon operative volume and costs (−0.28 [95% CI, −0.93 to 0.80]; P = .65). We found minimal variation in the mean cost of individual suture anchors between surgeons (1.2-fold) and moderate variation in the mean number of suture anchors used by labral tear size (1.6-fold) (P < .001 for both) (Table 3). Finally, the “empty” model containing only the surgeon (and no other predictors) revealed that operating surgeon alone explained 53.4% of the observed variation in costs (conditional R2 = 0.534).
Normalized Cost and Time for Outpatient Hip Arthroscopic Surgery a
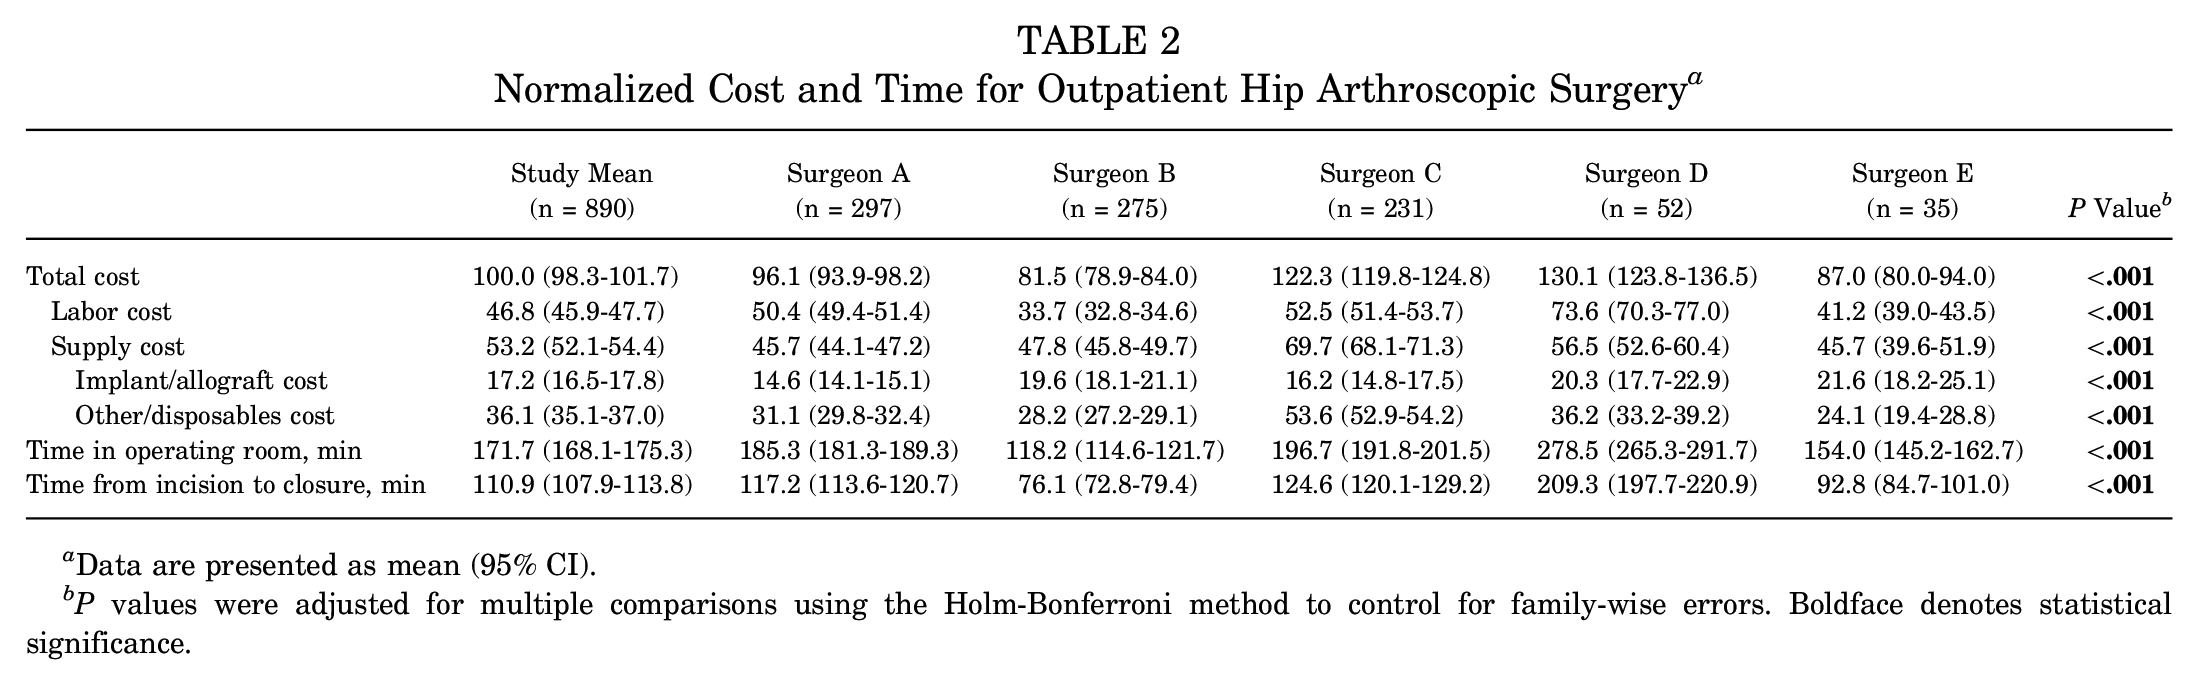
Data are presented as mean (95% CI).
P values were adjusted for multiple comparisons using the Holm-Bonferroni method to control for family-wise errors. Boldface denotes statistical significance.
Normalized Cost for Hip Arthroscopic Surgery Care Pathway a

Data are presented as mean (95% CI).
Number of anchors per hour (ie, 30 degrees) labral tear size.
Adjusted Cost Analyses
Multivariable mixed-effects modeling was implemented to elucidate the relationship between surgeon and intraoperative costs while adjusting for variables shown to drive costs on unadjusted analyses (see Appendix Table A5, available online). The final models included age, sex, Beck classification of labral damage, year of surgery, provider team (eg, resident, fellow, physician assistant/associate), osteoplasty type, labral procedure, and bone marrow aspirate concentrate or microfracture as fixed effects and surgery center and operating surgeon (if applicable) as random effects. Capsular management was not included because of multicollinearity/singularities.
Multivariable analyses revealed that adjusting for patient characteristics, surgical personnel, operative factors, and surgery center significantly improved the model's explanatory power to 91.8% (P < .001); however, the adjusted variation in costs between surgeons remained essentially unchanged from unadjusted analyses (decreased by <0.3%). Each of the 5 surgeons generated costs that deviated significantly from those predicted based on patient characteristics, surgical personnel, operative factors, and surgery center, with mean surgeon-specific deviations ranging from −5.0% to 21.8% (P < .001 for all) (Table 4). Further analysis of intersurgeon cost variation among the 4 cost subcategories (labor costs, total supply costs, implant/allograft costs, and other supply costs) demonstrated that the source of this variation differed across surgeons (Table 5). For example, surgeon A's below average costs were primarily driven by low supply (76.4% of variation) versus labor (23.9%) costs. In contrast, surgeon B's below average costs were driven entirely by labor costs (115.8%), as this surgeon's adjusted supply costs were actually higher than average (−15.3%). Interestingly, implant/allograft costs did not drive cost variation for most surgeons, as only −8.0% to 7.7% of cost variation was attributable to this subcategory for surgeons A to D. Notably, this trend did not hold for the lowest volume surgeon (E), for whom implants/allografts accounted for −37.2% of variation (ie, surgeon E's implant/allograft allocation was associated with 37.2% higher costs than those of other surgeons, after adjusting for several case-specific factors).
Adjusted Intraoperative Cost per Physician Relative to “Average” Surgeon a

Data are presented as mean (95% CI).
Relative Contributions of Labor and Supply Costs to Surgeon-Specific Cost Variation
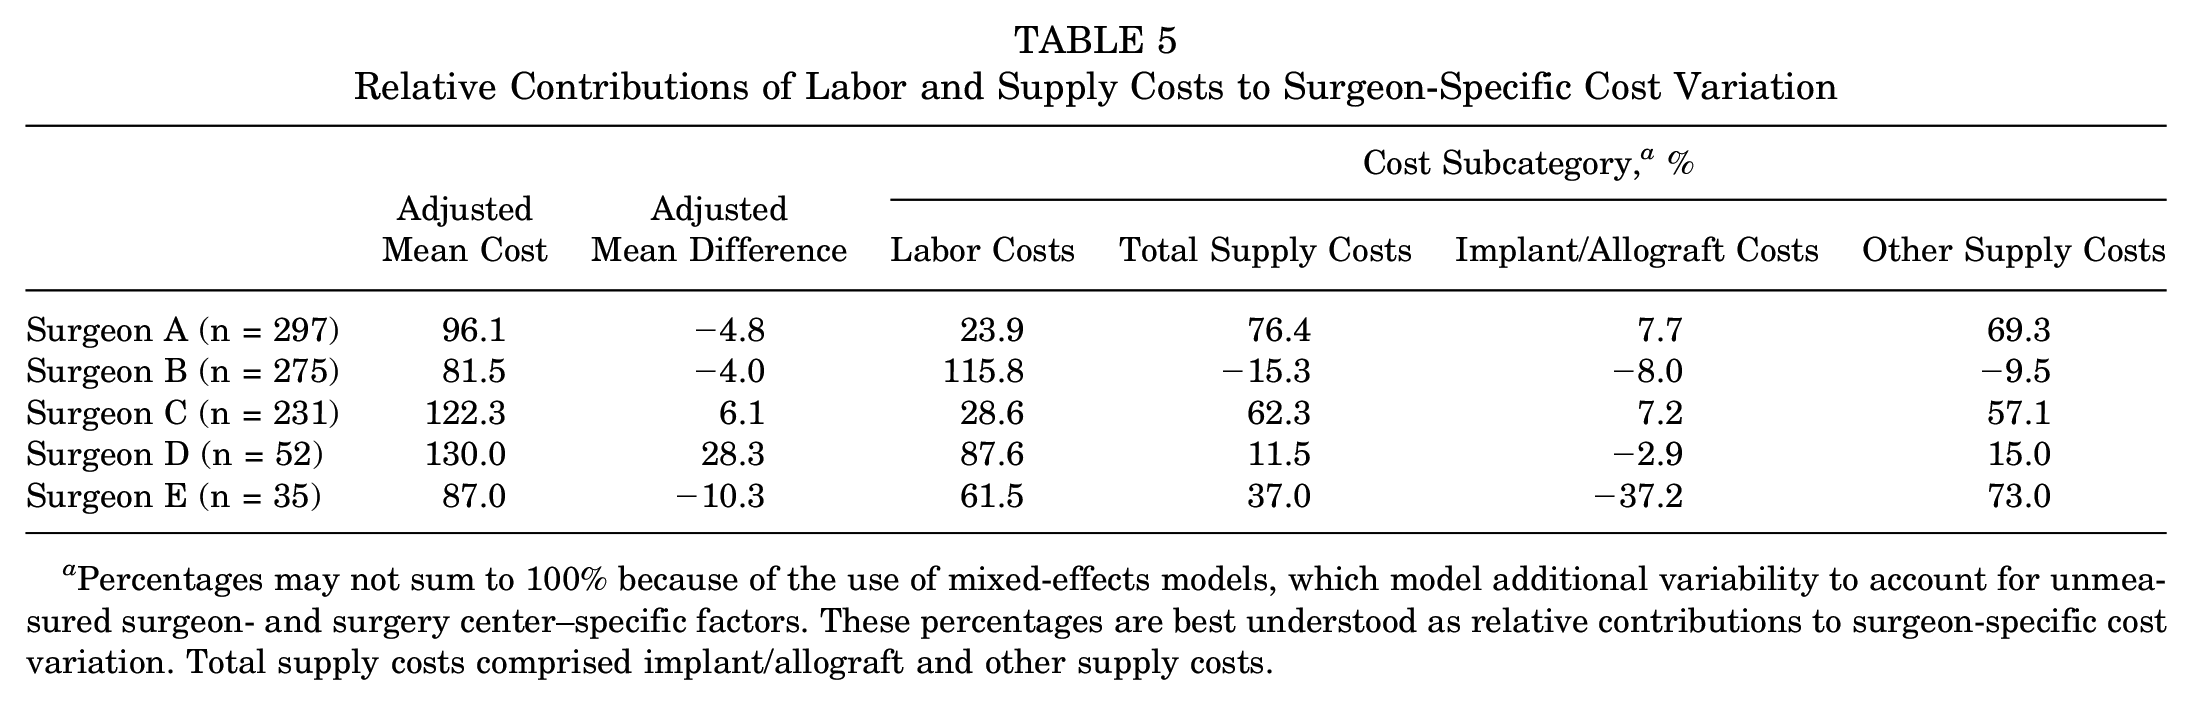
Percentages may not sum to 100% because of the use of mixed-effects models, which model additional variability to account for unmeasured surgeon- and surgery center–specific factors. These percentages are best understood as relative contributions to surgeon-specific cost variation. Total supply costs comprised implant/allograft and other supply costs.
Discussion
To our knowledge, this is the first study to employ the accurate TDABC methodology to characterize intersurgeon variation in the cost of outpatient hip arthroscopic surgery for symptomatic labral tears. We identified a 1.6-fold variation in the mean intraoperative cost between the highest and lowest cost surgeons, with 2.2- and 1.5-fold variations in mean labor and supply costs, respectively. Interestingly, although adjusting for patient characteristics, surgical personnel, operative factors, and surgery center effectively explained within-surgeon cost variation, most between-surgeon cost variation remained unexplained by these observable variables. These findings differ from our study hypothesis and have several notable implications on risk adjustment, cost reduction efforts, and bundled reimbursement structures.
Although the application of TDABC is growing within orthopaedics, its use remains limited in the context of hip arthroscopic surgery. In a recent TDABC analysis including 151 patients, Allen et al 1 found that consumables made up the majority of total outpatient hip arthroscopic surgery costs (61%), with surgical personnel costs accounting for 30% and medications and perioperative personnel costs comprising the remaining 9%. Of note, all procedures were performed by a single high-volume surgeon. Although this methodological decision likely improved the internal validity of the study findings, it remains unclear if the same variables drive costs for other physicians. In a multisurgeon TDABC analysis including nearly 900 patients, Dean et al 11 found supply costs to comprise a slightly lower proportion of total costs (49%), instead identifying labor costs as the largest generator of costs (51%). Moreover, they revealed operating surgeon to explain 33% of variation in total costs; however, an investigation into the cause of this intersurgeon variation was beyond the scope of this study.
Given the wide range of surgical techniques, patient selection criteria, and annual case volumes in the field of hip arthroscopic surgery, the present TDABC analysis specifically sought to characterize if such factors had direct implications on costs, uncovering 3 key findings pertinent to this goal. First, we validated that each of these factors did indeed vary between surgeons; even within a single integrated health care system, the 5 analyzed surgeons differed significantly across patients treated (eg, age, BMI, sex), procedures performed (eg, osteoplasty type, labral procedure, capsular management), and surgical volume (ie, 8.5-fold change between highest and lowest volume surgeons). Although research evaluating indications and techniques among hip arthroscopic surgery specialists remains limited, these findings align with recent work by McGovern et al, 36 which identified intersurgeon variation in the allocation of suture anchors by labral tear size. Second, we found that intraoperative costs were significantly different between surgeons, revealing a 1.6-fold variation in the mean intraoperative cost between the highest and lowest cost surgeons. This result is consistent with our first finding; given that surgeons display differences in caseloads and procedures, it follows that they also generate significantly different costs. Finally, although adjusting for patient characteristics, surgical personnel, operative factors, and surgery center explained variation in costs for a given surgeon, these factors surprisingly did not account for the wide variation in costs between surgeons. Thus, the persisting disparity in costs between surgeons reflects surgeon-specific attributes or characteristics beyond the several relevant variables analyzed in the present analysis. This finding is strikingly similar to that of a recent TDABC analysis evaluating drivers of the total cost in arthroscopic rotator cuff repair. 5 Specifically, Bernstein et al 5 identified “surgeon idiosyncrasy” as a major cost driver, coining this term as “something a surgeon does or does not do that impacts total cost and is not controlled for in the current analysis.” The present study corroborates this theory, suggesting that “surgeon idiosyncrasy” is a major cost driver not only for rotator cuff repair but also for hip arthroscopic surgery and likely many other orthopaedic procedures. Future research should aim to characterize the precise cause of these idiosyncrasies so that they can be rigorously scrutinized and potentially addressed, if deemed necessary based on current evidence-based clinical guidelines.
Interestingly, while the proportion of intersurgeon cost variation attributable to each cost subcategory (eg, labor costs, total supply costs, implant/allograft costs, and other supply costs) differed across surgeons, implant/allograft costs contributed the least to this variation. This unexpected finding may be explained by 2 major factors. First, in contrast to surgical procedures such as total joint arthroplasty in which the implant may comprise up to 50% of total inpatient costs, implants (ie, suture anchors) comprise only 15% to 18% of total costs in the hip arthroscopic surgery care pathway.1,11,35 Second, the present study revealed relatively minimal intersurgeon variation in the normalized anchor price, number of suture anchors, or anchor density between surgeons in the present study (see Table 3). Taken together, these factors highlight that implants represent a relatively small proportion of total hip arthroscopic surgery costs, and the limited variation in anchor costs or allocation between surgeons contributes to their minimal role in overall cost variation. Of note, the minimal variation in normalized anchor price may partially stem from our single large urban health care system, and intersurgeon variation in anchor prices is likely greater across all hospitals nationwide. 17 Nonetheless, given that implants comprise a relatively small proportion of total hip arthroscopic surgery costs, increased implant price variation is unlikely to meaningfully impact study conclusions.
Previous orthopaedic literature has evaluated the relationship of surgeon operative volume with both outcomes and costs. In the context of hip and knee arthroplasty, it is widely recognized that higher surgical volume is associated with lower costs, fewer complications, and reduced rates of revision.24,45,49,51 Similar trends regarding revisions and complications have been identified for both anatomic and reverse total shoulder arthroplasty, with Best et al 6 recently reporting an approximately 30% reduction in 2-year revision rates among high-volume surgeons (≥29 annual cases).19,23,54 The cost-volume relationship for total shoulder arthroplasty, however, appears to be more complex, as some studies have reported lower costs with increased volume,48,50 while others have found no significant association.10,19 In the field of hip arthroscopic surgery, increased surgeon volume has been associated with a reduced risk of subsequent hip surgery 37 ; however, the relationship between volume and costs has not yet been explored. Interestingly, in the present study including 5 surgeons, there was no significant correlation between surgeon operative volume and costs. Given the observational nature of this study, this finding does not definitively imply that there is no relationship between surgeon volume and costs for hip arthroscopic surgery, as additional factors may have mediated this null effect (eg, higher volume surgeons may manage more complex caseloads). 57 However, this counterintuitive result does suggest that simply redirecting patients to high-volume surgeons may not be the optimal strategy for reducing costs and maximizing value.
Finally, the present study did not identify a single driver underlying variation in costs among surgeons, instead demonstrating that the sources of intersurgeon cost variation differed significantly across the 4 cost subcategories (labor costs, total supply costs, implant/allograft costs, and other supply costs). For example, cost variation for surgeons B and D was driven primarily by labor costs, whereas cost variation for surgeons A and C was more influenced by supply costs (see Table 5). This finding highlights that intersurgeon cost variability in hip arthroscopic surgery is not solely attributable to factors such as longer operative times or increased use of intraoperative disposables but instead arises from a distinct constellation of patient selection, surgical technique, and consumable preferences unique to each surgeon. This intriguing result suggests that broad institutional actions such as imposing operating room scheduling limitations or renegotiating the costs of suture anchors are unlikely to reduce cost variation or enhance value. Instead, equipping individual surgeons with granular patient-specific cost data may prove more effective. For example, using the methodology described in this study, hospitals could provide surgeons with individual-level cost data (“scorecards”), along with anonymized peer comparisons. This strategy, which directly addresses the surgeon-specific nature of cost variation and leverages powerful insights from behavioral economics (eg, salience and relative social ranking), has been implemented by a few orthopaedic departments within the United States, yielding impressive reductions in costs and improvements in patient outcomes and value.33,34,41,58,60 As health care systems continue to adapt to novel reimbursement models under increasing economic pressure, understanding and addressing unwarranted cost variation through targeted data-driven approaches may be crucial for containing costs and optimizing value.
Limitations
The conclusions of this study should be interpreted in the context of certain limitations. First, given the study's objective of evaluating variation in costs between surgeons, we did not address the outcomes side of the value equation; thus, we refrain from speculating on the implications of specific study findings on patient value.43,46,47 Second, our costing methodology focused on the intraoperative phase of the care pathway, as this was the portion most likely to be directly affected by surgeon preference and technique.1,11 However, it is theoretically possible that the incidence of postoperative complications (eg, infection, heterotopic ossification, revision surgery) differed between surgeons, which would not be captured by the present methodology and represents an important area of future research. Third, although we analyzed a robust sample size of 890 procedures performed by 5 surgeons across 4 surgery centers, the limited number of surgeons evaluated may reduce the generalizability of our findings, and a greater number of surgeons would have enhanced our ability to characterize intersurgeon variation in costs. Fourth, one of the analyzed surgeons (surgeon D) emerged as a relative outlier regarding operative time, which may have inflated intersurgeon cost variation. However, such heterogeneity between surgeons may also represent a strength of our multisurgeon study design, as it reflects real-world variation in surgical practice and may enhance the generalizability of our findings by capturing a broader spectrum of surgeon preferences and associated costs. Furthermore, major findings on cost variation and drivers remained robust on sensitivity analyses omitting surgeon D. Finally, because institutional policy prohibits the reporting of United States dollar amounts, all costs were presented as normalized values. Importantly, normalization preserved relative values and had no impact on our investigation of cost drivers or intersurgeon variation.
Conclusion
The cost of outpatient hip arthroscopic surgery varied widely between surgeons; the cause of this deviation was multifactorial and surgeon specific. While within-surgeon cost variation was effectively explained by patient and operative characteristics, most between-surgeon variability remained unexplained by observable factors. These insights may support individual surgeons in cost reduction efforts and, more importantly, may enable the alignment of reimbursement rates with costs.
Supplemental Material
sj-pdf-1-ajs-10.1177_03635465251341463 – Supplemental material for Surgeon-Driven Variation in the Cost of Hip Arthroscopic Surgery for Labral Tears: A Time-Driven Activity-Based Costing Analysis
Supplemental material, sj-pdf-1-ajs-10.1177_03635465251341463 for Surgeon-Driven Variation in the Cost of Hip Arthroscopic Surgery for Labral Tears: A Time-Driven Activity-Based Costing Analysis by Michael C. Dean, Nathan J. Cherian, Ana Paula Beck da Silva Etges, Kieran S. Dowley, Kaveh A. Torabian, Zachary L. LaPorte and Scott D. Martin in The American Journal of Sports Medicine
Footnotes
Acknowledgements
The authors specially thank the Conine Family Fund for Joint Preservation for continued support and Mark Cote, DPT, MS, from Mass General Brigham for assistance with statistical analyses.
Submitted June 25, 2024; accepted March 31, 2025.
One or more of the authors has declared the following potential conflict of interest or source of funding: A.P.B.D.E. has served as a consultant for Avant-garde Health. S.D.M. has received support for education from Kairos Surgical and a gift from Allergan. AOSSM checks author disclosures against the Open Payments Database (OPD). AOSSM has not conducted an independent investigation on the OPD and disclaims any liability or responsibility relating thereto.
References
Supplementary Material
Please find the following supplemental material available below.
For Open Access articles published under a Creative Commons License, all supplemental material carries the same license as the article it is associated with.
For non-Open Access articles published, all supplemental material carries a non-exclusive license, and permission requests for re-use of supplemental material or any part of supplemental material shall be sent directly to the copyright owner as specified in the copyright notice associated with the article.