
Abstract
Background:
Residual interlimb deficits after anterior cruciate ligament reconstruction (ACLR) can lead to functional maladaptation and increase the risk of reinjury. The tuck jump assessment (TJA) may offer a more effective evaluation of ACLR status as compared with traditional tasks owing to increased risk of altered landing mechanics, asymmetrical landing, and increased knee valgus attributed to the cyclical nature of the task. However, it remains unclear whether altered TJA kinetics resolve over time or persist through return-to-play phases of rehabilitation.
Purpose:
To examine longitudinal kinetics, asymmetries, and functional performance deficits during TJA at 9 and 12 months after ACLR in female athletes at high risk of reinjury.
Study Design:
Cohort study; Level of evidence, 2.
Methods:
Female athletes (ACLR, n = 24; controls, n = 19; total, N = 43) performed a single trial of TJA on dual-force plates at 2 time points. The ACLR group (mean ± SD age, 16.8 ± 1.9 years) was tested at 9 and 12 months after surgery, and the control group (16.5 ± 3.6 years) was tested at similar time points. All athletes participated in similar sports and had comparable activity levels. Discrete time point analysis and statistical parametric mapping were used to identify deficits within each group.
Results:
At 9 months after surgery, the ACLR group exhibited significant interlimb differences in all kinetic variables (P < .05), which persisted at 12 months with only small reductions in magnitude. As compared with controls, the ACLR group demonstrated a persistent offloading strategy in the involved limb by exhibiting larger interlimb asymmetries for a range of kinetic variables and a greater vertical ground-reaction force in the uninvolved limb during most of the stance phase at both time points (P < .001). Distinct differences in functional performance of TJA were evident at both time points, characterized by lower peak vertical ground-reaction force, peak center of mass displacement, and relative vertical leg stiffness and longer ground contact times (P < .001).
Conclusion:
This study revealed that young female athletes after ACLR exhibit persistent interlimb deficits and functional maladaptations up to 12 months after surgery. The TJA identified significant biomechanical impairments to both limbs, resulting in asymmetrical loading and altered movement strategies as compared with healthy controls. Despite some improvements, athletes with ACLR continued to demonstrate offloading to the uninvolved limb, indicating incomplete neuromuscular recovery.
Keywords
Anterior cruciate ligament (ACL) injury, considered one of the most severe sports-related injuries for time lost in sport, typically requires surgical ACL reconstruction (ACLR) and an extensive rehabilitation period to restore knee joint stability and function.2,39 Return-to-play assessments often encompass a variety of single-leg functional tests32,33,35,42,52 to measure the extent of recovered function in the involved limb as compared with the uninvolved limb, 21 while function and asymmetry can also be assessed during dual-limb jump-landing tasks.17,23 Unilateral tests are generally considered better for evaluating the true capacity of each limb in isolation, while bilateral assessments offer greater insights into compensatory strategies, as both limbs interact to perform the task. Neither approach is inherently superior, but each provides unique information that contributes to our understanding of recovery from ACLR.
Bilateral drop jump and countermovement jump tasks have revealed that male and female athletes with ACLR can continue to exhibit residual deficits in function 8 to 12 months after surgery.1,23,26,50,52 These deficits, including reduced peak vertical ground-reaction force (VGRF), altered loading rates, and changes in braking and propulsive phase variables, are indicative of persistent limitations in load absorption and force generation capabilities of the involved limb.6,50 Consequently, athletes may continue to employ compensatory movement strategies in late stages of rehabilitation, whereby greater reliance on the uninvolved limb is necessary to not only execute the task but offload and mitigate excessive strain on the ACL.
Evidence supports the inclusion of more dynamic testing as part of post-ACLR functional assessment to demonstrate each athlete’s ability to meet the demands of one’s sport.21,25,30 The tuck jump assessment (TJA) is a biomechanical assessment readily used by clinicians to visually assess lower limb injury risk by identifying functional movement deficits associated with reduced neuromuscular control.5,20,36,43,51 While the TJA has typically been used as a visual, field-based screening tool to assess ACL injury risk, assessment of VGRF across multiple jumping cycles may offer a more detailed understanding of movement asymmetry17,28 and athletic rebounding capabilities.4,5 Thus, this approach may be more sensitive to changes over time, especially for those with ACLR.
Kinetic assessment of the TJA in healthy female athletes (age <25 years) revealed peak VGRF up to 5-times body weight (BW), with >10% interlimb kinetic asymmetries in variables such as VGRF, loading rate, and propulsive force.27-29 Statistical parametric mapping also showed significant interlimb differences during 77% to 99% of ground contact across jumping cycles. 28 Combined, these findings challenge the assumption of high symmetry in uninjured individuals and emphasize the need to differentiate between injury-related asymmetry and natural performance variability.25,37 Although limited kinetic data exist for the TJA in clinical populations, previous research shows large asymmetries (14.6%-34.7%) in male and female athletes with ACLR (age <25 years) during the first 5 jumping cycles, with higher forces in the uninvolved limb. 53 Although this demonstrates the importance of exploring interlimb kinetic asymmetries during TJA, analyses were limited by small sample sizes, single time points, and lack of control data, making it difficult to assess functional status relative to rehabilitation progress. Further investigation of interlimb asymmetries across multiple time points in ACLR rehabilitation is needed and could enhance clinical approaches by offering unique and invaluable insights on rehabilitation status.
Research indicates that 9 and 12 months are critical time points for assessing recovery and readiness to return to sport, as this period often coincides with key stages in the rehabilitation process and the transition to high-demand activities. 44 Therefore, our primary aim was to compare kinetics, asymmetries, and task performance of young female athletes (age <25 years) with ACLR at each time point with those of healthy matched controls. We hypothesized that even though there would be reduced interlimb kinetic asymmetries at 9 and 12 months after surgery, incomplete restoration of function and residual deficits would be evident in the involved and uninvolved limbs when compared with the matched controls.
Methods
Participants
A priori power analysis was conducted using G*Power (Version 3.1.9.6), 18 which indicated that a sample size of 36 was required to detect moderate effect sizes (F statistic = 0.25) for comparing means between 2 independent groups. This estimate was based on the primary outcome measure of peak VGRF, with an aim to achieve a statistical power of 0.95 with an alpha error of P < .05. Consequently, 43 female athletes (24 with ACLR and 19 healthy age-matched controls) were prospectively recruited to participate in this study (Table 1). Participants were recruited at 2 institutions from July 2021 to March 2024. Patients with ACLR were female team sport athletes (eg, soccer, basketball, and volleyball) aged 13 to 25 years who had undergone primary unilateral ACLR. Participants who had multiple-ligament reconstructions, previous ACL surgery, or meniscal repair were excluded from the study. Participants in the control group (aged 13-25 years) were identified and cross-matched by age and sport from local sports teams to participate in the study. For the ACLR group, testing was conducted at 9 months (T1) and 12 months (T2) after ACLR, while testing occurred at baseline (0 months; T1) and 3 months later (T2) for the control group. During the 3-month period between testing, control athletes continued with their normal lifestyles, including sports participation, but did not receive any strength conditioning and/or training targeting ACL injury prevention. Patients with ACLR engaged with standardized rehabilitation with the goal to return to the same level of sport. Participants were excluded if they had a history of musculoskeletal injury of the lower limb within 3 months before baseline testing or in the period between testing sessions. Analysis indicated no significant differences in age, height, or body mass between the ACLR and control groups. All participants recruited to the study completed all aspects of data collection, and there were no dropouts (Figure 1). In accordance with previously published approaches, limb dominance for each group was determined as the preferred landing leg.13,19,28 Informed consent was obtained from all participants before testing, and parental consent was obtained for those <18 years of age. All procedures were approved by the institutional research ethics committees (STUDY00002682 and STA1346) and conformed with the Declaration of Helsinki.
Participant Characteristics a
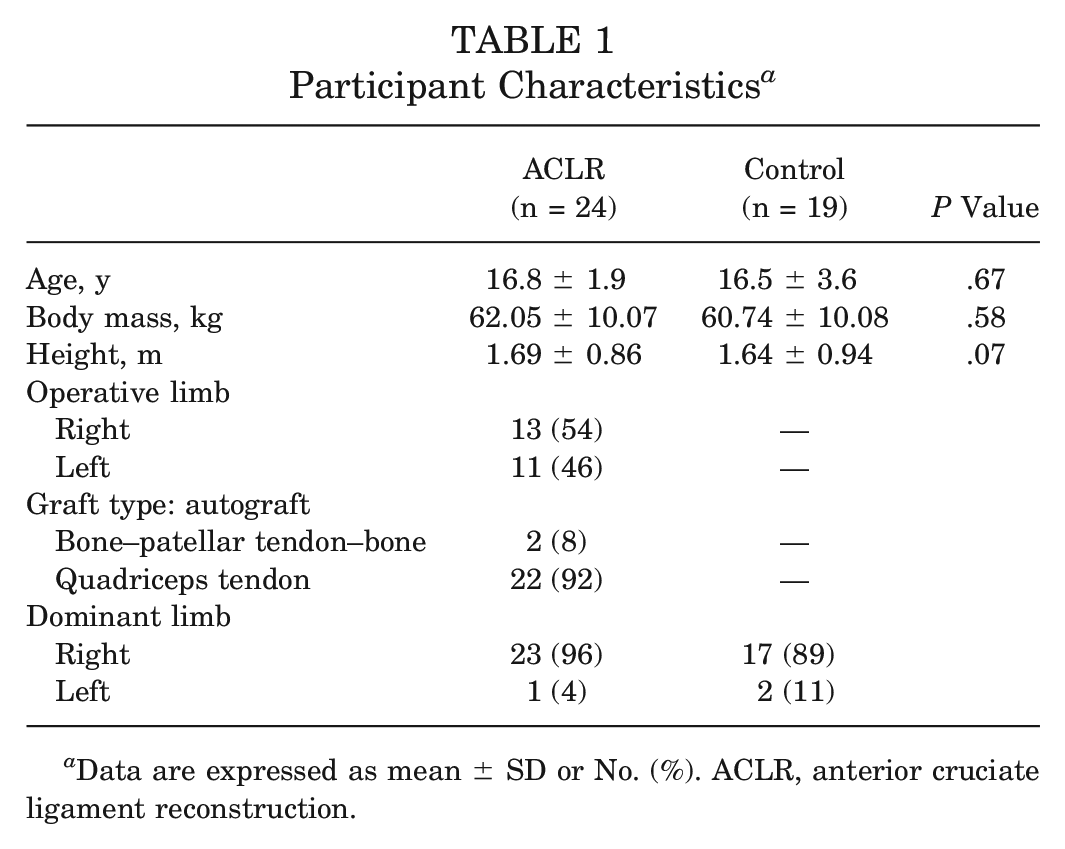
Data are expressed as mean ± SD or No. (%). ACLR, anterior cruciate ligament reconstruction.

Study flow diagram. ACLR, anterior cruciate ligament reconstruction; CON, control group; T1, testing at time point 1; T2, testing at time point 2.
Procedures
Participants were asked to perform repeated tuck jumps in accordance with the TJA protocol 43 for 10 seconds at T1 and T2 on 2 synchronized force platforms: for ACLR, 600 × 900 mm triaxial recorded at 1200 Hz (Advanced Mechanical Technology Inc); for control, 600 × 400 mm recorded at 1000 Hz (type 2812a; Kistler Instruments AG). The TJA protocol was described and demonstrated to participants, as well as supplemented with an instructional video that illustrated the required technique for performing tuck jumps. After this, participants were given the opportunity to familiarize themselves (~10 minutes) with the test procedure atop the force platforms. During this time, the principal investigator was present to offer guidance and feedback. Before initiation of the test, participants were instructed to perform continuous maximal-height tuck jumps for 10 seconds while adhering to the following instructions: (1) bring the knees up to hip height during each jump, (2) maintain the same landing footprint, and (3) face forward during the test. 43 The investigator provided verbal feedback to ensure that participants met these criteria, adjusting their techniques as necessary to achieve technical proficiency. This familiarization process was designed to minimize variability in technique and ensure that participants could perform the test consistently, reflecting their true abilities during the actual testing sessions.
After zeroing the dual-force ground-fixed plates, participants were instructed to stand upright on the plates with their feet aligned to 2 vertical strips of tape 35 cm apart, connected with a horizontal line forming an H shape. Data were captured over 15 seconds to allow for a quiet stance period at the start and end of each trial, and a single valid attempt was recorded for each participant (ie, full foot contact on each force plate for all jumping cycles). In the event of an invalid attempt (eg, landing off the force plates), participants were asked to repeat the trial; a maximum 3 trials were performed with a 5-minute rest period in between. All protocols were implemented with the same testing instructions at T1 and T2, and participants completed the same 10-minute dynamic warm-up before testing. The warm-up included multidirectional jogging to increase heart rate, dynamic stretching targeting major muscle groups, bilateral and unilateral jumps to activate lower extremity muscles, acceleration and deceleration exercises over 5 to 10 m, and change-of-direction drills. The principal investigator demonstrated each exercise and provided verbal instructions, while participants were encouraged to gradually increase exercise intensity throughout.
Data Analyses
A customized script in MATLAB (R2023b; MathWorks Inc) was used for processing, with data filtered using a recursive, fourth-order, low-pass digital Butterworth filter with a cutoff frequency of 50 Hz as determined by residual analysis. The initial countermovement jump was excluded from analysis, and the number of jumping cycles performed thereafter was included for data analysis. The threshold criterion to identify the beginning of each jumping cycle (ie, initial contact) and the end of the ground contact phase was determined when the force was >10 N. 54 Force-time data for all participants were normalized to BW. The following discrete kinetic variables for each limb and combined limbs (bilateral data) were calculated using previously reported methods and definitions and are described in Appendix Table A127,28,49 (available in the online version of this article): peak VGRF (BW), ground contact time (GCT; seconds), flight time (seconds), time of each jumping cycle (ie, touchdown to touchdown; seconds), jump height (meters), peak center of mass displacement (meters), relative vertical leg stiffness (kiloNewton / meters), vertical average and instantaneous loading rates (BW / seconds), total impulse (BW×seconds), braking impulse (BW×seconds), propulsive impulse (BW×seconds), braking to propulsive impulse ratio, duration of propulsive impulse (seconds), peak braking force (BW), peak propulsive force (BW), time of peak braking force (seconds), and time of peak propulsive force (seconds). In addition, the following discrete kinetic variables were determined and derived from bilateral data only27,29: flight time, jump height, time of each jumping cycle, peak center of mass displacement, and net impulse. An example of force-time data is presented in Figure 2 to show a typical VGRF and accompanying center of mass displacement during the ground contact phase of 1 jumping cycle in the TJA. Within-session coefficients of variation at T1 are presented in Appendix Table A2 (available online) and show similar reliability levels across the majority of variables for the control and ACLR groups.

Sample force-time curve for a single jumping cycle in the tuck jump assessment. The continuous line represents the vertical force (relative to body weight [BW]), and the dashed line represents the center of mass displacement throughout the ground contact period (0.21 seconds). Peak vertical ground-reaction force (circle at the peak) occurs during the braking phase and, in this example, coincides with the braking peak. Peak center of mass displacement (circle between phases) occurs at 0.083 seconds of ground contact, marking the end of the braking phase, which is the “stretching” aspect of the stretch-shortening cycle. During this phase, muscles such as the quadriceps and calf muscles lengthen to absorb energy as the body moves downward. After a brief amortization phase, the propulsive phase begins, which is the “shortening” phase of the stretch-shortening cycle, and lasts until take-off at 0.21 seconds. During this phase, stored elastic energy is released, and the muscles contract to generate upward force.
Interlimb kinetic asymmetries for each discrete variable within a jumping cycle were calculated for the ACLR group (involved vs uninvolved limb) and the control group (dominant vs nondominant limb) at T1 and T2 using the Bilateral Asymmetry Index 1 (equation 1). This method was used to ensure that interlimb differences measured during the bilateral TJA task were calculated relative to the sum of that variable.3,7,8 Mean absolute asymmetries for each participant were used for statistical analyses:
(ACLR or dominant limb – uninvolved or nondominant limb) / (ACLR or dominant limb + uninvolved or nondominant limb) × 100. (1)
Temporal data for each jumping cycle (ie, initial contact to take-off) within a trial were interpolated to 101 data points (100% of jumping cycle) to enable continuous waveform analysis between limbs at T1 and T2. 28
Statistical Analyses
Descriptive statistics (mean and standard deviation) were calculated for all variables at each testing session (T1 and T2) for each group. Participant characteristics for the ACLR and control groups were compared using independent t tests. All data were included for data analysis and were examined for normality using a Shapiro-Wilk test before analysis. For primary analyses, differences between groups and between limbs were compared between time points. Mean discrete kinetic variables were examined using 2 × 2 × 2 analysis of variance, in which group refers to ACLR or control, limb denotes the involved or uninvolved limb for the ACLR group or the dominant or nondominant limb for the control group, and time refers to the time of testing (T1 or T2). For between-group comparisons, involved and uninvolved limbs of the ACLR group were compared with dominant and nondominant limbs of the control group, respectively. 47 Mean bilateral kinetic data were examined using a 2 × 2 analysis of variance, with group as a between-subject factor and time as a within-subject factor. To mitigate against the risk of type I error owing to the number of variables analyzed, a Bonferroni-Holm correction was applied. Interlimb kinetic asymmetries were examined using Wilcoxon rank sign or Mann-Whitney U test for within- and between-group comparisons, respectively. Cohen d and Wilcoxon signed rank (r) effect sizes were used to determine the magnitude of differences, with effect sizes classified as follows: trivial (d < 0.20), small (d = 0.20-0.49), moderate (d = 0.50-0.79), or large (d ≥ 0.80). 12
Statistical parametric mapping with 2-tailed paired t tests was performed to compare VGRF differences between limbs during the stance phase of all jumping cycles in the ACLR group (T1, n = 265; T2, n = 267) and control group (T1, n = 293; T2, n = 287) at each time point. Statistical parametric mapping was conducted in MATLAB using the open-source software package SPM 1D 0.4 (Version M0.4; https://spm1d.org/). 46 Perfect agreement between limbs led to no regions of significant difference, whereas dissimilar waveforms led to large regions of difference and thus rejection of the null hypothesis.45,46 Cohen d effect sizes were used to determine the magnitude of significant differences between limbs in a point-by-point manner. Mean VGRF for each limb and mean effect size over the phase were reported using the aforementioned thresholds. 12 Positive effect sizes indicated higher values on the involved or dominant limb, while negative effect sizes indicated higher values on the uninvolved or nondominant limb. Statistical significance was determined at an alpha level of P < .05, and all analyses were conducted in SPSS (Version 27.0; IBM).
Results
Discrete Kinetic Variables
Mean discrete kinetic variables for each limb in the ACLR and control groups at each time point are displayed in Appendix Table A3 (available online). With the exception of instantaneous loading rate, braking to propulsive impulse ratio, and time of peak braking force, significant main effects for group were observed for all discrete kinetic variables (P < .05). Significant main effects for limb were observed only for VGRF, GCT, total impulse, braking impulse, duration of propulsive impulse, and peak braking force (all P < .05). There were no significant main effects for time.
Significant group × limb × time interactions were observed for discrete kinetic variables (P < .05). In the ACLR group, between-limb differences at T1 were evident for all kinetic variables except braking to propulsive ratio and time of peak braking and propulsive force. These differences persisted at T2, albeit with a small reduction in the magnitude of between-limb differences as compared with T1, primarily related to the reduced kinetics in the uninvolved limb. Trivial to moderate differences between limbs were evident in the control group at T1 for peak VGRF, relative vertical leg stiffness, total impulse, propulsive impulse, braking to propulsive impulse ratio, and peak propulsive force (P < .05), although significant differences were not apparent at T2.
Mean bilateral kinetic data for the ACLR and control groups are presented in Appendix Table A4 (available online). Data indicated a significant main effect for group for all kinetic variables except for flight time, jump height, instantaneous loading rate, net impulse, braking to propulsive ratio, and time of peak braking force. However, there was no significant main effect for time. Significant group × time interactions were observed at both time points for a range of bilateral kinetic variables, with the ACLR group demonstrating consistently lower peak VGRF (d = −2.20 to −2.39), peak center of mass displacement (d = −1.63 to −1.70), and relative vertical leg stiffness (d = −1.92 to −1.74) and longer GCT (d = 1.63-1.85) and time to complete each jumping cycle (d = 1.76-1.73) as compared with the healthy controls. Additionally, larger braking (d = 1.75-1.89) and propulsive impulses (d = 1.55-1.64) were evident at both time points when compared with the control group (all P < .001). Notably, where significant group × time interaction effects are reported, the differences exceeded the within-session reliability.
Interlimb Kinetic Asymmetries
Mean interlimb kinetic asymmetries for both groups at each time point are displayed in Appendix Table A5 (available online). In the ACLR group, small reductions in asymmetries were observed for peak VGRF, relative vertical leg stiffness, and peak braking force from T1 to T2 (all P < .05). The control group also demonstrated small reductions in asymmetries for the same variables and total impulse from T1 to T2. Larger asymmetries were evident in the ACLR group at T1 and persisted at T2 for VGRF, relative vertical leg stiffness, average loading rate, peak braking force, and time of peak braking and propulsive force (P < .05; T1, r = 0.44-0.65; T2, r = 0.40-0.72) as compared with the control group. Larger asymmetries were evident in the ACLR group for total impulse and braking impulse only at T2 (P < .05; r = 0.31-0.32). Asymmetries were smaller in the ACLR group at T1 and T2 for GCT (P < .05; r = −0.45 and −0.36) and duration of propulsive impulse (P < .05; r = −0.39 and −0.32) when compared with the control group, while all other asymmetries did not significantly differ between groups at T1 or T2.
Waveform Analysis of VGRF
In the ACLR group, statistical parametric mapping analysis revealed trivial to moderate differences in VGRF between limbs for most of the stance phase of all jumping cycles at T1 (2%-7% and 7%-100%; P < .001; d = −0.17 and −0.58) and T2 (4%-5% and 6%-100%; P < .001; d = −0.10 and −0.47), with greater VGRF in the uninvolved limb (T1, 0.58 and 1.34 BW; T2, 0.63 and 1.30 BW) when compared with the involved limb (T1, 0.53 and 1.09 BW; T2, 0.60 and 1.12 BW). In the control group, trivial to small differences in VGRF between limbs were evident during several phases of the stance for all jumping cycles at T1 (0%-5%, 11%-31%, and 46%-88%; P < .05; d = 0.17, 0.30, and 0.27) and T2 (1%-3%, 12%-35%, and 51%-81%; P < .05; d = 0.11, 0.22, and 0.23), with greater VGRF in the dominant limb (T1, 0.23, 1.64, and 1.81 BW; T2, 0.11, 1.46, and 1.92 BW) as compared with the nondominant limb (T1, 0.21, 1.51, and 1.70; T2, 0.10, 1.37, and 1.83) (Figure 3).

Interlimb differences in normalized vertical ground-reaction force during the tuck jump assessment for the ACLR and control groups at T1 and T2. (A) Mean waveforms and SD clouds. (B) Statistical parametric mapping t statistic inference curves with critical threshold lines (dashed line) and suprathreshold clusters (shaded areas) indicating significant differences between limbs (P < .05). (C) Mean Cohen d effect size and 95% confidence interval clouds. ACLR, anterior cruciate ligament reconstruction; BW, body weight; DOM, dominant; NDOM, nondominant; SPM, statistical parametric mapping; T1, testing at time point 1; T2, testing at time point 2.
Discussion
Athletes with ACLR demonstrated persistent limb deficits, with greater interlimb asymmetries and distinct differences in functional performance when compared with healthy controls. Notably, as compared with controls, athletes with ACLR exhibited longer GCT; lower peak VGRF, relative vertical leg stiffness, average loading rate, and peak braking and propulsive forces; and larger braking and propulsive impulses at 9 and 12 months after surgery. A persistent “offloading” strategy was evident in athletes with ACLR, with time series waveforms revealing significantly greater VGRF on the uninvolved limb for most of the stance phase of all jumping cycles. Despite slight improvements at 12 months, there was a continued reliance on the uninvolved limb for successful task execution, highlighting persistent functional deficits. These findings suggest that assessment of TJA kinetics can effectively detect undesirable jump-landing strategies in athletes with ACLR at 9 and 12 months after surgery, indicative of inadequate functional restoration.
Effective performance of the TJA requires sufficient reactive strength to adhere to test criteria and resist aberrant landing biomechanics. 43 Healthy female athletes in this study and previous literature28,29 typically demonstrated a jump-landing strategy during the TJA that was indicative of fast stretch-shortening cycle (SSC) function, characterized by high leg stiffness and short GCT (<250 ms). 34 In contrast, group-level analysis in this study indicates that athletes with ACLR at 9 and 12 months after surgery had compromised SSC performance, with significantly longer GCT (>250 ms), lower VGRF, and reduced relative vertical leg stiffness, resulting in fewer jumping cycles performed. Despite superior braking and propulsive impulses owing to extended ground contact, athletes with ACLR did not achieve greater jump heights, suggesting diminished neural regulation of SSC function after surgery. This highlights the need for a greater emphasis on plyometric and ballistic training methods within periodized rehabilitation programs to improve SSC function and reduce residual deficits.10,11 Clinicians could also consider monitoring TJA metrics associated with SSC capabilities, such as ground contact time, relative vertical leg stiffness, braking and propulsive impulses, and jump height, at key time points during ACLR rehabilitation to help guide training prescription and return-to-play decision-making.
The distinct interlimb differences and persistent biomechanical deficits in athletes with ACLR in this study are consistent with previous literature.23,53 The involved limb had reduced ground-reaction forces, resulting in larger interlimb kinetic asymmetries when compared with controls. Over time, the only asymmetry variables that significantly improved at 12 months after surgery in the ACLR group were peak VGRF, relative vertical leg stiffness, and peak braking force, albeit these changes were small in magnitude. Thus, it is apparent that athletes with ACLR continued to display an asymmetrical limb loading pattern at 12 months after surgery as compared with controls. Mean interlimb asymmetries ranged considerably across all discrete variables for athletes with ACLR at 9 months (1.8%-18.8%) and 12 months (1.9%-19.7%) after surgery, with subtle nonsignificant increases observed in some variables, such as average loading rate, braking to propulsive ratio, and time of peak braking force. In contrast, control athletes demonstrated consistently smaller asymmetries (0.9%-13.0%) across time points, with minor reductions in VGRF, relative vertical leg stiffness, total impulse, and peak braking force. The smaller asymmetry ranges reported in this study as compared with previous research 53 may stem from analyzing all jumping cycles rather than just the first few, which tend to be inherently variable. 28 Because current literature indicates that asymmetries are task- and variable-specific, it is difficult to compare asymmetry values across different tasks. 25 Thus, the asymmetry measures presented here may provide clinicians with normative reference values within this sample population. Clinicians should also consider individual changes in asymmetry, 38 which may offer more valuable insight into rehabilitation status and return-to-play readiness as compared with the group-level changes reported in this study.
Interlimb kinetic asymmetries across discrete variables at both time points often surpassed the arbitrary threshold of 10% to 15% for acceptable asymmetry that is regularly associated with increased risk of primary ACL injury.9,22 However, relying solely on measures of asymmetry may overlook the risk of more global strength loss and functional impairment in the uninvolved limb, which potentially inflate symmetry calculations. 25 Although the ACLR group showed some improvements in asymmetry at 12 months, indicating a shift toward more symmetrical loading during the TJA, significant differences between groups persisted. Both limbs of the ACLR group had lower peak VGRF, leg stiffness, loading rates, braking force, and propulsive force when compared with controls. These athletes also had longer GCT, leading to higher total, braking, and propulsive impulses, with a delayed peak propulsive force. Such between-group differences indicate continual impairments in both limbs of the ACLR group and highlight that assessing asymmetry values alone may not adequately indicate rehabilitation status.
Our data indicate a persistent offloading strategy to the uninvolved limb in athletes with ACLR, which likely indicates insufficient recovery of the involved limb despite an extensive postsurgery period. This offloading strategy, often observed during other bilateral functional tasks,6,14,17,24,26,47,52 may be driven by decreased knee moments 17 and quadriceps strength, 16 causing redistribution of force production to the uninvolved limb. Given that the goal of the TJA is to perform maximal-height tuck jumps repeatedly for 10 seconds, 43 athletes must continually generate a sufficient impulse to vertically displace the center of mass during each jumping cycle. Furthermore, adequate reactive strength capabilities of both limbs are required to resist unwanted movement during the in-flight phase of the task (eg, excessive trunk lean) and landing phase (eg, unequal foot contact). 51 In the present study, time series waveforms and kinetic data revealed unequal distribution, with greater force production and load absorption evident on the uninvolved limb in athletes at 9 months after ACLR as compared with controls. Similar patterns have been observed in male and female athletes after ACLR during a bilateral vertical drop jump test, and a persistent avoidance strategy to load the involved limb is evident up to 10 months after surgery.3,31,40,41
Vertical jump impulse deficits and asymmetries after ACLR are associated with heightened risk of ACL reinjury17,48 and appear to be consistently observed when evaluating a task that involves a higher eccentric component.3,50 Our data indicate that athletes with ACLR continually demonstrate an inability to effectively dissipate forces, with few changes between 9 and 12 months. Time series waveforms demonstrated consistent differences between limbs, and instantaneous loading rate for the uninvolved limb was the only discrete kinetic variable to significantly decrease over time in the ACLR group. All other variables for each limb within each group remained unchanged. When compared with controls, athletes with ACLR in this study produced significantly larger braking and propulsive impulses, indicating asymmetrical loading patterns that may partly indicate greater risk of injury to either limb.15,48,55 Clinically, our results emphasize the need for extended rehabilitation beyond 9 to 12 months. Kinetic assessments of the TJA can help clinicians monitor force production and load absorption, identifying patients who remain overly reliant on the uninvolved limb and guiding individualized rehabilitation strategies.
The distinct jump-landing patterns observed in athletes with ACLR are believed to be characterized by a compromised SSC function, highlighting the importance of evaluating both limbs and functional performance to guide return-to-play decision-making. As the TJA is a high-impact reactive task with a large eccentric component, it is essential to restore adequate strength and function of the involved limb before subjecting athletes with ACLR to the repeated jumping exercise. Clinicians should gradually load the knee during early stages of rehabilitation, where equal force distribution should be encouraged to avoid persistent offloading strategies to the uninvolved limb. Training should then progress and focus on restoration of SSC function through the integration of appropriately periodized plyometric exercises. Findings further support the importance of bilateral cyclical assessments such as the TJA for thorough evaluation of neuromuscular function in ACLR rehabilitation. Although the findings in this study are based on group-level data, injury risk screening and rehabilitation assessment should be conducted on an individualized basis. This approach ensures that clinicians consider individual responses to surgery, which will appropriately guide return-to-play readiness.
This study provides novel data and insight into the rehabilitation process and return-to-play readiness of young female athletes with ACLR. When interpreting the results, it is important to acknowledge potential limitations. Kinematic assessment was not included in this study, which may have helped define the underlying mechanisms and interpret adaptations in interlimb asymmetries and functional performance of the TJA. Nonetheless, intralimb kinetics are associated with knee joint moments and are clinically relevant to evaluate functional movement during rehabilitation.17,48 It should be noted that VGRF asymmetries and movement assessment may not account for all risks related to subsequent ACLR injury. Although patient-reported outcomes were not measured during this study (eg, International Knee Documentation Committee Subjective Form scores), biomechanical analysis of double- and single-leg drop jumps at 9 months after ACLR has shown fair to good ability to predict subsequent contralateral ACL rupture. 30 Kinetic assessment of the TJA at 9 and 12 months after surgery thus may highlight functional limitations in plyometric ability that also may reflect poorer patient-reported outcomes and increased risk of injury. Further research should consider evaluating patient-reported outcomes to provide additional context regarding the subjective experience of functional performance and recovery. Last, our analyses did not consider the influence of limb dominance, which could be a key consideration for future research.
Conclusion
This study highlights that young female athletes demonstrated residual deficits in kinetics and interlimb asymmetries, resulting in functional limitations that persisted up to 12 months after ACLR. Persistent asymmetrical loading to the uninvolved limb was evident and indicates incomplete neuromuscular recovery of the involved limb. Despite extensive time from surgery, these athletes also exhibited significant biomechanical impairments in the uninvolved limb as compared with healthy controls, suggesting that a more global loss of function extends beyond the impairments experienced by the involved limb after surgical intervention. Furthermore, kinetic assessment of the TJA effectively identified undesirable jump-landing strategies, emphasizing the need for extended and targeted rehabilitation beyond the typical 12-month rehabilitation period.
Footnotes
Submitted May 14, 2024; accepted October 29, 2024.
One or more of the authors has declared the following potential conflict of interest or source of funding: G.D.M. consults with commercial entities to support commercialization strategies and applications to the US Food and Drug Administration but has no direct financial interest in commercialization of the products. G.D.M.’s institution receives current and ongoing grant funding from the National Institutes of Health/National Institute of Arthritis and Musculoskeletal and Skin Diseases (grants U01AR067997, R01AR070474, R01AR055563, R01AR076153, R01AR077248, and R61AT012421), the Department of Defense (grant W81XWH22C0062), and the Arthritis Foundation Osteoarthritis Clinical Trial Network. G.D.M. has received industry-sponsored research funding to his institutions related to injury prevention and sport performance and has current ongoing funding from Arthrex Inc to evaluate anterior cruciate ligament surgical treatment optimization strategies; receives author royalties from Human Kinetics and Wolters Kluwer; and is an inventor of biofeedback technologies (patent US11350854B2, “Augmented and Virtual Reality for Sport Performance and Injury Prevention Application,” approved June 7, 2022; software copyrighted) designed to enhance rehabilitation and prevent injuries, which receives licensing royalties. AOSSM checks author disclosures against the Open Payments Database (OPD). AOSSM has not conducted an independent investigation on the OPD and disclaims any liability or responsibility relating thereto.
References
Supplementary Material
Please find the following supplemental material available below.
For Open Access articles published under a Creative Commons License, all supplemental material carries the same license as the article it is associated with.
For non-Open Access articles published, all supplemental material carries a non-exclusive license, and permission requests for re-use of supplemental material or any part of supplemental material shall be sent directly to the copyright owner as specified in the copyright notice associated with the article.