
Abstract
Background:
An increased tibial slope (TS) has been identified as a risk factor for anterior cruciate ligament (ACL) injury and graft failure after ACL reconstruction. However, different imaging modalities are used to determine the TS, resulting in divergent values. Consequently, no reference values and no consensus on thresholds can be reached, which in turn is mandatory for indicating correction osteotomies when facing outlier TS.
Purpose:
To determine the mean values of the TS and the incidence of their outliers in large cohorts of patients with ACL-injured and noninjured knees and to determine the feasibility of measuring TS on conventional lateral radiographs (CLRs).
Study Design:
Cross-sectional study; Level of evidence 3.
Methods:
TS of ACL-injured knees (n = 1000, group A) and ACL-intact knees (n = 1000, group B) was measured by 3 experienced examiners. Medial TS was measured on CLRs using the technique of Dejour and Bonnin. Patients with radiographs with poor image quality, osteoarthritis, previous osteotomies, or nondigital radiographs were excluded. The intra- and interrater reliability was calculated using the intraclass correlation coefficient.
Results:
The mean TS was significantly higher in group A than in group B (10.04°± 3° [range, 2°-22°] vs 9.02°± 2.9° [range, 1°-18°], respectively; P < .001). Significantly more participants in group A had TS larger than 12° (≥12°, 32.2% vs 19.8%, P < .001; ≥13°, 20.9% vs 11.1%, P < .001; ≥14°, 13.5% vs 5.7%, P < .001; ≥15°, 8% vs 2.7%, P < .001; ≥16°, 3.7% vs 1.4%, P = .0005), respectively. In contrast, significantly more participatns in group B had TS 8° or less (≤8°, 32.1% vs 42.7%, P < .001; ≤7°, 20% vs 30.9%, P < .001; ≤6°, 12.4% vs 19.8%, P < .001; ≤5°, 6.6% vs 12%, P = .0003; ≤4°, 2.8% vs 5.3%, P = .0045). The intraclass correlation coefficient revealed a good to excellent reliability throughout measurements.
Conclusion:
Median values for the TS were 9° for uninjured and 10° for ACL-injured knees on CLRs. Notwithstanding its statistical significance, this finding might be negligible in clinical practice. However, a significantly larger number of outliers were found in the ACL-injured group exceeding a TS of 12° and demonstrating an incremental proportion with increasing TS, serving as a potential threshold for correction osteotomy. Furthermore, CLRs in the largest cohort to date exhibited high reproducibility, proving the feasibility of CLRs as a routine measurement for TS.
Increasing evidence shows that the configuration of the dorsal inclination of the proximal tibia—namely, the tibial slope (TS)—has a strong effect on anterior cruciate ligament (ACL) strain, ACL injury rates, and failure rates after ACL reconstruction (ACLR).16,25,29,30,32 It has been shown that an outlier TS (≥12°) is associated with an increased number of ACL graft failures and produces an odds ratio of 11.6 for repeated ACL graft insufficiency after ACLR. 13 On the basis of these findings, some authors advocate measuring the TS in every case of ACL injury to identify outliers as a neglected risk factor for ACL graft failure.10,13 Particularly in the revision situation, assessment of the TS seems to be mandatory to decide whether a correction osteotomy might be indicated.1,7,28,31
A paucity of studies have used a uniform TS assessment, reporting on a threshold for an increased failure rate after ACLR or slope-correcting osteotomies. To date, different acquisition techniques have been introduced to measure the TS, such as magnetic resonance imaging (MRI), computed tomography (CT), and conventional lateral radiographs (CLRs). Every modality allows various measurements using different anatomic references. 6 This results in inconsistent data, obstructs comparison between studies with difference acquisition techniques, and impedes the ability to reach a consensus on a standardized measurement for the clinical routine.
CLRs are commonly available in the clinical setting, and potential confounders have been elucidated. 12 Concerning measurement of the TS, the technique described by Dejour and Bonnin 8 is widely used. However, the number of patients with ACL injury in the available studies is limited, ACL-intact controls are usually not included, and few studies report on intra- and interrater reliability.4,18,21,29 Thus, little consensus can be reached regarding mean values of TS and its outliers in patients with and without ACL injury. However, this information is mandatory to judge the clinical feasibility of CLRs in this regard.
The aim of the current study was, first, to determine mean values of TS in a large patient cohort and the incidence of outliers on CLRs in a standardized fashion. Second, we compared ACL-injured and noninjured knees, and third, we determined the intra- and interrater reliability. It was hypothesized that the TS and its outliers in ACL-injured knees would be significantly higher compared with those in the control group. Furthermore, we hypothesized that measurements using CLRs in a standardized fashion would result in high intra- and interrater reliability.
Methods
The institutional database was retrospectively reviewed for CLRs of patients with an ACL injury (group A). ACL insufficiency was confirmed via MRI and clinical examination. Patients with concomitant injuries of the posterior cruciate ligament, combined lower extremity fractures, osteoarthritis higher than grade II according to Kellgren and Lawrence, or previous osteotomies of the ipsilateral knee were excluded. In addition, we excluded patients whose radiographs did not include a true lateral view of the tibia as determined by proper superimposition of the femoral condyles (<5 mm). 12 We excluded radiographs with poor quality, such as a short tibial shaft (<12.5 cm), low resolution, or poor contrast, and nondigital radiographs. The inclusion process in the study group (group A) was set at N = 1000 CLRs. The control group (group B) consisted of 1000 CLRs of patients after exclusion of an ACL insufficiency. These numbers were based on the sample size calculation. CLRs in group B were performed to exclude degenerative changes or fractures adjacent to the knee, and special care was taken to exclude patients with possible ACL injury. The same exclusion and inclusion criteria were applied as in group A. The inclusion process is illustrated in Figure 1.
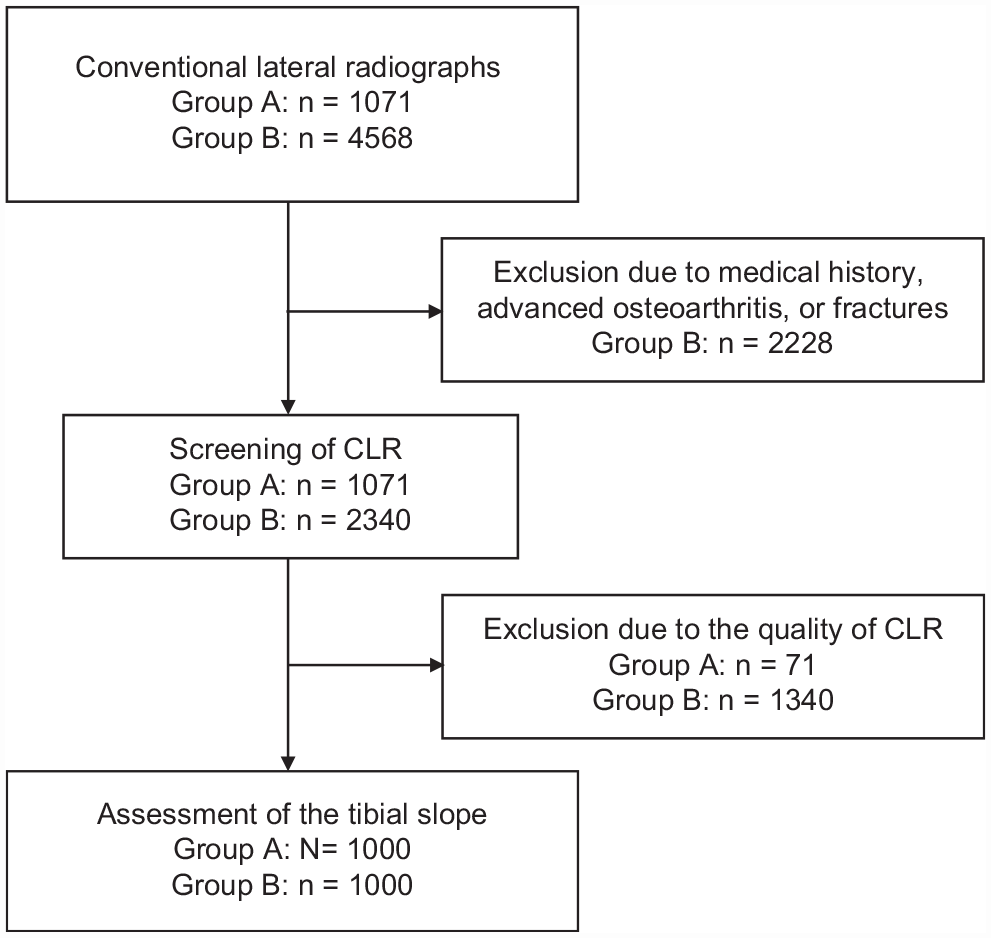
Flowchart depicting the selection of study participants. CLR, conventional lateral radiograph.
Anthropometric and descriptive measures including age and sex were documented. The study protocol was approved by the local ethics committee (EA2/016/21), and the study was carried out in accordance with the Declaration of Helsinki and all participants provided informed consent.
Radiological Assessment
TS was measured on CLRs by 3 experienced observers (A.W., R.B., C.G.) using a picture archiving and communication system workstation (Centricity RIS-I 4.2 Plus; GE Healthcare). All observers were blinded to all other parameters.
The TS is regarded as the angle between the posterior inclination of the medial tibial plateau and a line perpendicular to the tibial shaft axis. The tibial shaft axis was determined according to Dejour and Bonnin 8 using 2 midpoints between the anterior and posterior tibial cortex: one below the tibial tuberosity (approximately 5 cm below the joint line) and the other one 15 cm below the tibial joint line. Subsequently, the TS was determined between the tangent line to the medial tibial plateau, which is commonly superimposed on lateral radiographs, and to a line 90° to the diaphyseal axis. Although the best available radiographs were chosen, not all included enough tibial shaft to determine the width of the shaft at a distance of 15 cm distal to the joint line. In these instances, the most distal width (if ≥12.5 cm) was measured based on the aforementioned conditions (Figure 2).12-15
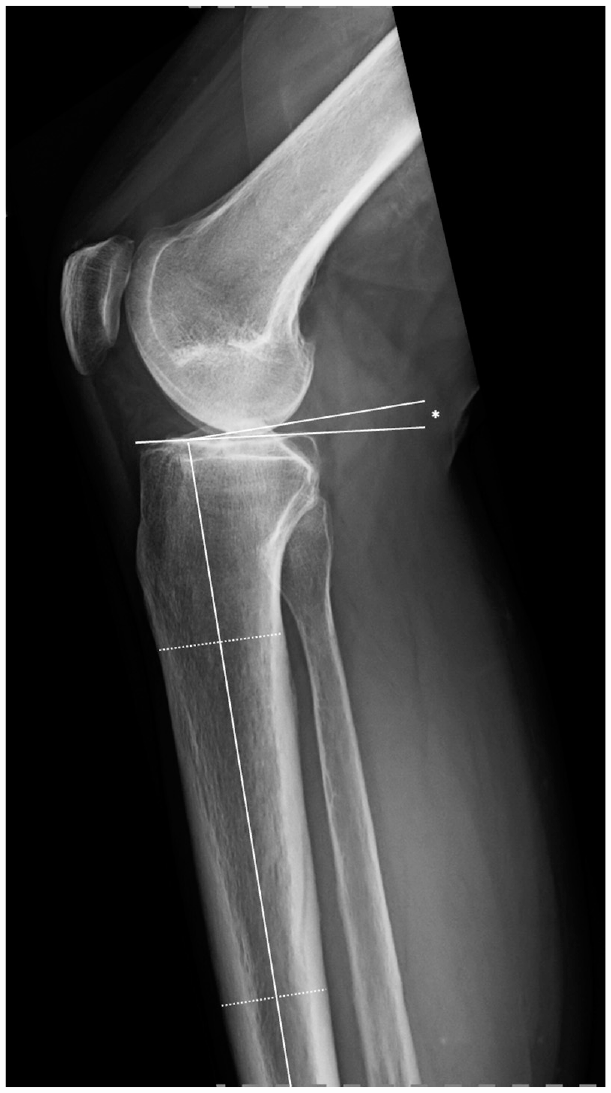
Measurement of the tibial slope, which is defined as the angle (*) between the tangent line of the medial tibial plateau and a line perpendicular to the tibial shaft axis.
Statistical Analysis
Statistical analysis was performed using SPSS 22 (IBM Corporation) and Prism Version 6 (GraphPad Software). Continuous data are expressed as mean ± SD and or median according to their distribution. D’Agostino and Person omnibus normality tests were used to test Gaussian distribution. Parametric data were compared using a t test, and nonparametric data were assessed using a Mann-Whitney test. Chi-square test was used to determine statistically significant differences between categorical variables. Multivariate analysis was performed to account for demographic differences between groups. P < .05 was considered statistically significant. A power analysis was performed to calculate the sample size, using G*Power software (Heinrich-Heine-Universität).
Intra- and interrater reliability was rated using the intraclass correlation coefficient according to Shrout and Fleiss 26 (2,1; absolute agreement). Intraclass correlation coefficient was categorized as slight, 0 to 0.2; fair, 0.21 to 0.4; moderate, 0.41 to 0.6; good, 0.61 to 0.8; and excellent, >0.8. 19 To test interrater reliability, we compared 100 measurements between each observer. To test intrarater reliability, we performed 50 measurements twice—at least 14 days apart—and consequently compared them between each individual observer.
Results
Inclusion of 1000 patients per group resulted in a power >0.9 to protect against undue rejection of the null hypothesis, thus achieving the anticipated level of statistical power and validation.
Group Characteristics
The mean age of patients was 36.6 years (range, 18-66 years) in group A and 41.2 years (range, 18-65 years) in group B (P < .001). Group A contained significantly more male patients (63.5%) compared with group B (48.3%) (P < .001). Multivariate analysis revealed no dependence between sex and TS but a statistically significant dependence between age and TS (P < .001; regression coefficient, –0.03). With respect to the affected side, group A had 50.8% right knees, and 53.4% of the cases in group B involved the right side (not significant).
Analysis of the Tibial Slope
The mean TS was 10.04°± 3° (median, 10°; range, 2°-22°) in group A and 9.02°± 2.9° (median, 9°; range, 1°-18°) in group B. This difference was statistically significant (P < .001). The numbers of patients with a TS of 2° to 16° are depicted in Figure 3.
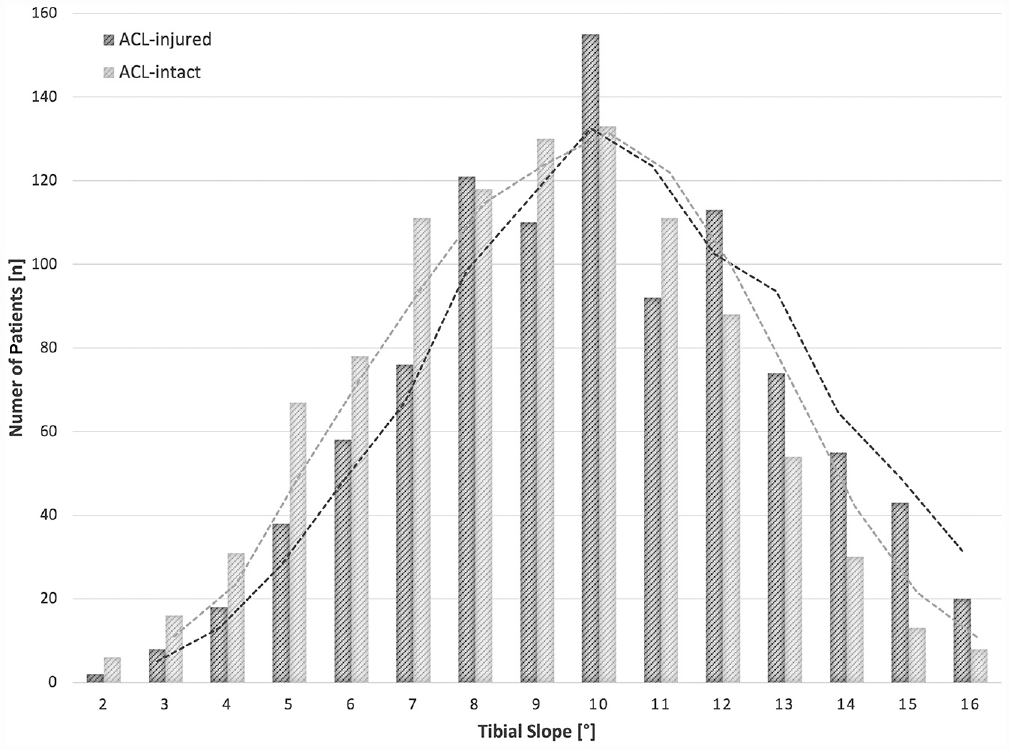
Distribution and trend lines of the tibial slope (TS) between 2° and 16° within the patient cohort. A significant divide is seen in favor of patients with intact anterior cruciate ligament (ACL) (light gray) at TS ≤ 8°. This is also evident for patients with ACL injury (dark gray) at TS ≥12°.
Outlier analysis revealed a significant divide in favor of group A marking the beginning of a TS of 12°. More specifically, in group A compared with group B, there was a significantly larger number of patients with TS ≥12° (32.2% vs 19.8%; P < .001), TS ≥13° (20.9% vs 11.1%; P < .001), TS ≥14° (13.5% vs 5.7%; P < .001), TS ≥15° (8% vs 2.7%; P < .001), and TS ≥16° (3.7% vs 1.4%; P = .0005), respectively. In contrast, there was a significant divide for group B with a TS ≤8° (Group A: 32.1% vs Group B: 42.7%; P < .001), TS ≤7° (20% vs 30.9%; P < .001), TS ≤6° (12.4% vs 19.8%; P < .001), TS ≤5° (6.6% vs 12%; P = .0003), and TS ≤4° (2.8% vs 5.3%; P = .0045), respectively.
The outlier ratio (percentage of group A divided by percentage of group B) between a TS of 2° and 16° is presented in Figure 4.
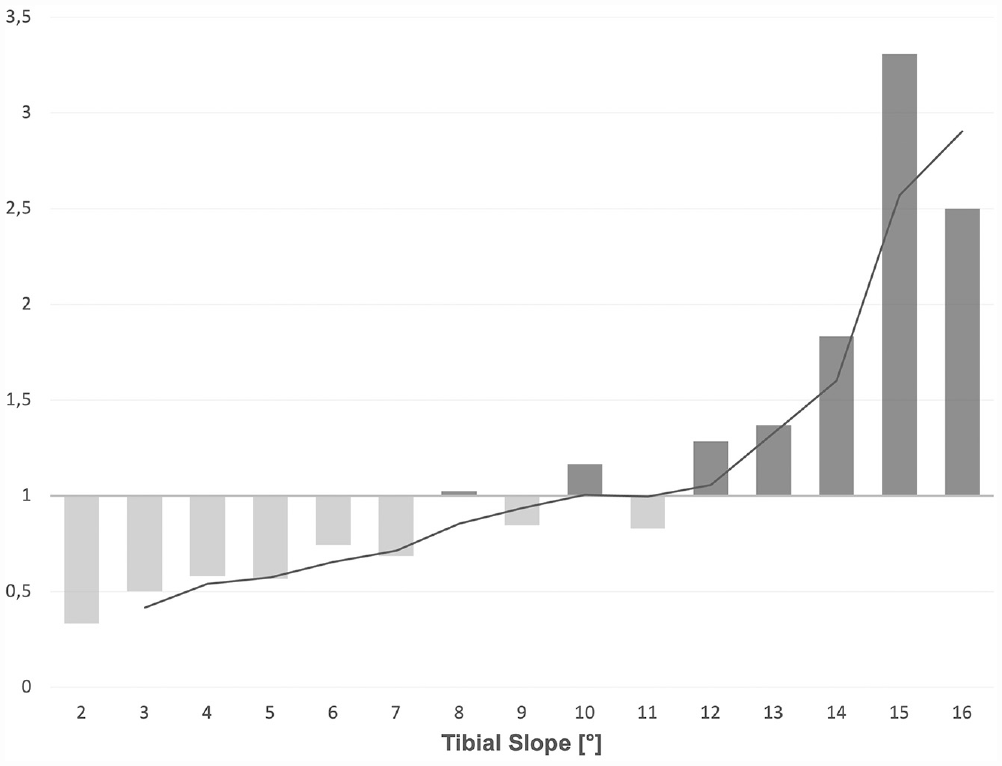
Distribution and trend lines of the outlier ratio (percentage of group A divided by percentage of group B) between a tibial slope of 2° and 16°. Values >1 are depicted in light gray, >1 in dark gray.
Inter- and Intrarater Reliability
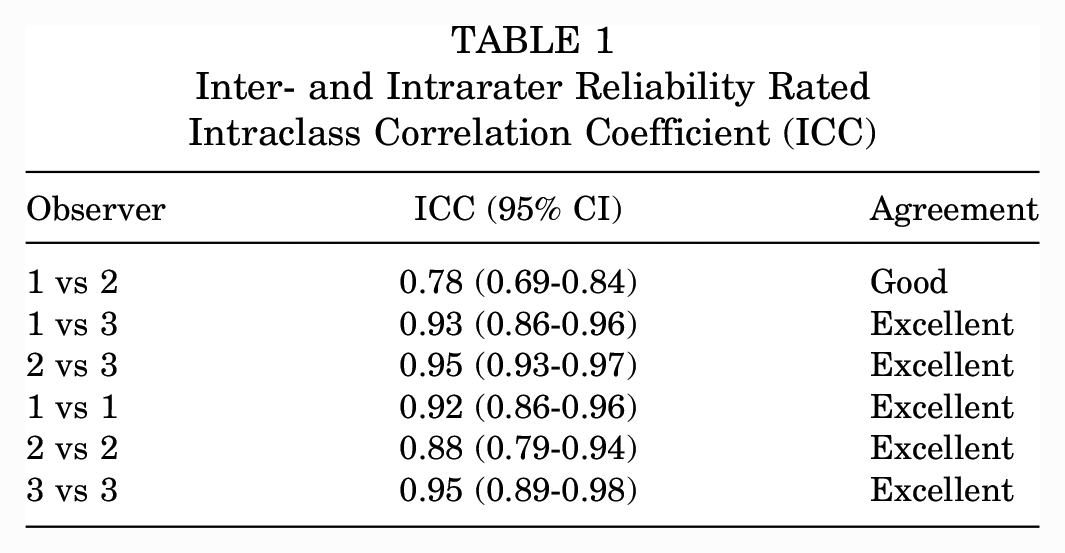
Inter- and intrarater reliability was assessed for all 3 observers (observer 1, A.W.; observer 2, R.B.; observer 3, C.G.) (Table 1).
Inter- and Intrarater Reliability Rated Intraclass Correlation Coefficient (ICC)
Discussion
The working hypothesis, that the mean TS on CLRs in ACL-injured knees would be significantly higher compared with that in ACL-intact knees, was supported by the current results. Notwithstanding its statistical significance, there was only a minor absolute difference of 1°, with both groups demonstrating considerable ranges. Consequently, one must consider this discrepancy to be of small clinical relevance. Nonetheless, ACL-injured knees exhibited a significantly higher portion of outliers above a TS of 12°, becoming even more pronounced with further increase of TS. In contrast, ACL-intact knees showed a significantly larger portion below a TS of 8°. This was also evident in the outlier ratio.
In addition, assessment of the TS on CLRs using the technique by Dejour and Bonnin 8 in a standardized fashion resulted in high inter- as well as intraobserver reliability, underlining the clinical feasibility of this modality for measurement of TS.
Micicoi et al 23 advocated that approximately 50% of healthy individuals present bony risk factors for sustaining ACL injuries, including 54% with an increased medial TS and 15% with an increased lateral TS. However, this connection between bony risk factors and actual ACL injury might be oversimplified, as shown by the results of the study and current clinical understanding for ACL injuries. Both groups in the present study revealed only a negligible mean difference, indicating that most patients who have ACL injury will present within normal TS ranges. Differences between groups were especially distinguished at both ends of the TS spectrum, as approximately one-third of ACL-injured and only one-fifth of ACL-intact knees showed a TS ≥12°. This finding is in line with several other studies that proposed this threshold as a risk factor for failure after ACLR.13,20,25,30 Notably, the divide of TS became even more pronounced with increasing TS. Consequently, this subset of patients could be categorized as outliers, as shown in the outlier ratio. Future studies need to delineate whether these patients qualify for TS correction osteotomy, as already advocated.1,7,27,28
Meric et al 22 reported the TS of >13,000 patients measured on CT scans before knee arthroplasty; the investigators defined their outliers to be <4° and >10° and found approximately 30% of cases lying outside this range. Given that the nominal values found on MRI and CT scans are usually 4° to 5° lower than those found on CLRs, this might explain the difference with the current results.17,24 It again becomes evident that the TS describes an acquisition-dependent tendency of the dorsal inclination of the tibial plateau within an equally measured cohort and not a nominal figure. Thus, comparisons between cohorts that are not uniformly measured will introduce considerable inaccuracy and will ultimately prevent firm conclusions.
Because conventional radiography is the most common imaging technique used in clinical practice and is conducted in almost every case of suspected ACL injury, the current study was performed to delineate feasibility for assessment of the TS. In contrast to CLRs, cross-sectional imaging allows for discrimination of the medial and lateral TS yet requires specialized software and is more time-consuming. 12 The current results, which we obtained in the largest patient cohort to date using CLRs and the technique by Dejour and Bonnin, 8 showed a high inter- and intraobserver reliability, indicating a high reproducibility for clinical routine. Moreover, mean values for ACL-intact knees in the present study concur with those in the literature, which reports a mean TS of 8.4° to 9.9° for CLRs.4,18,21,29 With respect to the literature, the Dejour and Bonnin technique shows wide application, high reproducibility, and moderate to strong correlation with MRI assessment of the TS.12-15,17,24 Taking the aforementioned into account, it might be reasonable to propose this technique as the standard measurement of TS in the clinical setting.
Our study has a few limitations that should be noted. Because of its retrospective design, information on patients in the ACL-intact group was based on the clinical history of our institutional database. Thus, MRI scan with the presence of an intact ACL was not available in all patients. However, patients with a medical history or examination suggestive for ACL injury were excluded.
The characteristic differences between groups A and B should be noted, as well as the fact that we could not account for potential disparity regarding body mass index and ethnicity.2,3 In group A, patient age was significantly lower and significantly more male patients were included compared with group B. This might be attributable to the fact that group A represents a younger and more active group of patients who are prone to ACL injury compared with group B, whose radiographs were taken because of undefined trauma or exclusion of degenerative changes. Of note, conflicting results have been reported about the effect of aging (after skeletal maturity up to the presence of severe osteoarthritis) and TS.2,5,11 Patient sex did not have a significant effect on the TS, yet multivariate analysis showed a significant dependence between age and TS. Even if the regression coefficient might indicate that this is clinically negligible, it still must be noted when interpreting the results.
As already discussed, another drawback of the current study is the measurement of TS on standard radiographs, thus potentially ignoring a possible asymmetry between the medial and lateral TS. 9 Nevertheless, radiographs have been reported to provide an accurate and objective quantification of the TS as well as high correlation with MRI assessment.12,17 In addition, the clinical use of radiography might be higher than that of MRI.
Conclusion
The TS was significantly higher in 1000 patients with an ACL-injured knee compared with 1000 patients with an ACL-intact knee. The mean values differed by only 1°, which might be negligible in clinical practice. However, a significantly larger number of outliers were noted in the ACL-injured group exceeding a TS of 12°, which became more distinct with increasing TS and thus qualified as a potential threshold for correction osteotomies.
Footnotes
Submitted August 31, 2022; accepted April 19, 2023.
The authors declared that they have no conflicts of interest in the authorship and publication of this contribution. AOSSM checks author disclosures against the Open Payments Database (OPD). AOSSM has not conducted an independent investigation on the OPD and disclaims any liability or responsibility relating thereto.