
Abstract
Background:
The healing capacity of the human glenoid labrum varies by tear location. Current evidence suggests that the healing capacity of meniscal and cartilage injuries relates to cellular composition and vascularity. However, little is known about the histological characteristics of the glenoid labrum and how they may affect healing potential in specific anatomic regions.
Hypothesis:
Regenerative characteristics of the glenoid labrum differ based on the anatomic region.
Study Design:
Descriptive laboratory study.
Methods:
Human glenoid labra from fresh unpreserved cadavers were transversely sectioned in different anatomic regions. Masson trichrome stain was used to determine dense and loose extracellular matrix regions and vessel densities. Hematoxylin and eosin, Ki-67+, and CD90+/CD105+ stains were performed to determine total, proliferative, and progenitor cell densities, respectively. Regression models demonstrated relationships between vascular area, progenitor cell quantity, and probability of successful operation.
Results:
Among all labral aspects, the superior glenoid labrum had the highest percentage (56.8% ± 6.9%) of dense extracellular matrix or avascular tissue (P < .1). The vascular region of the superior labrum had the fewest total cells (321 ± 135 cells/mm2; P < .01) and progenitor cells (20 ± 4 cells/mm2; P < .001). Vascular area was directly correlated with progenitor cell quantity (P = .006002). An increase in probability of successful operation was associated with a linear increase in vascular area (R2 = 0.765) and an exponential increase in progenitor cell quantity (R2 = 0.795). Subsequently, quadratic models of vascularity and progenitor cell quantity around the labral clock were used to assess relative healing potential. Quadratic models for percentage vascular area (P = 6.35e-07) and weighted progenitor cell density (P = 3.03e-05) around the labral clock showed that percentage vascular area and progenitor cell quantity increased as labral tissue neared the inferior aspect and diminished near the superior aspect.
Conclusion:
Anatomic regions of the glenoid labrum differ in extracellular matrix composition, vascularity, and cell composition. The superior glenoid labrum is deficient in vascularity and progenitor cells, which may explain the high failure rates for repairs in this location.
Clinical Relevance:
Improved understanding of the composition of distinct glenoid labral positions may help to improve therapeutic strategies for labral pathology.
The glenoid labrum is a hybrid of connective tissue and fibrocartilage around the glenoid. Its functions include stabilization of the humeral head, shock absorption, and attachment of stabilizing structures. Tears may be described by their position on a superimposed clockface on the glenoid (with the long head of the biceps as 12 o’clock) or by general anatomic positions, such as the anterior, superior, posterior, and inferior glenoid labrum (AGL, SGL, PGL, and IGL, respectively).20,22,23,47,59 Superior labrum anteroposterior (SLAP) tears, which occur at the superior labral aspect after trauma or repetitive motion, are among the most common labral tears, accounting for up to 80% to 90% of glenoid labral tears. 28 Bankart tears, the most common injury in the unstable shoulder,14,20 occur at the anterior or anteroinferior aspect. The reverse Bankart tear, which has variable incidence rates,20,28,46 occurs at the posterior or posteroinferior aspect. Interestingly, clinical outcomes of the IGL, AGL, and PGL are better than those of the SGL (Table 1). Patients undergoing isolated repair of the IGL, AGL, and PGL have a 90% or higher rate of return to sport,6,11,15,35,49 a 64% to 92% rate of return to preinjury level,6,11,15,49 and reoperation rates of 0% to 7.1%.2,6,11,17,35,48 This contrasts with patients undergoing SLAP repair, with a 62% to 63% rate of return to preinjury level26,56 and a reoperation rate of 28%. 53 Tears of 270° excluding the SGL have half the reoperation rate (14.2%) 10 and similar recovery to the preinjury level (60%) 51 of SLAP repairs despite being larger. The SGL also has the lowest rate of postoperative improvement of symptoms 53 compared with other positions.2,5,6,11,15,35,36
Clinical Outcomes of Labral Tears in the Different Anatomic Labral Regions
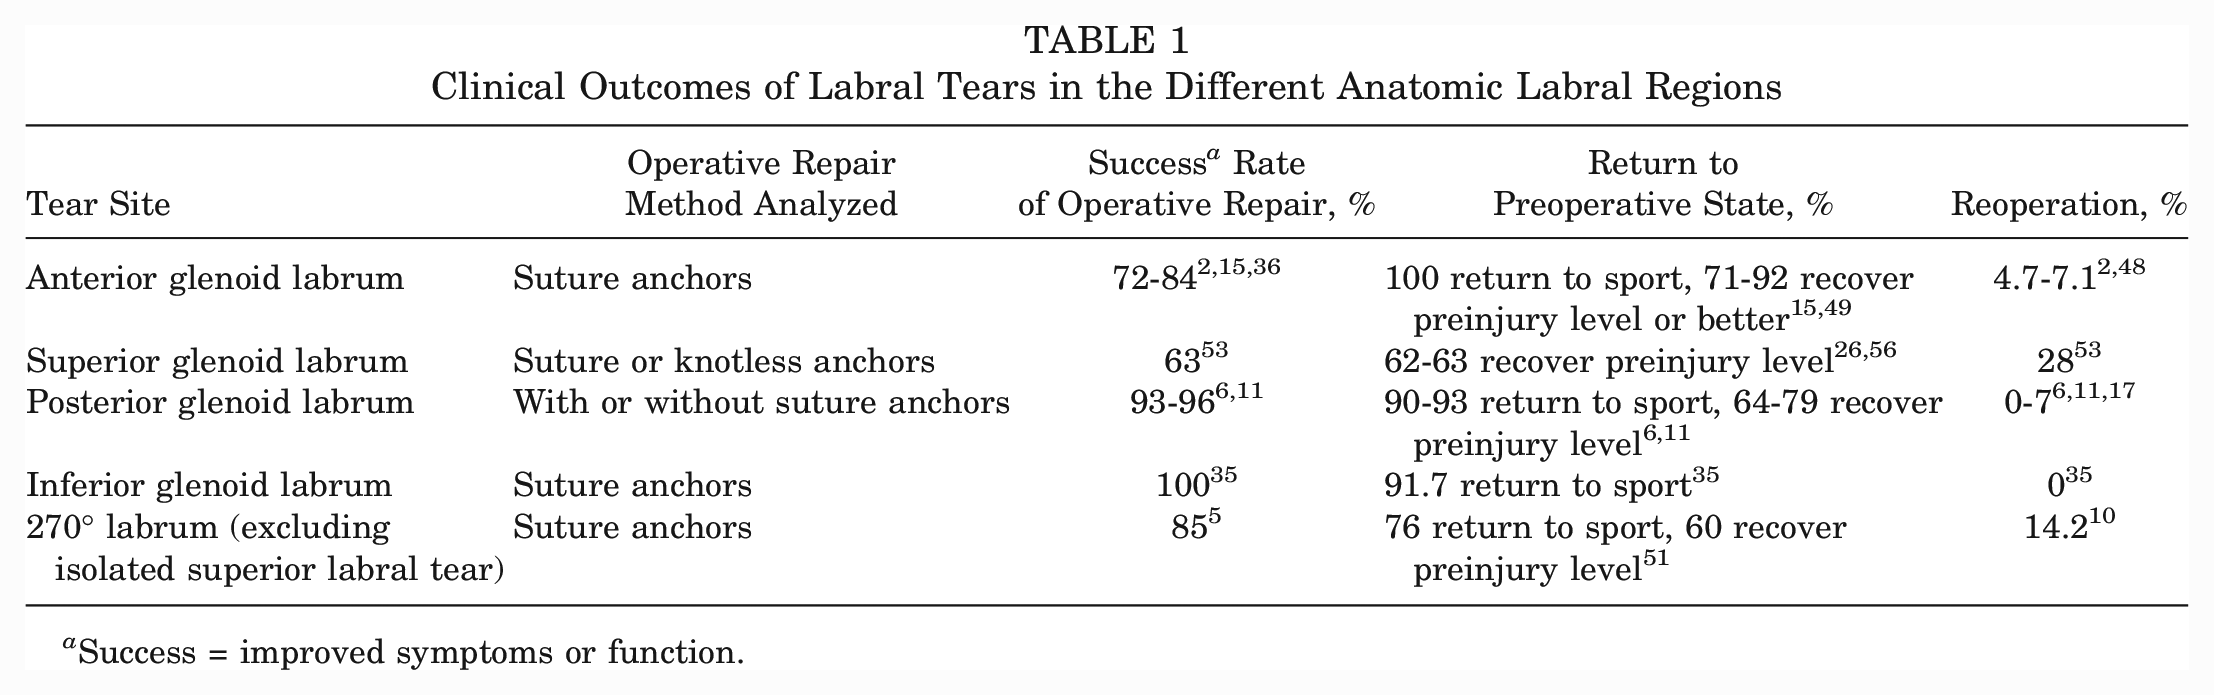
Success = improved symptoms or function.
The high failure rate of SLAP tear repairs may be due in part to the tension that the biceps tendon places on the repair site, which may interfere with healing. 55 Biceps tension has been found to cause 13 or to further aggravate SLAP tears. 34 Furthermore, the anterosuperior position has the lowest elastic modulus and yield strength in the glenoid labrum, making it more susceptible to tearing or aggravation. 59 Conversely, the IGL, which has higher elastic modulus and yield strength, 59 has the lowest reoperation rate. 35 However, these results only explain the mechanical differences at different labral aspects; comparative histological analyses are limited.
Reports about similar tissues to the glenoid labrum suggest that histological factors may also influence the healing capacity. For the meniscus, vascularity plays a substantial role in the healing outcome of a tear. Healing is best in the red-red region (most vascular), moderate in the red-white region (moderately vascular), and worst in the white-white region (avascular).7,12,37,41 While general studies on the glenoid labrum report that it has vascularized loose connective tissue on its capsular periphery3,23,32,45 and avascular fibrocartilage on its articular side,23,33,43,47 comparative studies of vasculature at different aspects are limited and not entirely consistent. One study reports lower vasculature on the superior aspects of the glenoid labrum compared with the inferior and posterior aspects. 23 Another reports that the glenoid labrum is roughly one-third avascular at every anatomic position. 47 Additional analysis on glenoid labral vascularity may help to examine the regenerative potential of different glenoid labral positions.
Vascularity may promote healing because of the supply of progenitor cells, as indicated by higher quantities of mesenchymal stem cells (MSCs) in the vascular region of the meniscus 31 and enhanced regeneration of avascular regions of the meniscus and the articular cartilage after MSC administration.19,29,42,57,61 While resident CD90+/CD105+ progenitor cells were found in the meniscus and human acetabular labrum,16,40 it is unclear whether there are differences in progenitor cell quantities between different labral aspects. No previous studies have examined progenitor cell populations in the glenoid labrum.
Finally, a dense extracellular matrix (ECM) or low interfibrillar (IF) area has been implicated to impede healing by inhibiting cell migration, such as in the mature adult meniscus.39,54 While the glenoid labrum has a loose ECM makeup on its capsular side32,45 and dense ECM adjacent to its articular surface,23,32,45 quantification of loose and dense ECM makeup has yet to be conducted at different anatomic positions of the glenoid labrum.
The purpose of this study was to investigate histological properties in different labral aspects. It was hypothesized that vascularity, ECM density, and progenitor cell density would vary based on the anatomic region and thereby affect the healing potential of each region.
Methods
Preparation of Labral Explants for Histological Evaluation
Glenoid bones with intact labrum, cartilage, and capsule were explanted from 3 human cadavers. The shoulder specimens used in this study were graciously provided by Zimmer Biomet, at the conclusion of a surgical training session to demonstrate total shoulder replacement to students with an interest in orthopaedic research or surgery. The shoulder specimens came from donors with the following demographics: 76-year-old woman, 85-year-old man, 96-year-old woman, where specimens showed no pathologies identifiable by the surgeon (J.B.). These specimens were stored, handled, and utilized in accordance with guidelines and regulations set forth by the Anatomic Board of the State of Texas (Health and Safety Code–Title 9, Chapter 691, Subchapter A). The complete labra and capsules were extracted from the bone. Explants were fixed in 4% paraformaldehyde, dehydrated, and paraffin-embedded as previously described. 3
Histological Evaluation
After the whole labrum was embedded, 7-µm transverse sections in the 12-o’clock (SGL), 3-o’clock (AGL), 6-o’clock (IGL), and 9-o’clock (PGL) locations of the labrum were sectioned and stained for all studies. For additional analysis, transverse sections from the 1:30, 4:30, 7:30, and 10:30 regions (anterosuperior, anteroinferior, posteroinferior, and posterosuperior regions, respectively) of each subject were also used (Appendix Figure A1, available in the online version of this article) for quadratic regression models to show the pattern of vasculature and progenitor cell quantity around the whole labral clock. The choice of section location was consistent across all donors. For every histological stain, data for each labral clock location and its respective regions (vascular and avascular) came from 3 subjects, each of whose data was averaged from 3 serial transverse sections (3 subjects × 3 sections per subject). Each bar of every bar graph represents the mean values for the 3 subjects, and error bars represent the standard deviation among the subject.
First, based on previous publications,54,64 Masson trichrome–stained sections were used to assess the ECM densities, revealing 2 regions in all explants: one with loosely packed collagen fibers rich in vessels and one with densely packed collagen fibers with few to no vessels. For ease of analyses, the loose and vascularized tissue region was termed the vascular region, and the dense and avascular tissue region was termed the avascular region. Specifically, stained tissues from every labral aspect had a vascular and an avascular region distinguishable by its loose ECM (>30% IF area) and dense ECM (<15% IF area), respectively; these regions were confirmed to have significantly different IF areas from each other (P < .0001) (Appendix Figure A2, available online), where percentage IF area was defined as percentage collagen negative area based on a previous publication 54 and percentage collagen positive area was calculated based on a previously cited method. 64 Using ImageJ (National Institutes of Health) “Color Deconvolution” (Masson trichrome setting), “Threshold,” and “Measure” functions, 25 we identified and calculated the percentage area of the vascular and avascular regions for each cross section. The vessel number in each region was counted using the ImageJ point tool. The vessel density was calculated by dividing the total number of vessels in a region by the region's surface area.
Next, hematoxylin and eosin–stained sections were used to examine cellularity. Cell number was measured using the ImageJ “analyze particles” function (settings: nuclei area of 12-255 µm2 for a nuclei diameter of ~4 to 18 µm, 30 circularity of 0.20-1). The total number of cells was divided by the surface area of the respective region to calculate the cell density.
Proliferative activities of different regions were identified by using immunohistochemistry staining with Ki-67 primary antibody (ab16667; rabbit anti-human; Abcam), fluorescein isothiocyanate (FITC)-conjugated goat anti-rabbit secondary antibody, and DAPI (4′,6-diamidino-2-phenylindole) counterstain, as previously published. 65 Cells positive for Ki-67, a universal marker of proliferative cells, 60 were counted using the ImageJ point tool.
CD90+/CD105 progenitor cells have been found in both the meniscus and human acetabular labrum.16,40 To examine and compare the presence of progenitor cells in different tissue regions, the tissue sections were double stained using Alexa Fluor 594 Anti-CD90 (ab202512, rabbit anti-human; Abcam) and FITC Anti-CD105 (ab53318, mouse anti-human; Abcam) and then counterstained with DAPI. The density and percentage of progenitor cells in each region were calculated as previously described. 40
Statistical Analysis
For all bar graphs except Figures 1C, 2B, and 3B, samples (subsets of data being compared with each other, as represented by each bar of the graph) had normal distributions and homogeneous variances, so the classic 1-way analysis of variance (ANOVA) and Tukey range test were used for multiple-sample analyses. For Figure 1C, the average vessel densities for loose and dense regions were compared using the Wilcoxon rank-sum test. For Figures 2B and 3B, the classic 1-way ANOVA and Tukey range test were used to compare vascular regions of all labra, and the Wilcoxon rank-sum test was used to compare vascular and avascular regions within the same type of glenoid labrum. Results were expressed as mean ± SD. A significance of 5% or 10% was used for all analyses and chosen a priori by common practice. All bar graph sample sizes were n = 3 subjects.
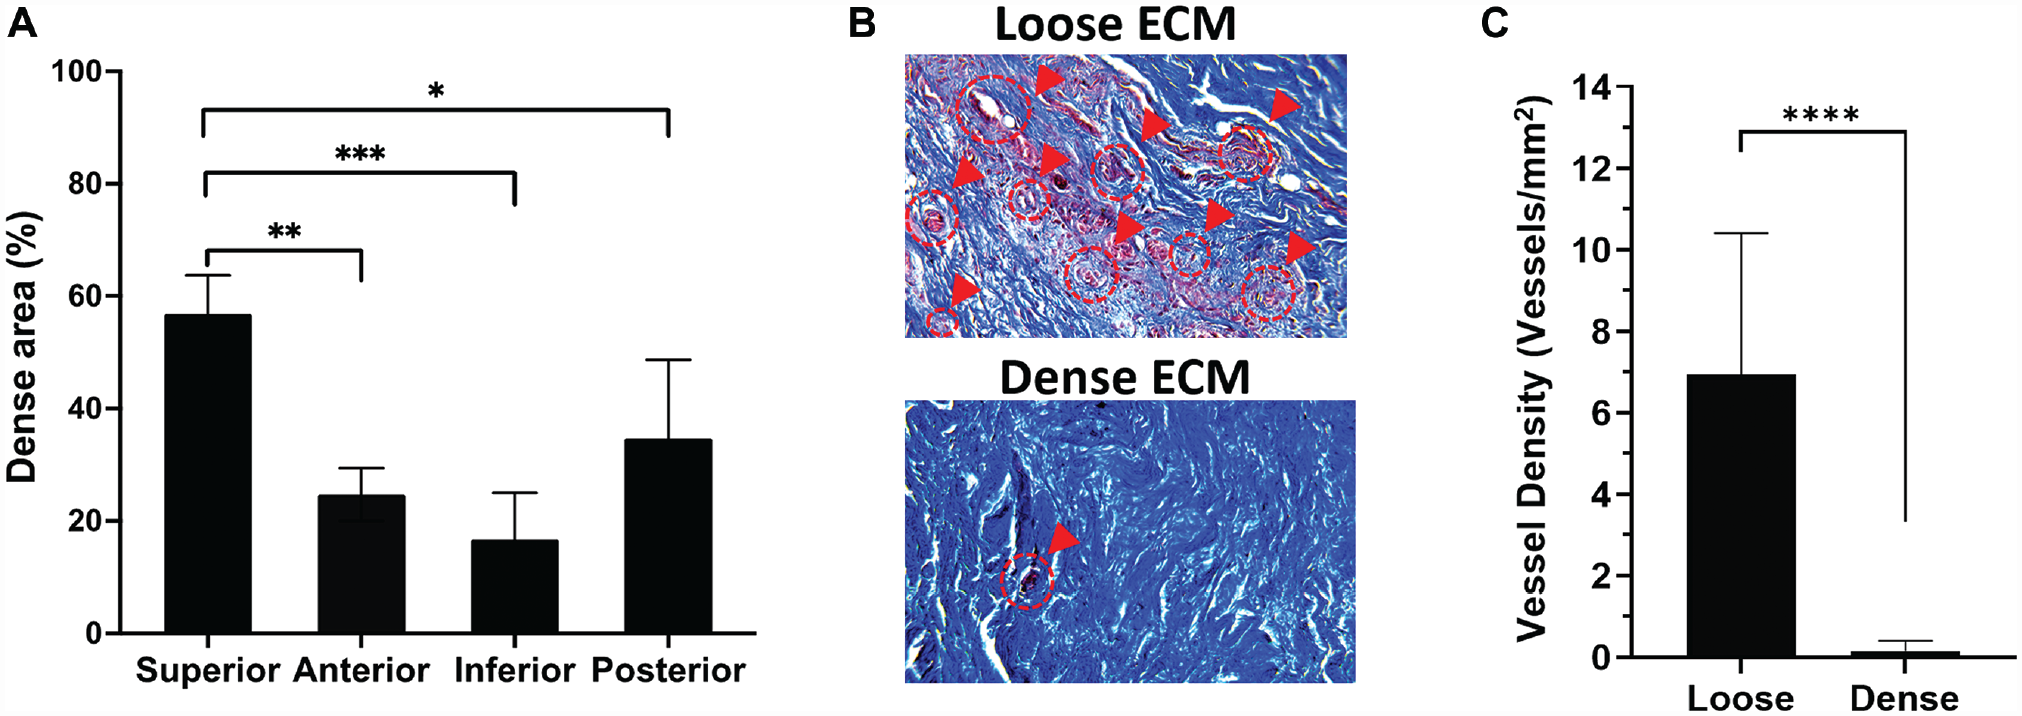
Extracellular matrix (ECM) composition in different regions of the glenoid labrum. (A) Percentage of dense tissue in each glenoid labral region. *, **, *** = P < .10, .05, .01 using 1-way analysis of variance with Tukey post hoc, respectively. (B) Masson trichrome histological images show loose and dense regions, where vasculature is marked with red circles and arrows. (C) Density of blood vessels in dense and loose regions per mm2. ****P < .001 using the Wilcoxon rank-sum test.
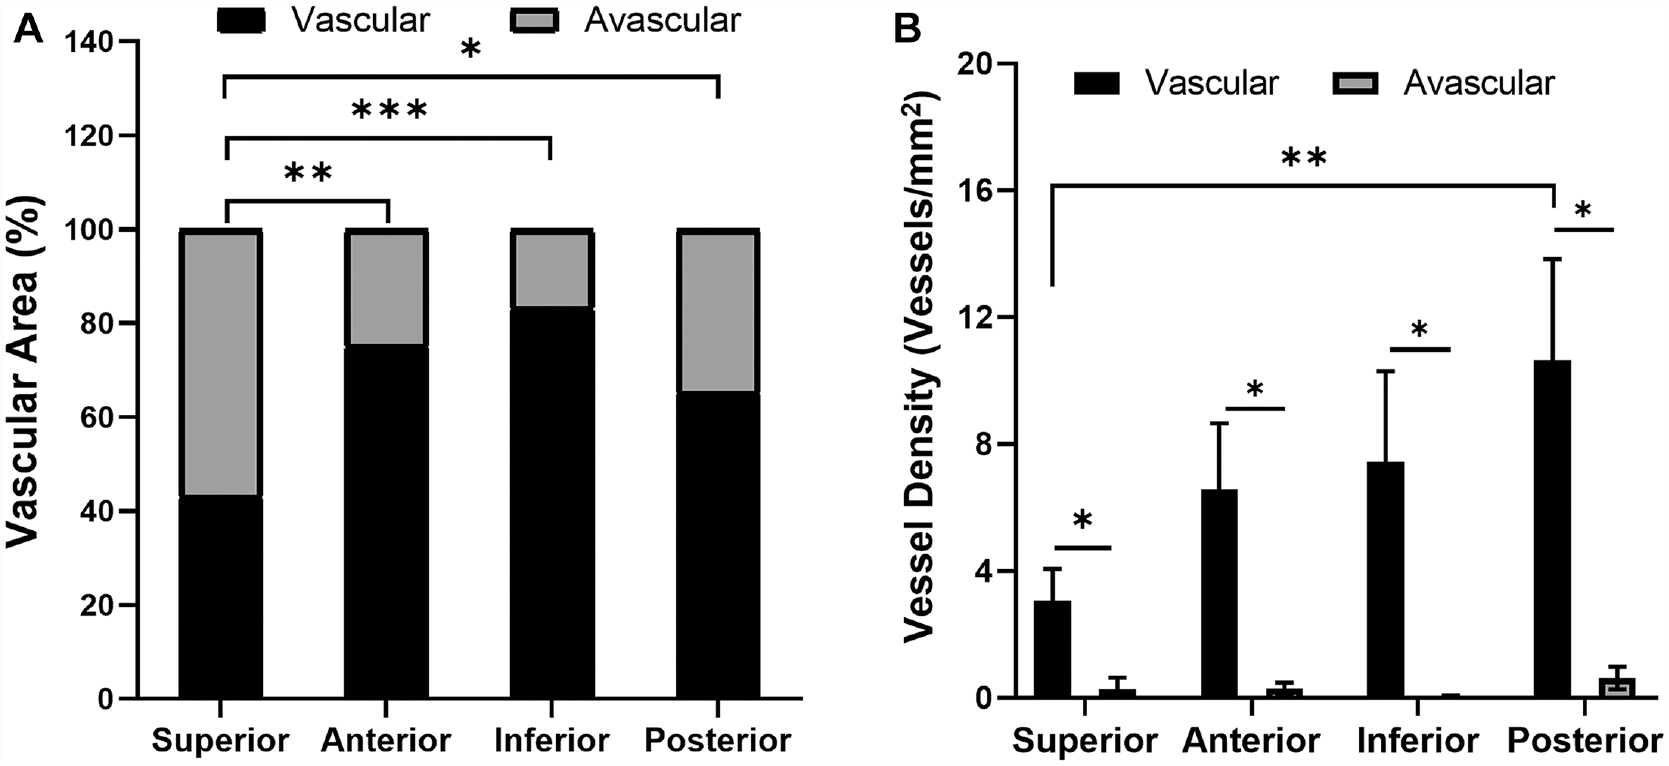
Vascularity in the different regions of the glenoid labrum. (A) Percentage of vascular and avascular regions. (B) Vessel density in the vascular and avascular areas. *P≤ .10, **P < .05, ***P < .01 using 1-way analysis of variance with Tukey for vascular region comparisons in A and B; Wilcoxon rank-sum test for vascular versus avascular comparisons in B.
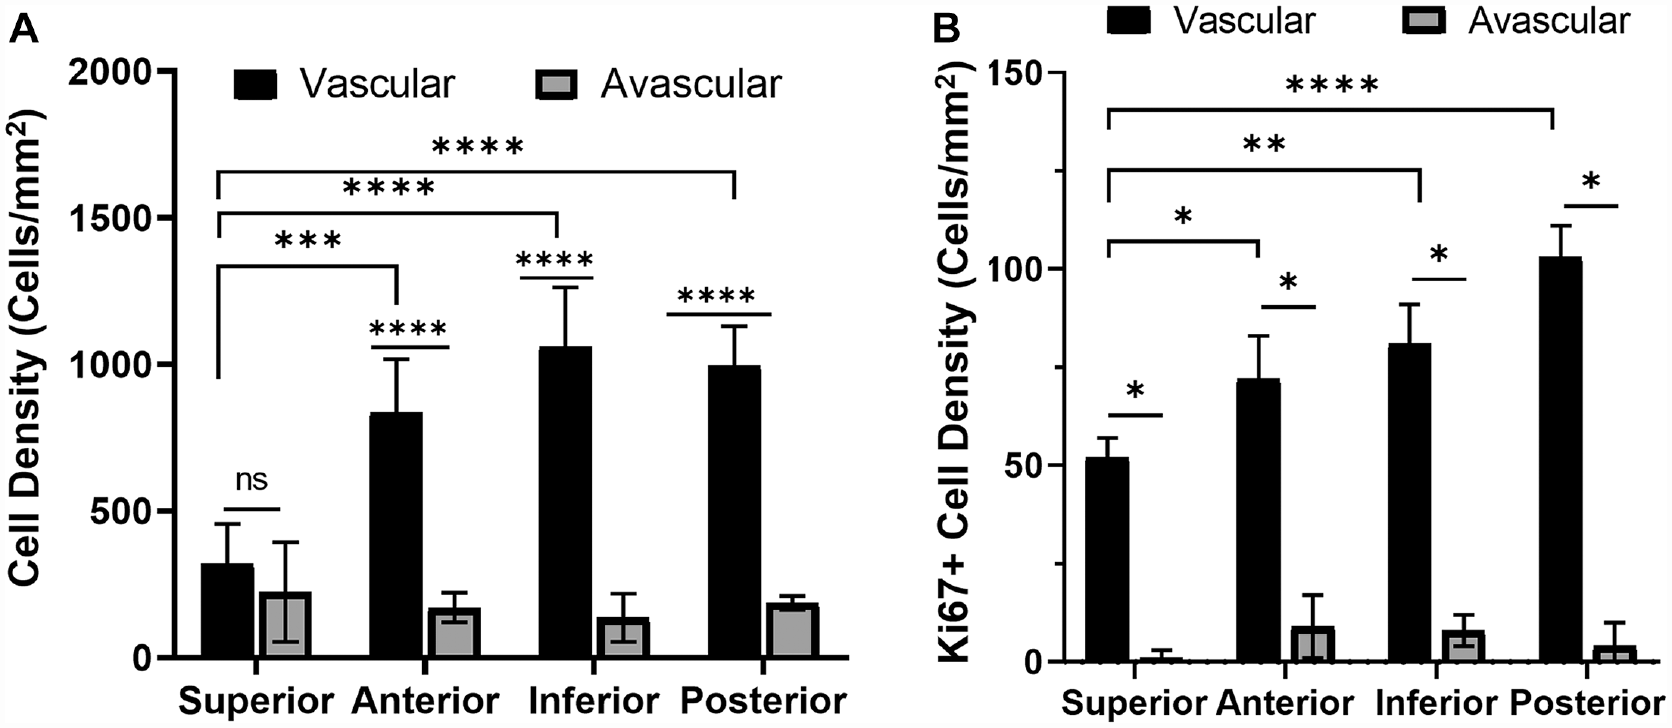
Evaluation of cell density in the glenoid labral regions. (A) Total cell density in the vascular and avascular regions. Not significant (ns) *P > .1, ***P < .01, ****P < .001 using 1-way analysis of variance (ANOVA) with Tukey post hoc for all comparisons. (B) Cell density per mm2 of proliferative cells stained by Ki-67. *P≤ .10, **P < .05, ****P < .001 using 1-way ANOVA with Tukey for vascular region comparisons and Wilcoxon rank-sum test for vascular versus avascular comparisons.
For linear regression analysis, weighted mean progenitor cell density (CD90+/105+ cells/mm2) for all labral sections (3 sections per glenoid labrum type, 12 sections total) was calculated as [(percentage vascular area) × (vascular area progenitor cell density)] + [(percentage avascular area) × (avascular area progenitor cell density)]. Weighted mean was used so that the progenitor cell densities in both vascular and avascular regions could be accounted for based on their relative tissue size. For analysis of probability of successful operation (%) versus percentage vascular area or weighted mean progenitor cell density, the probability of successful operation was calculated based on published reoperation rates for the corresponding labrum. Specifically, IGL tissues were assigned a probability of 100% based on a reoperation rate of 0%, 35 AGL tissues were assigned a probability of 95.3% based on a reoperation rate of 4.7%, 48 PGL tissues were assigned a probability of 93% based on a reoperation rate of 7%, 11 and SGL tissues were assigned a probability of 72% based on a reoperation rate of 28%. 53 It should be noted that the probability of successful operation for anterior, inferior, posterior, or superior tears mentioned in the cited papers may refer to tears that occur in a range of clock regions around the corresponding anatomic position. We first analyzed the 3-, 6-, 9-, and 12-o’clock aspects and confirmed the relationship between vascularity, progenitor cell quantity, and operational success. To account for tears occurring between the transition points studied, 4 we carried out additional vascularity and progenitor cell density analyses that also incorporated data from the 1:30, 4:30, 7:30, and 10:30 regions (anterosuperior, anteroinferior, posteroinferior, and posterosuperior regions, respectively) of each subject's labrum. Because quadratic regression has commonly been used to model vascular or cellular measurements showing nonlinear trends,1,9,27,38,63 quadratic regression models were used to show the percentage vascular area and weighted progenitor cell density anywhere in the whole labral clock.
Results
Vascular and Avascular Regions
Masson trichrome–stained sections revealed various proportions of loose and dense tissue (Figure 1A). The percentage of dense tissue was highest in the SGL (56.81% ± 6.89%), followed by the PGL 34.71% ± 13.99%), AGL (24.73% ± 4.69%), and IGL (16.68% ± 8.30%) (Figure 1A). Regarding tissue vascularity, substantially more vessels were observed in loose tissue compared with dense tissue (Figure 1B). Quantification of vessel density further confirmed this (Figure 1C).
A comparison of the extent of vascularity among different aspects of the glenoid labrum revealed that percentage vascular area was highest in the IGL (83.32% ± 8.30%), followed by the AGL (75.27% ± 4.69%) and PGL (65.29% ± 13.99%) (Figure 2A). The SGL had the significantly lowest percentage vascular area (43.19% ± 6.89%) compared with other labral aspects. As expected, a significantly greater vessel density was observed for the vascular region compared with the avascular region at each labral location (Figure 2B). However, vessel densities of most vascular regions were not significantly different. Therefore, differences in percentage of vascular area contribute the most to differences in total vasculature by region. For all positions, vessels were present along the capsular periphery, which is consistent with previous reports that labral vasculature resides on the capsular periphery.3,23
Cell Density and Distribution
For every type of glenoid labrum except the SGL, the vascular region cell density was significantly higher than (~5-8 times) that of its avascular region (Figure 3A). The SGL had the vascular region with the lowest cell density (321 ± 135 cells/mm2). While the vascular region of the AGL (836 ± 182 cells/mm2) and PGL (997 ± 133 cells/mm2) had a significantly higher cell density than the SGL, the IGL vascular region had the highest cell density of all (1062 ± 201 cells/mm2). The avascular regions of all labral aspects did not differ significantly in cell density. The proliferative Ki-67+ cell density in vascular regions was >7 times that of avascular regions (Figure 3B). At a significance level of 10%, the proliferative cell density of the SGL vascular region (52 ± 5 cells/mm2) was significantly lower than that of the AGL vascular region (72 ± 11 cells/mm2), PGL vascular region (103 ± 8 cells/mm2), and IGL vascular region (81 ± 10 cells/mm2).
Progenitor Cell Density and Percentage
Fluorescent images showed abundant CD90/CD105 progenitor cells in the IGL vascular region, but not in the IGL avascular region or the SGL vascular and avascular regions (Figure 4). When compared among all tissue regions, we find that the CD90/CD105 cell density was significantly the highest in the IGL vascular region (181 ± 27 cells/mm2). In the SGL vascular region, the progenitor cell density was ~9 times lower (20 ± 4 cells/mm2) (Figure 5A). The progenitor cell densities of the AGL vascular region (64 ± 14 cells/mm2) and PGL vascular region (46 ± 15 cells/mm2) were also significantly lower compared with that of the IGL vascular region. The IGL was also the only labral aspect showing a significant difference in the progenitor cell density among its vascular (181 ± 27 cells/mm2) and avascular (58 ± 6 cells/mm2) regions. The percentage of progenitor cells among all resident cells was highest in the IGL, where 24.73% ± 6.76% and 12.66% ± 1.49% of total cells carried progenitor cell markers in the vascular and avascular regions, respectively (Figure 5B). The SGL had the lowest percentage of progenitor cells in both its vascular (4.72% ± 2.38% cells) and its avascular (3.03% ± 2.59% cells) regions. The AGL and PGL had moderate progenitor cell densities, with 9.09% ± 2.35% and 7.01% ± 5.44% progenitor cells for the AGL vascular and avascular regions, respectively, and 9.12% ± 2.95% and 8.36% ± 5.19% progenitor cells for the PGL vascular and avascular regions, respectively.
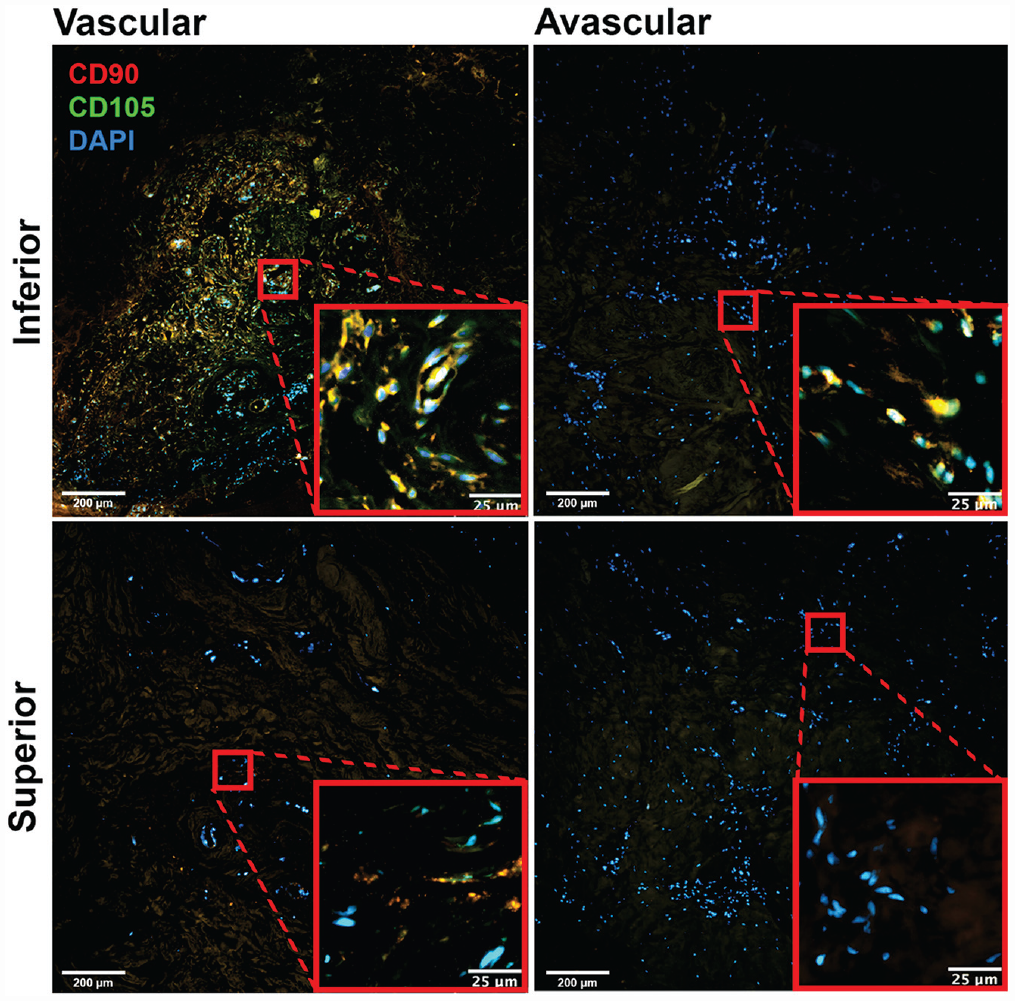
Representative images of CD90 and CD105 double staining in the vascular and avascular zones of the inferior and superior glenoid labra (10×). DAPI, 4′,6-diamidino-2-phenylindole.
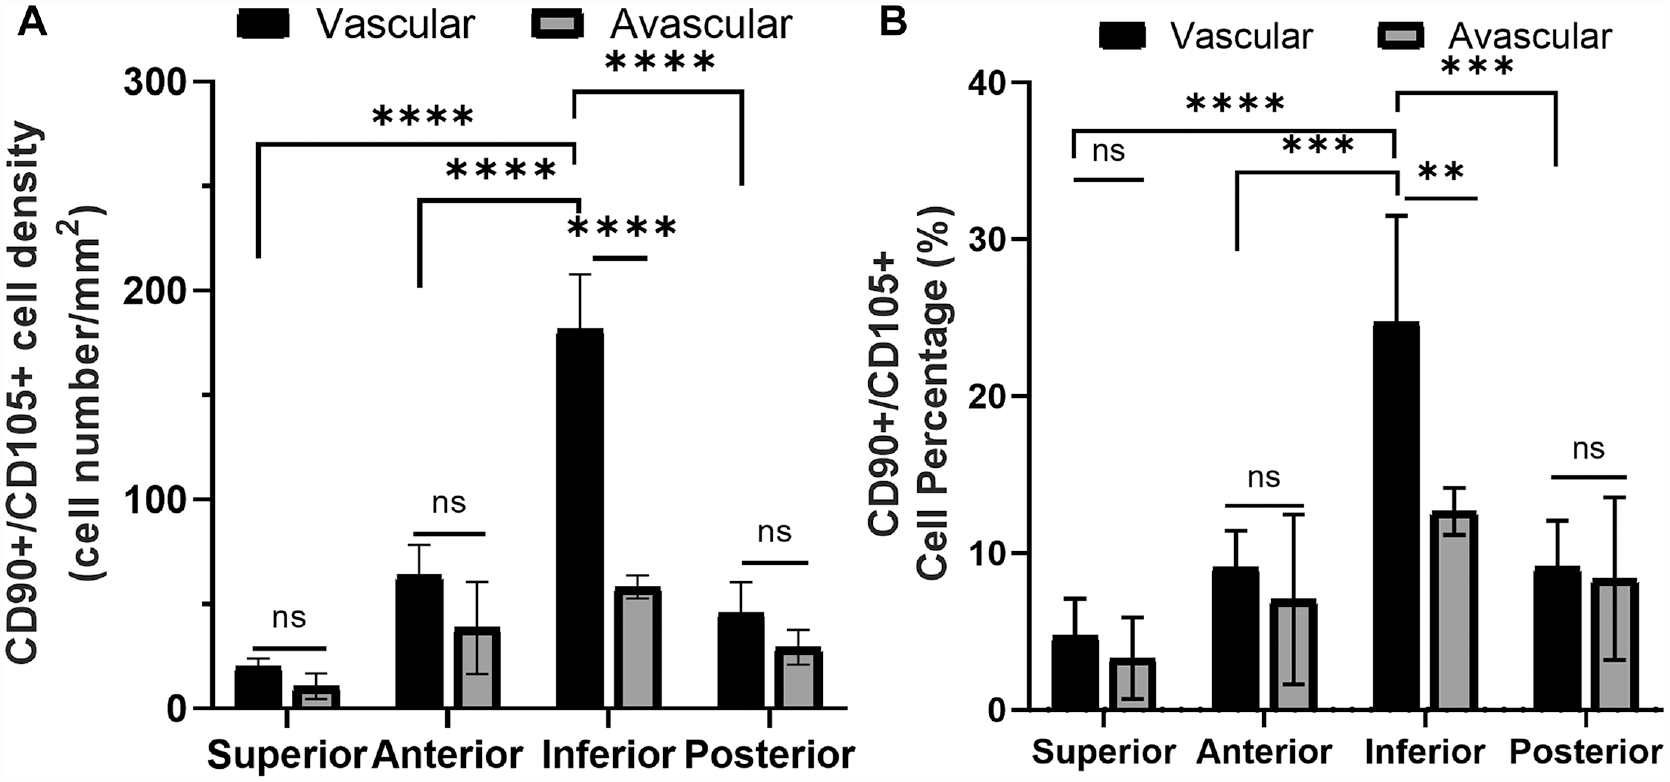
Characterization of progenitor cells in the vascular and avascular regions. (A) CD90+/CD105+ progenitor cell density and (B) percentage of CD90+/CD105+ progenitor cells in different regions. Not significant (ns) *P > .10, **P < .05, ***P < .01, ****P < .001, using 1-way analysis of variance with Tukey post hoc for all comparisons.
Relationships Between Vascularity, Progenitor Cell Quantity, and Operative Success
It was observed that the labra with higher proportions of vascularized tissue (% vascular area) contained more progenitor cells. To analyze such a relationship, a linear regression between the percentage vascular area of each labral section and its respective weighted mean progenitor cell density was performed (Figure 6A). Percentage vascular area was a strong predictor of progenitor cell density (P < .01) (Figure 6A). The linear relationship was moderate, as indicated by an R2 value of 0.5466.
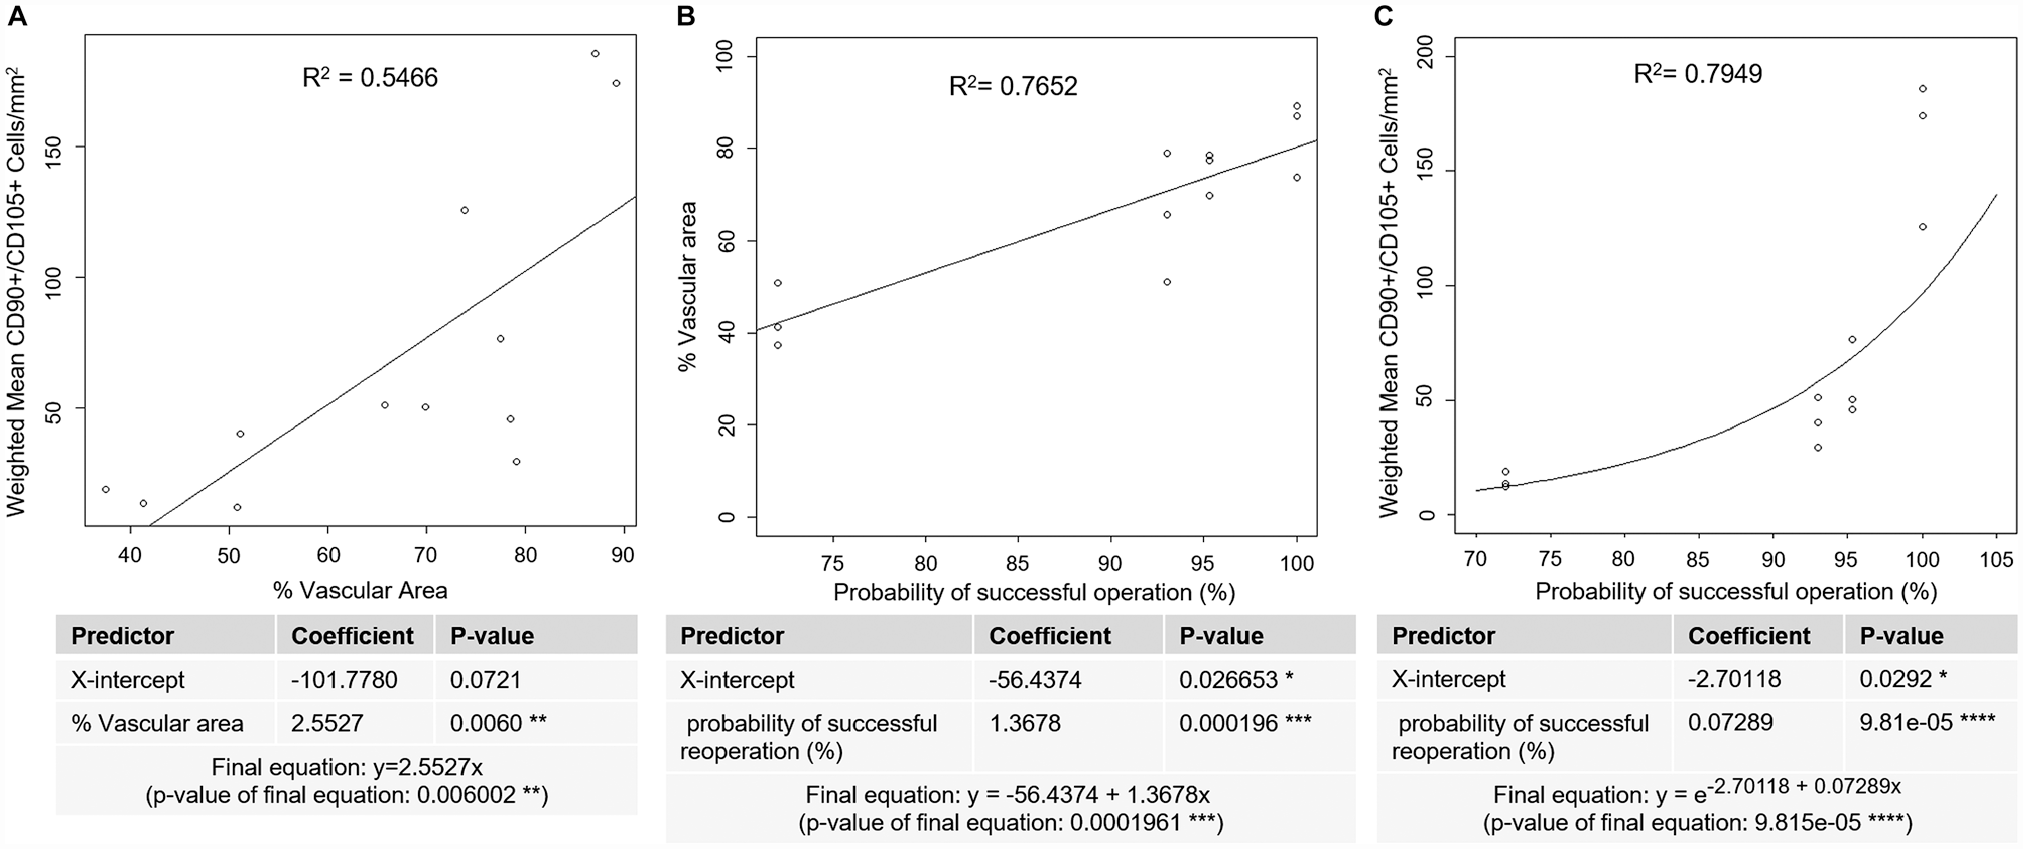
Regression analyses to assess relationships between vascularity, progenitor cell quantity, and probability of successful operation. (A) Linear regression analysis relating vascular area to progenitor cell quantity. **P < .01. (B) Linear regression analysis relating probability of successful operation (%) to percentage vascular area. *P < .05, ***P < .001. (C) Exponential regression analysis relating probability of successful operation (%) to weighted mean progenitor cell density. *P < .05, ****P < .0001.
To measure the relationship between vascularity and the healing outcome, a linear regression between probability of successful operation and percentage vascular area showed that a higher probability of successful operation was associated with higher vasculature (Figure 6B). There was a strong linear fit between probability of successful operation and percentage vascular area with an R2 value of 0.7652 (Figure 6B). Furthermore, the probability of successful operation was significantly correlated with percentage vascular area, with a coefficient P < .001 (Figure 6B).
Further analyses were conducted to determine the relationship between probability of successful operation and weighted mean progenitor cell density (Figure 6C). We use exponential regression rather than linear regression because progenitor cells must proliferate to repair damaged tissue, and cell proliferation generally follows an exponential model. 24 Weighted mean progenitor cell density increased exponentially as the probability of successful operation increased (Figure 6C). There was a strong exponential relationship between probability of successful operation and weighted mean progenitor cell density with an R2 value of 0.7949 (Figure 6C). Furthermore, the probability of successful operation was significantly correlated with progenitor cell quantity, with a coefficient P < .0001 (Figure 6C).
Pattern of Vascularity and Progenitor Cell Quantity Throughout the Whole Labral Clock
While previous analyses were conducted at the main transition points of the labral clock (anterior, inferior, posterior, superior), variability of labral pathologies means that tears may also occur anywhere between these points. 4 Because we have found that percentage vascular area and weighted progenitor cell density are positively correlated with operational success, quadratic regression models were used to analyze vascular area and weighted progenitor cell density at the following clock regions of labra: 0:00, 1:30, 3:00, 4:30, 6:00, 7:30, 9:00, 10:30, and 12:00 (same as 0:00). At a significance level of 5%, statistically significant quadratic regression models may indeed be fitted into data to show the trend of percentage vascular area around the clock (P = 6.347e-07) (Figure 7A) and weighted progenitor cell density around the clock (P = 3.029e-05) (Figure 7C). Radial histograms clearly show that the percentage vascular area increases as the labral location is closer to the inferior labral aspect and decreases as the labral location is closer to the superior labral aspect (Figure 7B). Similarly, weighted progenitor cell density increases significantly toward the inferior labral aspect and extensively decreases closer to the superior labral aspect (Figure 7D).
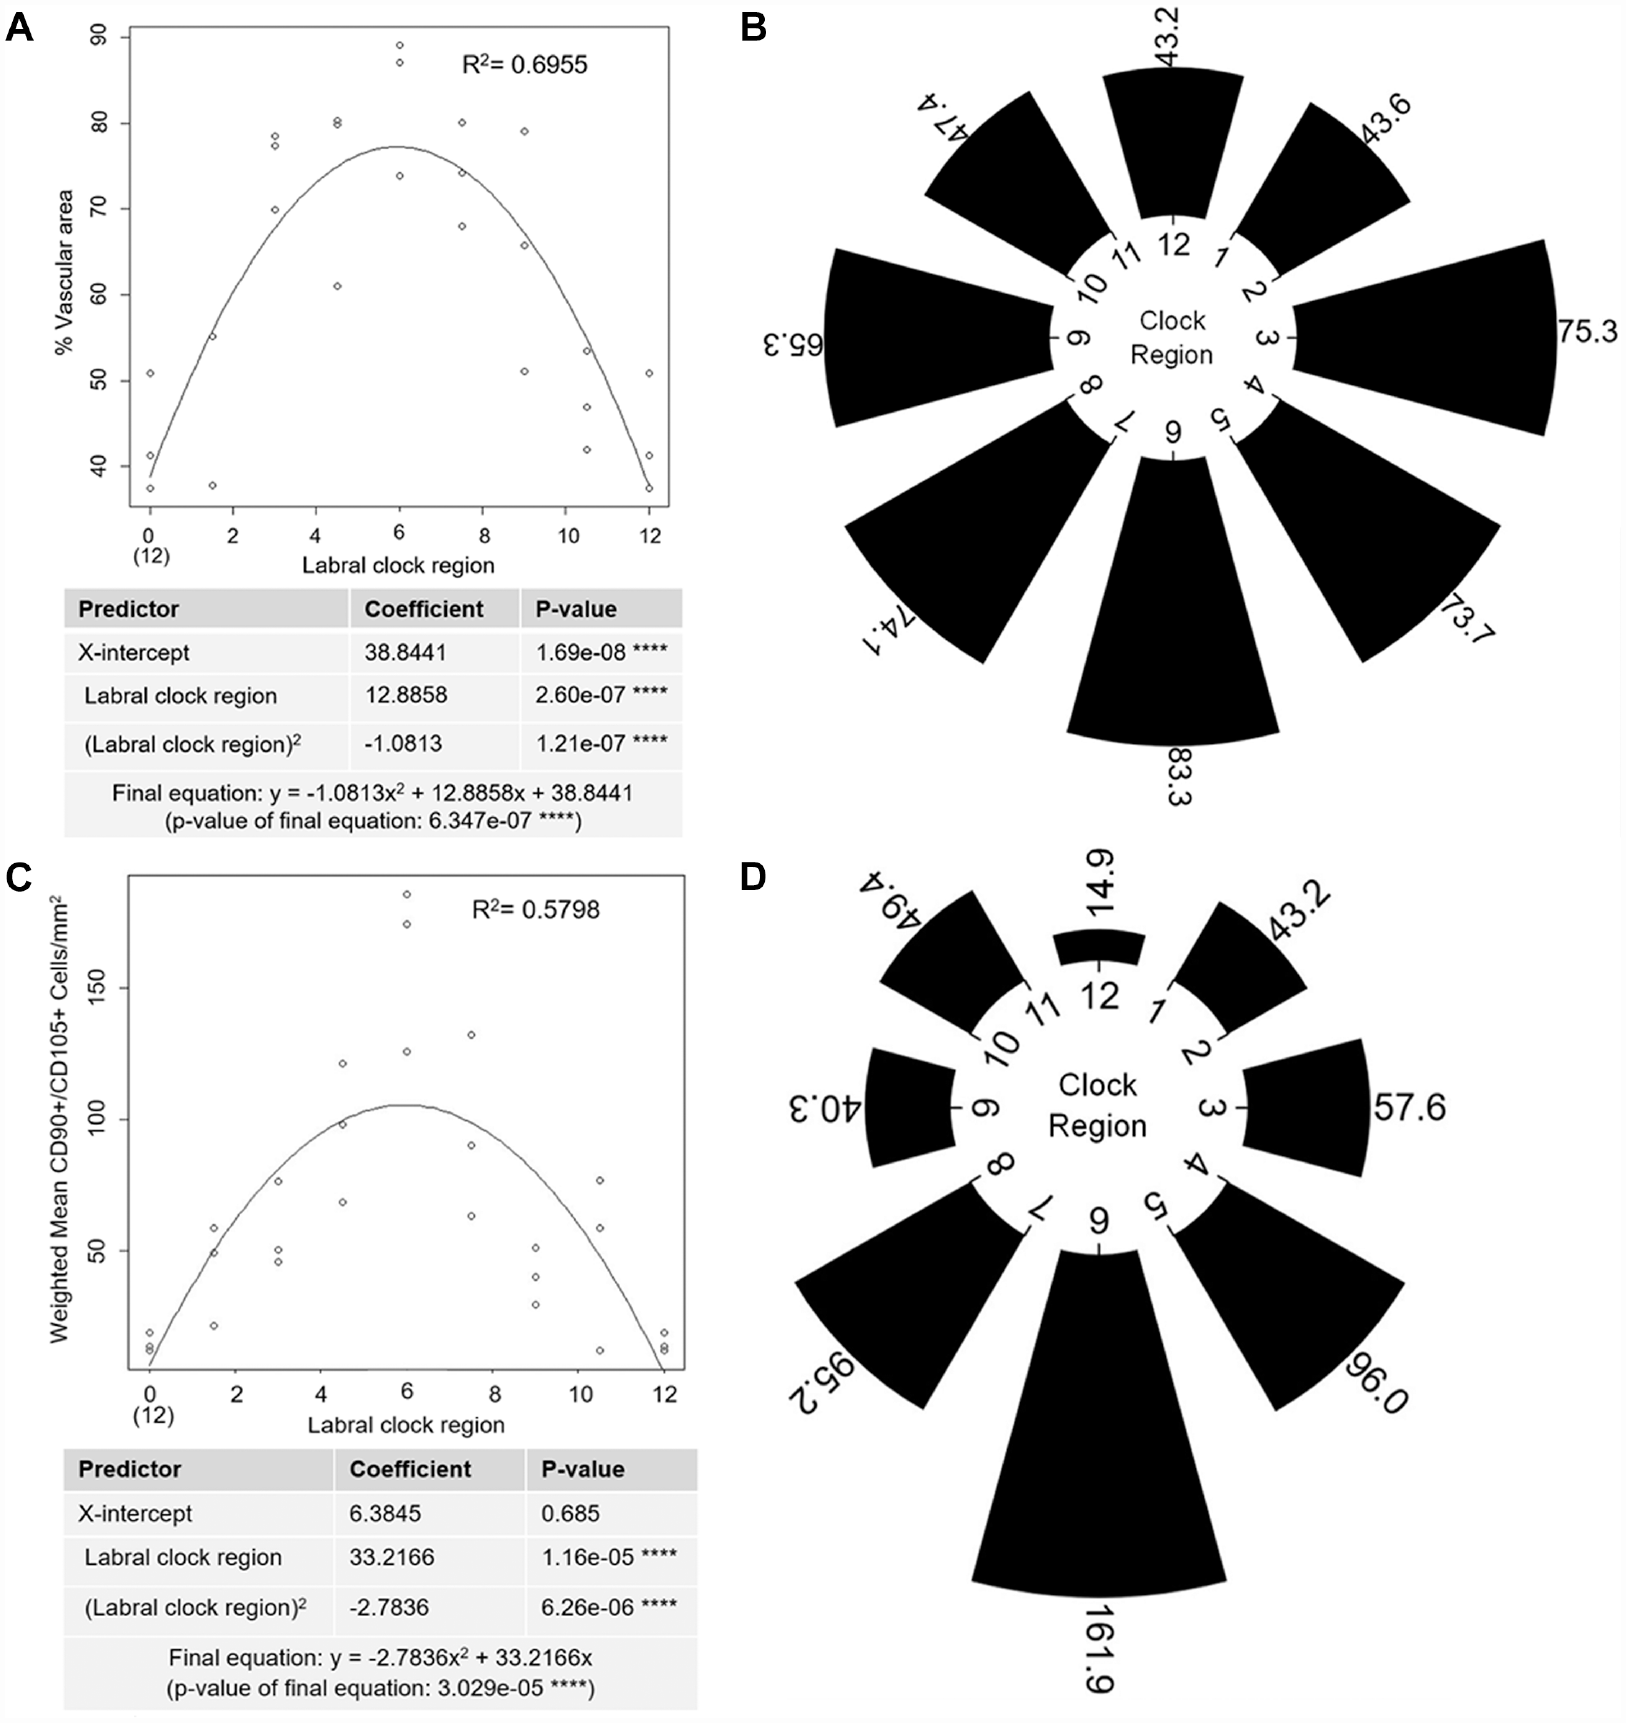
(A) Quadratic regression analysis relating clock regions of the glenoid labrum to percentage vascular area. ****P < .0001. (B) Mean percentage vascular area around the labral clock presented as a radial histogram. (C) Quadratic regression analysis relating clock regions of the glenoid labrum to weighted progenitor cell density. ****P < .0001. (D) Weighted mean progenitor cell density around the labral clock presented as a radial histogram.
Subject-to-Subject Consistency
The subject-to-subject consistency of the histological observations has also been analyzed. We found that for all 3 subjects, the SGL had a significantly greater proportion of dense ECM compared with other aspects (Appendix Figure A3A, available online), and the loose ECM of the labrum had a significantly greater vessel density than the dense ECM (Appendix Figure A3B, available online). Similarly, for all 3 subjects, the SGL showed a significantly lower percentage of vascular area than other labral aspects (Appendix Figure A4A, available online), the vascular area of each labral aspect had a significantly greater vessel density than its avascular area (Appendix Figure A4B, available online), and the vascular area of the SGL had a lower vessel density than that of other labral aspects (Appendix Figure A4B, available online). Consistently among all subjects, the vascular area had a significantly greater total cell density than the avascular area for all but the SGL (Appendix Figure A5A, available online), the vascular area of the SGL had a significantly lower cell density than that of other labral aspects (Appendix Figure A5A, available online), and the vascular area of each labral aspect had significantly more Ki-67+ cells than its avascular aspect (Appendix Figure A5B, available online). Finally, for all subjects, the vascular area had a significantly greater number and percentage of progenitor cells than the avascular area only at the IGL (Appendix Figure A6, A and B, available online), and the vascular area of the IGL had a significantly greater number and percentage of progenitor cells than all other labral aspects (Appendix Figure A6, A and B, available online).
Discussion
The main finding of this study is that vasculature and progenitor cell quantity vary at different aspects of the glenoid labrum. The results are consistent with the differences observed among the labral regions in terms of clinical outcomes and failure rates of repair. The IGL was found to have the largest proportion of vascular tissue and the highest progenitor cell density. This is in line with the previous finding that the IGL has the lowest reoperation rate. 35 Conversely, the SGL—the area with the highest reoperation rate after repair 53 —had the smallest proportion of vascular tissue and lowest progenitor cell density. This is consistent with a report that the superior aspects of the glenoid labrum are less vascular compared with other aspects of the glenoid labrum, such as the IGL. 23 The higher vascularity of nonsuperior positions of the glenoid labrum could be linked to their firm attachment to the glenoid capsule, which is the source of blood supply to the labrum.23,52 The SGL, in contrast, is loosely attached to the capsule.21,22 Most of its mass is instead attached to the avascular long head of the biceps tendon.23,47,52 The blood supply to the superior region may be hindered further with an increasing detachment from the capsule, especially with age. 21
Linear regression analysis revealed that a greater percentage of vascular area was associated with increased progenitor cell quantity. An increase in percentage of vascular area and weighted mean progenitor cell density was observed for labral tissues with higher probability of successful operation. This is consistent with literature showing that poor vascularity and progenitor cell content are associated with poor clinical outcomes for the white-white region of the meniscus7,12,31,37,41 and for articular cartilage that has not been treated by progenitor cells.42,61 Thus, a lower proportion of vascularized tissue and, subsequently, a lower overall supply of progenitor cells may lower the regenerative potential of the SGL and contribute to higher failure rates for SLAP repairs.
These results suggest that all labral tissues— especially the poorly vascularized SGL—may benefit from specialized treatments to improve their vasculature or progenitor cell content. For example, growth factors such as vascular endothelial growth factor for blood vessel formation 58 and platelet-derived growth factor or fibroblast growth factor–2 for MSC proliferation44,66 can be incorporated into surgical sutures using hydrogels or nanoparticles to promote localized and controlled increase in blood supply and endogenous cells at the labral tear site. For the relatively avascular and acellular SGL, direct delivery or recruitment of stem cells at the tear site may be considered, as stem cell therapy has been shown to enhance the healing of tissues with low vascularity and progenitor cell content.19,29,42,57,61 Cell-free strategies such as microfracture treatment may also boost SGL healing outcomes. While microfracture treatment in cartilage has been shown to generate fibrocartilage, which is not native to cartilage, 10 this treatment may have better outcomes in the labrum than in cartilage because fibrocartilage is native to the labral tissue.
In addition to suggested treatments to improve vascularity and progenitor cell quantity, recent studies suggest that biceps tenotomy or biceps tenodesis may improve healing specifically for the SGL.50,55 While it is understood how a biceps tenotomy or biceps tenodesis mechanically improves SLAP repair outcomes, it is not understood how the procedures affect the inherent regenerative potential of the SGL. We have observed that the SGL has the greatest proportion of dense ECM, which is known to interfere with cell migration and healing in the mature meniscus.39,54 The results support the theory that the SGL has developed greater collagen density compared with the rest of the labrum in response to tension from the connecting biceps tendon. While anywhere from one-half to two-thirds of the biceps tendon originates from the supraglenoid tubercle, most of the rest is attached to the SGL,8,62 allowing it to exert tensile stresses that trigger ECM production. 18 Despite increased ECM density in the SGL, inherent anatomic variants such as superior labral clefts or foramens allow the SGL to remain loosely attached to the glenoid rim compared with other labral aspects. 8 Thus, the SGL has poor clinical outcomes not only because of anatomic variants that make it more prone to tearing, but also because it is less prone to healing after tearing. Removing biceps tension from the SGL with a biceps tenotomy or biceps tenodesis may reduce the ECM density of the SGL, thereby facilitating cell migration and vessel infiltration. This is supported by the finding that fibroblasts in tissue models downregulate ECM synthesis and upregulate collagenase upon removal of tensile stress. 18 Further studies are needed to test if the SGL undergoes similar ECM remodeling after biceps tenotomy or biceps tenodesis.
This study not only bolsters support for certain treatment options (eg, growth factor or stem cell therapies, biceps tenotomy or tenodesis), but also provides insight into clinical prognoses. After confirming that operational success is positively correlated with vascularity and progenitor cell quantity, our study also showed that labral tissue increases in percentage of vascular area and progenitor cell quantity as it nears the inferior aspect. Thus, the relative healing potential of torn labra may be predicted based on their anatomic regions.
Our study has several limitations. First, the use of cadaveric samples has inherent limitations such as anatomic/tissue variation and sample size. Second, our data are limited regarding the background information of the available specimens, which may have affected the results because vascularity, progenitor cell distribution, and ECM density may differ with age and/or health status. The inclusion of control specimens presenting with labral tears or labral tear repair would garner more representative results on the target population. Additionally, the presence of such vascularity and progenitor cell density in labral tissue does not demonstrate the functionality of such properties. Further confirmation of the results with functional studies (cellular responses) is needed. Nonetheless, our specimens were fresh-frozen samples, which allowed us to analyze maintained tissue structure and integrity that otherwise may have been altered if subjected to previous preservation. Another limitation is that only 3 human cadavers were used. Although a larger sample size would strengthen the study and may be considered for future studies, the results are valid because of consistency among all subjects. Specifically, when all results were divided by subject, all 3 subjects consistently showed the same trends in ECM density, vascularity, and cellularity at different labral aspects. All these similarities occurred even though the donors had different descriptive features, such as ages ranging from 76 to 96 years old and inclusion of both sexes. While the potential influence of age or sex on labral characteristics has yet to be determined in depth, the findings present here should reflect a general pattern in human labral physiology.
Conclusion
Our results were able to demonstrate the anatomic differences in the different regions of the glenoid labrum. The IGL was found to have the largest proportion of vascular area along with the highest progenitor cell density. On the other hand, the SGL had the smallest vascular area and the lowest progenitor cell density. These histological results align with reported clinical outcomes and shed light on the possible underlying reasons for the high reoperation rate after surgery for SGL tears.
Supplemental Material
sj-pdf-1-ajs-10.1177_03635465231171680 – Supplemental material for Histological Analysis of Regenerative Properties in Human Glenoid Labral Regions
Supplemental material, sj-pdf-1-ajs-10.1177_03635465231171680 for Histological Analysis of Regenerative Properties in Human Glenoid Labral Regions by Le Q. Hoang, Bhavya Vaish, Samira Izuagbe, Cynthia M. Co, Joseph Borrelli, Peter J. Millett and Liping Tang in The American Journal of Sports Medicine
Footnotes
Submitted September 30, 2022; accepted March 9, 2023.
One or more of the authors has declared the following potential conflict of interest or source of funding: The shoulder specimens used in this study were graciously provided by Zimmer Biomet. L.T. has a potential financial interest with Progenitec Inc. A management plan has been created to preserve objectivity in research in accordance with the University of Texas at Arlington's policy. P.J.M. has received consulting fees, speaking fees, and royalties from Arthrex. AOSSM checks author disclosures against the Open Payments Database (OPD). AOSSM has not conducted an independent investigation on the OPD and disclaims any liability or responsibility relating thereto.
References
Supplementary Material
Please find the following supplemental material available below.
For Open Access articles published under a Creative Commons License, all supplemental material carries the same license as the article it is associated with.
For non-Open Access articles published, all supplemental material carries a non-exclusive license, and permission requests for re-use of supplemental material or any part of supplemental material shall be sent directly to the copyright owner as specified in the copyright notice associated with the article.