
Abstract
Background:
Previous research has demonstrated clear associations between specific running injuries and patterns of lower limb kinematics. However, there has been minimal research investigating whether the same kinematic patterns could underlie multiple different soft tissue running injuries. If they do, such kinematic patterns could be considered global contributors to running injuries.
Hypothesis:
Injured runners will demonstrate differences in running kinematics when compared with injury-free controls. These kinematic patterns will be consistent among injured subgroups.
Study Design:
Controlled laboratory study.
Methods:
The authors studied 72 injured runners and 36 healthy controls. The injured group contained 4 subgroups of runners with either patellofemoral pain, iliotibial band syndrome, medial tibial stress syndrome, or Achilles tendinopathy (n = 18 each). Three-dimensional running kinematics were compared between injured and healthy runners and then between the 4 injured subgroups. A logistic regression model was used to determine which parameters could be used to identify injured runners.
Results:
The injured runners demonstrated greater contralateral pelvic drop (CPD) and forward trunk lean at midstance and a more extended knee and dorsiflexed ankle at initial contact. The subgroup analysis of variance found that these kinematic patterns were consistent across each of the 4 injured subgroups. CPD was found to be the most important variable predicting the classification of participants as healthy or injured. Importantly, for every 1° increase in pelvic drop, there was an 80% increase in the odds of being classified as injured.
Conclusion:
This study identified a number of global kinematic contributors to common running injuries. In particular, we found injured runners to run with greater peak CPD and trunk forward lean as well as an extended knee and dorsiflexed ankle at initial contact. CPD appears to be the variable most strongly associated with common running-related injuries.
Clinical Relevance:
The identified kinematic patterns may prove beneficial for clinicians when assessing for biomechanical contributors to running injuries.
Keywords
Running is an increasingly popular method of physical activity; however, it also poses a risk of injuries to the musculoskeletal system. It has been reported that approximately 50% of runners become injured annually, with 25% injured at any one time. 13 The majority of running-related injuries are considered to be overuse injuries, with the most frequently injured sites including the knee, foot, and lower leg, with incidence rates reported of around 50%, 39%, and 32%, respectively. 46 Less common injury sites include the ankle and lower back, as well as the hip and pelvis, with incidence rates ranging from 4% to 16%, 5% to 19%, and 3% to 11%, respectively. 45 Of all running-related injuries, the most frequently cited injuries include patellofemoral pain (PFP), iliotibial band syndrome (ITBS), medial tibial stress syndrome (MTSS), Achilles tendinopathy (AT), plantar fasciitis, stress fractures, and muscle strains.24,44 Many of these injuries are known to have high recurrence rates, leading to a reduction or cessation of training in approximately 30% to 90% of cases. 47 The factors related to the development of running-related injuries are multifactorial and diverse; however, it is widely accepted that abnormal running kinematics play a role.1,7,31
There has been a large amount of research that has sought to identify the kinematic patterns associated with many common soft tissue running injuries, including MTSS, 26 PFP,32,52 ITBS,12,31 and AT. 39 Interestingly, many of these studies have reported similar kinematic patterns to be associated with different running injuries. For example, increased hip adduction has been associated with PFP32,52 and ITBS,12,31 and increased hip internal rotation has been associated with PFP 41 and MTSS. 26 Research has also suggested that because of kinematic coupling between the femur, knee, and foot, increased hip adduction or hip internal rotation may contribute to greater rearfoot eversion.2,27,38 Interestingly, increased rearfoot eversion has been associated with injuries such as MTSS3,50 and AT. 39 This research suggests that there may be a number of similar kinematic patterns that could underlie multiple different soft tissue running injuries. It is possible that these patterns could lead to elevated stress on multiple anatomic structures, leading to the development of injuries at different areas. These kinematic patterns may represent global contributors to injuries.
Recent research supports the idea of biomechanical parameters that could be considered global contributors to running injuries. In a prospective study of 249 runners, Davis et al 7 reported that runners who went on to develop a range of different injuries demonstrated significantly elevated vertical loading rates. However, in a retrospective study that investigated runners with AT and MTSS, Becker et al 3 reported greater rearfoot eversion in the late stance phase to be a characteristic consistently associated with an injury. Although these 2 studies provide preliminary evidence for the existence of global contributors to running injuries, Davis et al 7 did not include kinematic data, while Becker et al 3 investigated only MTSS and AT. Therefore, further research is required to understand whether there are similar kinematic patterns that may underlie multiple different running injuries. This understanding would be invaluable to clinicians as it could be used as a basis for both screening techniques and preventative and rehabilitative programs.
The aim of this current study was to identify whether there are kinematic parameters that may represent global kinematic contributors to running injuries. To achieve this objective, we sought to identify whether there are differences in running kinematics between a large group of runners with common running injuries (ITBS, PFP, MTSS, and AT) compared with a healthy control group. We hypothesized that the pooled group of injured runners would demonstrate greater contralateral pelvic drop (CPD), hip adduction, and rearfoot eversion when compared with injury-free controls. We also hypothesized that these kinematic patterns would be consistent among injured subgroups.
Methods
Participants
A total of 108 runners were enrolled in this current study, including 72 injured runners (28 male, 44 female) and 36 healthy controls (15 male, 21 female) matched for age, height, and weight (Table 1). The injured group contained subgroups of 18 runners each with PFP, ITBS, MTSS, and AT (Table 2). These injuries were selected as they are cited as the most prevalent soft tissue overuse running injuries. 24 An a priori sample size calculation was conducted using data from a previous study reporting kinematic differences between healthy and injured runners. 32 Using G*Power software, we calculated that we would need at least 98 people (65 injured) to detect an effect size of 0.75 with a power of 0.85 and a critical alpha of .01. Participants were recruited via poster advertisements at local running clubs and sports injury clinics. All participants provided written informed consent before participation, and ethical approval was obtained via the local ethics committee.
Participant Characteristics a
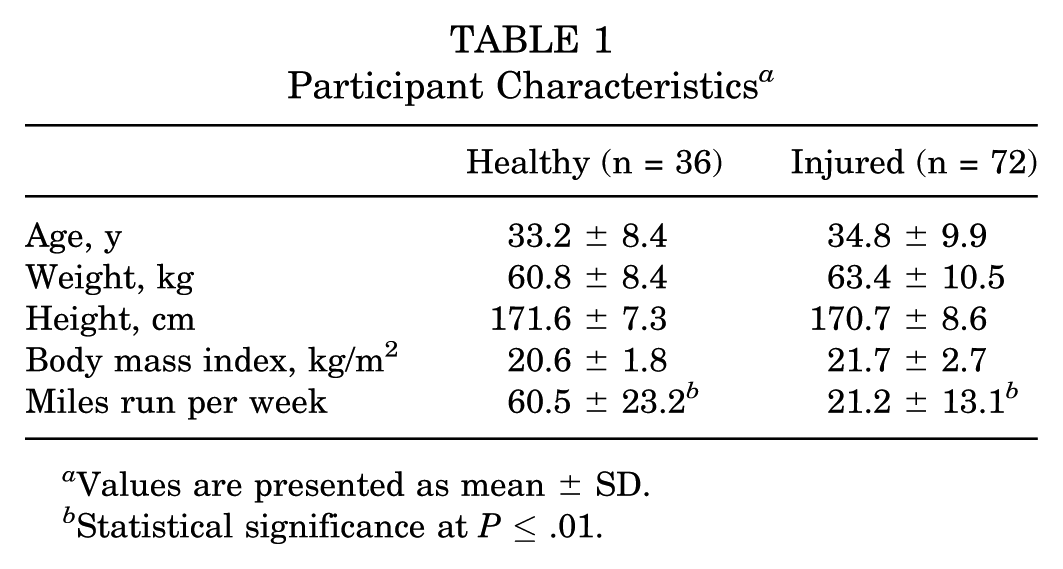
Values are presented as mean ± SD.
Statistical significance at P ≤ .01.
Characteristics of Injured Subgroups a
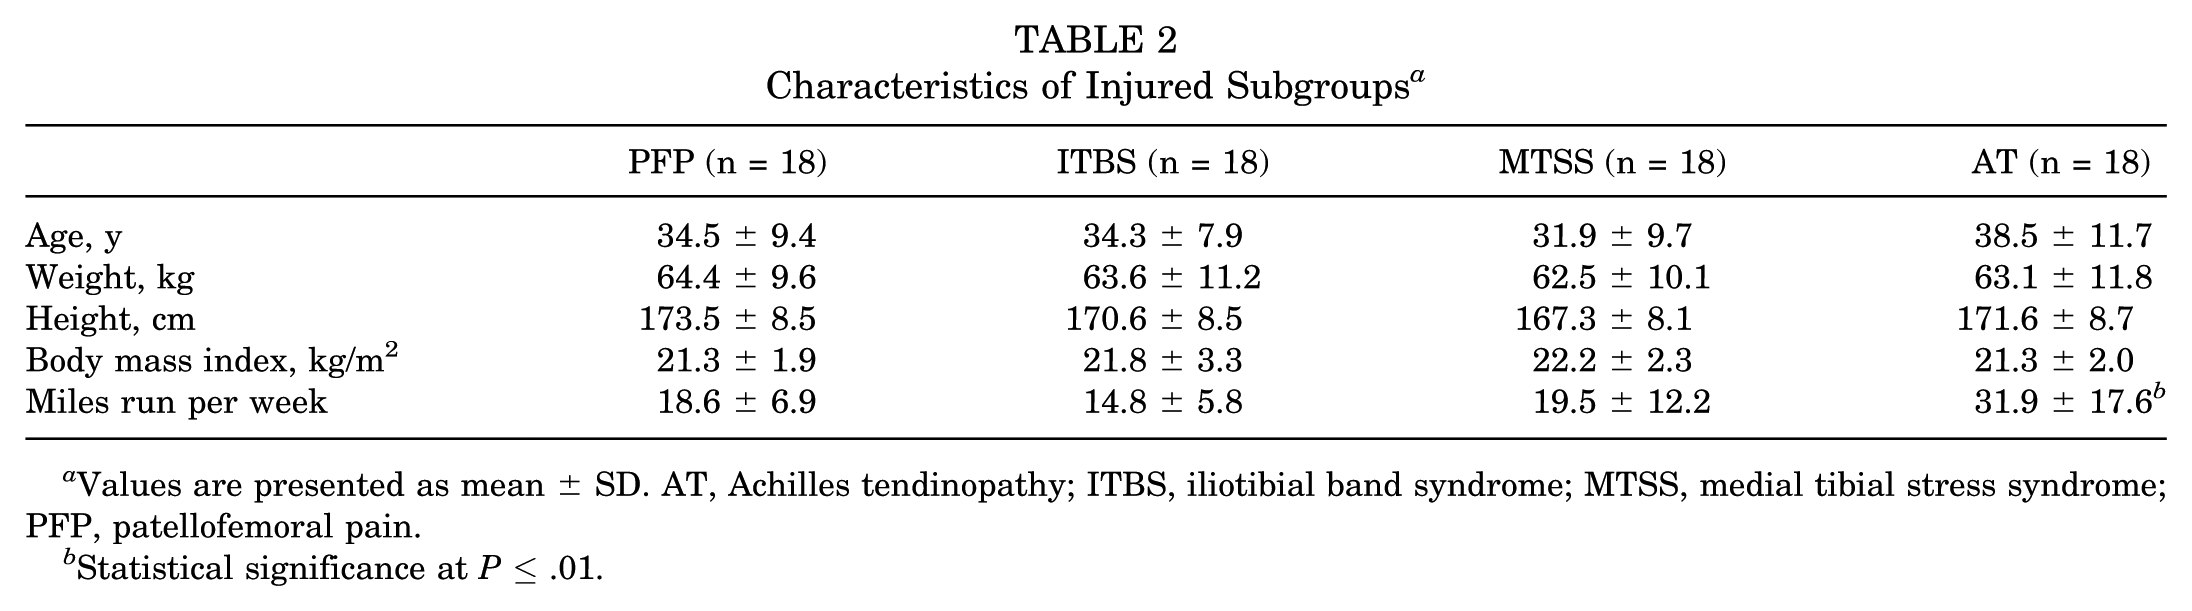
Values are presented as mean ± SD. AT, Achilles tendinopathy; ITBS, iliotibial band syndrome; MTSS, medial tibial stress syndrome; PFP, patellofemoral pain.
Statistical significance at P ≤ .01.
Inclusion/Exclusion Criteria
Injured Group
The injured group included participants with a current diagnosis of either PFP, ITBS, MTSS, or AT. Injury diagnosis was confirmed after a physical examination by a qualified physical therapist in accordance with previously published diagnostic criteria for PFP, 6 ITBS, 17 MTSS, 54 and AT 22 (see Appendix 1, available in the online version of this article). All participants reported being able to run up to 10 minutes before the onset of pain and maximal pain during running of greater than 3 of 10 on a numerical rating scale (0 = no pain, 10 = worst possible pain). Additionally, all participants reported that they were not currently receiving medical treatment for their injury and that their pain had caused a restriction to their running volume and/or frequency for a minimum of 3 months. Previous research has reported training factors such as a rise in weekly training volume to increase the risk of injuries. This is likely because of a sudden excessive rise in acute tissue stress on the musculoskeletal system, resulting in insufficient time for adaptive changes. 33 Therefore, to control for training errors as a cause of injury, participants were excluded if they reported an increase in weekly training volume of greater than 30% preceding the onset of injury.
Healthy Group
Control participants were included if they reported running a minimum of 30 miles per week for the past 18 months with no reported injury. Participants were excluded if they reported any musculoskeletal ailment within the past 18 months that caused a restriction or cessation of running or any need to seek advice from a health care professional. Additional exclusion criteria included a history of overuse running injuries, injuries caused by another sport, previous spinal injuries, or lower limb surgery.
Procedures
Kinematic data were collected from all participants while running on a treadmill at 3.2 m/s wearing their own running shoes. After a 5-minute warm-up period, 30 seconds of kinematic data were collected using a 12-camera Oqus system (240 Hz; Qualisys). A total of 9 anatomic segments were tracked following a previously published protocol by the same authors shown to have good to excellent repeatability.28,37 Segments included the thorax, pelvis and bilateral thigh, shank, and foot segments. In addition, a further rearfoot segment was included using 3 noncollinear markers attached to the heel of the participant’s shoes. The foot segment was used to calculate sagittal plane ankle kinematics, while the rearfoot segment was used to calculate frontal plane foot kinematics. Further details of the markers used to track each segment and the precise definition of the anatomic coordinate systems are provided in Appendix 2 (available online) and described in previous publications.14,28,37
Raw kinematic data were low pass filtered at 10 Hz. Intersegmental kinematics, along with the motions of the pelvis and thorax with respect to the laboratory system, were calculated using a 6 degrees of freedom model with the commercial software Visual3D (C-Motion). Gait events were defined using a kinematic approach 20 and subsequently used to segment each kinematic signal into a minimum of 10 consecutive gait cycles. An ensemble average for each signal was determined and selected kinematic parameters derived from the ensemble average curves. This latter processing was carried out using a custom Matlab script (MathWorks).
Data Analysis
A range of kinematic parameters at both initial contact and midstance was selected for analysis. Parameters at initial contact included sagittal plane angles of the trunk, pelvis, hip, knee, and ankle as well as frontal plane angles of the trunk and rearfoot. Peak angles at midstance included sagittal and frontal plane angles of the trunk, pelvis, knee, ankle, and rearfoot as well as transverse plane angles of the hip and knee. Parameters were selected based on previous research reporting differences between injured and noninjured runners.39,41,52 Peak angles at midstance were defined as the maximum joint angle between initial contact and toe-off. Foot strike patterns of each group were determined based on the kinematic waveforms of the ankle joint. If the ankle demonstrated an immediate movement into plantarflexion, participants were classified as having a rearfoot strike, while participants demonstrating immediate ankle dorsiflexion were classified as having a forefoot strike. The injured leg was analyzed from the injured runners, and the right or left leg was analyzed at random from the healthy runners to match the total distribution of right and left legs in the injured group.
Statistical Analysis
Participant characteristics were analyzed using independent t tests for the healthy versus injured group comparison and 1-way analysis of variance (ANOVA) for the subgroup comparison (Tables 1 and 2). Chi-square tests were used to assess for differences in the distribution of foot strike patterns between the groups. To identify possible global contributors to running injuries, we used a 2-phased approach. First, data from the injured group were pooled and kinematic parameters compared with those of the healthy group using an independent t test. Second, for any variables found to be significantly different after the injured versus healthy comparison, we assessed for subgroup differences between the 4 injured subgroups using 1-way ANOVA and a post hoc least significant difference test. To be considered a global contributor to running injuries, a kinematic parameter was required to be consistent across the different injured subgroups. This ensured that differences observed in the pooled injured data were not the result of large effects in one of the injured subgroups. Before analysis, all kinematic parameters were assessed for homogeneity of variance and normal distribution using the Levene test (P ≥ .05) and Shapiro-Wilk test (P ≥ .05). When assumptions were not met, an equivalent nonparametric test was used. To reduce the possibility of type I errors, a critical alpha of .01 was used for the injured versus healthy comparison. However, we used a critical alpha of .05 for the subgroup ANOVA because of the smaller subgroup sample sizes. This was deemed appropriate given the smaller number of group comparisons and therefore a lower likelihood of type I errors.
In addition to calculating statistical significance for group comparisons, we also calculated effect sizes. For t test comparisons, we used Cohen d and interpreted an effect size of 0.2, 0.5, and 0.8 as small, medium, and large, respectively. 4 For the ANOVA comparisons, we used the eta-square statistic (η2 = sum of squares between groups/sum of squares total) and interpreted effect sizes of 0.01, 0.09, and 0.25 as small, medium, and large, respectively. 4
Finally, a forward stepwise binary logistic regression analysis was conducted to determine which kinematic parameters could predict classification into either the injured or healthy group. Parameters identified to be significantly different between healthy and injured groups were considered for the regression model. Variables were excluded from the regression model if they were found to demonstrate differences between injured subgroups.
Results
Injured Versus Healthy
The pooled data showed the injured runners to land with significantly more knee extension and ankle dorsiflexion (Table 3 and Figure 1). At midstance, the injured runners were found to have significantly greater forward trunk lean, CPD (Figure 2A), and hip adduction (Figures 2C and 3 and Table 4). Large effect sizes of 1.37, 0.89, and 0.87 were observed for CPD, hip adduction, and knee flexion at initial contact, respectively (Tables 3 and 4). Trunk forward lean at midstance and ankle dorsiflexion at initial contact demonstrated moderate effect sizes of 0.65 and 0.71, respectively (Tables 3 and 4). Chi-square tests found no significant difference in the distribution of foot strike patterns between the groups (P = .332). In the healthy group, there was a total of 17 forefoot and 19 rearfoot runners. In the injured group, there was a total of 27 forefoot and 45 rearfoot runners.
Kinematic Angles at Initial Contact a
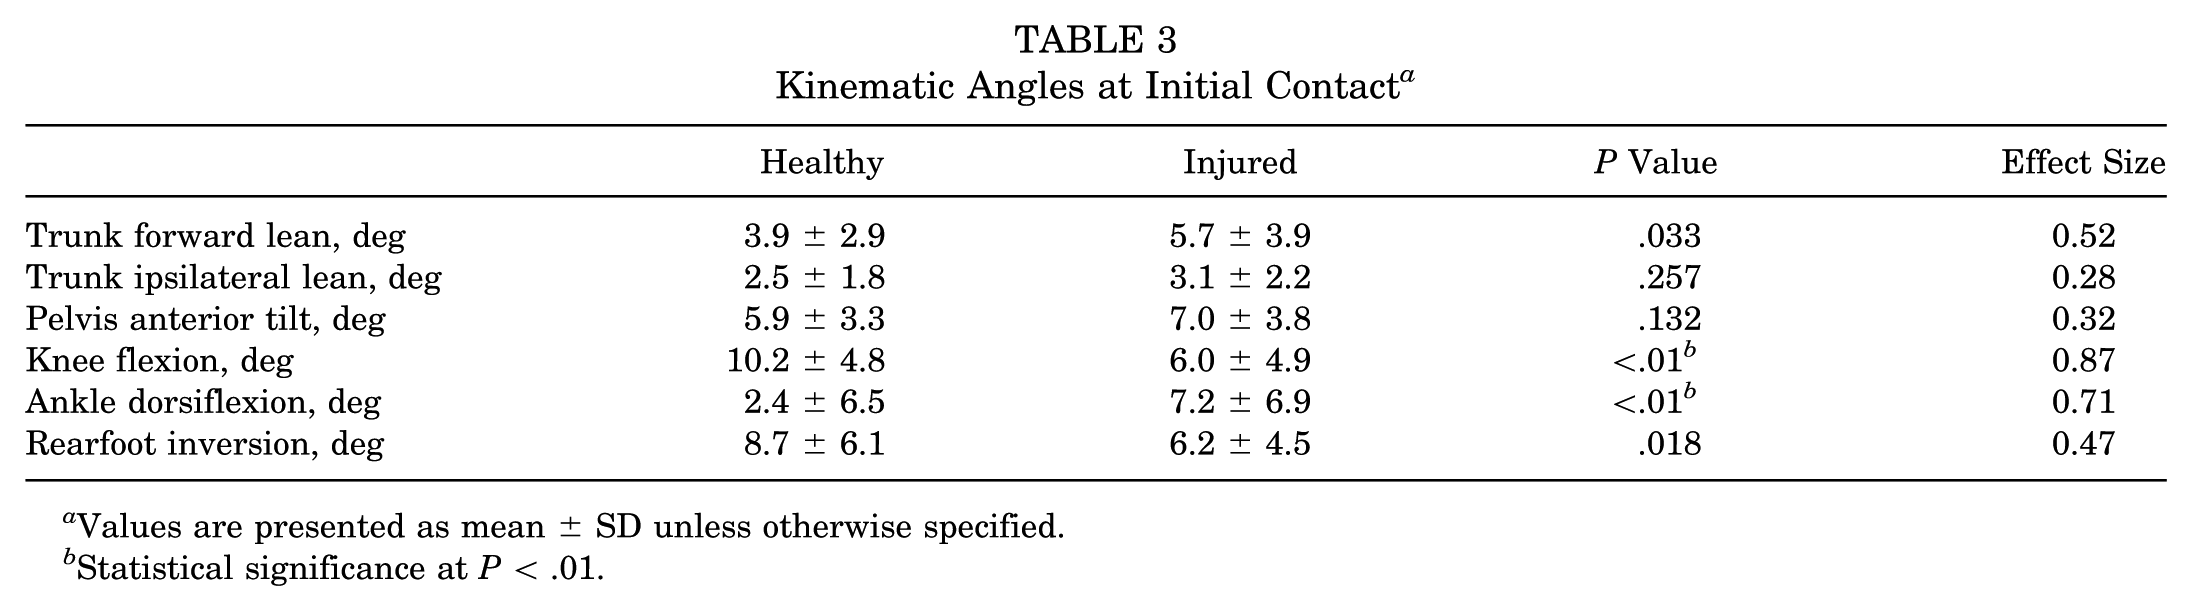
Values are presented as mean ± SD unless otherwise specified.
Statistical significance at P < .01.
Peak Kinematic Angles at Midstance a
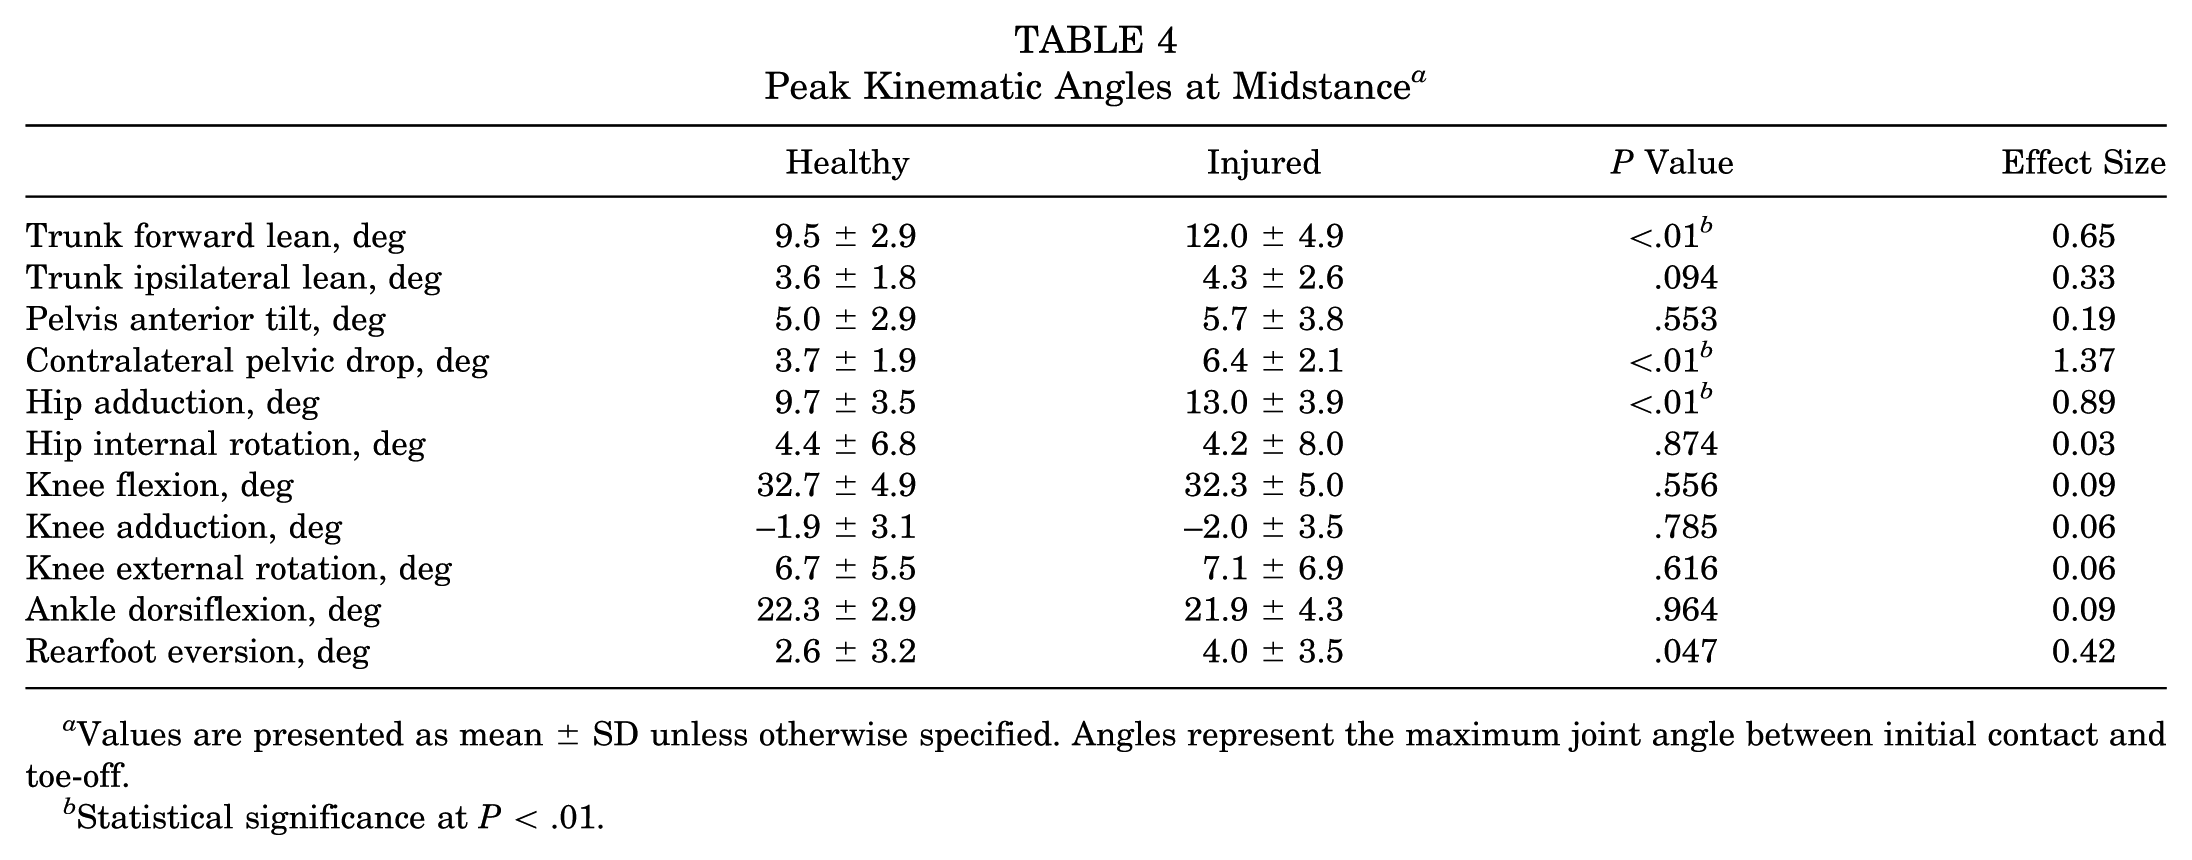
Values are presented as mean ± SD unless otherwise specified. Angles represent the maximum joint angle between initial contact and toe-off.
Statistical significance at P < .01.
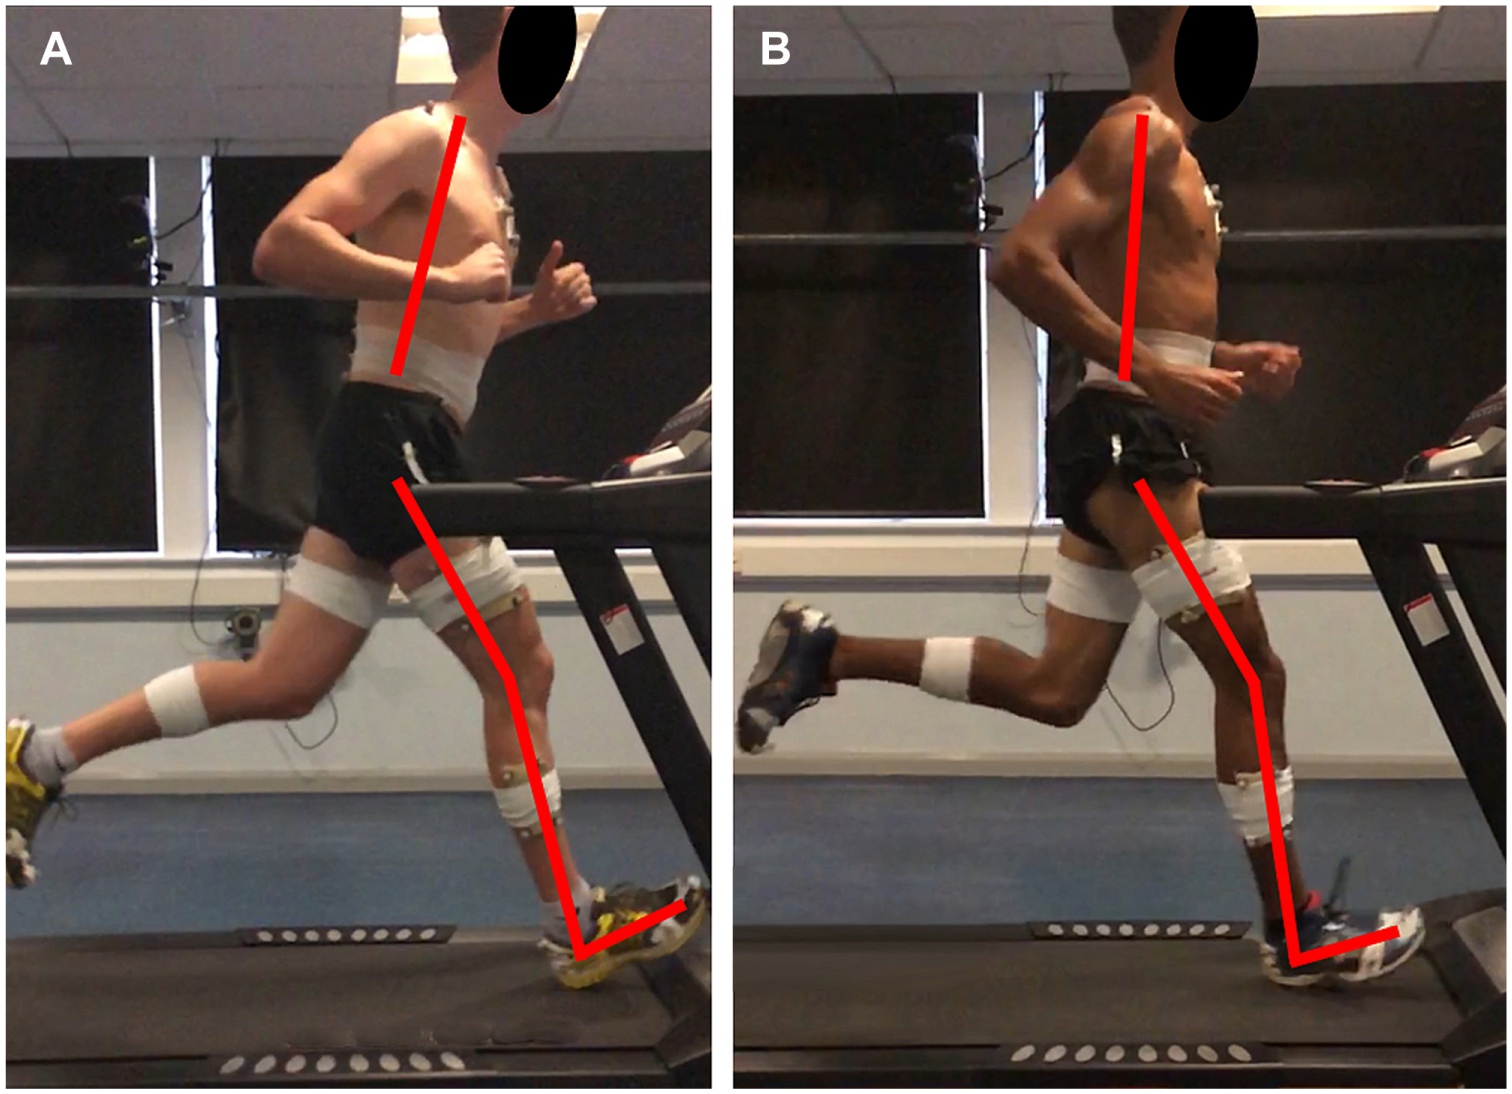
Two-dimensional representation of forward trunk lean, knee flexion, and ankle dorsiflexion at initial contact. (A) injured runner; (B) healthy runner.
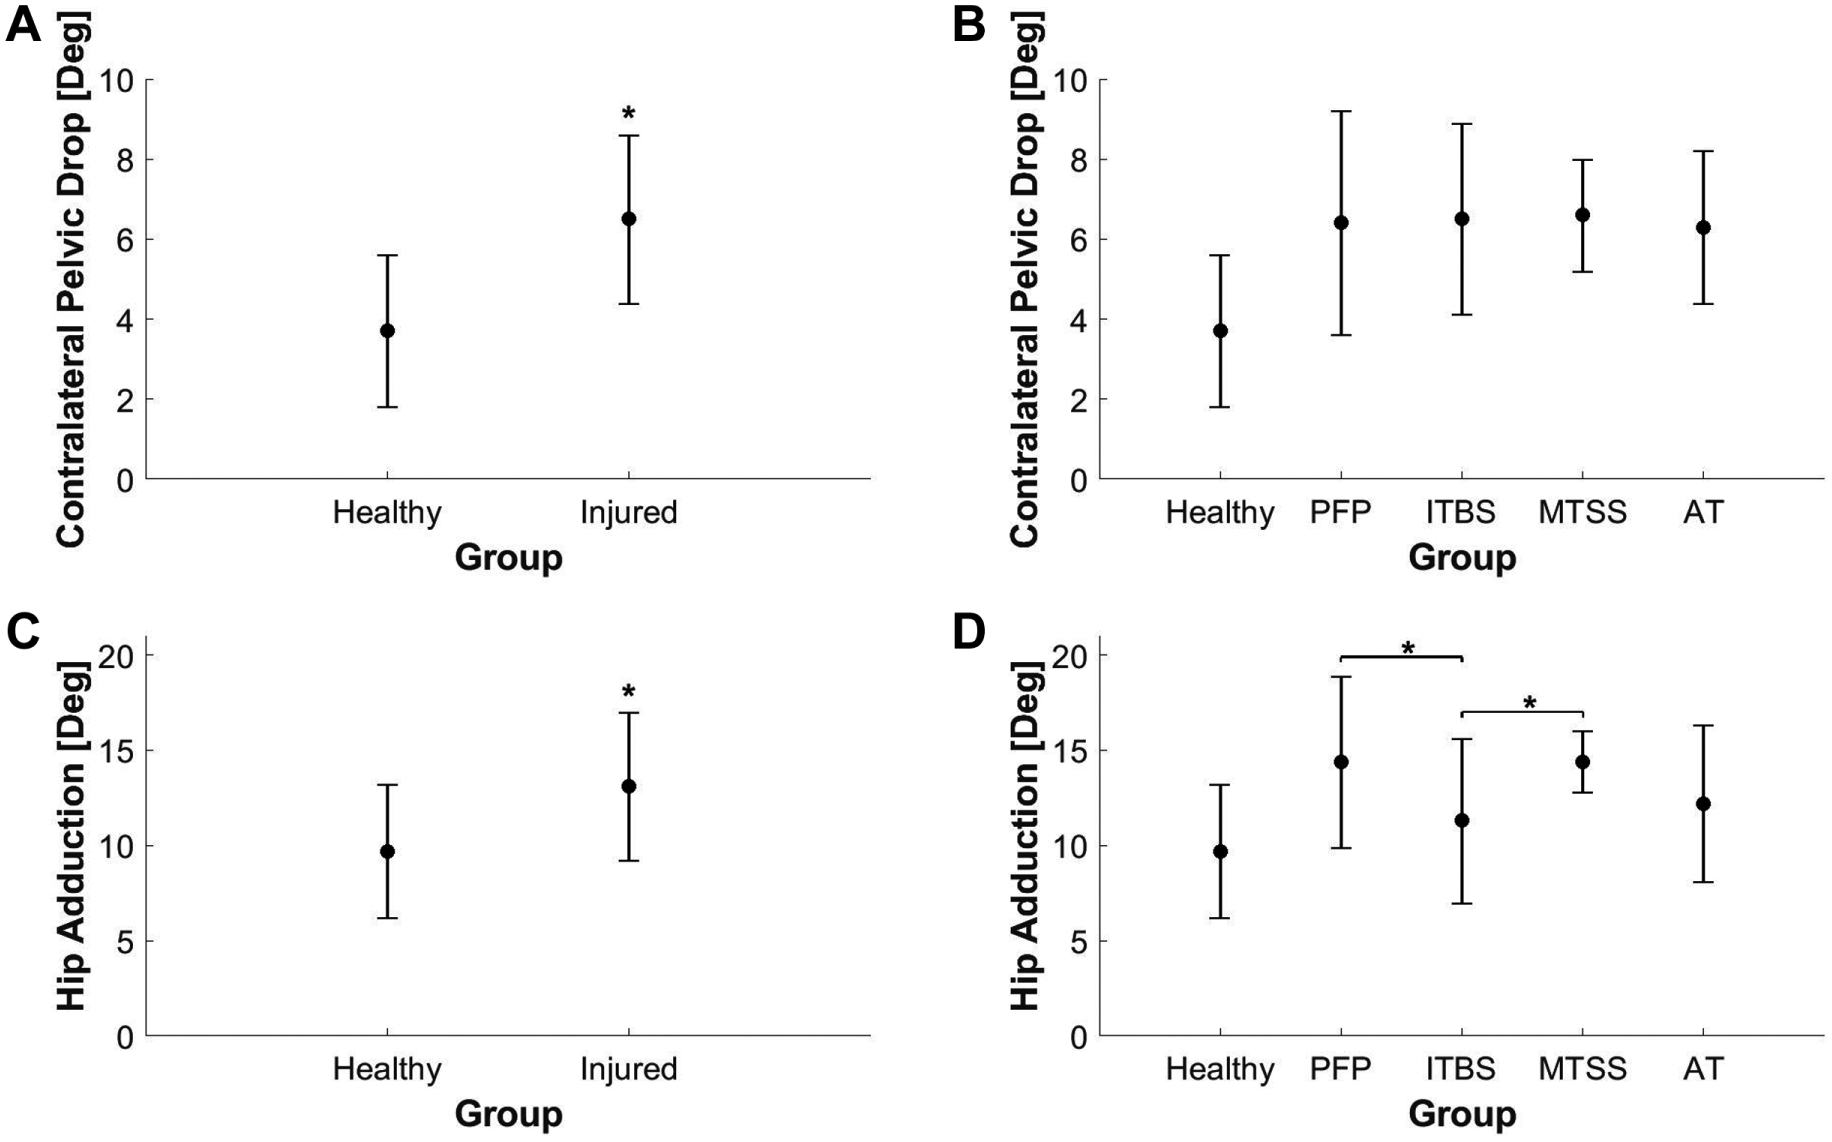
(A) Contralateral pelvic drop for healthy and injured groups. (B) Contralateral pelvic drop for healthy group and injured subgroups. (C) Hip adduction for healthy and injured groups. (D) Hip adduction for healthy group and injured subgroups. Whiskers represent ±1 SD. *Statistically significant differences for the (A, C) t test and (B, D) subgroup analysis of variance. The healthy group is shown in B and D for comparison purposes only. AT, Achilles tendinopathy; ITBS, iliotibial band syndrome; MTSS, medial tibial stress syndrome; PFP, patellofemoral pain.
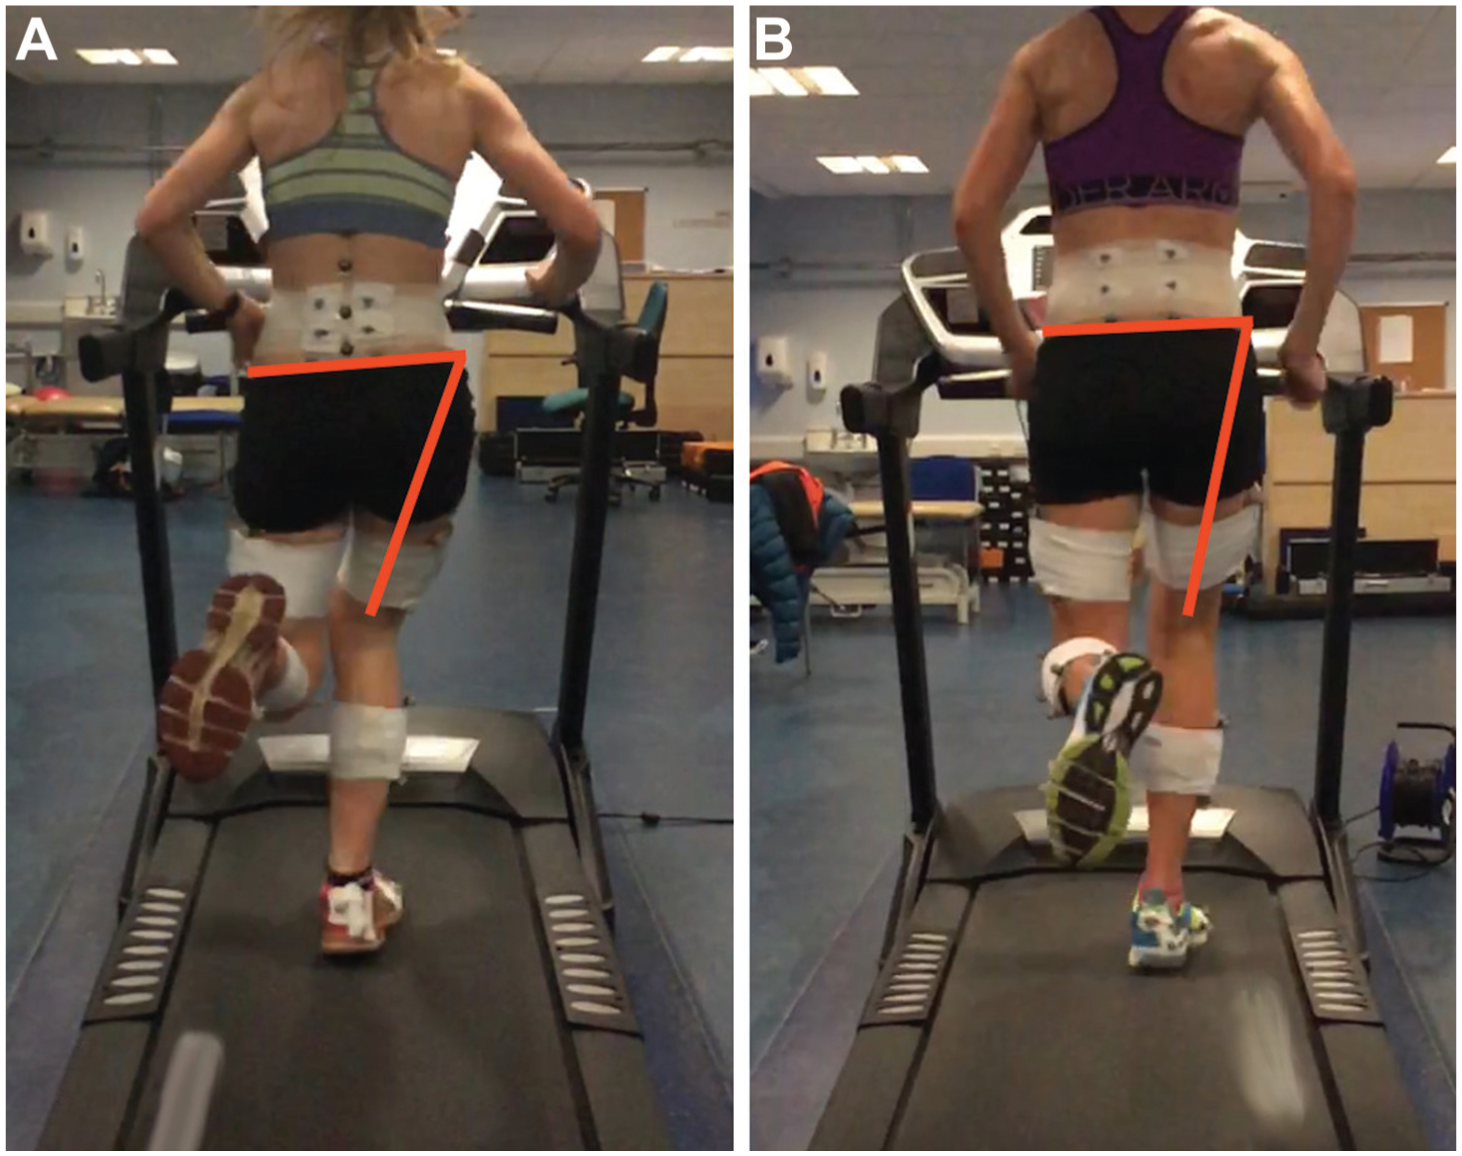
Two-dimensional representation of contralateral pelvic drop and hip adduction at midstance. (A) injured runner; (B) healthy runner.
Injured Subgroups
The subgroup ANOVA was conducted to identify if there were differences between injured subgroups for variables identified as being different between the pooled injured and healthy groups. This analysis found no differences for ankle dorsiflexion and knee flexion at initial contact (Table 5). Furthermore, there were no differences in peak trunk forward lean and CPD at midstance (Table 5), indicating that these parameters were consistent across the injured subgroups. However, there was a significant difference between injured subgroups for peak hip adduction (Table 5). Post hoc least significant difference tests found the PFP (P = .018) and MTSS (P = .016) subgroups to have 3.1° and 3.2° more hip adduction than the ITBS group, respectively (Figure 2D).
Analysis of Variance Between Injured Subgroups a
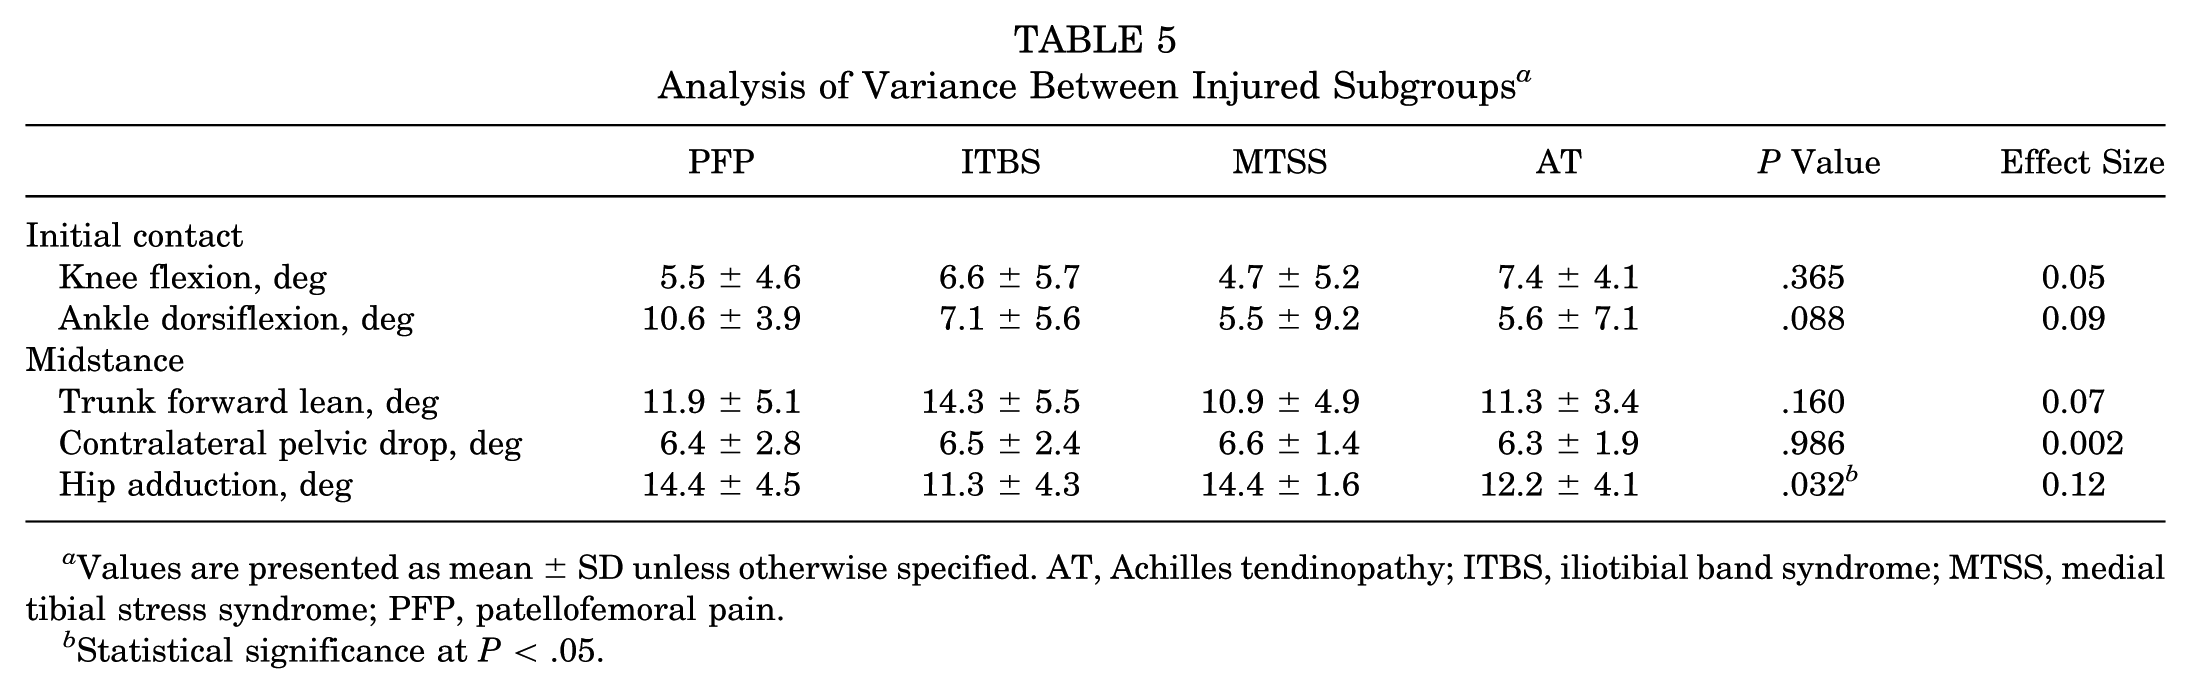
Values are presented as mean ± SD unless otherwise specified. AT, Achilles tendinopathy; ITBS, iliotibial band syndrome; MTSS, medial tibial stress syndrome; PFP, patellofemoral pain.
Statistical significance at P < .05.
Logistic Regression
The final variables identified as global kinematic contributors included knee flexion and ankle dorsiflexion at initial contact as well as trunk forward lean and CPD at midstance. All 4 variables were entered into the logistic regression model. The forward stepwise logistic regression model identified that CPD at midstance (odds ratio, 1.87 [95% CI, 1.41-2.49]; P ≤ .001) and knee flexion at initial contact (odds ratio, 0.87 [95% CI, 0.78-0.97]; P = .012) were significant predictors of the classification as either healthy or injured, explaining 47% of the variance in the data (R2 = 0.466). The most important predictor variable was CPD, with an 80% increase in the odds of being classified as injured for every 1° increase in pelvic drop. For knee flexion, there was a 23% reduction in the odds of being classified as injured for every 1° increase in knee flexion at initial contact.
Discussion
This study identified a number of kinematic differences between the injured and healthy runners that were consistent across injured subgroups. In particular, the injured runners were found to demonstrate significantly greater peak CPD and forward trunk lean as well as a more extended knee and dorsiflexed ankle at initial contact (Tables 3-5 and Figures 1 and 3). We found CPD to be the most important predictor variable when classifying runners as healthy or injured. These kinematic patterns may represent global kinematic contributors to soft tissue running injuries and together may define a pathological running gait.
Global Kinematic Contributors
Peak CPD was found to be the kinematic parameter most strongly associated with running injuries. Previous studies have associated CPD with PFP 52 and MTSS 26 ; however, this study identified increased CPD among multiple different running-related injuries, including ITBS and AT (Figure 2B). Therefore, CPD may represent a global kinematic contributor and risk factor for many common soft tissue running injures.
It is likely that CPD will influence lower limb tissue stress at a number of different anatomic sites through a number of different mechanisms. For example, Tateuchi et al 43 identified that increasing CPD resulted in an increase in iliotibial band tension at the lateral femoral condyle. This will likely influence ITBS development through increased strain 19 and increased compression between the iliotibial band and lateral femoral condyle. 11 At the same time, an increase in iliotibial band tension will result in lateral displacement of the patella. 29 Lateral displacement of the patella will lead to a rise in patellofemoral joint stress, leading to PFP development, 36 while at the lower limb, increased CPD will result in a medial shift in the ground-reaction force relative to the knee joint center.37,42 This may alter the force distribution through the lower limb, leading to increased bending forces on the medial tibia 5 and potentially alter the pressure distribution through the foot. This may contribute to the development of either MTSS or AT.25,50
One possible explanation for the increased CPD observed in the injured group could be reduced strength or neuromuscular function at the hip. Previous authors have reported the delayed onset of gluteus medius and maximus function in runners with PFP 51 and AT, 15 while others have reported reduced hip abductor strength in runners with ITBS, 16 PFP, 41 AT, 18 and MTSS. 48 The hip abductors, in particular, the gluteus medius, are thought to control frontal plane kinematics of the pelvis and hip. 40 Therefore, it is conceivable that reduced strength or neuromuscular function of the gluteus medius would lead to an inability to stabilize the pelvis in the frontal plane, causing increased CPD.
We also found the injured runners to land with greater knee extension and ankle dorsiflexion (Table 3 and Figure 1), which may influence tissue stress in a number of ways. First, in knee extension, the patella becomes vulnerable to lateral tilt and displacement, which may influence patellofemoral contact areas and joint stress during the early stance. 35 Second, an extended knee and dorsiflexed ankle at initial contact are typically associated with a greater distance between the center of mass and the foot at contact. A greater distance between the center of mass and foot, as well as larger ankle dorsiflexion angles, has been associated with increased knee joint loading and breaking impulse. 49 An extended knee at initial contact has also been reported to reduce the ability to attenuate impact forces during the early stance. 8 Collectively, it seems plausible that the extended lower limb posture at initial contact may influence impact loading and knee joint loading during the early stance.
One possible mechanism explaining the differences in forward trunk lean may be strength deficits around the gluteals and paraspinals. Previous studies have reported fatigue of the paraspinal and gluteal muscles to be associated with an increase in trunk forward lean during running 21 and drop landings. 23 Therefore, the reduced strength capacity of the gluteals and paraspinals may result in an inability to maintain an upright running posture among the injured runners.
Kinematic Subgroups
While hip adduction was found to be greater among the pooled injured group, the subgroup analysis revealed that this parameter differed across the injured subgroups (Table 5 and Figure 2, C and D). Specifically, we found hip adduction to be greater among subgroups of runners with PFP and MTSS compared with the ITBS subgroup (Figure 2D). This finding is in contrast to previous studies by Noehren et al 31 and Ferber et al, 12 who reported increased hip adduction among runners with ITBS. One potential reason for the contrasting findings may be the sex differences between studies. Hip adduction has been reported to be influenced by sex subgroups, 52 with greater hip adduction among female runners. In the current study, we included a mix of male and female participants, while Noehren et al 31 and Ferber et al 12 only included female participants. While we acknowledge that hip adduction may be an important kinematic risk factor for certain injuries, we believe that our data suggest that hip adduction may be more influential in specific subsets of runners and injuries rather than others.
Limitations
One limitation is that the study was retrospective, and therefore, it is not possible to conclude if the observed kinematic patterns are the cause of injury or the result of injury. Nevertheless, we ensured that all data were recorded before the onset of pain to minimize any possible effect of pain on the observed kinematic patterns. However, we cannot rule out the possibility that participants may have adapted their running kinematics in response to chronic injuries or in apprehension of the acute onset of pain. Therefore, we acknowledge that future prospective studies are required to further investigate whether the kinematic patterns observed within the current study are the cause or effect of injury. Another study limitation is the higher weekly mileage of the healthy group (Table 1). However, we believe that this could be considered a strength as previous research suggests that running greater than 40 miles per week is a risk factor for developing injuries. 46 On average, our healthy group was exceeding this threshold for more than 18 months before testing but remained injury free. Therefore, we believe that the healthy group may be representative of a healthy running gait to remain injury free at training loads exceeding the previously reported injury threshold. It is also important to note that this study was limited to a select number of common soft tissue running injuries, and therefore, these results may not apply to other injuries such as plantar heel pain, stress fractures, and muscle strains. Further research would be required to establish a link between the identified kinematic patterns and other running-related injuries.
Clinical Relevance
The findings from the present study may have a number of clinical implications. First, all of the identified kinematic parameters can be easily visualized using 2-dimensional (2D) gait analysis methods9,10,34 (Figures 1 and 3). A number of recent publications have shown 2D assessments of CPD, hip adduction, trunk forward lean, and sagittal plane knee and ankle angles to be highly correlated with 3D measurement systems and to demonstrate high intratester and intertester reliability.9,10,34 Therefore, it should be possible to use 2D measurement techniques to assess the biomechanical parameters that were associated with injuries in this study. Second, many of the identified global kinematic contributors to injuries can be modified through gait retraining. For example, CPD and hip adduction can be retrained using mirror feedback, 53 while knee and ankle angles are influenced by increasing cadence or modifying foot strike patterns. 30 Therefore, this study highlights a number of key kinematics that can be considered global contributors to running injuries and can be easily assessed and modified in clinical practice. This may assist clinicians in the development of rehabilitation programs for common running-related injuries.
Conclusion
This study identified a number of global kinematic contributors to common running injuries. In particular, we found injured runners to run with greater peak CPD and trunk forward lean as well as an extended knee and dorsiflexed ankle at initial contact. CPD appears to be the variable most strongly associated with common running-related injuries. The kinematic patterns identified as global contributors to injuries can be easily assessed and modified in clinical practice.
Supplemental Material
DS_10.1177_0363546518793657 – Supplemental material for Is There a Pathological Gait Associated With Common Soft Tissue Running Injuries?
Supplemental material, DS_10.1177_0363546518793657 for Is There a Pathological Gait Associated With Common Soft Tissue Running Injuries? by Christopher Bramah, Stephen J. Preece, Niamh Gill and Lee Herrington in The American Journal of Sports Medicine
Footnotes
The authors declared that they have no conflicts of interest in the authorship and publication of this contribution. AOSSM checks author disclosures against the Open Payments Database (OPD). AOSSM has not conducted an independent investigation on the OPD and disclaims any liability or responsibility relating thereto.
References
Supplementary Material
Please find the following supplemental material available below.
For Open Access articles published under a Creative Commons License, all supplemental material carries the same license as the article it is associated with.
For non-Open Access articles published, all supplemental material carries a non-exclusive license, and permission requests for re-use of supplemental material or any part of supplemental material shall be sent directly to the copyright owner as specified in the copyright notice associated with the article.