
Abstract
Retroreflectivity is essential for the visibility of transportation infrastructure, ensuring road safety, especially under low-light conditions. Traditional methods for measuring retroreflectivity, such as nighttime visual inspections and retroreflectometer measurements, are labor-intensive, subjective, and pose safety risks. With the introduction of lidar technology, traffic sign retroreflectivity can be assessed more efficiently, as lidar-derived reflectivity values demonstrate a strong linear correlation with retroreflectivity. This study leverages a lidar device to propose a Double U-Net framework for predicting pixel-level reflectivity from daytime red, green, blue (RGB) images, providing a localized and accurate prediction. To train the Double U-Net model, a structured data set of over 7,600 images of transportation infrastructure was created, incorporating lidar-derived depth and reflectivity data. Given the sparsity of low-resolution lidar point clouds, linear interpolation was applied to generate pixel-level depth and reflectivity images. The proposed Double U-Net framework employs a two-stage architecture, where depth is predicted from cropped images in the first stage, and then combined with the original image and class embeddings in the second stage to generate pixel-level reflectivity predictions. A weighted loss function balances depth and reflectivity errors, enhancing prediction accuracy and robustness. The model achieved a median mean square error (MSE) of 0.0162 with interpolated data, 0.02233 with raw data, a median structural similarity index measure (SSIM) of 0.5413, and a Mann-Whitney U Test alignment of 58.2% with raw reflectivity data at a 0.001 significance level. The model effectively captures localized defects on traffic signs, providing a more detailed analysis compared with traditional methods.
Keywords
Introduction
Retroreflectivity degradation is a critical concern for all road users, as it directly affects the visibility and effectiveness of traffic infrastructure, especially during nighttime and low-light conditions. To mitigate this risk and enhance road safety, authorities prioritize the regular maintenance and assessment of traffic infrastructure. However, measuring retroreflectivity degradation is a complex and resource-intensive task, requiring significant time and financial investment. Despite these challenges, the importance of this task cannot be overstated, given its direct correlation with road safety. Retroreflectivity is crucial for traffic infrastructure because it ensures visibility from a distance, giving drivers ample time to react and make informed decisions. The degradation of retroreflectivity over time, caused by environmental factors such as weathering, dirt accumulation, and physical damage, can significantly reduce the visibility of traffic signs, thereby increasing the risk of accidents.
The significance of retroreflectivity in improving road safety is well-documented ( 1 ). It is a key factor in achieving Show-Me Zero ( 2 ), a strategy aimed at eliminating all traffic fatalities and severe injuries. Retroreflective traffic signs play a vital role in guiding both drivers and pedestrians, thereby reducing the likelihood of collisions. Scholars have emphasized that frequent analysis and maintenance of traffic sign and road marking conditions are fundamental aspects of an effective highway asset management system ( 3 ). This highlights the need for regular monitoring to ensure that transportation infrastructure remains highly visible and effective in its role.
Since a high portion of the traffic network and highway system was constructed in the early to mid-20th century, inevitable issues have arisen with its current usage. The primary concern is the aging of transportation infrastructure. Studies indicate that nighttime driving, which constitutes only 20% of total traffic, experiences a fatality rate three times higher than daytime ( 4 ). This emphasizes the need for regular maintenance, focusing on the visibility and integrity of traffic signs and pavement markings to prevent accidents and minimize fatalities ( 5 ). According to the American Society of Civil Engineers (ASCE) 2021 Report Card, roads and bridges received grades of D and C, respectively, pointing to aging infrastructure as a major contributor to congestion and increased crash risks ( 6 ).
In guidelines established by the Federal Highway Administration (FHWA) ( 1 ), retroreflectivity is identified as the primary and essential criterion for evaluating the condition of traffic signs, as it ensures visibility and effectiveness, especially during nighttime driving. The Methods for Maintaining Traffic Sign Retroreflectivity ( 1 ), propose traditional assessment methods such as nighttime visual inspection and measured sign retroreflectivity. Nighttime visual inspection involves an inspector assessing the visibility of traffic signs from a moving vehicle at night, using only the vehicle’s low-beam headlights as the light source. The inspector evaluates the brightness and legibility of the signs as the vehicle approaches. In contrast, measured sign retroreflectivity uses a retroreflectometer to measure the amount of light reflected from the sign’s surface, providing objective data based on specified distances and angles. While nighttime visual inspection is cost-effective, its reliance on subjective judgment by inspectors working under low-light conditions raises safety concerns, potentially endangering both the inspectors and road users. Similarly, measured sign retroreflectivity provides accurate, objective data; however, the complex procedures require inspectors to spend extended time in traffic environments, posing additional safety risks. Additionally, both methods are challenged by time sensitivity, safety hazards, efficiency limitations, and a lack of comprehensive, objective data ( 1 , 5 ). The time, effort, and safety risks in nighttime inspection required for comprehensive assessments can be prohibitive, leading to less frequent inspections and potentially allowing degraded signs to remain in use for extended periods.
Recent studies have identified multiple factors that influence both the retroreflectivity and legibility of traffic signs, which are critical for ensuring visibility under varying lighting conditions. Key factors include environmental and weathering influences, such as pollution, dirt, and UV exposure; material-related aspects, such as aging and type; and physical characteristics, including installation height, angle, and orientation ( 7 – 9 ). These findings suggest a correlation between daytime visual performance and nighttime retroreflectivity, indicating that daytime visibility could potentially serve as a predictor for retroreflectivity degradation, supporting predictive maintenance approaches.
Advanced technologies, including cameras and lidar systems, have been explored to improve retroreflectivity assessment through automated, high-precision data collection. Unlike traditional methods, lidar provides point-level data for an entire sign, revealing localized defects, such as stains or folds, that might be missed by average retroreflectivity measurements. However, the high cost of lidar and the need to calibrate device-scaled intensity for range and incidence angle before estimating standardized retroreflectivity remain barriers to widespread adoption ( 4 ). In addition, point cloud sparsity, environmental conditions, and sign-specific properties such as sheeting level and color further complicate this process.
To address the limitations associated with both traditional and advanced methods, we propose a novel two-stage framework that predicts the retro-intensity of transportation infrastructure directly from a single camera which is taken during daytime. We extend the traditional U-Net model to a Double U-Net architecture enabling us to learn retro-intensity from an RGB image. The target of the model architecture is the depth mask image and the retro-intensity mask image, both derived from lidar point cloud data processed through Robot Operating System (ROS). Model target data are prepared by first using a fine-tuned You Only Look Once, version 8 (YOLOv8) model to detect and classify transportation infrastructure from RGB images. Recognized objects are cropped, and their corresponding depth and retro-intensity are extracted from lidar point clouds for training data preparation. For better analysis, the sparse lidar point cloud depth and retro-intensity data are interpolated and saved as images to provide pixel-level information. Using the cropped transportation infrastructure objects as model inputs and corresponding depth and reflectivity data as targets, we train a Double U-Net framework, which predicts retro-intensity outcomes by minimizing a weighted loss combining depth and retro-intensity. The effectiveness of the Double U-Net model is assessed using three metrics—mean square error (MSE), structural similarity index measure (SSIM), and the Mann-Whitney U Test—by comparing the interpolated and raw retro-intensity under the transportation infrastructure mask generated by the Segment Anything Model (SAM) ( 10 ). The resulting model demonstrates the capability to accurately predict complete retro-intensity for transportation infrastructure solely through the visual characteristics captured in the images. This approach effectively addresses the high costs associated with traditional methods, offering a cost-effective and efficient solution for transportation management.
Furthermore, the proposed Double U-Net model enables the analysis of vast amounts of image data, identifying patterns, or small visual changes that human inspectors might overlook. This approach can significantly reduce the need for manual measurements, the associated labor costs, and the high costs of lidar devices. The model’s ability to operate with only camera inputs makes it a scalable solution for continuous monitoring of transportation infrastructure retro-intensity. This system provides transportation administrators with a streamlined and accessible tool for infrastructure assessment, thereby enhancing the efficiency of management practices.
The contributions of this study are extensive and represent a significant advance in the field of traffic infrastructure monitoring, particularly in the context of measuring and predicting retro-intensity. The study makes significant contributions in three key areas:
We introduce a novel framework that fuses the transportation infrastructure object image with class, depth, and retro-intensity information obtained spatially and temporally from the lidar point cloud, enabling a comprehensive approach to data integration. Also, this framework provides pixel-level retro-intensity predictions, rather than traditional object-level assessments, allowing for a more detailed evaluation and localized issues detection.
We define a two-stage Double U-Net architecture that extends the traditional U-Net model, incorporating fused image and lidar point cloud data processed through ROS, along with a self-tuning YOLOv8 model for recognizing and tracking transportation infrastructure to predict the retro-intensity of transportation infrastructure. We also propose a new weighted loss function that combines the depth, which is used as the intermediate step, and the retro-intensity value to predict the reflectivity of the transportation infrastructure from the visual characteristics captured in the image.
The proposed model provides a cost-effective and scalable solution that significantly reduces the reliance on manual measurements and expensive lidar equipment, thereby giving transportation administrators an accessible tool for infrastructure assessment.
The rest of this paper is organized as follows. First, we review the relevant literature. We then outline the data collection process before detailing the methodologies employed in this study. This is followed by a discussion of the evaluation and results. We finish with conclusions, remarks, and potential directions for future work.
Literature Review
Traffic Sign Visibility and Safety
Traffic sign visibility is crucial for road safety as it provides drivers with essential information to navigate and make decisions, especially in challenging conditions such as nighttime driving. Clear and visible signs help drivers understand upcoming hazards, speed limits, and directions, which can prevent accidents and improve road safety ( 3 ). As the assessment criterion of traffic sign visibility at night, the retroreflectivity of signs is critical, and its degradation can lead to numerous safety issues, making it a key focus of this study.
Traditional approaches to evaluating traffic sign retroreflectivity often involve manual methods, including visual inspection and the use of retroreflectometers as outlined by FHWA ( 1 ). These methods provide direct and accurate readings but are labor-intensive, time-consuming, and introduce safety risk for inspectors. Early research to avoid this problem involves capturing nighttime images with a vehicle-mounted camera and analyzing them using support vector machine (SVM) recognition methods ( 11 ). This technique measures visibility based on average gray levels, considering camera settings, sign reflectivity, and illuminance ( 11 ). While automated and less labor-intensive, it may be affected by varying lighting conditions and camera calibration issues.
Factors Affecting Retroreflectivity and Daytime Legibility
Recent studies have identified various factors that significantly affect the retroreflectivity degradation of traffic signs, a critical aspect for ensuring nighttime visibility and driver safety. Environmental factors, such as pollution, dirt, and weather conditions significantly degrade retroreflectivity ( 7 , 9 ). Dust and dirt accumulate on sign surfaces over time, scattering light and reducing the signs’ reflectance, while moisture from rain and fog further diminishes reflective efficiency, particularly in high-traffic areas ( 7 ). Material aging and type also play a crucial role in retroreflectivity degradation ( 8 , 9 , 12 , 13 ). Retroreflective materials deteriorate under continued UV exposure, leading to decreased reflectivity over time. This deterioration often correlates with the sign’s age and is worsened in materials of lower durability ( 14 ). In addition, physical factors, including installation height, angle, and orientation, can also lessen the effectiveness of retroreflection ( 2 , 9 , 13 ). Lastly, temperature and humidity also contribute to retroreflectivity degradation ( 9 ). Similarly, as part of transportation infrastructure, pavement markings experience retroreflectivity degradation from factors such as traffic load, climate conditions, and material type, affecting their reflective performance over time ( 15 ).
In examining factors that affect the daytime visual performance of traffic signs, material degradation and surface contamination play a crucial role. Material degradation and surface contamination are critical factors affecting the daytime visibility of traffic signs, as fading, surface wear, and pollution diminish the contrast and clarity needed for rapid driver recognition ( 16 ). Pollution and dust accumulation create a layer on the sign’s surface that scatters light and fades colors, making signs less discernible, especially in complex visual environments ( 17 ). In addition to material factors, environmental and physical factors such as angle, mounting height, and orientation also considerably affect daytime visibility. Research highlights that traffic signs positioned at inappropriate angles or heights outside a driver’s natural line of sight often go unnoticed or require greater cognitive effort to detect ( 18 ). The Manual on Uniform Traffic Control Devices (MUTCD) emphasizes the importance of correct placement and routine maintenance to mitigate surface degradation from pollutants, ensuring sustained legibility and recognizability of traffic signs, which are essential for road safety ( 16 , 19 ). These findings underscore the importance of both strategic installation and maintenance in preserving the legibility and recognizability of traffic signs under daylight conditions, providing a basis for assessing related impacts on traffic safety and driver response times.
Building on the discussions in the previous sections, certain factors, such as pollution, weather, fading, aging, material type, and installation angle, are hypothesized to simultaneously affect both retroreflectivity and daytime legibility, suggesting a potential correlation between these two performance aspects. Studies indicate that factors degrading retroreflectivity also reduce daytime visibility ( 7 , 16 ), implying that daytime legibility could serve as a predictor for nighttime retroreflectivity. Establishing this link between visual performance and retroreflectivity provides a foundation for further investigation into predictive methods, thereby supporting the development of more efficient, proactive maintenance strategies.
Machine Learning and Advanced Technologies for Retroreflectivity Assessment
Measurement-Based Machine Learning for Retroreflectivity Prediction
Machine learning methods have gained traction in predicting retroreflectivity degradation given the priority attached to enhancing traffic safety. Studies have used deep neural networks trained on data collected by retroreflectometers, considering factors such as sheeting types, brands, colors, orientations, and observation angles ( 9 , 13 ). These models have demonstrated improved accuracy over traditional methods. Another machine learning framework based on the Random Forest (RF) algorithm has been designed to predict the retroreflectivity degradation of pavement markings over a three-year period. The RF algorithm was chosen for its nonparametric approach and robustness against multicollinearity, outperforming traditional regression models with high predictive accuracy (R2 values between 0.88 and 0.99) ( 15 ). This framework underscores the importance of selecting robust algorithms and comprehensive variables in achieving high predictive accuracy. Another group of scholars employed machine learning algorithms to predict the retroreflectivity status and lifespan of road traffic signs. They used three primary algorithms: RF, SVM, and Artificial Neural Networks (ANN) for classification and regression models. The models demonstrated high accuracy, with classification models achieving up to 94% accuracy and regression models reaching an R2 value of 94% ( 12 ). Among these, the ANN model outperformed others by achieving the highest accuracy rates for both data sets used. The superior performance of the ANN model is attributed to its ability to learn and model complex, non-linear relationships between inputs and outputs, capturing intricate patterns in the data that other models might not easily identify ( 12 ). This study highlights the effectiveness of ANN in modeling retroreflectivity, suggesting its potential for broader applications in traffic sign maintenance and safety planning.
Limitations of Point-Based and Object-Level Retroreflectivity Measurements
Even though previous machine learning methods have been shown to be superior in predicting transportation infrastructure retroreflectivity, the average value of the retroreflectivity of signage which is typically measured from only one or multiple specific points of the sign is used to represent the overall condition of the sign ( 1 , 20 ). However, in the real world, the condition of transportation infrastructure is more complicated. For example, the localized contamination, partial occlusion, or surface deformation is hard to detect using only the average value. A comprehensive framework which shows more detailed information with localized issues should be developed to ascertain the pixel-level retroreflectivity instead of the object-level value.
Mobile Lidar for Scalable Infrastructure Assessment and Retroreflectivity Modeling
To investigate more detailed information on traffic sign retroreflectivity, recent advances have seen the integration of lidar data to enhance accuracy. Lidar point clouds provide dense 3-D geometric information, spatial context, and retro-intensity, enabling rapid, objective, and comprehensive data collection. These data have supported a wide range of applications for traffic signs, including large-scale detection, extraction, classification, and inventory mapping from mobile lidar point clouds. Accordingly, an early mobile lidar study into traffic signs has emphasized automated sign detection and inventory construction, often using retro-intensity related information to facilitate sign candidate extraction and subsequent recognition. Representative pipelines have been developed to support sign object detection and extraction from mobile mapping point clouds for downstream inventory use ( 21 – 23 ). Complementary work has addressed operational sensing needs by improving robust sign detection and identification for localization or real-time perception using onboard sensors and mobile lidar point clouds ( 24 – 27 ). Beyond detection, researchers have advanced sign understanding toward segmentation and shape-level parsing, where the goal is to delineate sign surfaces and isolate sign objects from background structures ( 28 ). In parallel, multiple efforts have addressed classification and recognition by coupling point cloud sign candidate identification with downstream identification or category labeling, either directly from lidar-derived features or via projection to synchronized imagery for final classification ( 26 , 29 – 31 ). Finally, lidar has also been used to support visibility- and recognizability-related evaluation, leveraging spatial relationships between sign surfaces and their surrounding environments to characterize whether signs are likely to be perceivable in real scenes ( 18 , 25 , 32 ). Notably, in these lidar-based detection and mapping pipelines, retro-intensity related attributes are primarily used as discriminative cues, rather than for directly quantifying retroreflectivity. For pavement assets, mobile lidar has been used extensively to extract and classify road markings by exploiting the retro-intensity contrast between marking materials and asphalt. For pavement assets, mobile lidar has been used extensively to extract and segment road markings by exploiting the retro-intensity contrast between marking materials and asphalt ( 33 – 35 ). Guan et al. ( 34 ) developed an automated workflow to extract road markings from mobile laser scanning point clouds by leveraging intensity-derived representations and segmentation with subsequent refinement. Similarly, Yang et al. ( 33 ) extracted lane markings from mobile lidar point clouds by creating a georeferenced feature image and segmenting markings using retro-intensity and elevation features. Another line of work organizes point clouds into scan lines and detects markings via retro-intensity discontinuities along scan trajectories, enabling efficient marking extraction from mobile mapping data ( 35 ). Beyond extraction, Cheng et al. ( 36 ) further classified the extracted markings by incorporating shape and spatial descriptors derived from segmented points to support network-level inventories. Researchers have also explored reflectivity-enhanced segmentation, where the reflectivity channel is typically a vendor-processed, calibrated or normalized form of raw retro-intensity and is used as an explicit feature to better distinguish pavement markings from the surrounding road surface in point cloud segmentation ( 37 ).
Beyond using lidar retro-intensity as a feature for object detection, segmentation, classification, and extraction, recent studies have increasingly established quantitative links between lidar retro-intensity and standardized retroreflectivity, shifting the role of retro-intensity from a discriminative cue to a scalable measurement proxy by applying normalization to mitigate the effects of range and incidence angle on the recorded returns. For traffic signs, Ai and Tsai ( 38 ) pioneered this direction by normalizing lidar retro-intensity for range and incidence angle and demonstrating a strong linear relationship between normalized retro-intensity and handheld retroreflectometer measurements, enabling automated sign retroreflectivity estimation. Subsequent work further validated lidar-enabled sign condition assessment and deterioration analysis at scale ( 39 ) and compared handheld retroreflectivity against lidar-based evaluations in autonomous vehicle contexts ( 40 , 41 ). More recently, learning-based frameworks have begun integrating lidar retro-intensity with complementary RGB imagery to jointly support sign recognition and retroreflectivity estimation, indicating an emerging direction toward unified, scalable assessment pipelines ( 42 ). For pavement markings, Mahlberg et al. ( 43 ) reported a practical methodology that relates mobile lidar retro-intensity to pavement marking retroreflectivity for evaluation. Brinster et al. ( 44 ) followed with a closely aligned intensity-based evaluation direction for durable tape markings, reinforcing the operational feasibility of intensity-to-retroreflectivity use. To support scalable assessment workflows, Hou et al. ( 45 ) integrated mobile lidar with video log imagery to automate pavement marking retroreflectivity condition assessment at the network level. He et al. ( 46 ) further developed a lidar-based perception and evaluation method explicitly targeting pavement marking retroreflection. Moving toward standard-aligned prediction, Hodaei et al. ( 47 ) explored multibeam spinning lidar retro-intensity for predicting standard retroreflectivity of lane markings. In addition, Manasreh et al. ( 48 ) proposed a learning-based, feature-centric framework that predicts pavement marking retroreflectivity directly from mobile lidar data.
Lidar technology has been widely used for transportation infrastructure assessment because it enables rapid data collection, high geometric accuracy, and comprehensive spatial coverage. Lidar point clouds support mapping and evaluation of various assets, including pavement markings and traffic signs. However, lidar systems remain costly and operationally complex, which limits large-scale and frequent deployment. To improve practicality and scalability, recent studies have increasingly integrated camera imagery into lidar-based workflows, leveraging complementary strengths: lidar provides reliable geometry and spatial context, while cameras offer low-cost, high-resolution appearance information. For example, Zhou and Deng ( 30 ) showed that fusing lidar with camera imagery can improve the robustness and accuracy of traffic sign recognition. This fusion direction further motivates learning-based pipelines that use lidar for supervision during model development but perform inference using camera images only, enabling cost-effective deployment.
The current paper is inspired by the observed relationship between traffic sign retroreflectivity and lidar retro-intensity ( 38 ). Motivated by FHWA guidance that the primary modes of traffic sign deterioration are loss of retroreflectivity and fading of color portions, which impair nighttime visibility and daytime legibility respectively ( 20 ), this study focuses on conditions where shared factors such as UV weathering, contamination, and mounting geometry drive co-degradation of both measures. Prior work indicates that, after calibration for range and incidence angle, lidar retro-intensity is linearly correlated with standardized retroreflectivity ( 38 ). However, existing lidar-enabled sign retroreflectivity studies typically rely on lidar measurements at deployment time and report object-level or point-aggregated estimates, which can obscure localized defects and spatial non-uniform deterioration on the sign surface. To address this gap, we use normalized lidar retro-intensity as dense supervision during model development but performed inference with daytime imagery only to enable efficient and low-cost deployment. Building on these insights, we developed a Double U-Net framework that fuses daytime imagery, sign class information, and lidar-derived depth and normalized retro-intensity during training to ascertain the pixel-level retro-intensity from a single daytime image. The proposed approach: 1) produces pixel-level outputs that preserve localized reflectivity patterns beyond point-based measurements; 2) leverages a joint training objective that couples depth and retro-intensity related supervision to improve spatially consistent predictions; and (3) eliminates the need for lidar at inference time, supporting scalable traffic sign condition assessment using only standard daytime images.
Data Collection
In this study, we used a Livox HAP lidar (Model HAP [TX]), with a detection range of 150 m, a field of view (FOV) of 120° horizontal by 25° vertical, a point rate of 452,000 points per second, and a frame rate of 10 Hz, for 3-D data acquisition. To complement the lidar data, a Logitech 1080p Webcam capable of a 90° extended view and a frame rate of 30 Hz was mounted directly on the lidar. Operated using the ROS, this configuration enabled simultaneous collection of 3-D spatial information and video streaming data. ROS provided the tools and libraries necessary for hardware abstraction, device control, and inter-process communication as well as package management to ensure synchronized data collection from both sensors. All data collected in this project were managed and processed through ROS.
Figure 1 illustrates the installation set-up of the lidar and camera sensors and the research area in this study. Multiple locations within the Columbia area were selected for data acquisition to ensure the collection of a sufficient training data set. The routes chosen included E Broadway, Downtown, W Broadway, MIZZOU Campus, S Providence Road, and N Providence Road. During this process, approximate 9,000 images of traffic infrastructure in 21 classes were captured, providing a comprehensive data set for consequent analysis and model training. As previous studies have shown, the degradation of traffic sign retroreflectivity is primarily influenced by factors such as orientation, observation angle, color, material type, age-related wear, and general environmental exposure such as dew, frost, and temperature ( 7 , 9 , 13 ). These factors lead to visible changes, including fading, discoloration, and surface wear, which affect retroreflective properties. Our model leverages these visible signs of degradation, using data collected under clear, precipitation-free conditions, to predict the retroreflectivity of traffic signs and assess their overall and localized deterioration.
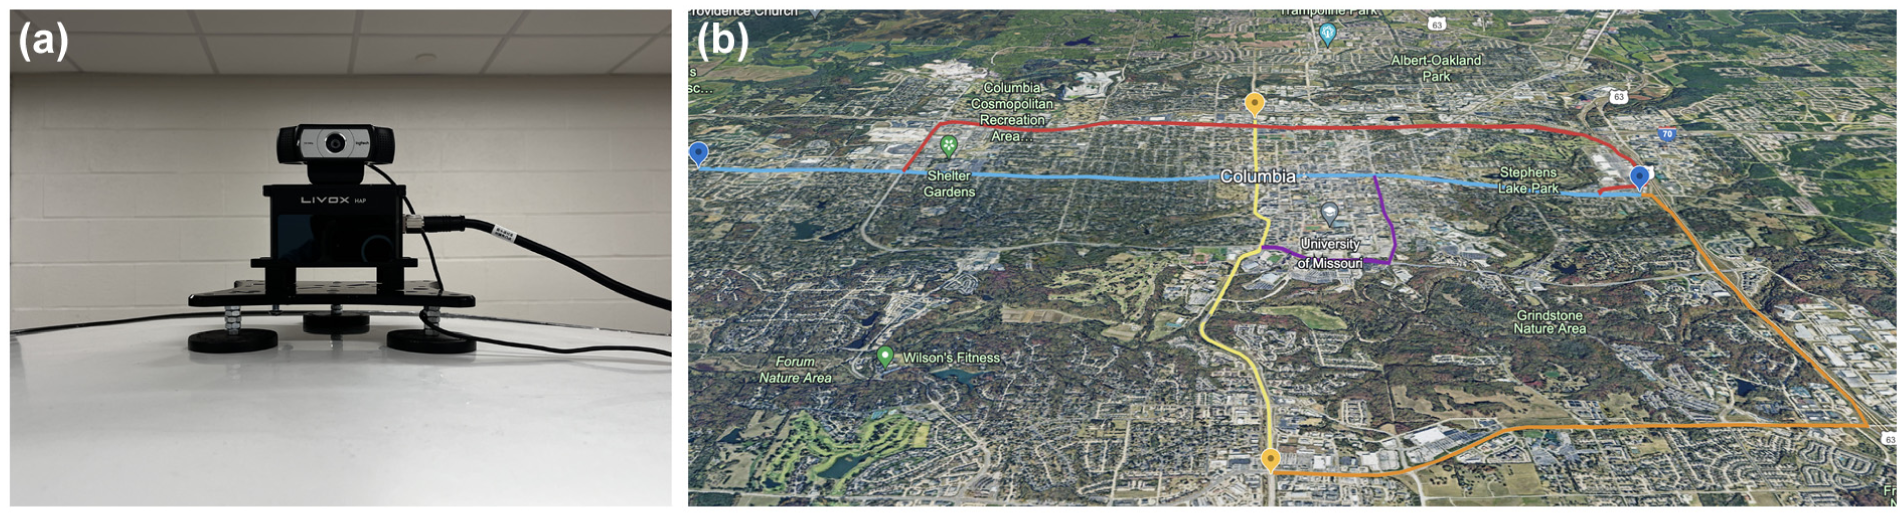
Lidar and camera set-up and research area: (a) LiDAR and camera setup; (b) study area shown on Google Earth base imagery (©2023 Google).
Methodology
In this paper, we proposed a novel two-stage methodological framework for the retro-intensity prediction of transportation infrastructure, as illustrated in Figure 2. The framework consists of five primary sequential steps. The first stage focuses on data preparation, covering steps 1 through 3, while the second stage emphasizes model generation, including steps 4 and 5.
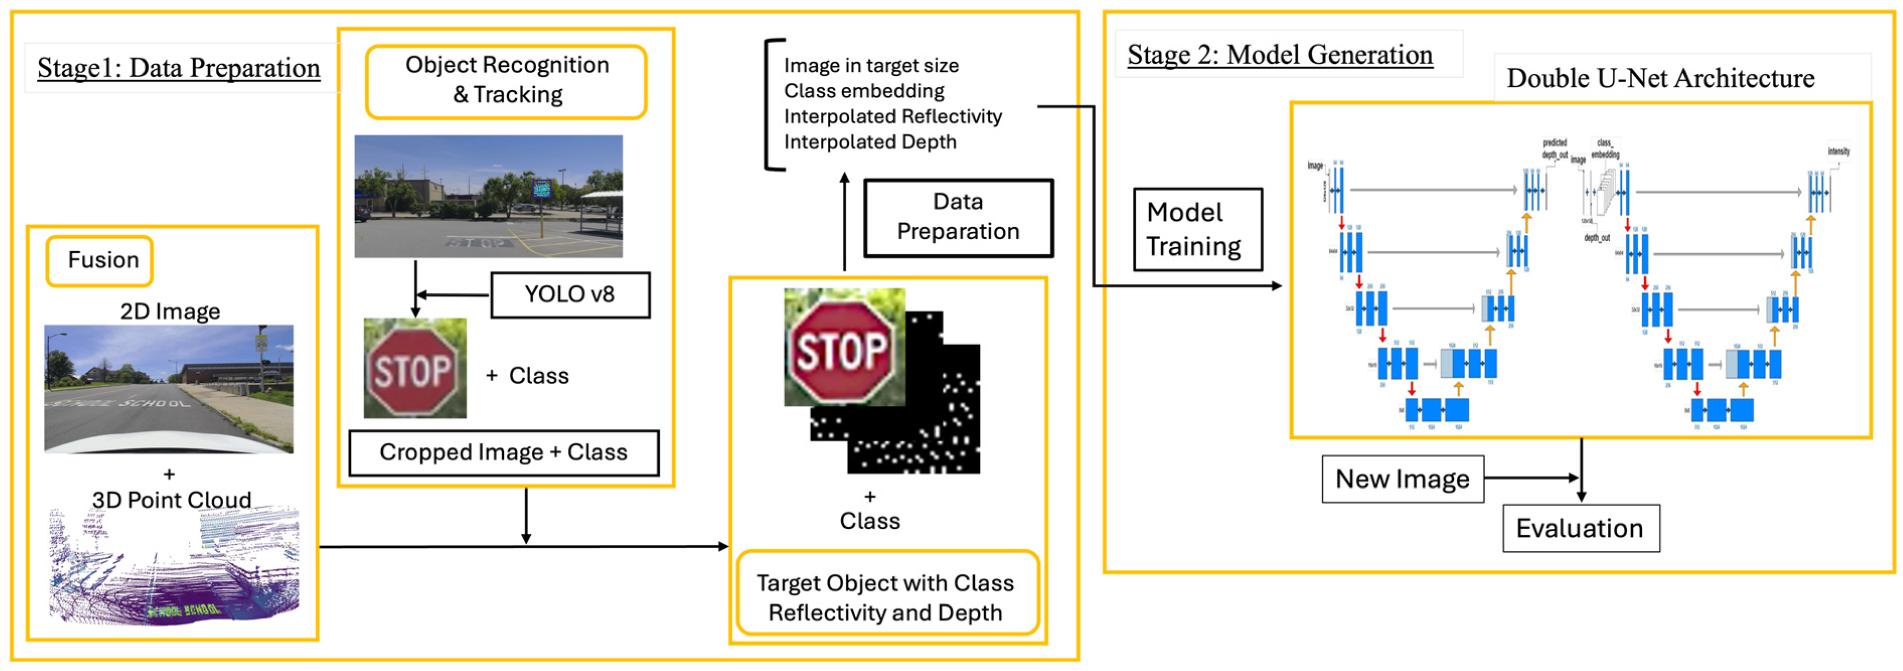
Proposed pipeline.
Initially, data collected from lidar and camera sensors are spatially fused through timestamp alignment, followed by the calibration of the devices’ intrinsic and extrinsic parameters. Subsequently, an advanced object recognition and tracking method, YOLOv8, is used to isolate transportation infrastructure components and extract their corresponding depth and intensity. Third, the cropped images are resized to the target dimensions of 128 x 128 pixels. The corresponding intensity and depth information are interpolated to address the sparse density of the point cloud information, ensuring a more comprehensive representation across the entire image. Thereafter, a Double U-Net architecture is introduced to generate the retro-intensity perception results using the processed data. Finally, a mask of the transportation infrastructure, generated from the SAM using the image, is applied to the retro-intensity perception results. The distribution of predicted retro-intensity and raw retro-intensity within the mask area is then compared to evaluate the model. Below, we provide a detailed description of each step.
Data Fusion
In this project, data fusion involves integrating information from lidar and camera sensors. Using the ROS (
49
) we collected synchronized data streams, ensuring precise temporal alignment through timestamping. For spatial fusion, we first calibrated the camera’s intrinsic parameters, determining the camera matrix and distortion coefficients to correct for lens distortion and define the focal properties. Next, we manually selected corresponding points from the 3-D lidar point cloud and 2-D camera images to obtain the extrinsic parameters, defining the transformation between the lidar and camera coordinate systems. This extrinsic calibration involved optimizing the rotation matrix and the translation vector to align the lidar point cloud with the camera images. Finally, the spatial fusion was performed by projecting the 3-D lidar point cloud onto the 2-D image plane using the calibrated parameters. This projection follows the standard pinhole camera model (
50
,
51
):
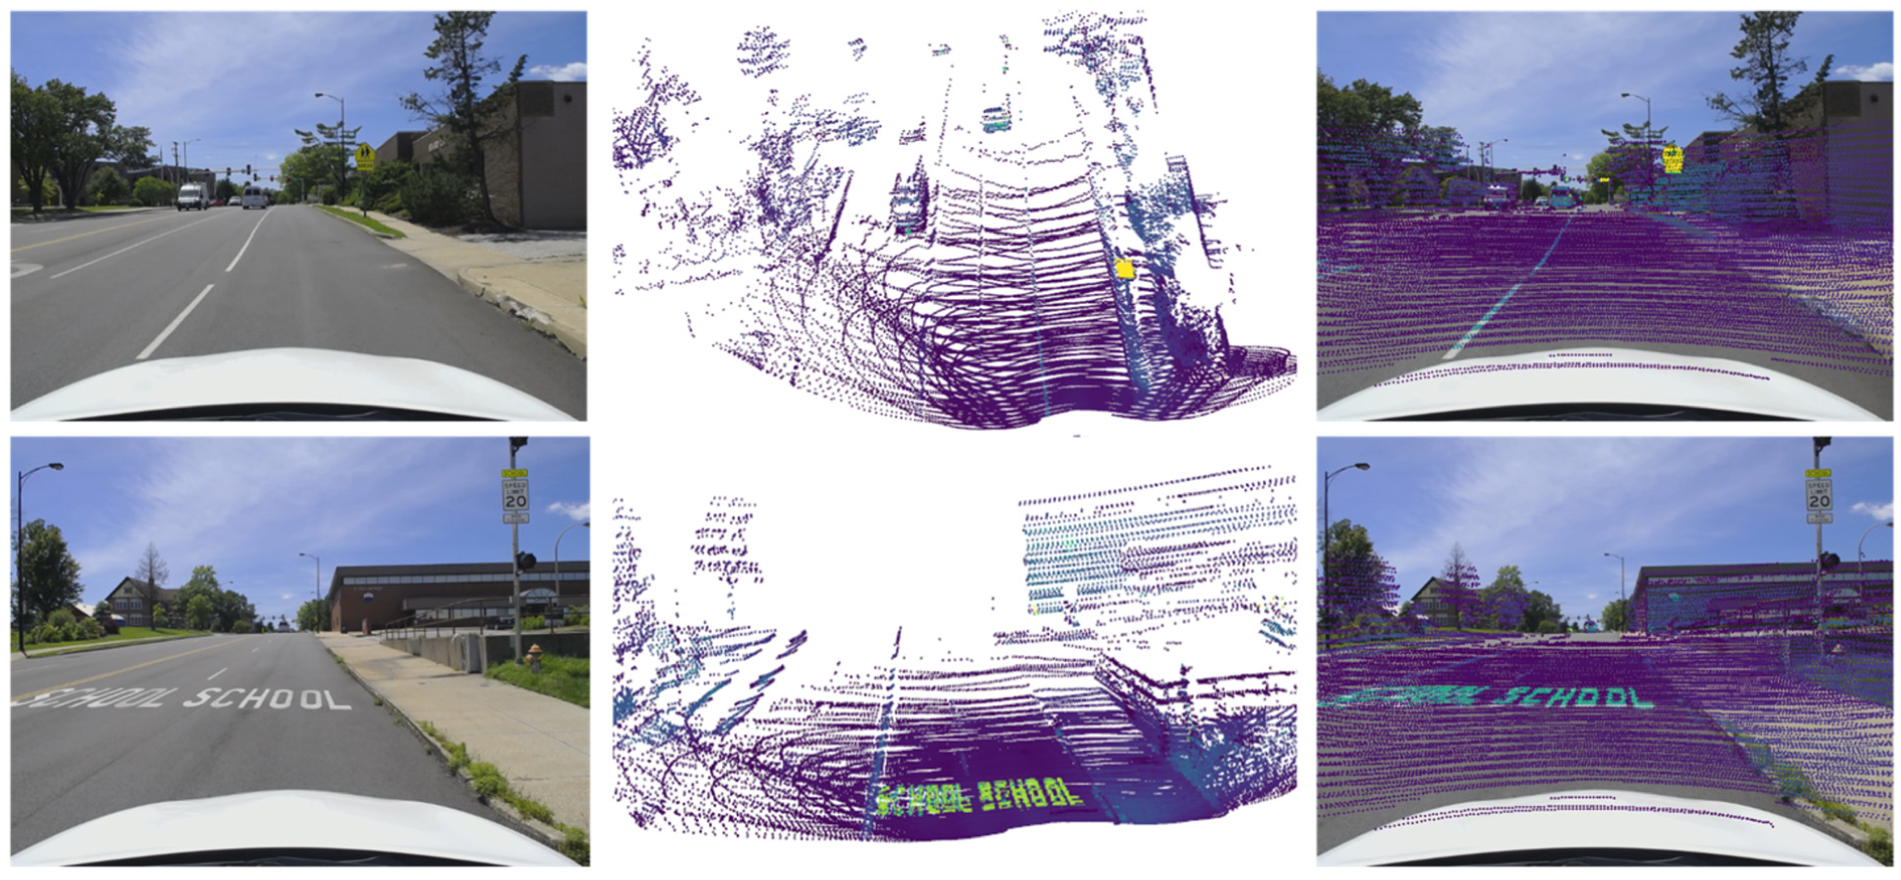
Extrinsic parameter calibration: (a) original image; (b) point cloud data, colored by retro-intensity (yellow: high, green: moderate, purple: no reflectivity); and (c) extrinsic parameter calibration result, colored by retro-intensity.
Object Recognition and Tracking
Accurate and rapid object detection is crucial for identifying and monitoring specific components within transportation infrastructure. In this study, YOLOv8, a state-of-the-art object detection model, which is renowned for its advanced capabilities and rapid processing speed, is adopted for object recognition and tracking. We used a self-tuning YOLOv8 model customized to our specific requirements. This model was trained on a substantial data set of annotated images. More than 10,000 images were manually labeled for 51 distinct classes of transportation infrastructure components, which cover most of the transportation infrastructure in MUTCD, including regulatory signs (stop sign, yield sign, speed limit sign, no parking sign, do not enter sign), warning signs (school sign, deer crossing, railroad crossing sign, slippery sign), guide signs (street sign, one way sign, bike route sign), traffic control devices (traffic light, delineator), and other infrastructure elements (crosswalk, light poles, electric poles). After filtering out suboptimal transportation infrastructure components, such as those with low confidence scores, small areas, or unclear patterns, our collected data set includes 21 of these classes, approximately 9,000 single images. As the image and point cloud data has been fused, the class information, the corresponding depth and retro-intensity information are also obtained through the YOLOv8 model. Among the two tracking algorithms integrated in YOLOv8 (BoT-SORT and ByteTrack), we adopted ByteTrack in this study because of its lightweight design, computational efficiency, and its ability to associate low-confidence detections, which make it suitable for large-scale traffic sign data sets. YOLOv8’s advanced detection and reliable tracking provide precise and efficient identification of transportation infrastructure components, thus providing a clear foundation for subsequent data set generation, model establishment, and evaluation. Figure 4 demonstrates the process of object recognition and tracking, as well as the depth and retro-intensity information acquisition. In Figure 4, from left to right, it shows the object recognition and tracking result through the self-tuning YOLOv8 model, the calibrated point cloud information colored by retro-intensity, the target area with point cloud information, and the cropped image with class, depth, and retro-intensity information.
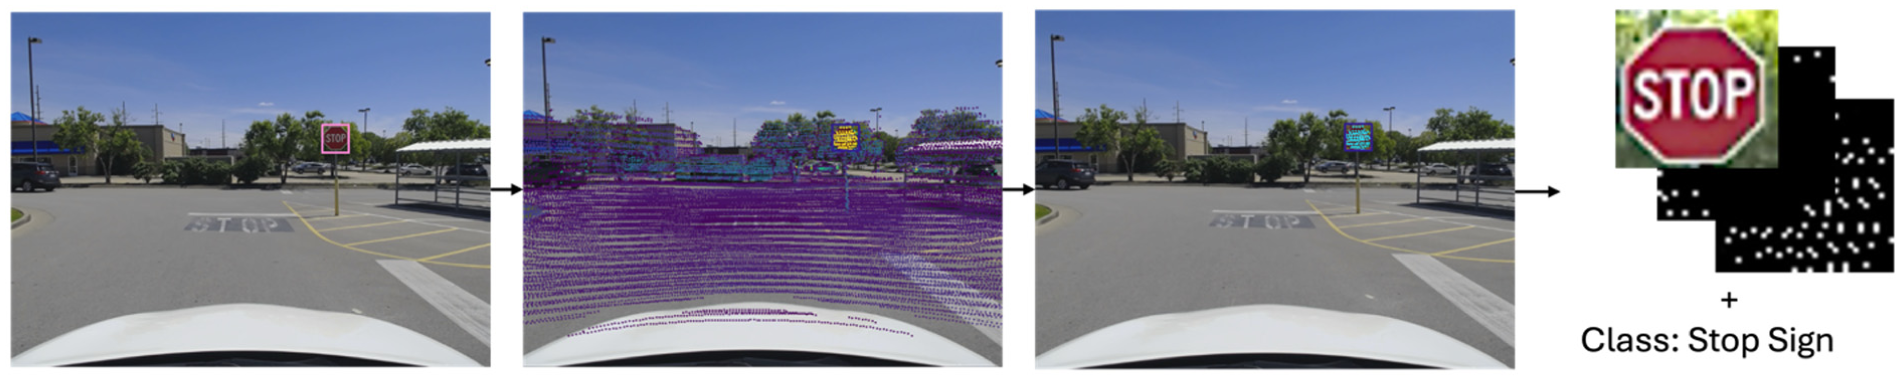
Recognition and tracking process through YOLOv8 for image and corresponding point cloud.
Training Data Generation
To prepare the training data set, about 9,000 images of transportation infrastructure, along with their corresponding depth and intensity point cloud information, as well as class information, were collected and organized into four distinct folders, forming a comprehensive training set. The image folder comprises cropped images of transportation infrastructure components, extracted using the self-tuning YOLOv8 model.
Since raw lidar retro-intensity is strongly affected by beam distance and incidence angle (
38
,
52
,
53
), using uncorrected values would introduce systematic bias into the labels. We therefore normalize the raw retro-intensity values before interpolation, following established calibration frameworks (
38
). Let
Given the sparsity of point cloud data collected from low-resolution lidar, a linear interpolation method was employed to fill the gaps. Consequently, both the depth and intensity data were interpolated, converted to integer values, and saved as images in the respective depth and intensity folders. The depth values range from 0 to 70, while the intensity values range from 0 to 255. The label folder contains the labels generated by YOLOv8, where the class information is the only relevant detail in this study. This structured organization of data provides the model with a variety of training samples, which facilitate effective and more accurate predictions. Figure 5 illustrates the details of the data generation process. In Figure 5, the first line shows the original cropped image, the raw retro-intensity collected from lidar, and the linear interpolated result from the raw retro-intensity, while the second line shows the depth information. Notably, in the raw retro-intensity image in Figure 5, we can clearly observe that some points in the central and edge areas of the pedestrian sign have retro-intensity different from the surrounding points. This variation can lead to a relative amplification trend of these differences in the interpolated results.
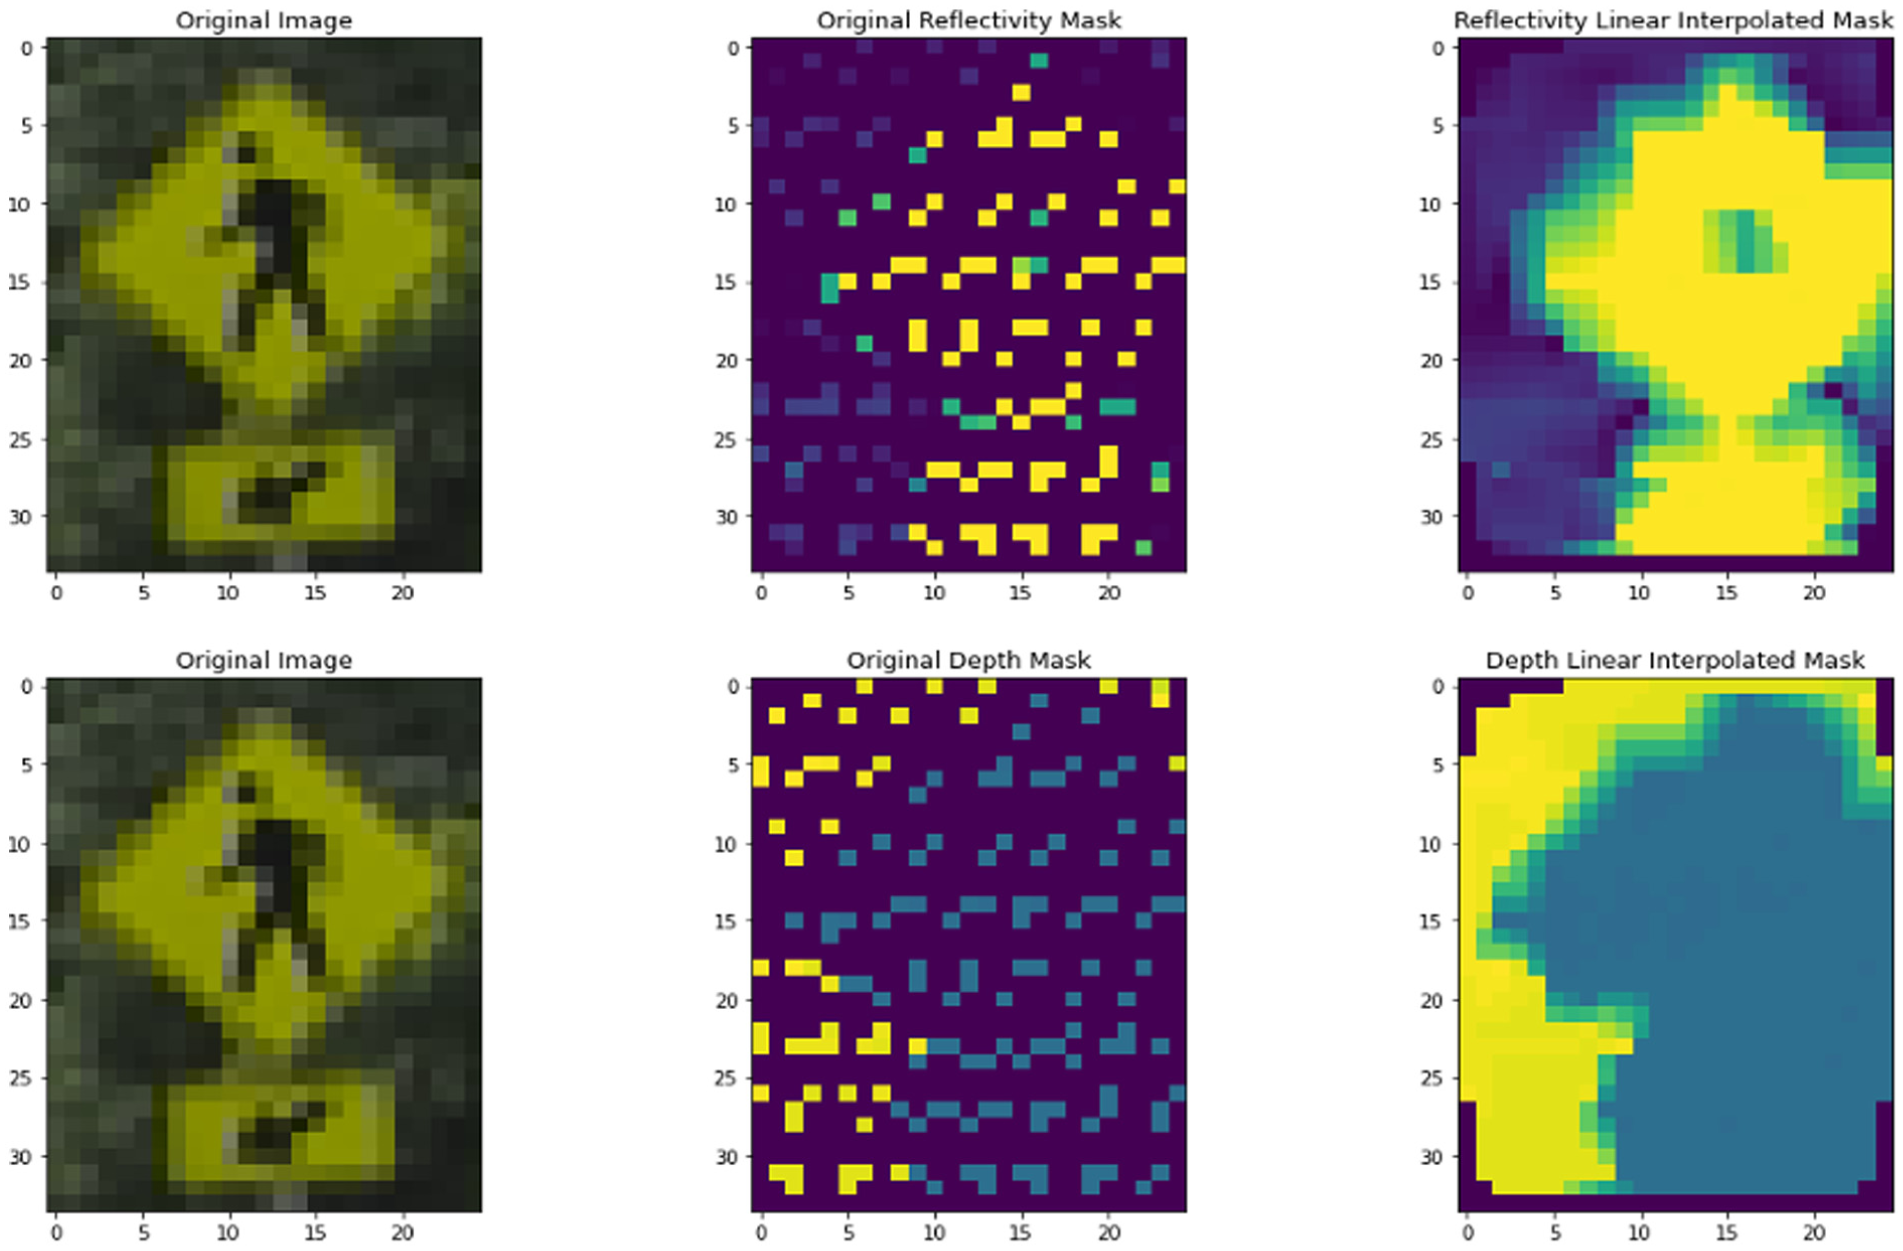
Data generation for cropped image: (a) raw retro-intensity, interpolated retro-intensity; (b) cropped image, raw depth, interpolated depth.
Double U-Net Model
Model Structure
The default U-Net model is a convolutional neural network architecture designed for image segmentation tasks, featuring a symmetric encoder-decoder structure that typically produces a binary mask for segmentation results ( 54 ). The U-Net model was modified because of its demonstrated ability to effectively preserve spatial information throughout the feature extraction process, facilitated by its unique architecture, specifically the skip connections ( 54 ). This capability is particularly critical for pixel-level tasks, such as retro-intensity prediction, where maintaining localized accuracy is essential. While transformer-based segmentation models have shown effectiveness in various applications ( 55 ), vision transformers are reported to be less data-efficient when trained on insufficient amounts of data because of weaker inductive biases such as locality ( 56 ). Therefore, CNN-based architectures such as U-Net are more suitable for our moderate data set size and provide a favorable accuracy–efficiency trade-off for dense pixel-level prediction in typical training and inference settings ( 54 ). In this study, we introduced a modified two-stage Double U-Net architecture aimed at predicting retro-intensity masks for transportation infrastructure components, with depth prediction serving as an intermediate step to enhance the final retro-intensity prediction. In the first stage, the model uses the cropped image to predict a depth mask, leveraging the U-Net’s demonstrated efficacy in generating segmentation masks. Instead of mapping each 64-component feature vector to binary classes, we retained the feature vector as a numeric value to facilitate depth prediction. Subsequently, the predicted depth mask is integrated with the original cropped image and class embedding in the second stage to predict retro-intensity.
This hierarchical approach leverages the spatial correspondence between depth and retro-intensity data from lidar, with the depth information aiding in distinguishing points that are on the sign from those that are not. This is because the depth and retro-intensity share the same lidar point cloud positions, and depth can effectively assist in predicting retro-intensity by clustering information and differentiating relevant areas. Moreover, objects closer to the lidar typically have denser point clouds, leading to more accurate retro-intensity measurements. This proximity allows for a more precise interpolation of the retro-intensity, enhancing the accuracy of the model’s predictions. This dual role of depth data in distinguishing regions and refining reflectivity predictions highlights its importance in the model.
To ensure non-negative outputs, a ReLU activation function is applied after each 1x1 convolution layer at the end of each U shape. Figure 6 illustrates the structure of the two-stage Double U-Net model, highlighting the modifications implemented and the performance improvements.
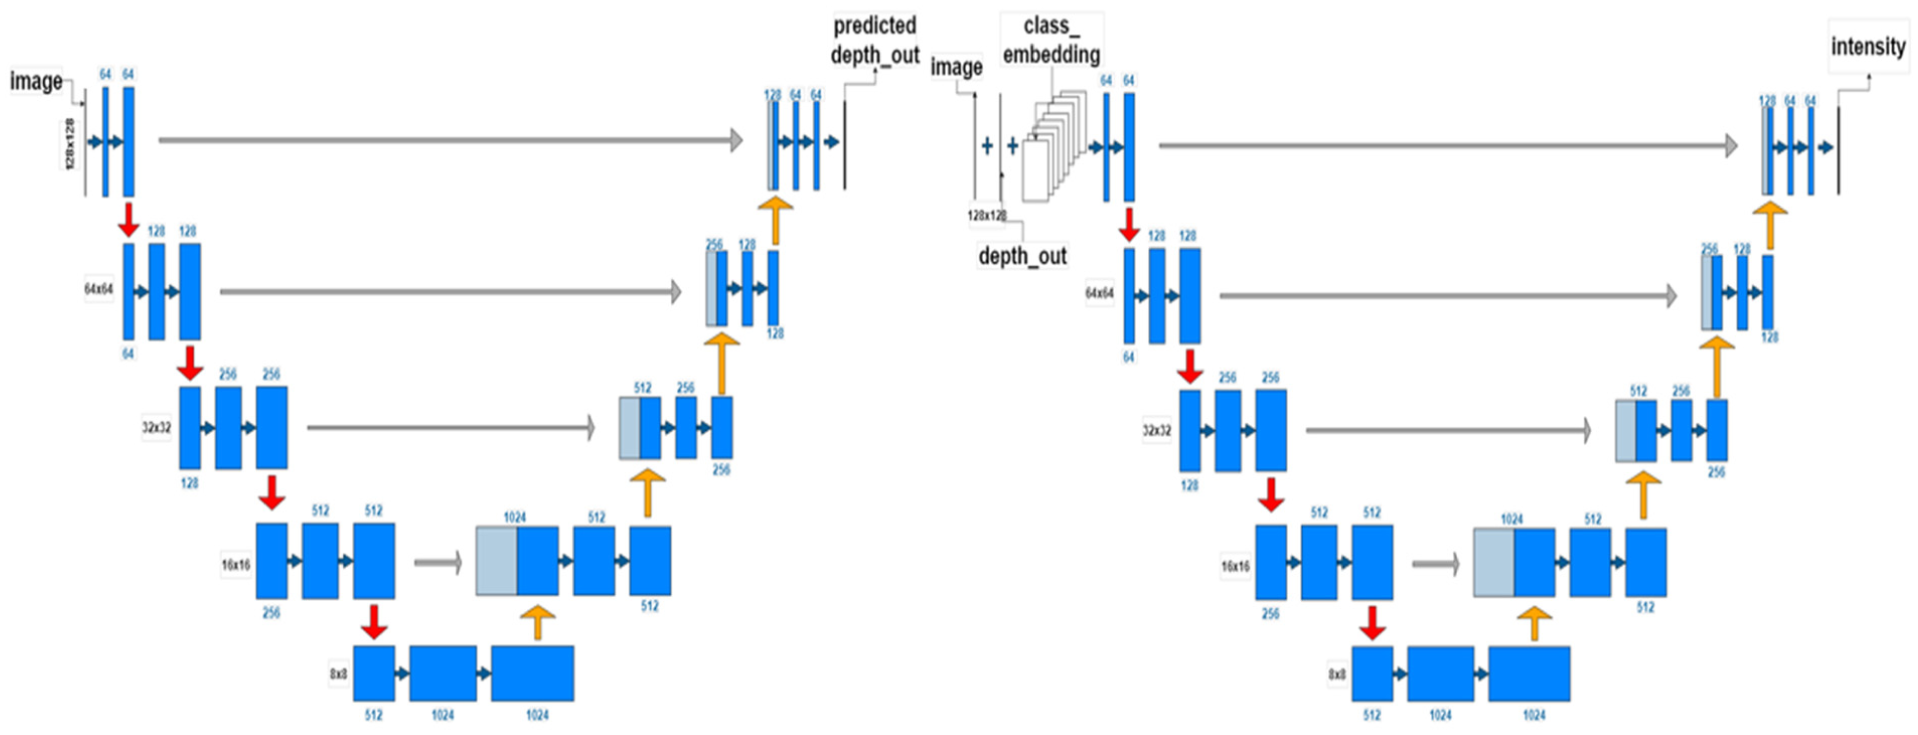
Double U-Net retro-intensity model.
Based on Figure 6, all the cropped transportation infrastructure component images have been resized to 128 × 128 pixels as input image tiles. Following the traditional U-Net structure, the input image is processed through an encoding path consisting of two convolution layers, each followed by a ReLU activation function, and max-pooling layers to extract features. The decoding path then reverses the process using up-convolutional layers to up-sample the feature maps, which are concatenated with corresponding feature maps from the encoding path. Subsequently, a convolution layer with ReLU is applied to generate the depth mask. Finally, the predicted depth mask is concatenated with the image tile and the class embedding information to undergo the same process a second time in the second stage, finally generating the retro-intensity mask.
Loss Function
The Double U-Net retro-intensity prediction model aims to minimize two components, the auxiliary depth loss and the primary retro-intensity loss. Despite the depth prediction not being explicitly presented in the final retro-intensity result, it proves beneficial in estimating retro-intensity. The total loss function is shown in Equation 1. The weighted coefficients reflect the relative importance of each component, with retro-intensity prediction as the primary objective and depth prediction serving as an auxiliary task to enhance spatial understanding.

where both
where
In this process, the interpolated depth mask and retro-intensity mask are worked as ground truth.
This two-stage methodology significantly improves the accuracy of retro-intensity predictions, aiming to develop a cost-effective solution that achieves the capabilities of lidar-based systems without the associated high costs from lidar itself.
Post-Processing of Model Result
The retro-intensity derived by lidar shows high correlation with retroreflectivity, according to Ai & Tsai’s research ( 38 ). To mitigate biases introduced by variations in beam distance and incidence angle, Ai & Tsai proposed a normalization method for retro-intensity values. This normalization process yields more consistent retro-intensity measurements, which are then used to evaluate the reflective properties of transportation infrastructure. Additionally, a standard for assessing transportation infrastructure using these normalized retro-intensity values in connection with retroreflectivity values from the MUTCD was also established. Inspired by Ai & Tsai’s paper, we also normalized the retro-intensity values obtained from the lidar system to ensure consistency and comparability. This normalization process provides a more accurate representation of the transportation infrastructure’s actual reflective properties, aligning with the criterion for future research.
Afterward, we employed the SAM to isolate the traffic sign areas within the images. This model precisely segments the traffic signs, enabling focused analysis of the reflectivity data within these regions. We then compared the normalized retro-intensity values within these segmented areas to the raw retro-intensity data and the interpolated retro-intensity data to evaluate the accuracy of our predicted retro-intensity.
Results and Discussion
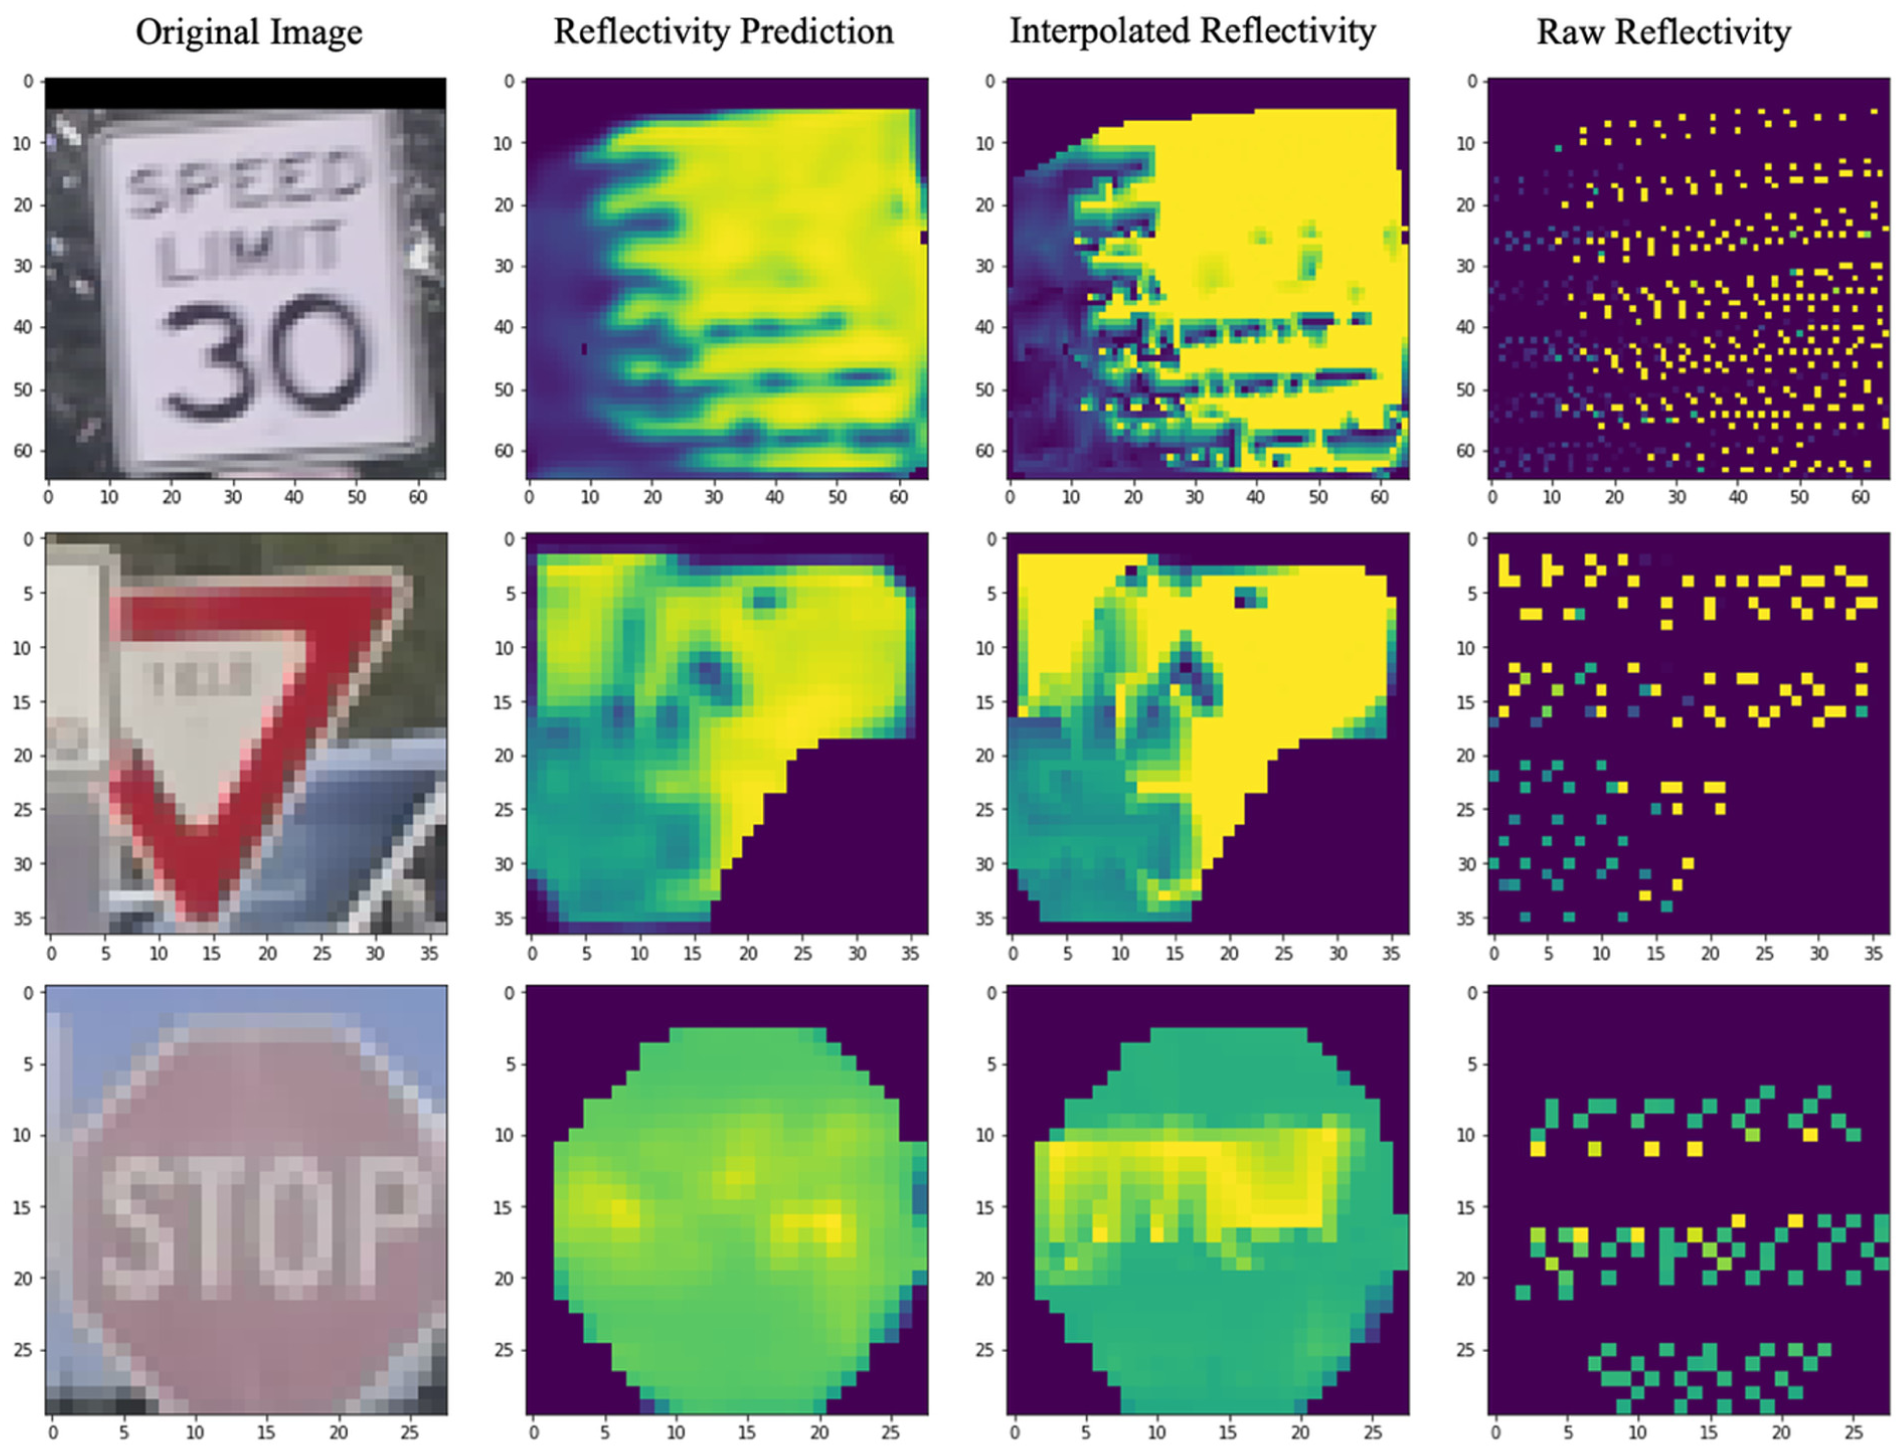
The performance of the Double U-Net model was evaluated on a test data set which is composed of about 2,952 single images along with corresponding lidar depth, retro-intensity, and class information. To ensure uniformity in evaluation process, the data processing and preparation for the test data set followed the same procedures as the training data set. Figure 7 exemplifies the model’s results, showing the predicted retro-intensity compared with the interpolated and raw retro-intensity. In this section, the normalized retro-intensity values that range from 0 to 1 within the transportation infrastructure segmentation area are compared. In Figure 7, different scenarios are presented: the first three rows represent cases where the retro-intensity of the signs is clearly distinct, whereas the last two rows illustrate signs with reduced legibility, such as those affected by occlusion, fading, or loss of retroreflectivity.
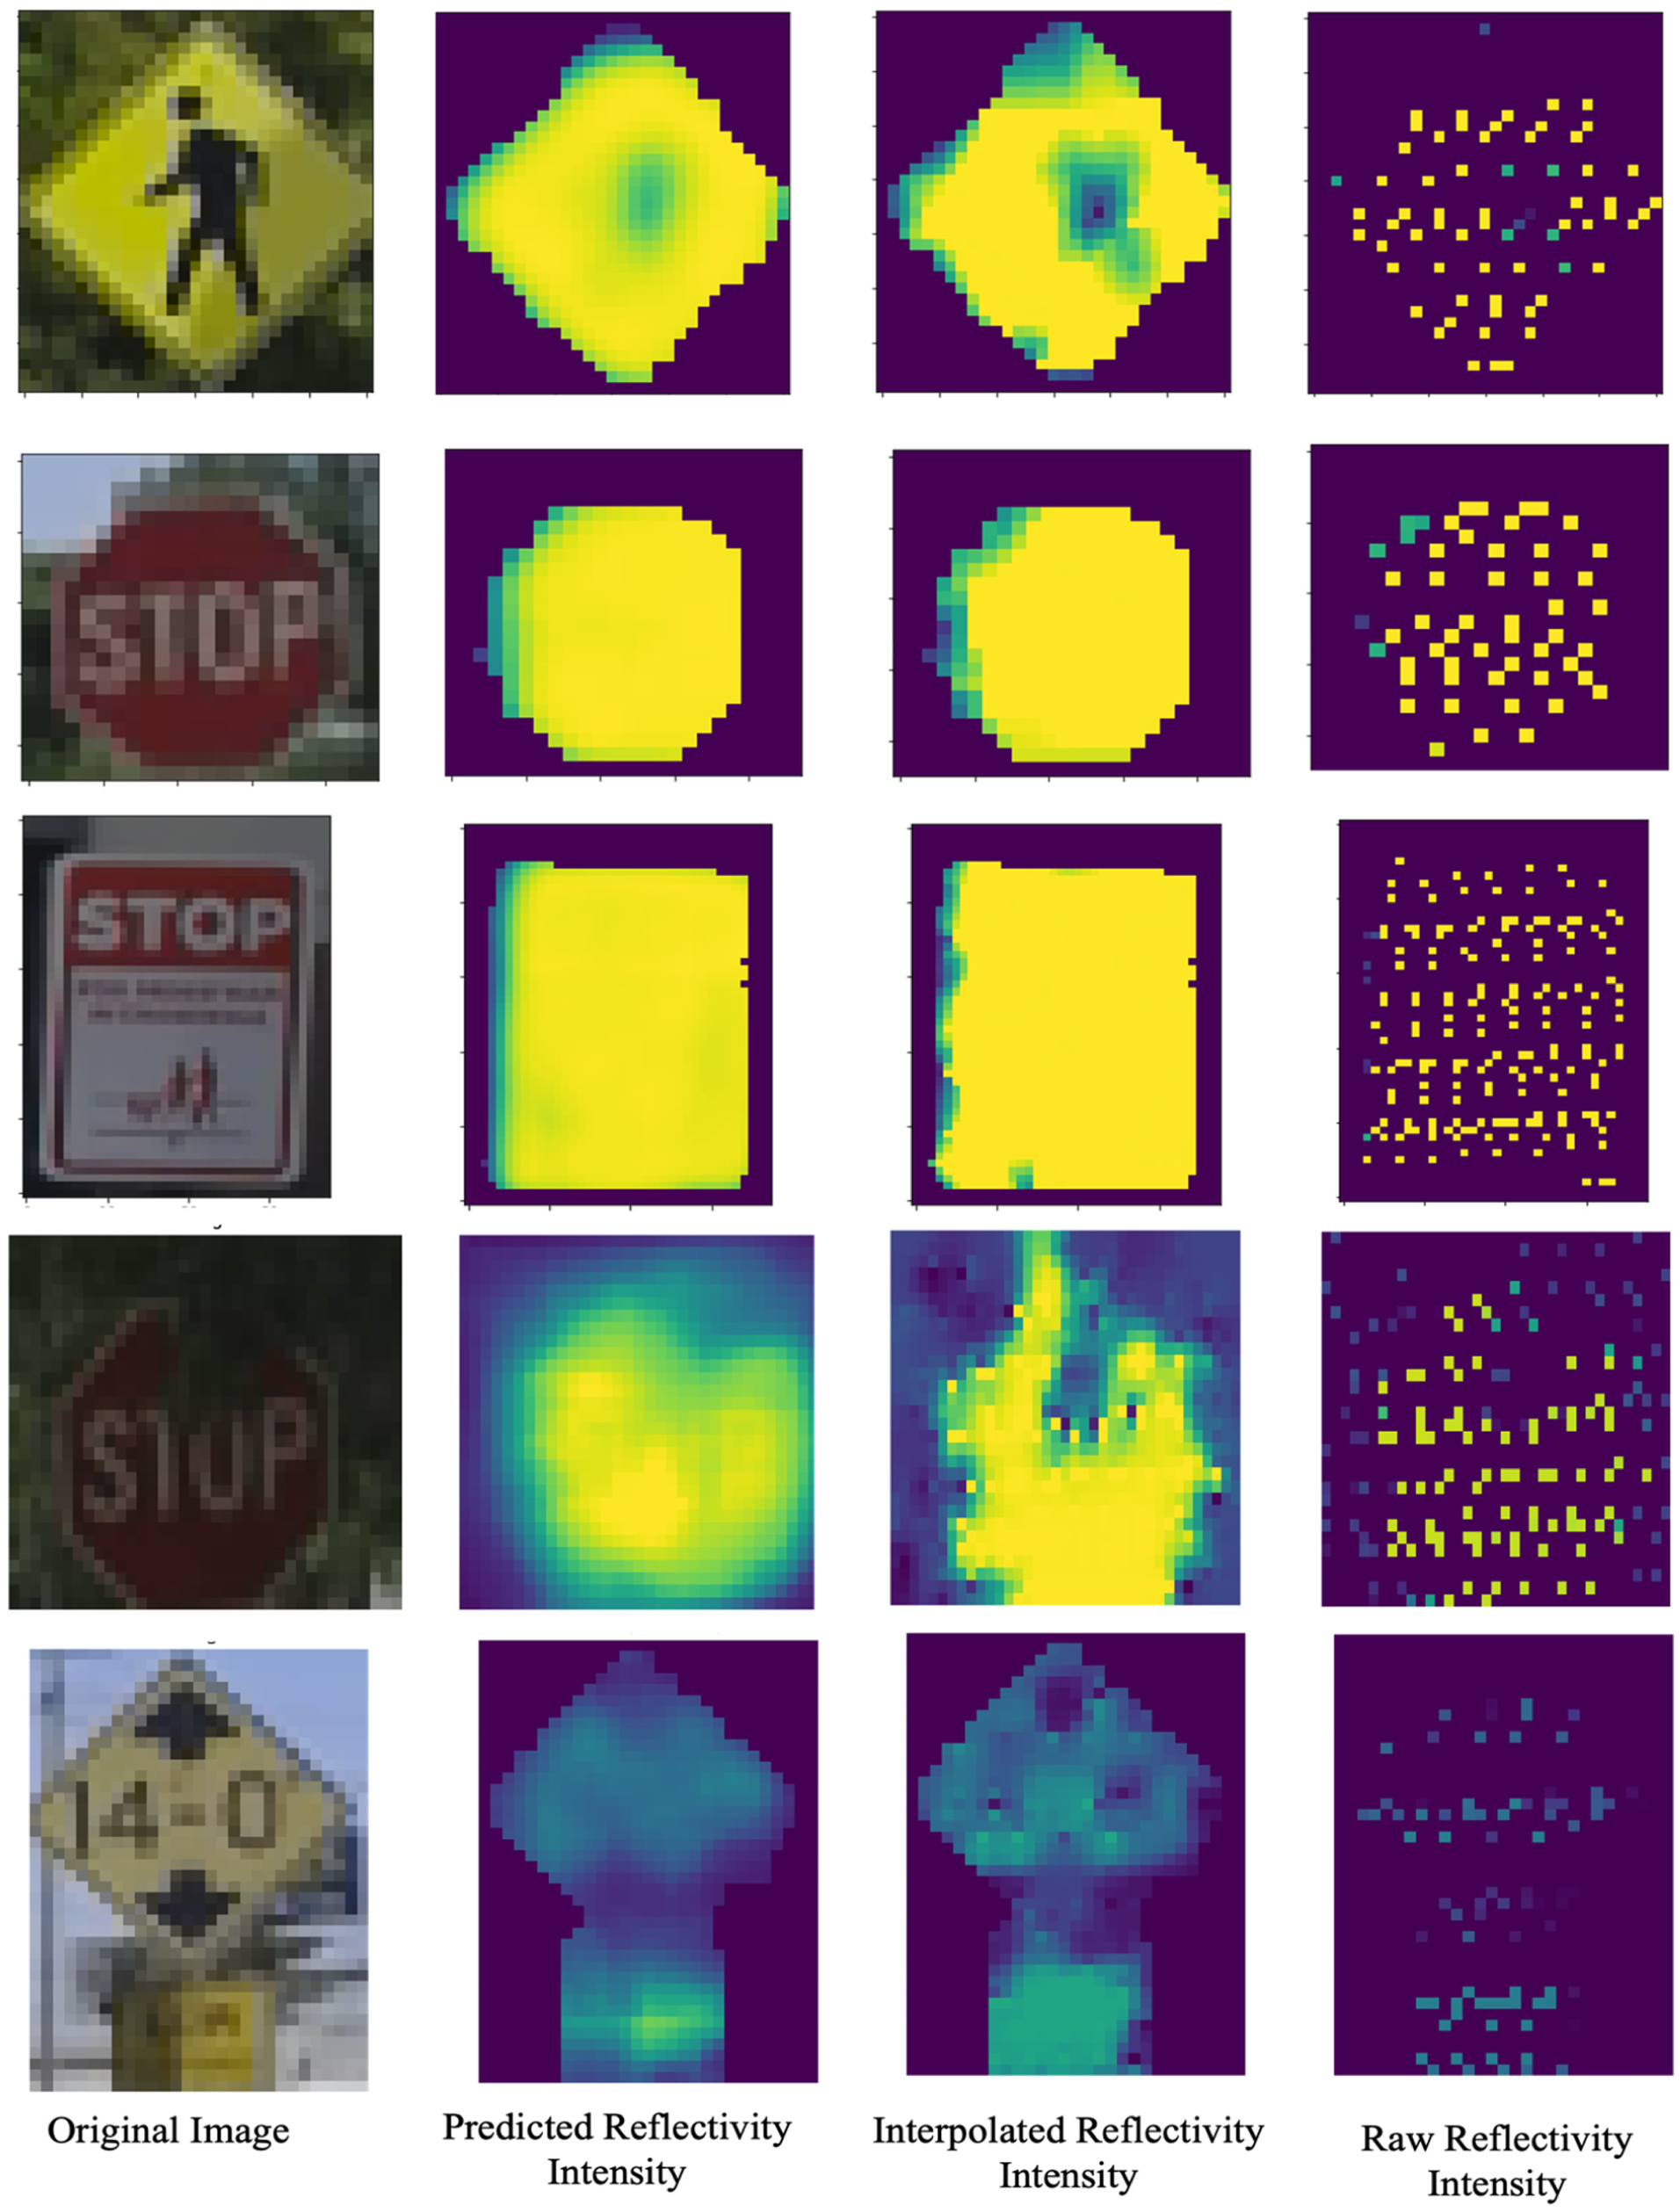
Examples of model prediction results.
In Figure 7, the images from left to right display the cropped image, the predicted retro-intensity within the mask, the interpolated retro-intensity within the mask, and the raw retro-intensity within the mask. From this figure, the predicted masks consistently identify these anomalous regions, demonstrating their capability to highlight areas of concern when compared with the raw and interpolated images. Additionally, the distribution of the predicted retro-intensity at the 0th, 25th, 50th, 75th, and 100th percentiles exhibit a high degree of similarity with both the interpolated and raw retro-intensity distributions. Specifically, when compared with the distribution of interpolated retro-intensity, the distribution of the predicted retro-intensity shows absolute different rates of 10.33%, 2.80%, 1.30%, 1.18%, and 0% at the 0th, 25th, 50th, 75th, and 100th percentiles, respectively. In comparison with the raw retro-intensity distribution, the absolute differences are 15.85%, 4.76%, 2.32%, 1.64%, and 0% at the same percentiles. These results indicate a strong correspondence between the predicted and actual retro-intensity distributions, demonstrating the accuracy of the predictions.
To assess the model’s accuracy in detecting degradation, we manually placed non-reflective tape on certain transportation infrastructure elements. This set-up allowed us to evaluate the model’s ability to accurately predict retro-intensity. Figure 8 shows the predicted result within the mask area, along with the result without degradation.
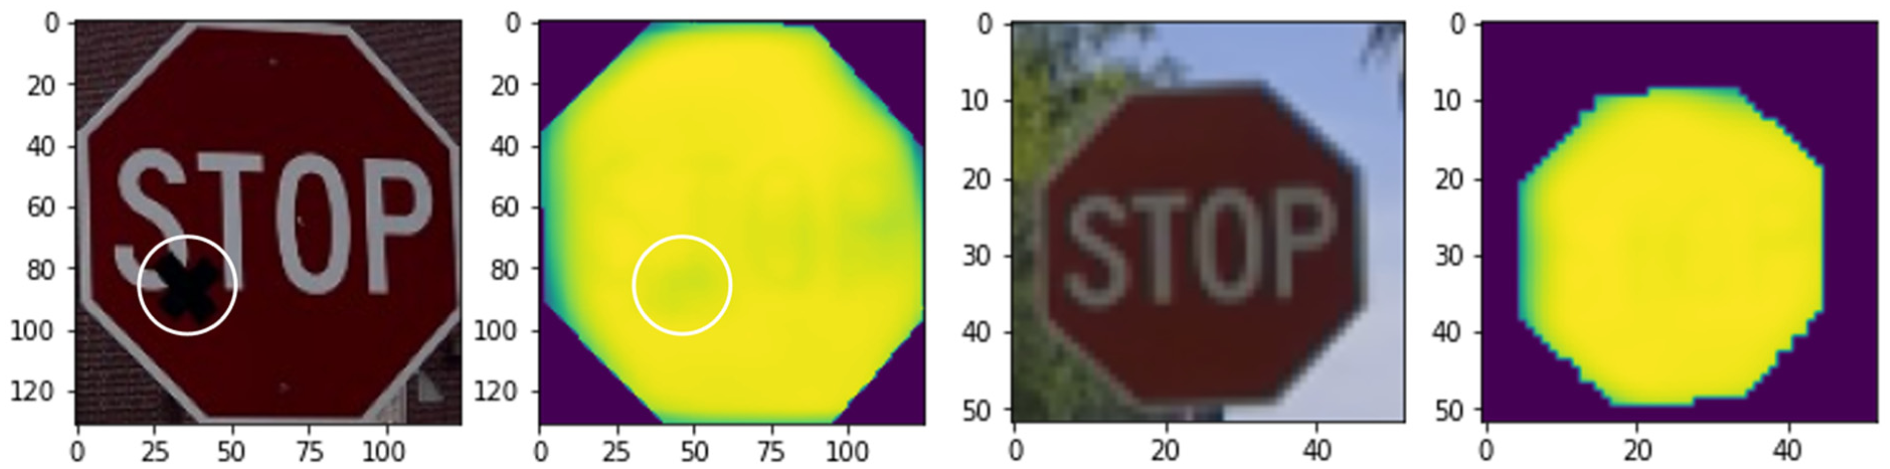
Model performance with manually degraded sign and natural sign.
Evaluation Metrics
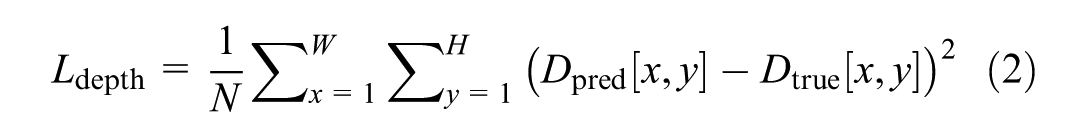
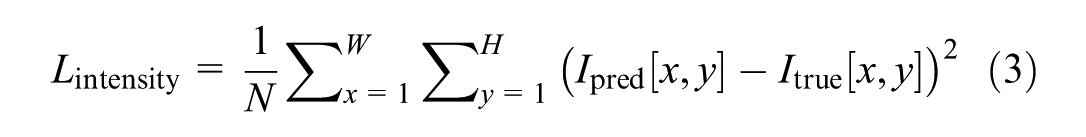
To evaluate the predicted retro-intensity quantitatively, three main metrics were used: MSE, SSIM ( 57 ), and the Mann–Whitney U Test. These metrics help in comparing the predicted reflectivity against both interpolated reflectivity and raw reflectivity values. MSE is a common metric used to measure the average squared difference between predicted values and actual values. It provides a straightforward quantification of the prediction error. A lower MSE indicates better predictive accuracy. The equation for MSE is:
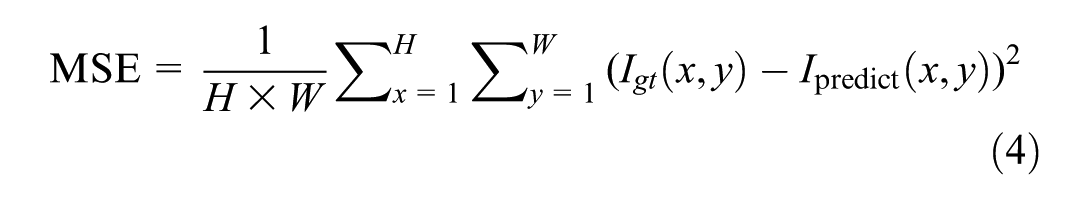
where
We calculate the MSE between the predicted reflectivity and interpolated reflectivity over the entire image to ensure a robust comparison. The SSIM is used to measure the similarity between two images. Unlike MSE, SSIM considers changes in structural information, luminance, and contrast. It provides a more perceptually meaningful measure of image quality ( 58 , 59 ). The SSIM equation is defined in Equation 5.
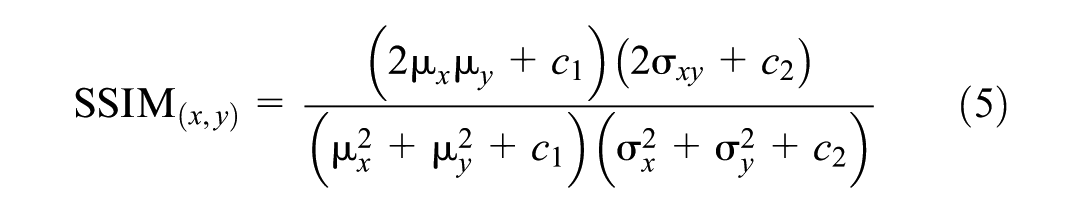
where
A higher SSIM value indicates higher similarity.
The Mann–Whitney U Test ( 60 ) is a nonparametric statistical test used to determine whether there is a significant difference between the distributions of two independent samples. This test is particularly useful for comparing sparse data points, such as raw reflectivity data, with the corresponding predicted reflectivity values. The test evaluates whether the two samples come from the same distribution, providing a measure of the statistical significance of the differences observed. The Mann–Whitney U statistic is defined in Equation 6.

where
Evaluation with Interpolated Reflectivity
As the Double U-Net model is trained using the interpolated retro-intensity, we first compare the predicted retro-intensity against the interpolated retro-intensity. Since both of these two data sets are generated as complete images, it is straightforward to use image-based metrics such as MSE and SSIM, which provide quantitative measures of the overall error and structural similarity. In this study, MSE is used to measure the average squared difference between the predicted retro-intensity and the interpolated retro-intensity, providing a measure of the prediction error across the entire image. While SSIM evaluates the perceptual similarity, considering luminance, contrast, and structural information.
Result
The MSE values at the 0th, 25th, 50th, 75th, and 100th percentiles are 0.000595, 0.008813, 0.016158, 0.030599, 0.295741, respectively. The distribution of MSE values at different percentiles indicates that the majority of prediction errors are relatively small, with the first 75% of MSE values being below 0.030599, suggesting that the model performs well in most cases. However, the MSE value at the 100th percentile is 0.295741, indicating the presence of outlier cases with significantly larger prediction errors. These cases may require further investigation and optimization. As shown in Figure 9, the histogram plot of MSE illustrates that the majority of MSE values are concentrated at the lower end. Table 1 summarizes the MSE values across different traffic sign classes. The median MSE ranges from 0.0044 for the “Do Not Enter” sign to 0.1611 for the “Deaf Child Area” sign, reflecting substantial variability in prediction accuracy among classes. Categories with very limited sample sizes, such as “Deaf Child Area,”“Permit Parking Only,”“Stop Ahead,” and “Rail Road Crossing,” tend to show higher MSE values, likely as a result of insufficient training data. Moreover, large standard deviations (SD) in certain categories, most notably the “Street Sign” class suggest instability in model performance. This variability, particularly in “Street Sign” may result from the wide diversity of shapes, colors, and visual conditions encompassed within the class, which increases the complexity of accurate recognition.
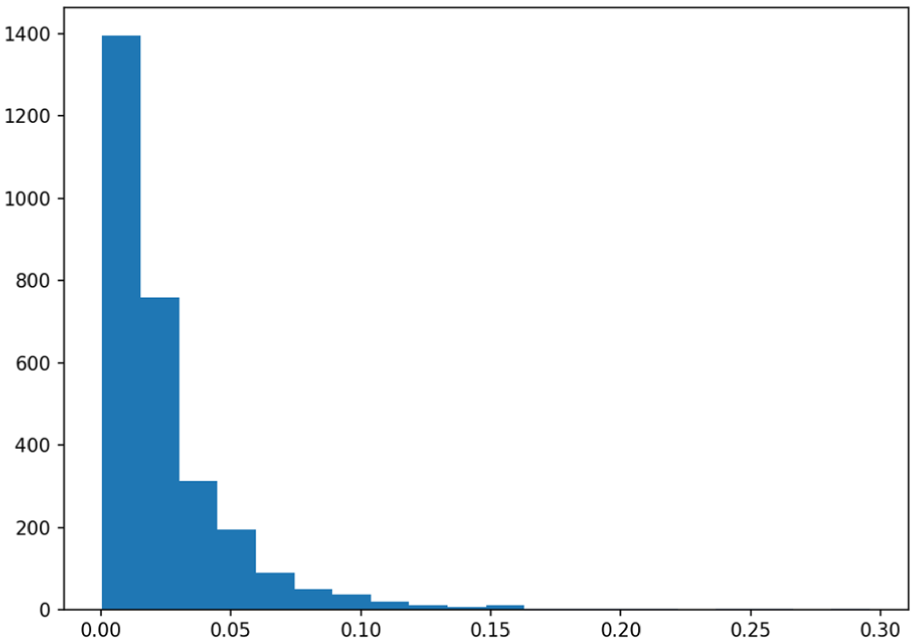
Histogram plot of mean square error (MSE) between normalized predicted retro-intensity and normalized interpolated retro-intensity.
MSE Analysis of Predicted Retro-Intensity by Traffic Sign Class
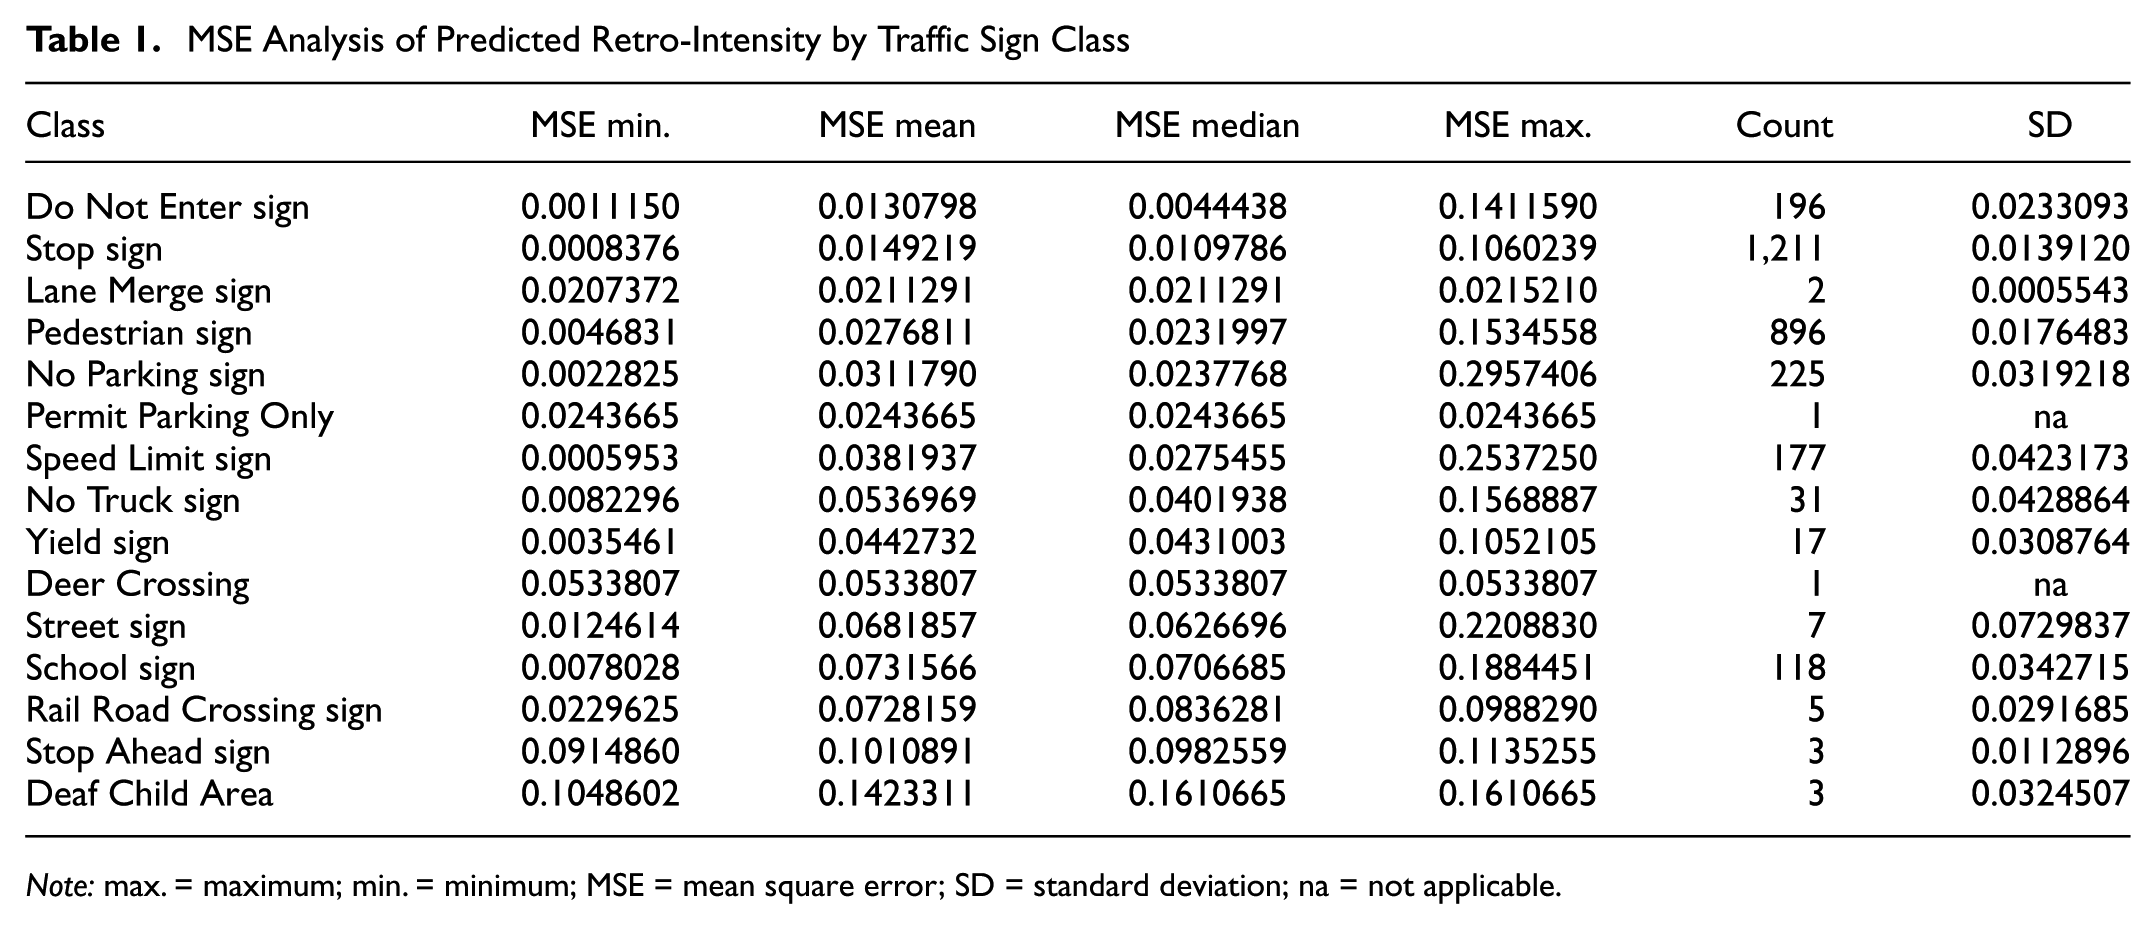
Note: max. = maximum; min. = minimum; MSE = mean square error; SD = standard deviation; na = not applicable.
The SSIM distribution reveals significant insights into the structural similarity between predicted and interpolated retro-intensity images. Figure 10 provides the histogram plot of the SSIM between predicted retro-intensity image and interpolated retro-intensity image. Specifically, the distribution reveals that the SSIM values range from 0.0162 at the 0th percentile, to 0.4334 at the 25th percentile, 0.5413 at the 50th percentile, 0.6662 at the 75th percentile, and reach up to 0.8864 at the 100th percentile. This indicates a wide range of SSIM values, with a noticeable concentration toward higher similarity indices. This similarity implies that the predicted retro-intensity images closely match the interpolated ones for luminance, contrast, and structure, thereby confirming the effectiveness of the Double U-Net model in maintaining the essential visual and structural properties of the images.
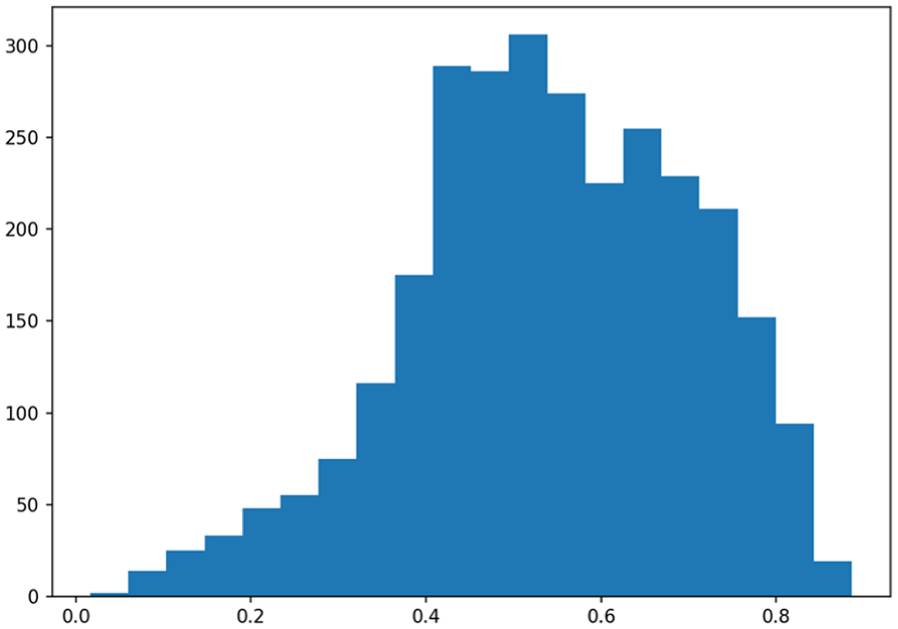
Histogram plot of structural similarity index measure (SSIM) between predicted retro-intensity image and interpolated retro-intensity image.
Figure 11 presents the mean and median SSIM values for various traffic sign classes, accompanied by their respective sample sizes. Significant variations in SSIM values are observed across classes. For instance, the “Do Not Enter” sign demonstrates high SSIM values approaching 1, reflecting strong similarity between the predicted retro-intensity and the interpolated ground truth reflectivity. Conversely, the “Deaf Child Area” exhibits relatively lower SSIM values, indicating greater discrepancies for this class in our test set.
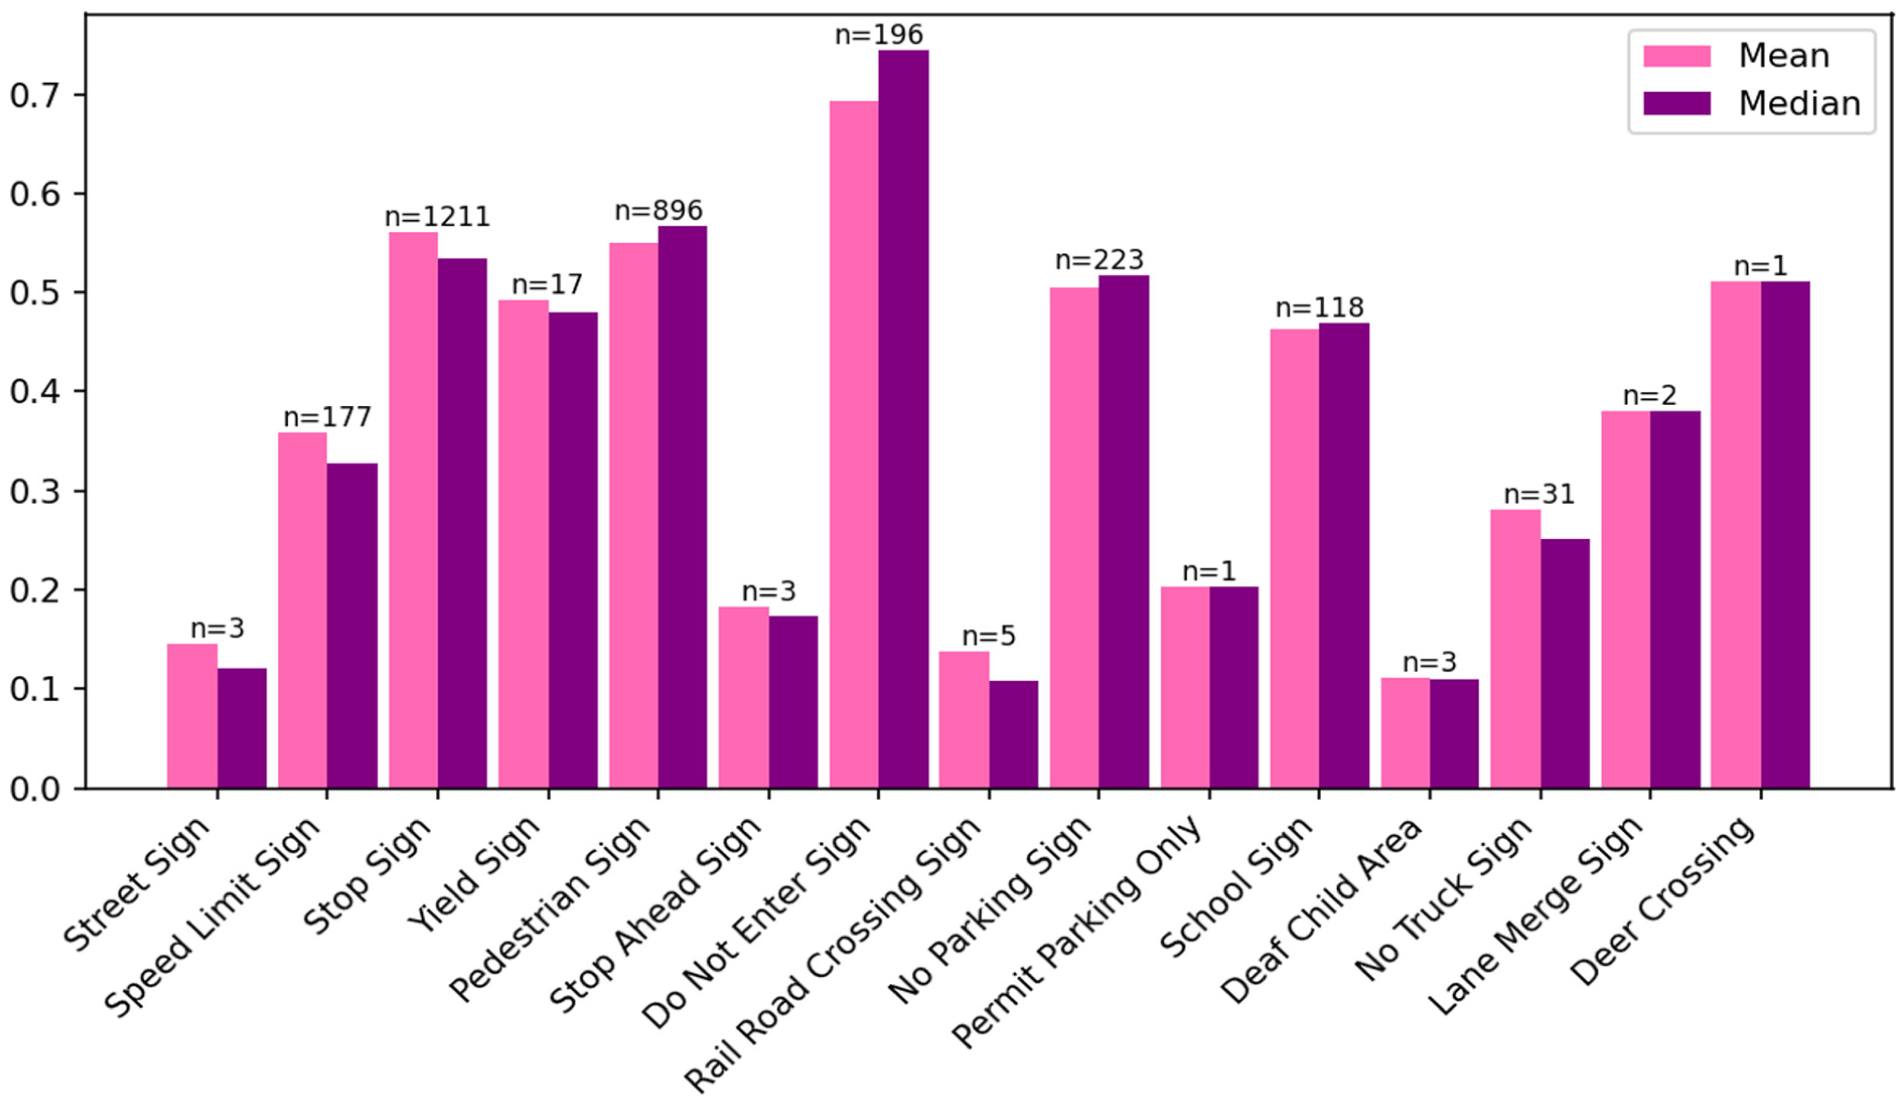
Structural similarity index measure (SSIM) statistics by class.
It should be noted that the class-level SSIM statistics are influenced by both class-specific variability and sample size. Importantly, sample size mainly affects the stability and representativeness of the reported mean and median SSIM, rather than directly determining whether SSIM is high or low. For example, “Deer Crossing” sign and “Lane Merge” sign show moderate to good SSIM, while “Deaf Child Area” sign shows a low SSIM. These cases illustrate that, when sample size is extremely small, the reported SSIM can be unstable and should not be interpreted as a reliable indicator of typical class performance. Therefore, we interpret SSIM differences more confidently for classes with sufficient samples and treat results for very small samples as preliminary observations.
Evaluation with Raw Reflectivity
Evaluating the predicted retro-intensity against raw retro-intensity presents a unique challenge because of the sparsity of raw retro-intensity data. Raw retro-intensity data points are scattered and do not form a complete image, making direct comparison difficult. To evaluate the accuracy, we adopt both local and global methods because of the sparse nature of the raw data. The local method involves averaging the predicted retro-intensity values over a
For a global comparison, we consider the distribution of values. Besides comparing the local pixel MSE, it is essential to ensure that the overall distribution of the neighborhood-averaged predicted retro-intensity values has a similar distribution to that of the raw data values. If the two data sets are from the same distribution at an alpha level of 0.1%, we consider the prediction and the raw data to be from the same distribution. To statistically evaluate the distribution differences between raw retro-intensity values and the corresponding predicted retro-intensity values, we use the Mann-Whitney U Test. This nonparametric test determines whether there is a significant difference between the distributions of two independent samples.
Results
The MSE analysis of the neighborhood averaging method reveals the following values at various percentiles: 0th percentile at 0.00077, 25th percentile at 0.01182, 50th percentile at 0.02233, 75th percentile at 0.04245, and 100th percentile at 0.31348. This distribution indicates that the majority of MSE values are relatively low, suggesting good agreement between the predicted retro-intensity and the raw data. However, there are a few instances with significantly higher errors.
From the Mann-Whitney U Test, in 2,952 samples, 1,718 samples of predicted retro-intensity using the neighborhood averaging method show no statistically significant difference at the 0.001 significance level, which suggests that 58.2% of the predicted retro-intensity values have the same distribution as the raw reflectivity data. Considering the sparsity of the raw reflectivity data points, these results indicate a high level of consistency between the predicted and raw data distributions.
Failure Cases and Analysis
While the proposed Double U-Net model demonstrates strong performance in predicting pixel-level retro-intensity, certain challenges remain. To provide a comprehensive evaluation, we present failure examples that illustrate the model’s limitations, including noisy inputs, occlusions, and sparse lidar data conditions. Figure 12 shows three cases: the first row depicts noisy input caused by vehicle turning during data collection, where lidar latency misaligned background points onto the traffic sign’s point cloud. The second row highlights occlusion issues. The third row illustrates sparse point cloud challenges, where the word “STOP” on the sign, exhibiting higher retroreflectivity (yellow in the figure), is accurately captured by lidar but exaggerated through interpolation, leading to discrepancies between predictions and raw data. These cases highlight areas for future improvement and offer insights into the model’s limitations.
Model performance illustrated with failure cases.
Conclusion
This study developed a two-stage Double U-Net network to predict retro-intensity for traffic infrastructure using only images. The data from lidar and camera sensors were fused through ROS, followed by YOLOv8 for object recognition and tracking, enabling the isolation of transportation infrastructure components and extraction of depth and retro-intensity information. The processed images, as well as class, interpolated depth, and interpolated retro-intensity information were then reconstructed to generate the training data set. The advanced segmentation model, U-Net, was modified and extended into a two-stage architecture to work with the training data, enabling it to predict retro-intensity accurately by simultaneously using loss from both depth and retro-intensity.
Three metrics, MSE, SSIM, and the Mann-Whitney U Test, were used to evaluate the accuracy of the proposed framework against the raw retro-intensity and the interpolated retro-intensity image within the area segmented using SAM, because of the sparsity of point cloud data from lidar. MSE analysis, with a median value of 0.0162, revealed that the majority of errors were relatively low, indicating good predictive accuracy. SSIM analysis showed that nearly half of the evaluated images exhibited high structural similarity. The Mann-Whitney U Test confirmed that 58.2% of the predicted retro-intensity values shared the same distribution as the raw retro-intensity data at a significance level of 0.001, making the results highly acceptable, particularly considering the sparsity of the raw data points.
The findings suggest that the Double U-Net model can effectively predict retro-intensity with a high level of accuracy, maintaining the essential visual and structural properties of the images. This study’s primary goal is to reduce costs by providing a model that accurately predicts traffic infrastructure retro-intensity without relying on lidar data. By offering a cost-effective solution for reflectivity prediction, this research presents significant value for transportation infrastructure monitoring and analysis. One of the model’s key advantages is its ability to identify local defects in transportation infrastructure based on the predicted retro-intensity results. Unlike previous research that relies on overall retro-intensity, which is able to ignore the minor defects, this model enables the detection of small, localized issues that might otherwise be missed.
Discussion, Limitations, and Future Work
The data collection process in this study was conducted dynamically by driving at the speed limit. It means the collected data could be influenced by various environmental factors, leading to different outcomes for the same transportation infrastructure depending on the image input. To ensure consistent retro-intensity measurements for each unique transportation infrastructure, YOLOv8’s tracking capability was essential. Averaging the prediction results across all frames for a given sign provides a more reliable and representative measure of its reflectivity.
This study targets a specific scope. We focus on cases where shared factors such as UV weathering, contamination, and mounting geometry lead to the co-degradation of color fading and loss of retroreflectivity. Situations driven primarily by a single factor are not addressed, for example shadows or glare that degrade daytime appearance while retroreflectivity remains acceptable, or microstructure damage that reduces retroreflectivity with little visible change. Consistent with this scope, the reported results demonstrate feasibility within this co-degradation setting rather than a general relationship across all conditions.
Furthermore, the model was trained using interpolated depth and retro-intensity as ground truth. Consequently, the model’s predictions are highly dependent on the quality of the raw point cloud data. This reliance amplifies the characteristics of the raw data, meaning that any strengths and weaknesses in the raw point cloud are also magnified in both the interpolated and predicted results. Therefore, the quality of the point cloud data is crucial, particularly in its density. To mitigate the impact of low-quality point cloud data, careful data selection based on criteria such as density, depth, and image area is essential.
Future research should focus on enhancing the density and accuracy of point cloud data to improve model precision and robustness. Also, future research directions should include establishing a standard aligned with the MUTCD for real-time monitoring and assessment of transportation infrastructure retro-intensity at minimal cost. The aim is to develop a comprehensive system that not only provides accurate predictions but also delivers real-time condition assessments, ensuring efficient and affordable monitoring of traffic infrastructure. Moreover, this study has demonstrated the capability of the model to visualize localized issues on traffic signs. Future research should focus on classifying different types of localized issues and developing condition assessment methods adapted to various sheeting types, colors, and specific localized issue categories. Additionally, for different sign categories, more detailed and precise threshold criteria should be established to facilitate accurate evaluations and targeted maintenance strategies.
Footnotes
Author Contributions
The authors confirm contribution to the paper as follows: study conception and design: Adu-Gyamfi, Zhang; data collection: Zhang, Yu; analysis and interpretation of results: Zhang, Adu-Gyamfi; draft manuscript preparation: Zhang, Arachchilage, Adu-Gyamfi. All authors reviewed the results and approved the final version of the manuscript.
Declaration of Conflicting Interests
The authors declared no potential conflicts of interest with respect to the research, authorship, and/or publication of this article.
Funding
The authors disclosed receipt of the following financial support for the research, authorship, and/or publication of this article: This research is based on work supported by the National Science Foundation under grant 2045786.