
Abstract
Two years ago, a new virus named Severe Acute Respiratory Syndrome CoronaVirus 2 (SARS-CoV-2) emerged. In the ensuing race to contain the virus, many non-pharmaceutical interventions (NPIs) have been introduced. Yet questions like “What is the risk of SARS-CoV-2 infection in a particular scenario?” and “Which NPIs limit virus transmission most effectively?” remain. Crowd and epidemiological simulation models can help formulate an answer to these questions. This paper studies virus spread and infection risk using a newly developed hybrid virus spread model PeDViS (Pedestrian Dynamics–Virus Spread model), which links an existing validated crowd movement dynamics model (NOMAD) with a new virus spread model (QVEmod). In particular, five common public transit scenarios are simulated: walking through a corridor, buying a ticket, moving through the ticket gates, waiting at a platform, and traveling by train. The relative impact of four variables (i.e., demand, waiting time, facial masks, and ventilation) was studied. This study illustrates that PeDViS can provide comprehensive insights into virus spread and the relative differences in infection risk. Furthermore, it corroborates the impacts featured in literature for all public transit scenarios. That is, ventilation and facial masks limit the probability of infecting other individuals. Moreover, waiting time and higher demand levels increase the probability of infecting other travelers. Second, especially large impacts of the NPIs facial masks and ventilation are found for the more “dangerous” scenarios; that is, long queues, delays, or waiting times coincide with high demands and crowd densities.
Keywords
Introduction
Two years ago, a new virus named Severe Acute Respiratory Syndrome CoronaVirus 2 (SARS-CoV-2) emerged in Asia. Since its introduction, it rapidly spread across the globe and has disrupted societies ever since. Given the impact of infections with the SARS-CoV-2 on individuals and the health care system, countries worldwide have been attempting to limit its spread using all means possible, often resorting to very vexatious measures such as countrywide lockdowns and physical distancing regulations.
Even though effective countermeasures, such as vaccines, are now available and can limit the clinical impact of a SARS-CoV-2 infection, these measures are not available to the same extent across the globe. Thus, we are looking ahead to an extensive time period during which this virus will keep roaming smaller or larger parts of the world. Consequently, next to pharmaceutical measures, effective non-pharmaceutical interventions (NPIs) are essential to allow the world to open up responsibly.
Over the last year, many NPIs have been implemented. These range from the physical distancing regulation, where people that do not belong to the same household are asked to keep at least 1.0–2.0 m apart (i.e., [ 1 – 3 ]) to the use of facial masks to limit virus spread and virus uptake by individuals. In addition, regulations aimed at the limitation of the number of different contacts during the day are proposed, such as the use of bubbles at schools and limiting the capacity of restaurants. All NPIs have ramifications for the well-being and financial position of individuals, companies, and countries alike.
Despite tremendous research efforts done, it remains challenging to disentangle some of the most vital questions, such as “What is the risk of virus spread in a specific scenario” and “Which NPIs are most effectively limiting virus transmission while causing the least negative impact for the individual and society as a whole?”. Also in the mobility sectors, questions on the effectiveness of NPIs and crowd management are being raised. The answer to this question is not trivial, because the effectiveness of NPIs is expected to vary between contexts as a result of varying operational crowd dynamics, layout, physiological conditions, and compliance. However, simulation models can provide preliminary insights into the do’s and don’ts of NPI application in mobility scenarios.
This paper aims to evaluate the impact of NPIs on virus spread and infection risk in public transit. To do so, we simulate virus spread in five scenarios that often occur in public transit, namely walking in a busy corridor, buying a ticket, walking through a set of ticket gates, waiting at a platform, and riding on a train. We use the new hybrid virus spread model PeDViS (Pedestrian Dynamics–Virus Spread model) that was recently developed by Delft University of Technology (Transport & Planning) and Wageningen University and Research (Veterinary Epidemiology). This model combines knowledge from different fields (crowd modeling and epidemiology) and links an existing validated crowd movement dynamics model (NOMAD) with a new specialist SARS-CoV-2 virus spread model (QVEmod).
This paper is structured as follows. First, a brief state-of-the-art on SARS-CoV-2 impact modeling is presented. Accordingly, the hybrid virus spread model PeDViS and its two main sub-models NOMAD and QVEmod are introduced. The paper continues with a brief description of the research methodology and an introduction to the five public transit scenarios. Subsequently, the results are presented and discussed. This paper finishes with a summary of the results and the implications of our simulation study results for the operation of public transit during a SARS-CoV-2 pandemic.
State-of-the-Art Virus Impact Modeling
The integration of mobility models and viral transmission models is not a new development. Yet, until recently, virus transmission was predominantly studied at the level of nations. Sallah et al. ( 4 ), for instance, combined a graphic-based mobility model and a Susceptible–Infected–Recovered (SIR) model to predict the spread of cholera in Haiti. Similarly, Cliff et al. ( 5 ) used an agent-based model that accounts for mobility patterns to model the spread of influenza across Australia. Also, Hackl and Dubernet ( 6 ) adopted a large-scale agent-based transport simulation to simulate the seasonal influenza outbreaks in a metropolitan area.
Recently, studies have increasingly focused on small-scale transmission of viruses, for instance in relatively small indoor spaces like restaurants. Here, two groups of studies can be distinguished. The first group combines a pedestrian simulation model with discrete threshold(s) that identify whether an individual will become infected. For instance, Romero et al. ( 7 ) use a simple mathematical model to determine indoor exposure levels in an academic building. Xiao et al. ( 8 ) use a social force model to study the impact of NPIs for indoor spaces on the number and duration of high-risk interactions. Similarly, Xu and Chraibi ( 9 ) model NPIs for supermarkets using a collision-free velocity model. The most sophisticated as regards pedestrian dynamics is the model by Ronchi and Lovreglio ( 10 ), which provides a generic deterministic virus transmission model to be used in combination with any pedestrian movement simulator.
Yet epidemiological research shows that virus transmission is a stochastic process ( 11 ). A second group of models explicitly incorporates this stochastic nature, either by defining a probability per risky contact or by assuming infection probabilities to be linearly related to the exposure time. Fang et al. ( 12 ) applied an infection probability curve that increases with the duration of the contact while assuming that people can get infected only when they have close contact with infectious individuals (less than 1 m). Bouchnita et al. ( 13 ) used a similar infection risk identification method, but assumed a cut-off distance of 2 m.
At the same time, virus spread is also known to be very context dependent. Airflow, layout, the materialization of the surfaces, the interaction between individuals and surfaces, and activity patterns of individuals matter (e.g. [ 14 – 16 ]). Yet most existing hybrid virus spreading models assume contact transmission and ignore indirect transmission routes. Consequently, assessing NPIs with the use of crowd models (with or without infection probability models) might result in an over- (i.e., outdoor scenarios with large airflows) or underestimation (i.e., indoor scenarios with limited ventilation or very high demands) of infection risks. The third strain of models integrates pedestrian simulation models with virus spread models to identify virus exposure. This third strain allows for spatial and temporal heterogeneity in both human behavior and viral spread, which allows researchers to better understand the impact of human behaviors on transmission risks. We will use one of these models, namely PeDViS to research the impact of NPIs in public transit scenarios.
A Hybrid Model for Virus Spread Modeling
This section introduces a new hybrid model to simulate virus spread and infection risks in crowding scenarios. First, the overall modeling philosophy is elaborated on. Accordingly, a brief introduction of NOMAD is provided, the pedestrian simulation model used to simulate crowd movement scenarios. The third section provides a condensed overview of the epidemiological model that simulates virus spread and identifies the exposure density of individual pedestrians. The last section details how exposure density is translated to the infection risks.
Overall Modeling Philosophy PeDViS
The background indicates that a combined pedestrian movement dynamics–epidemiological model is required to study the transmission of SARS-CoV-2. PeDViS is such a model, which combines an existing microscopic pedestrian simulation model (i.e., NOMAD) and an epidemiological model for Quantifying Viruses in Environments (i.e., QVEmod), see Figure 1.
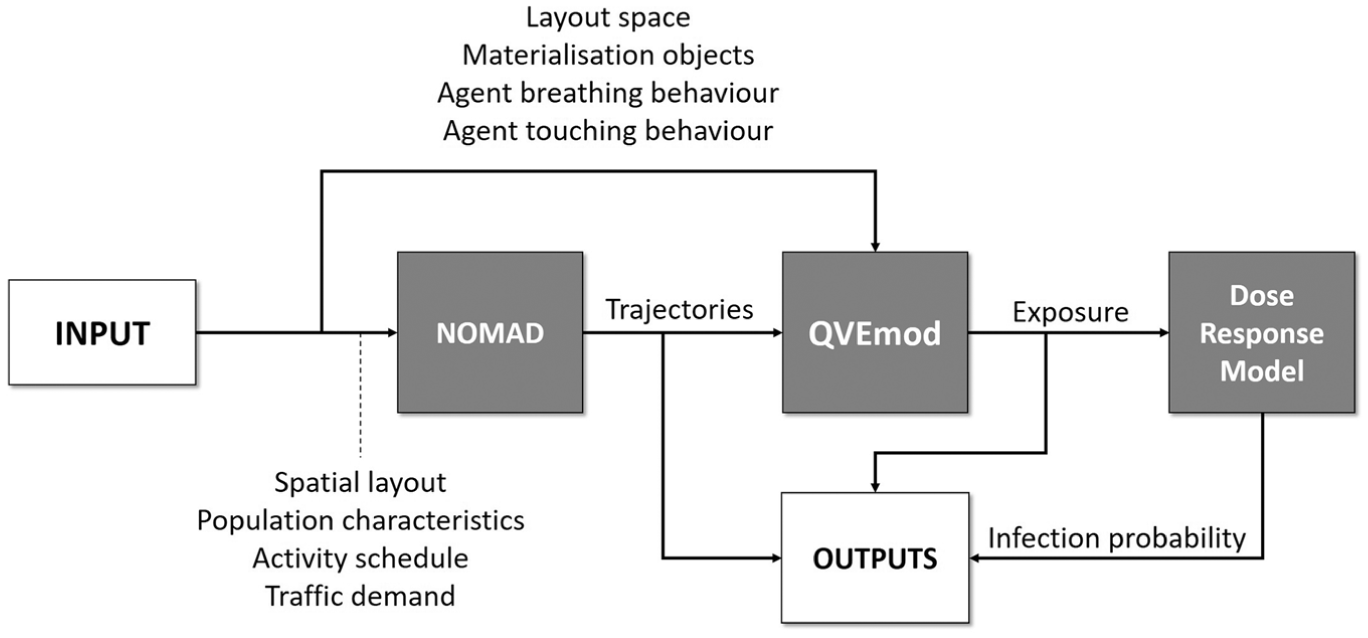
Model chain Pedestrian Dynamics–Virus Spread model (PeDViS).
Here, NOMAD uses the predefined set of activity schedules and the list of personalized characteristics for each group in the population to simulate the operational movement behavior of each individual. The operational movement behavior features two sub-models, which for each activity in a pedestrian’s activity schedule determine the (best) route toward each destination and accordingly determine their walking dynamics (i.e., walking velocity and acceleration) along that route. In particular, operational walking dynamics models can incorporate user-specified behavioral responses to limit SARS-CoV-2 transmission in their indoor spaces that might impact their operational walking dynamics, for example, more extensive avoidance behavior as a result of physical distancing. The result of NOMAD is a set of fully detailed trajectories for each individual within the space.
The second sub-model, QVEmod, uses these trajectories, combined with epidemiological attributes of the individuals (most notably the infectious status of individuals and their respiratory activities (e.g. breathing, talking), to simulate the spread of the virus in the environment. Accordingly, the model determines the extent to which other individuals in the same space are exposed to the virus. How SARS-CoV-2 particles are distributed over time and in space is modeled as the accumulation of the virus in the environment, both in the air and on surfaces.
The total virus exposure of all individuals via all three infection routes is accordingly the input of the third sub-model, namely the dose–response model. This model estimates the risk of becoming infected with SARS-CoV-2 for each individual based on the total amount of SARS-CoV-2 they came into contact with during their stay in the space.
More details on all three models are provided below. A thorough explanation and justification of all sub-models can be found in Duives et al. ( 17 ).
NOMAD: A Routing and Movement Dynamics Model
NOMAD is a microscopic pedestrian simulation model that simulates the operational movement dynamics of individuals. In particular, the walker model of NOMAD is implemented in PeDViS. This model is briefly introduced below. For an in-depth discussion of the walker model and its calibration, the reader is referred to Campanella ( 18 ). The result of NOMAD is a set of trajectories pertaining to the coordinates and velocity of each individual in the simulation at each timestep of the simulation. Generally, a timestep of 0.1 s is adopted.
The routing model of NOMAD is utility-based and developed by Hoogendoorn and Bovy ( 19 ). It makes use of the minimum walking cost principle. In essence, individuals balance their desire to move toward their destination with other needs, for instance, travel time, physical effort, and distance to attractive sights. The desired direction of an individual is determined using the steepest descent method, where individuals move orthogonally to the equi-cost lines.
At an operational level, the movement of pedestrians is assumed to be the result of accelerations that are caused by signals and forces that pedestrians are subjected to while walking. These forces are accounting for three types of behavior, namely path straying (i.e., desire to obtain and keep a certain speed and direction), agent–agent collision avoidance (i.e., desire not to collide with other individuals), and obstacle avoidance (i.e., desire to keep distance between you and all other obstacles in a space). The balance between these three forces is determined by a set of user-specified parameters that are agent specific. A noise term is included to incorporate the natural fluctuations of pedestrian movements. Together these three forces shape the acceleration of an individual.
QVEmod: A SARS-CoV-2 Spread Model
QVEmod is a spatially explicit agent-based model that simulates the emission of viruses by infectious individuals, how these virus particles subsequently spread in space and time through the environment and eventually may get taken up by individuals. A full elaboration on this model can be found in Duives et al. ( 17 ). A brief introduction is provided below.
QVEmod tracks virus spread for two classes, namely pedestrians and the environment. Both model classes acquire virus particles throughout a simulation. Here, the environment is composed of two air layers (i.e., aerosols and droplets) and one surface layer, all of which are two-dimensional grids. The model simulates virus spread and exposure in seven steps (see Figure 2):
Virus emission by the infectious pedestrian
Droplet deposit onto surfaces
Droplet and aerosol decay over time
Droplet and aerosol diffusion
Exposure of pedestrians via inhalation
Contamination of surfaces by the infected individuals
Exposure of pedestrians via surfaces
The seven model steps are evaluated at each time step, which is set at 1 s in this research. The environment is divided into equally sized grid cells with a size of 0.5 m2 (i.e., default value of QVEmod).
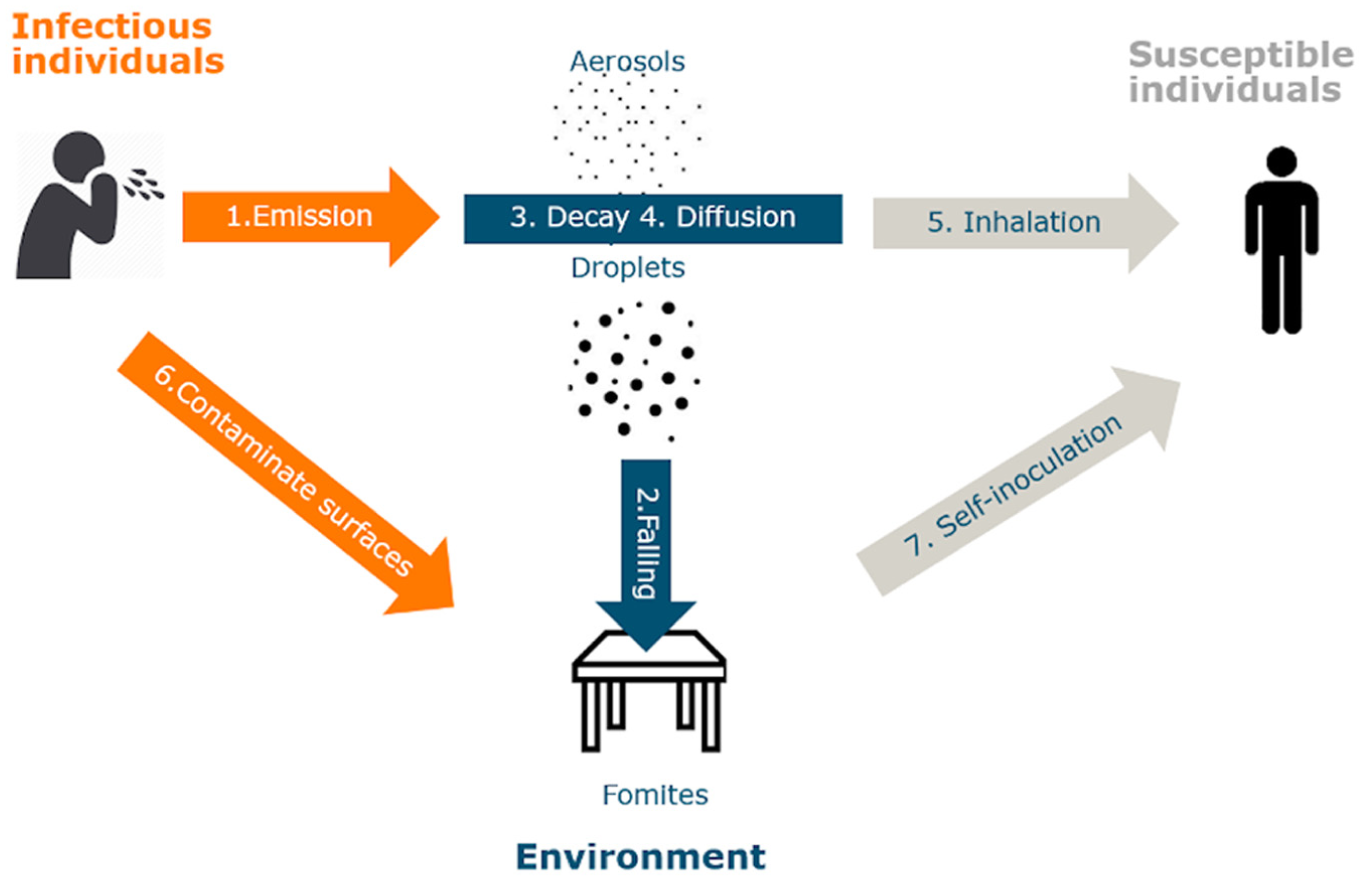
Schematic of the sub-models of an epidemiological model.
The PeDViS model is under rapid development to track the state-of-the-art on SARS-CoV-2. This particular study uses the implementation of the PeDViS model of April 2021. Under the default setting, only one infectious pedestrian enters a simulation with an infectiousness scaler set to unity. The virus emission of this infectious pedestrian is dependent on breathing-induced emission rates. In the default, which is adopted in this study, an individual’s emission rate is based on breathing-induced emission rates. Other respiratory activities can be incorporated through the activity infectiousness scaler.
The user-specified input concerning the environment (i.e., width, length, materialization, touch frequency of objects and obstacles) is used to determine the contamination of surfaces and self-inoculation (i.e., transmission of virus particles by individuals who touch surfaces and consecutively their mouth, eyes, or both). Besides that, NPIs, such as wearing masks and cleaning surfaces, can be taken into account by the model.
Dose–Response Model
QVEmod simulates individuals’ exposure via three routes. The relationship between the number of viral particles someone is exposed to, and the risk of acquiring an infection is likely to differ between transmission routes (i.e., [ 20 ]). The relationship between exposure and infection risk is modeled using an exponential dose–response relationship ( 21 ).
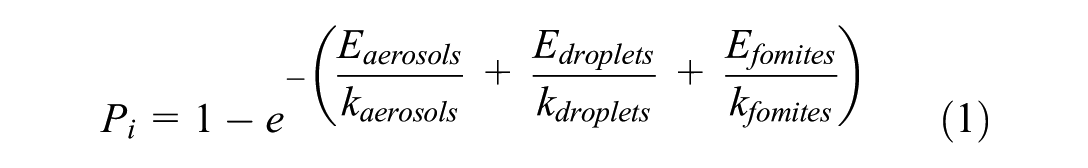
where
The estimates for individual exposures are used to estimate the number of infections that occurred during a specific event. Using the cumulative exposure of all individuals, the dose–response model provides an estimate of the probability that that individual acquired an infection during their stay in the indoor space. The total number of new infections that occurred during a specific scenario was estimated by drawing, for each individual in the simulation, a random number from a uniform distribution [0,1]. This process was repeated 100 times to estimate a reasonable representation of the infection probability for each scenario.
Research Methodology
This study aims to identify the relative impact of context variables and NPIs on virus spread and virus transmission in public transit scenarios. To do so, we simulate the five most common parts of any public transit trip, namely buying a ticket, scanning a ticket at a set of ticket gates, walking to a platform, waiting at a platform, and traveling by train. The exact setup of the scenarios is presented in the next section.
For each scenario, one pedestrian simulation is run. Even though NOMAD is a stochastic model, we expect little impact of NOMAD’s stochastic nature on the results of these simplistic stable scenarios. Accordingly, QVEmod is run 15 times, where each time another agent that enters in the first 2 min of the simulation is infected. This ensures that the full impact of the presence of the infectious individual is captured in the 15-min-interval that most scenarios last. For each run, the dose–response model is run 100 times to identify the expected number of potential infections that results from the scenario.
Please note, the resulting number of infections for one infected individual in one scenario is especially aimed at showing the impact of one infectious individual in this type of indoor space. To understand the total infection risk for a given transit scenario for a given moment during the pandemic, one should still translate our results (i.e., infections per one infected individual) into the total number of infections for a given virus prevalence (i.e., average number of infectious individuals per 10,000 individuals of the total population that are infectious) in society.
For each of these scenarios, we accordingly determined the distribution of interaction distances, the distribution of contact durations for all interactions within 1.5 m, the virus exposure distribution, and the expected number of infections per run of each scenario. These three distributions are used to identify the relative infection risk that each scenario induces.
Public Transit Case Studies Introduction
This research studies the impact of an infectious individual in a public transit system under varying conditions and the adoption of various NPIs. This section presents the case study design. First, the population is described. Afterward, the five case studies are introduced one by one, in the order in which pedestrians will encounter them along their public transport trip. First, they buy a Ticket and Check-in. Accordingly, they walk through a Corridor. They wait at the Platform before boarding a train, metro, tram, or bus. After which, they ride in the vehicle (Train) for an extensive amount of time.
Population Characteristics
During peak hour in the morning, often the population is comprised of predominantly single individuals on their way to work. Consequently, this case study does not incorporate grouping behavior. Moreover, to slightly simplify the simulation analyses, we adopt a homogeneous population with a mean desired walking speed of 1.0 m/s and a standard deviation of 0.1 m/s. All of the simulated pedestrians have no walking impairments. Moreover, pedestrians are assumed to carry no large bags or suitcases. These simplifications are expected to slightly optimize pedestrian movement behavior (i.e., more fluid movements, larger acceleration, more homogeneous crowd flow). Yet we expect that these choices will not affect the results in any significant manner as the infection rate amongst group members are high under all conditions and short-term interactions as a result of heterogeneous speeds account for little to the cumulative virus exposure of an individual.
Buying a Ticket
The first scenario features a rectangular station hall in which pedestrians can buy a ticket (see Figure 3a). Pedestrians enter the hall at the top left and exit at the top right. Five ticket machines are located on the right-hand wall, approximately 60 cm apart. The queue in front of the ticket machine is orthogonal to the general walking direction in the station. All pedestrians in the scenario need to buy a ticket, which ensures that we can explicitly simulate the exposure risk of buying a ticket. The pedestrians are automatically and equally distributed over the queues. The queues fill in the first 2 min of the simulation, after which the queues are steadily maintained during the remaining 13 min that this scenario lasts. In this scenario, we will consider four types of influences on virus spread:
Demand levels—inflow rate of the first 2 min ranges from 0.05, 0.2, or 0.4 P/s
Ventilation—air exchange rate (ACH) is set to 3 (bad ventilation), 6 (good ventilation), or 920 (outdoor)
Masks—pedestrians either wear facial masks or not
Number of ticket machines—either five, or just three ticket machines are active.
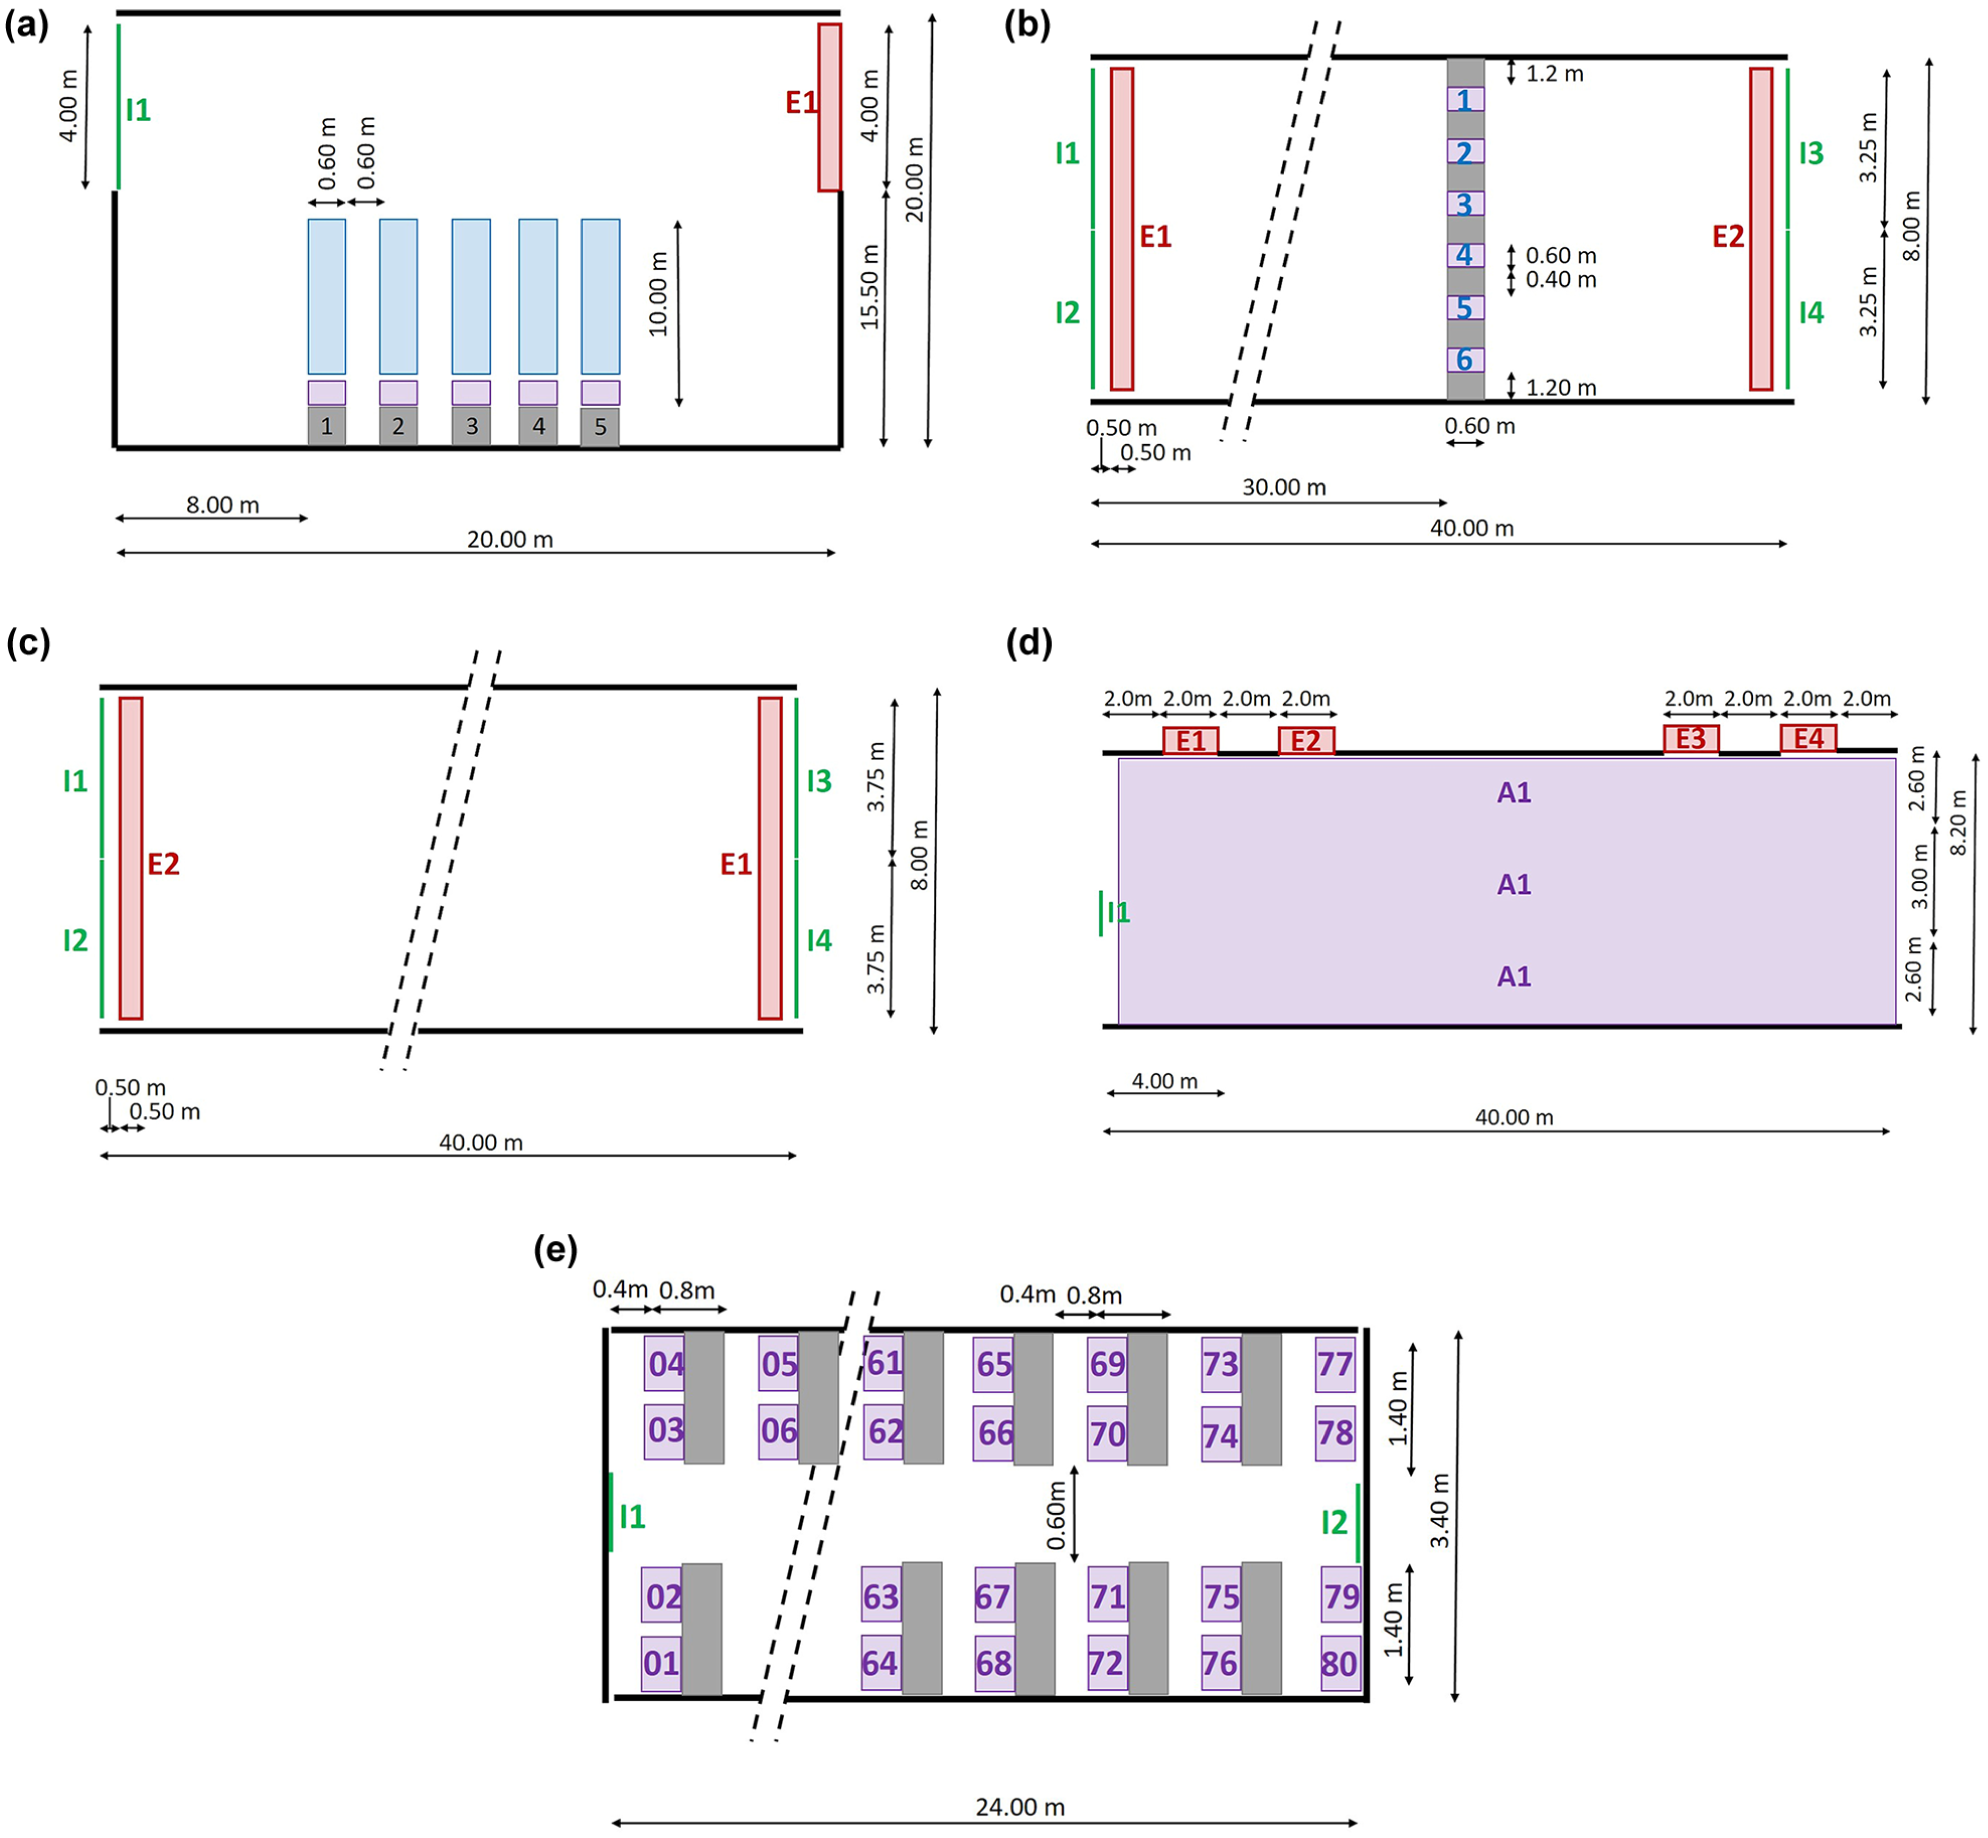
Spatial layout of the five public transit scenarios, namely (a) ticketing, (b) check-in, (c) corridor, (d) platform, and (e) train.
Walking Through the Ticket Gate
Afterward, pedestrians continue their way and scan their tickets at the gate (see Figure 3b). This second scenario simulates a straight one-directional corridor, in which pedestrians enter at the left (I1 and I2) and exit on the right (E2). Between entering and exiting, they scan their ticket and step through the gate, a process that slightly delays them as they need to slow down to scan the ticket. Here, we assume that all pedestrians will touch the surfaces of the ticket gates. Each run of this scenario features a steady inflow of pedestrians throughout the runtime of 15 min. In this scenario, we will consider four types of influences on virus spread:
Demand levels—inflow rates of the 15 min range from 0.2 (low), 0.3 (capacity), and 0.4 (more than capacity) P/s.
Ticket scanning time—delay as a result of scanning one’s ticket is 2, 4, or 6 s.
Ventilation—ACH is set to 3 (bad ventilation), 6 (good ventilation), or 920 (outdoor).
Masks—pedestrians either wear facial masks or not.
Walking in Corridors
After scanning, the pedestrians move through the platform through a narrow corridor of 8 m wide (see Figure 3c). Here, both uni- and bidirectional traffic scenarios can be expected. Thus, depending on the scenario, pedestrians only walk from left (I1 and I2) to right (E1) or also from right (I3 and I4) to left (E2). In all cases, we expect the crowd to split into two lanes, as is often occurring in bi-directional crowds. Given the size of the corridor, we do expect that pedestrians are not able to always keep their distance. In addition, this scenario features 15 min of runtime. This scenario features four types of influences on virus spread:
Demand levels—total inflow rates of the 15 min range from 0.6 (low), 0.9 (capacity), and 1.2 (more than capacity) P/s.
Flow ratio—the percentage of pedestrians that walks from left to right and vice versa, which is set to 100/0, 75/25, and 50/50.
Ventilation—the ACH is set to 3 (bad ventilation), 6 (good ventilation), or 920 (outdoor).
Masks—pedestrians either wear facial masks or not.
Waiting at a Platform
When the pedestrians reach the platform via entrance I1, they have to wait for their train (see Figure 3d). They will walk onto the platform during the inflow period of 3 min, after which they all wait until the train arrives. They will attempt to use the entire width of the platform to wait for the train. When the train arrives, they all exit via exits E1–E4. The pedestrians are either randomly distributed across space (50%) or move toward the nearest free spot near coordinate x = 36, y = 6. This way, the platform fills up from back to front and from the side at which the train will arrive toward the back. This scenario features four types of influences on virus spread:
Density levels—density after the inflow period is 0.2 (low demand), 0.4 (optimal physical distancing), or 0.8 (more than capacity) P/m2.
Waiting time—the time that pedestrians spend waiting for the train after the inflow period is finished, which is set to 5, 10, or 15 min.
Ventilation—the ACH is set to 3 (bad ventilation), 6 (good ventilation), or 920 (outdoor).
Masks—pedestrians either wear facial masks or not.
Riding on a Train
After entering the train, they take several minutes to reach their destination (see Figure 3e). Pedestrians enter via entrances I1 and I2 and directly move to their seats. When they are at their seats, they can take off their facial masks. The seats on the top are facing to the right while the seats on the bottom are facing to the left. The train only features benches that can host two pedestrians. The scenario will only feature the inflow, as the contacts during the entrance and exit period are limited in time. We expect that most infectious contacts will occur while the train is moving.
The authors have explicitly chosen to model only one type of transit vehicle with a simple entrance/egress scenario because little epidemiological differences are expected as a result of the size of the vehicle, the precise pedestrian dynamics inside the vehicle, the seating layout and the differences in ventilation dynamics in various transit vehicles. The main driver of infection risk in this scenario is the time individuals spend in the transit vehicle in the vicinity of a contagious individual. More research is required to determine whether this hypothesis is correct, or whether these other factors should also be explicitly considered.
This scenario features four types of influences on virus spread:
Density levels—density after the inflow period is 1 in 4 seats filled (low demand), 2 in 4 seats filled or all seats filled.
Travel time—the time that pedestrians spend in the train after the inflow period is finished is set to 10, 20, and 30 min.
Ventilation—the ACH is set to 3 (bad ventilation), 6 (good ventilation), or 920 (outdoor).
Masks—pedestrians either wear facial masks or not.
Results Per Scenario
The five scenarios have been translated into a very comprehensive set of analyses. Below we will present a summary of these results pertaining to the impact of the four main variables on pedestrian behavior and virus spread. The following section will first discuss the impact of crowding. Subsequently, the impact of waiting time is studied. Lastly, the impact of facial masks and ventilation is briefly touched on. Before going into the results, we will present some insights into the virus spread in all five scenarios.
Virus Spread in Public Transit Scenarios
Figure 4 displays a snapshot of a timestep of the ‘average’ scenario for all five scenarios. These visualizations present the infectious agent in red. The virus spread (aerosols) is identified in shades of red (low virus load) and yellow (high virus load). (Color online only.) As expected, virus particles are not only located near to the infectious individual but also diffuse through the air and lingers at locations that the infectious individual has visited before. This illustrates that individuals run the highest risks of being infected when they either spend a long time near the infectious individual or reside for a long time at a location that was previously visited by an infectious individual. The longer individuals spend in the middle of the virus cloud, the larger the virus dose they take up and the higher the probability that they become infected.
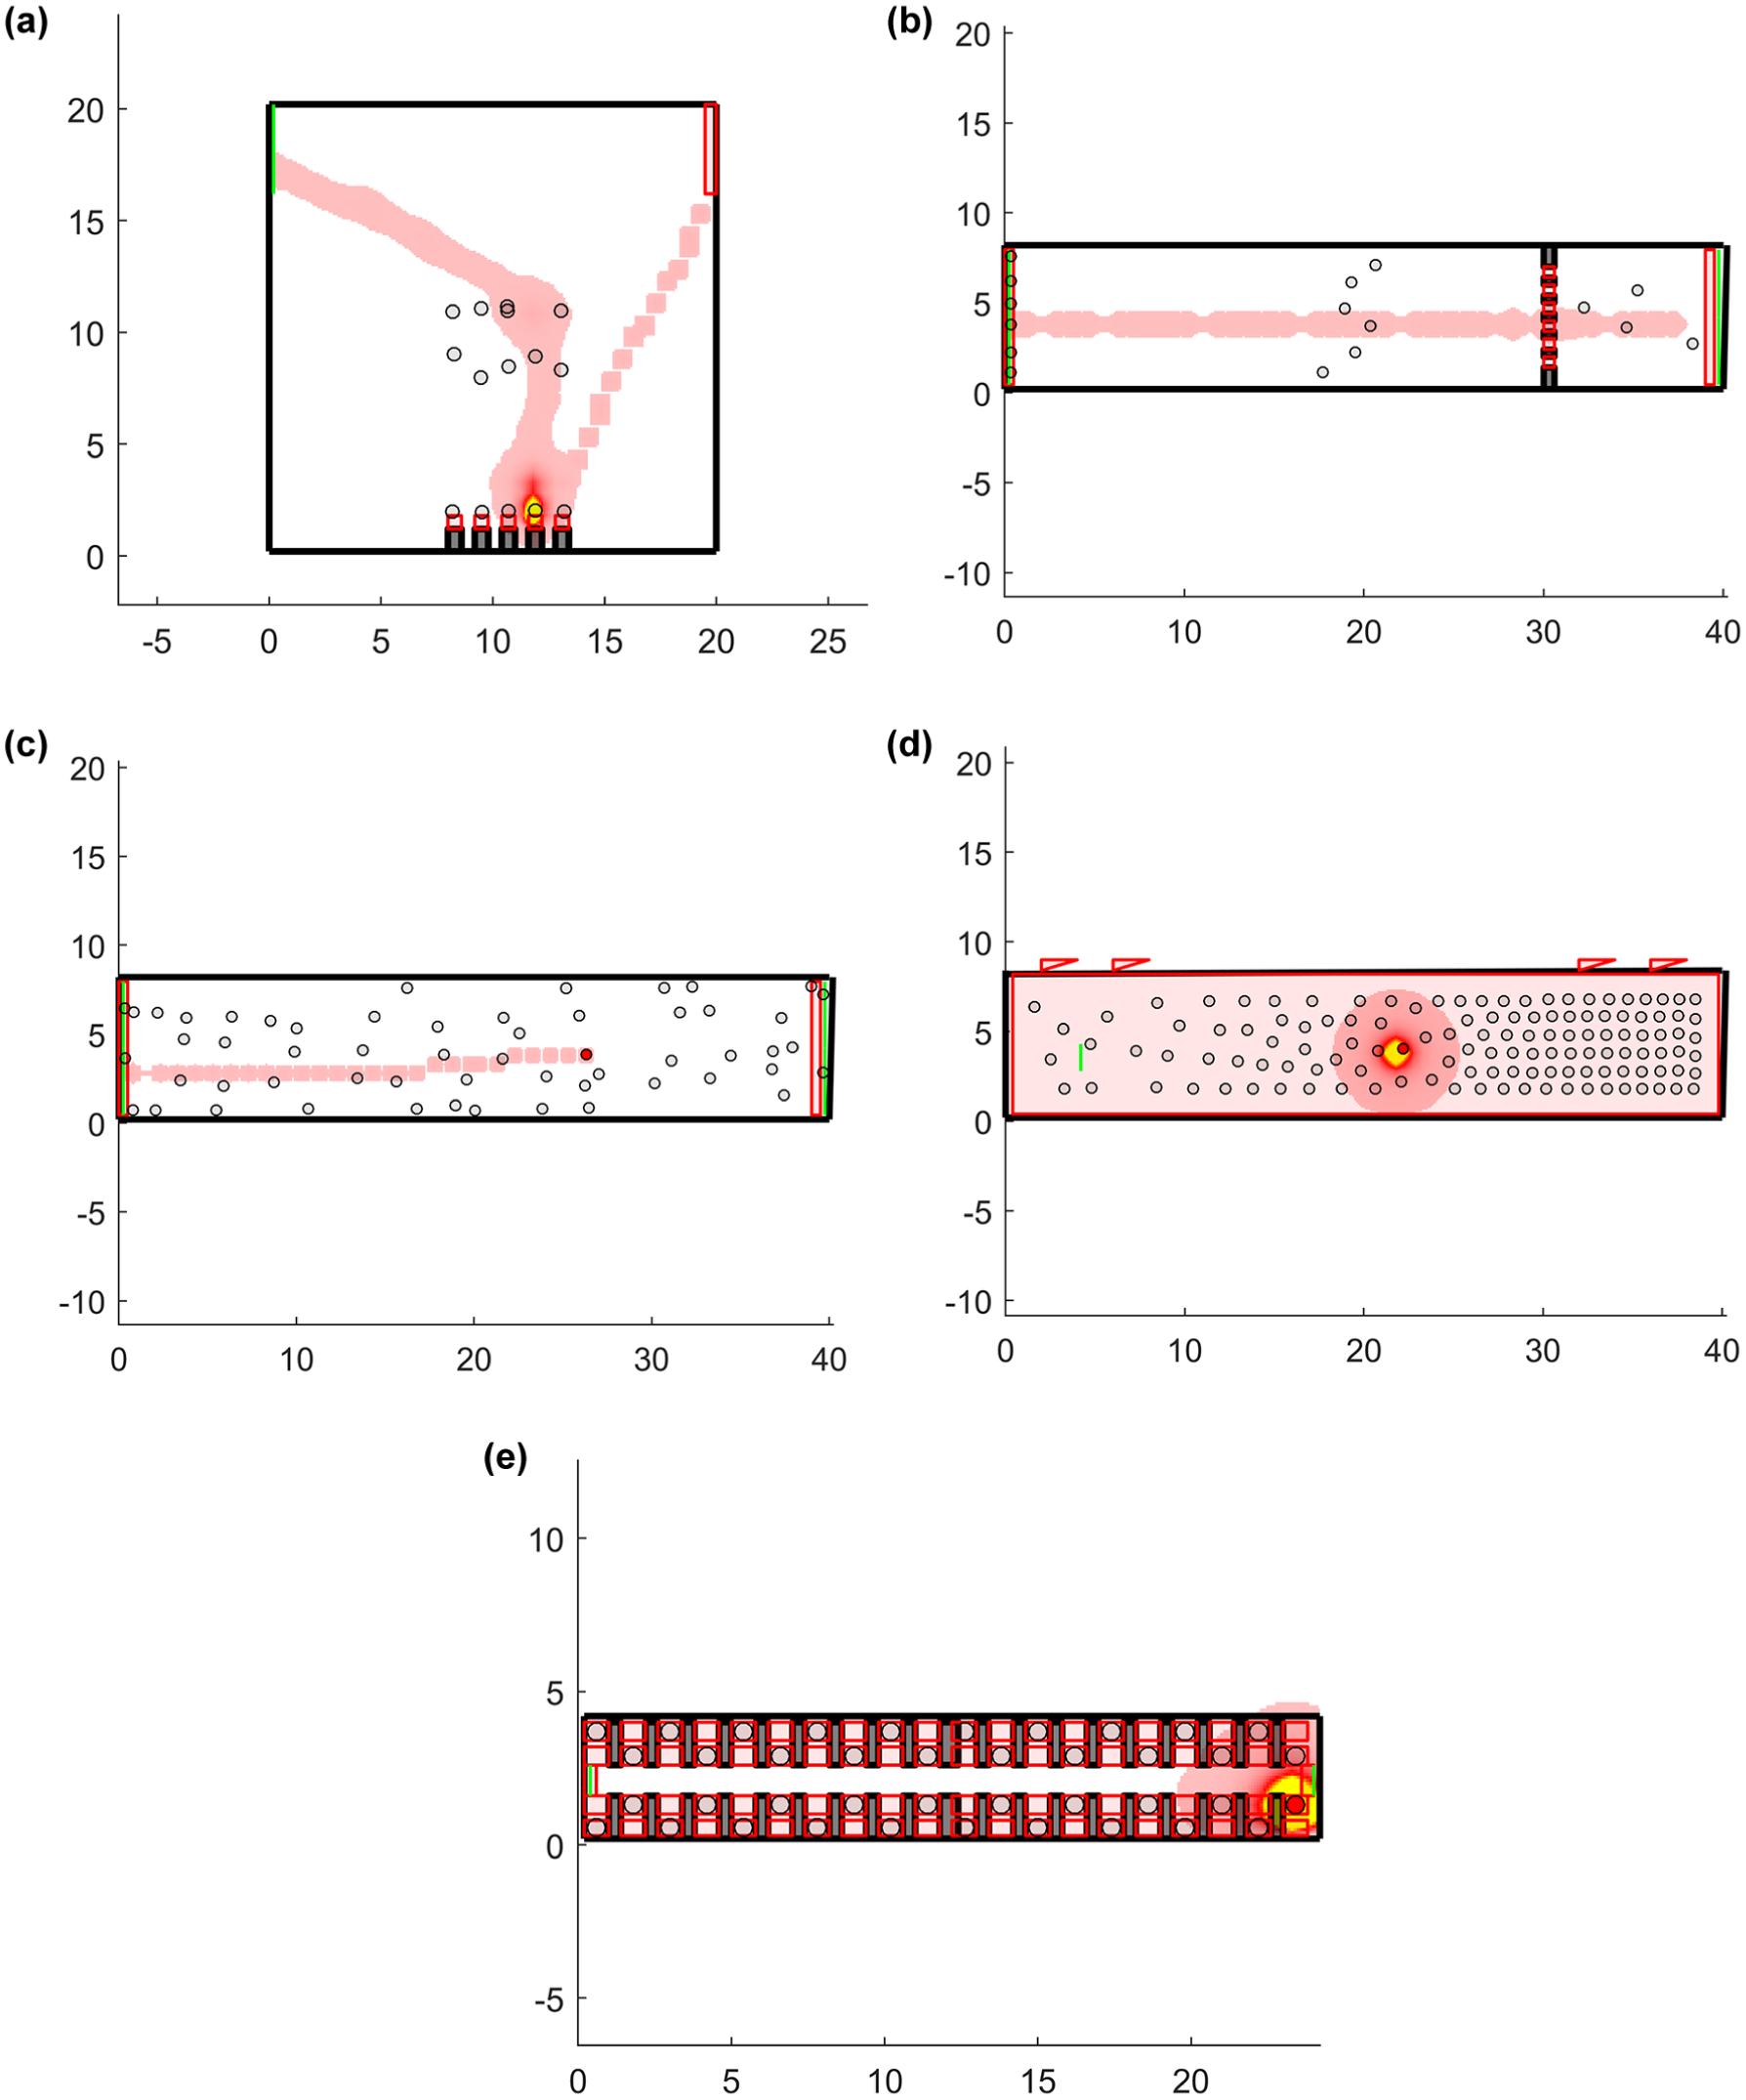
Virus spread in the five scenarios (i.e., [a] ticketing, [b] check-in, [c] corridor, [d] platform, and [e] train) where one infectious agent is present in a transit space. Color online only.
The scenarios show that the brightness of the cloud increases when the infectious individual stands still for a long time at one location (e.g. Figure 4d). That is, other individuals that accordingly stand at the same location also take up more virus particles, than individuals that are moving into a virus cloud created by a moving infectious individual. Consequently, under similar demand, locations where individuals wait or are delayed present higher infection risks than locations where individuals are continuously on the move. Please note, that the total infection risk can still be higher in fast-paced movement scenarios, owing to the higher probability of infectious pedestrians being present on the scene.
Impact of Crowding
In four out of five scenarios, crowding can have an impact on the infection risk. These scenarios were set in a way to resemble low, just under capacity, and just over capacity demand. Figure 5 shows that the risk of infection increases in all medium and high-demand scenarios. Here, higher demands often coincide with higher density levels and lower interpersonal distances. Please note, the infection risks can only be compared between similar scenarios, because demand levels can vary between scenarios.
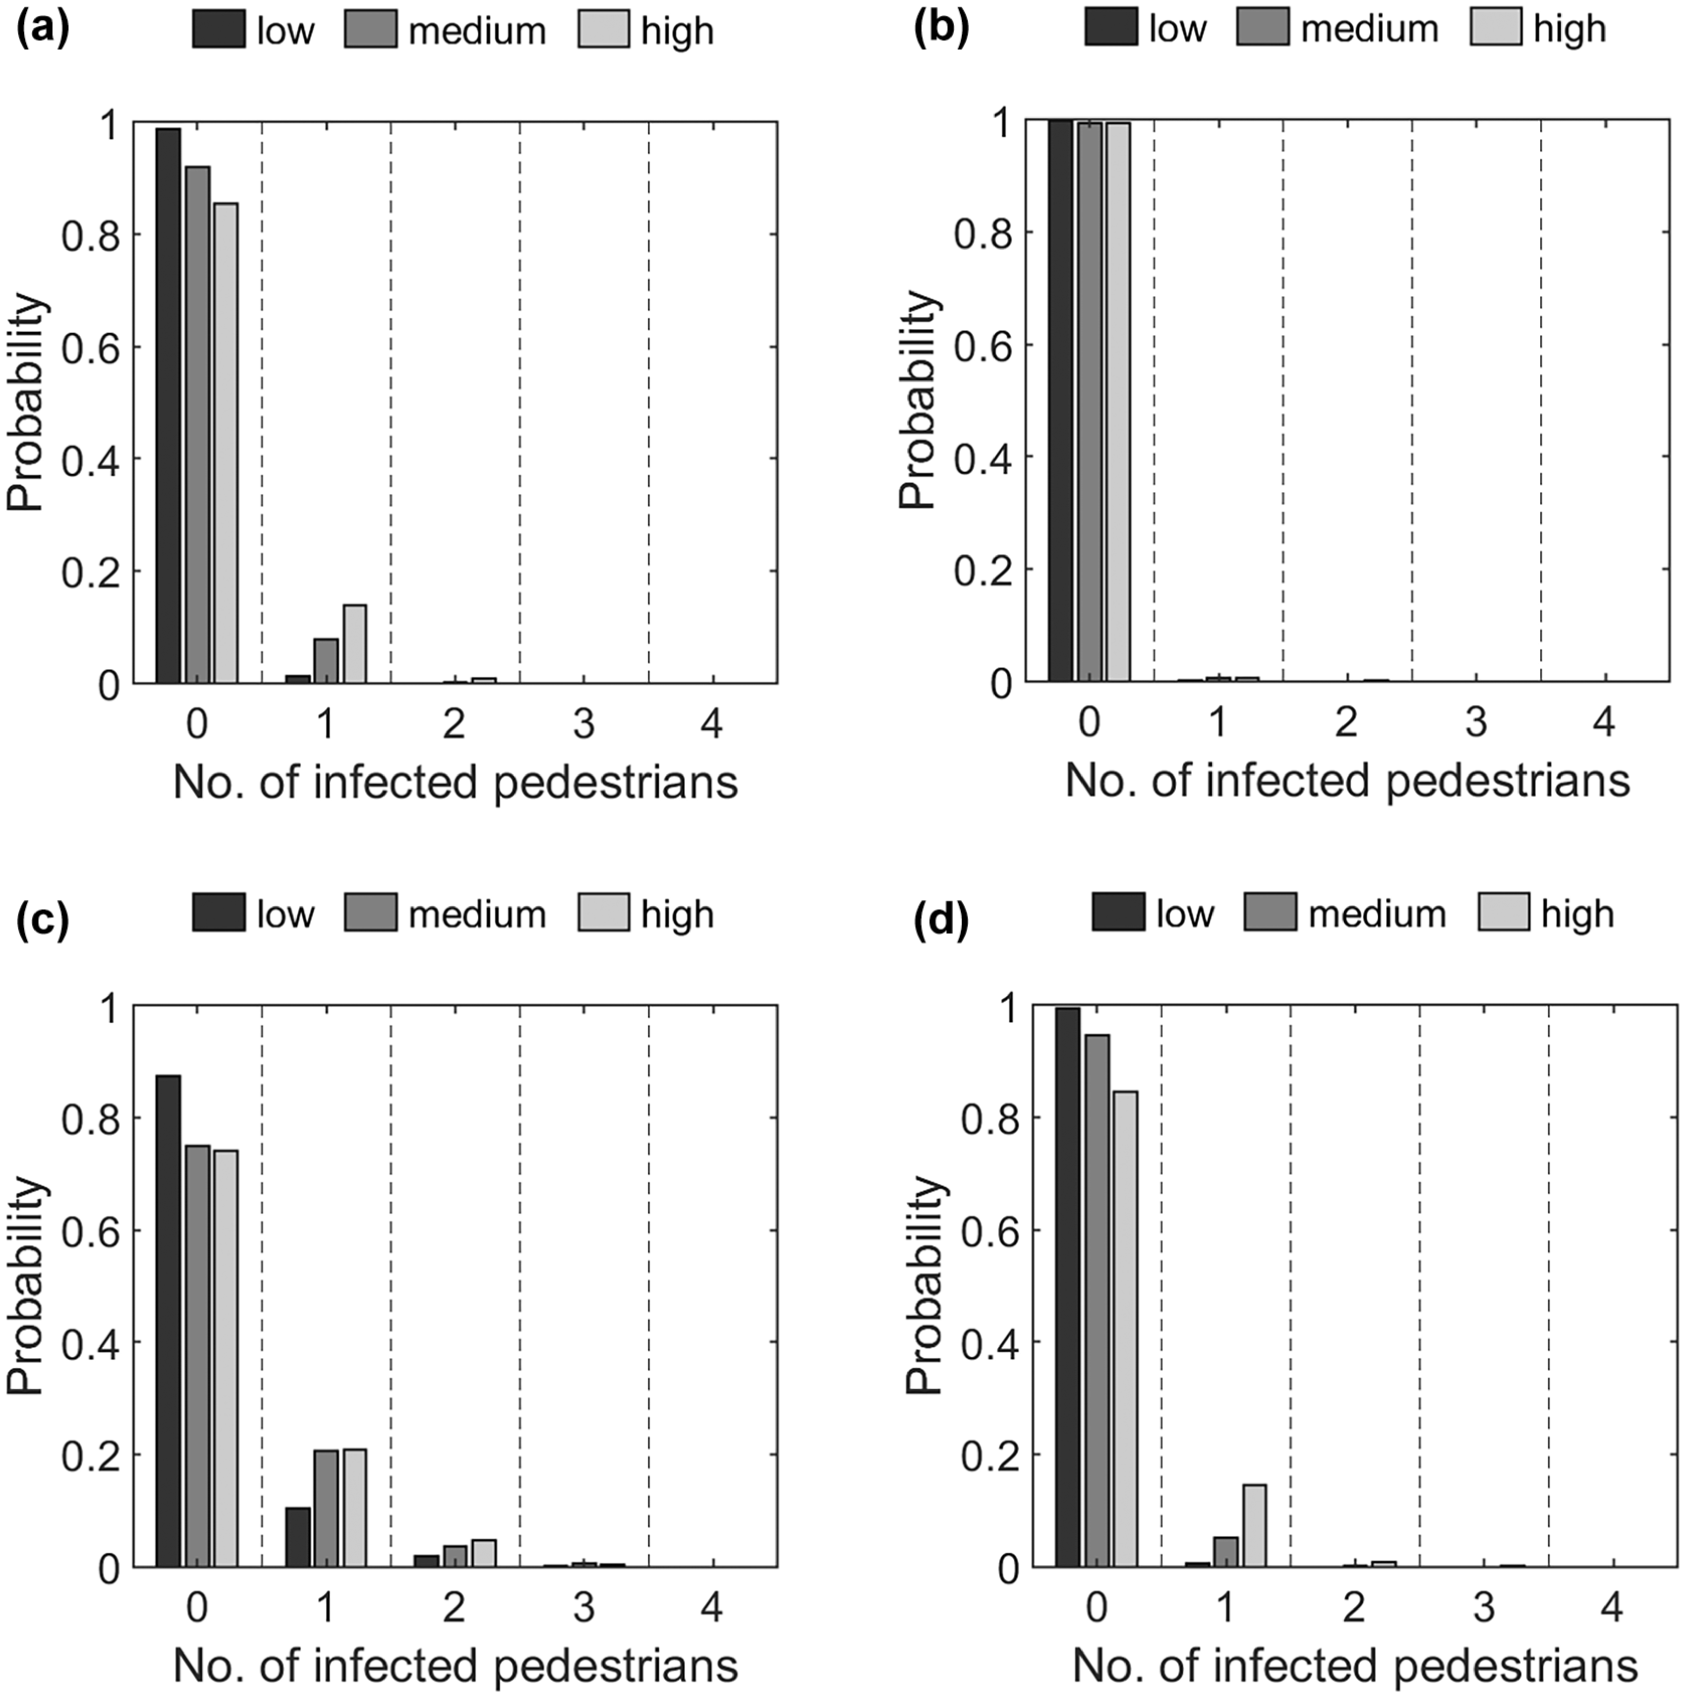
Probability density function for four scenarios (i.e., [a] ticketing, [b] corridor, [c] platform, and [d] train) and varying demand levels.
Moreover, the figure also shows that there is a probability that 1, 2, or 3 individuals get infected in three out of these four scenarios. Specifically, the ticketing, platform, and train scenario, are all scenarios in which pedestrians are forced to wait for extensive amounts of time. Thus, we can conclude that crowding in locations where people are forced to stand still or wait increases the risk of infection with SARS-CoV-2 in a public transit system.
Impact of Waiting Time
In two scenarios, namely waiting at the platform and riding on the train, pedestrians are forced to wait in a confined space. Figure 6 displays the probability density function of the risk of an infectious individual infecting one or more other individuals for these two scenarios, where the only difference between the runs of the same scenario is the average waiting/travel time of the individuals. In general, in most runs, no new infections arise because of waiting or traveling. Yet, in both scenarios, the probability of at least one infection increases sharply with the duration of the waiting time (13%) in the case of the train scenario. In the platform scenario, especially the number of infections increases with the long waiting scenarios. Moreover, in the case where individuals travel by train for more than 30 min in the same compartment as an infectious individual (without a facial mask, 50% of seats filled), also the probability of infecting more than 1 individual becomes larger than 0. Please note that a difference in the infection risk is found between the platform and the riding on the train scenario. This only occurs as a result of our use of similar ventilation conditions (ACH) in both scenarios. However, in real life, often a higher air exchange rate is found at the platforms owing to the influx of air via the train/metro tunnels or because the platforms are situated outside.
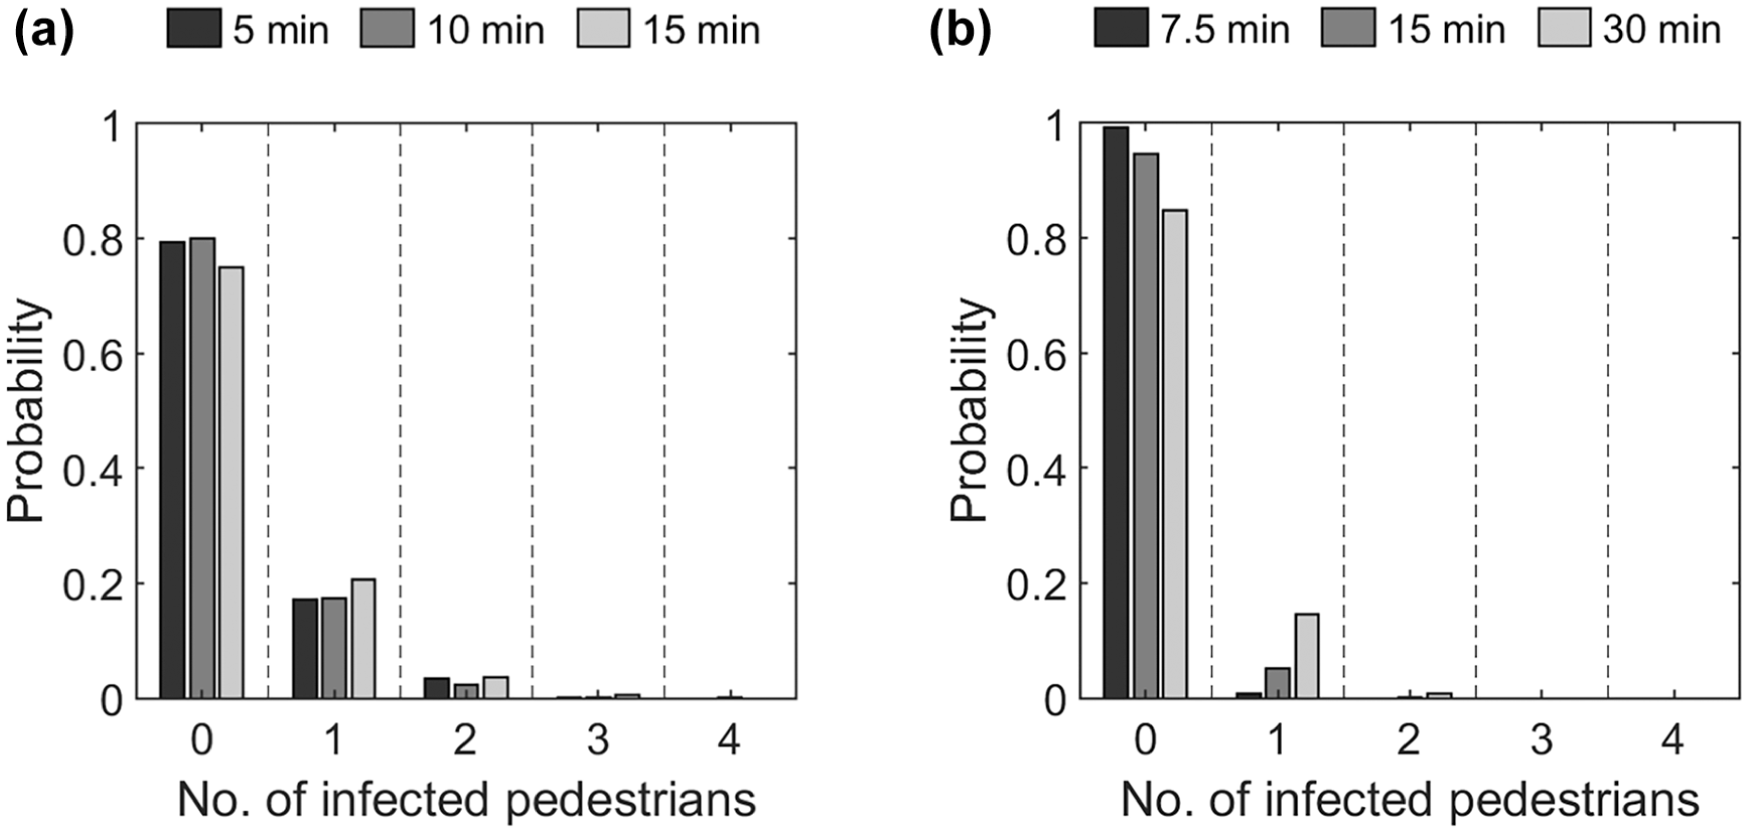
Probability density function of the number of infected pedestrians per run for two scenarios (i.e., [a] platform and [b] train) and varying waiting times.
Impact of Facial Masks
In the Netherlands, the use of facial masks is often adopted as an NPI to limit SARS-CoV-2 transmission in crowded spaces. For instance, the use of facial masks was mandatory in public transit in The Netherlands (August 2021). Figure 7 illustrates the impact of wearing facial masks when walking. Please note that facial masks are also incorporated in these simulations when sitting or waiting. Besides that, also in these analyses, only the results pertaining to the same scenario can be compared directly, as demand and, as such, the total infection risk can differ greatly between scenarios.
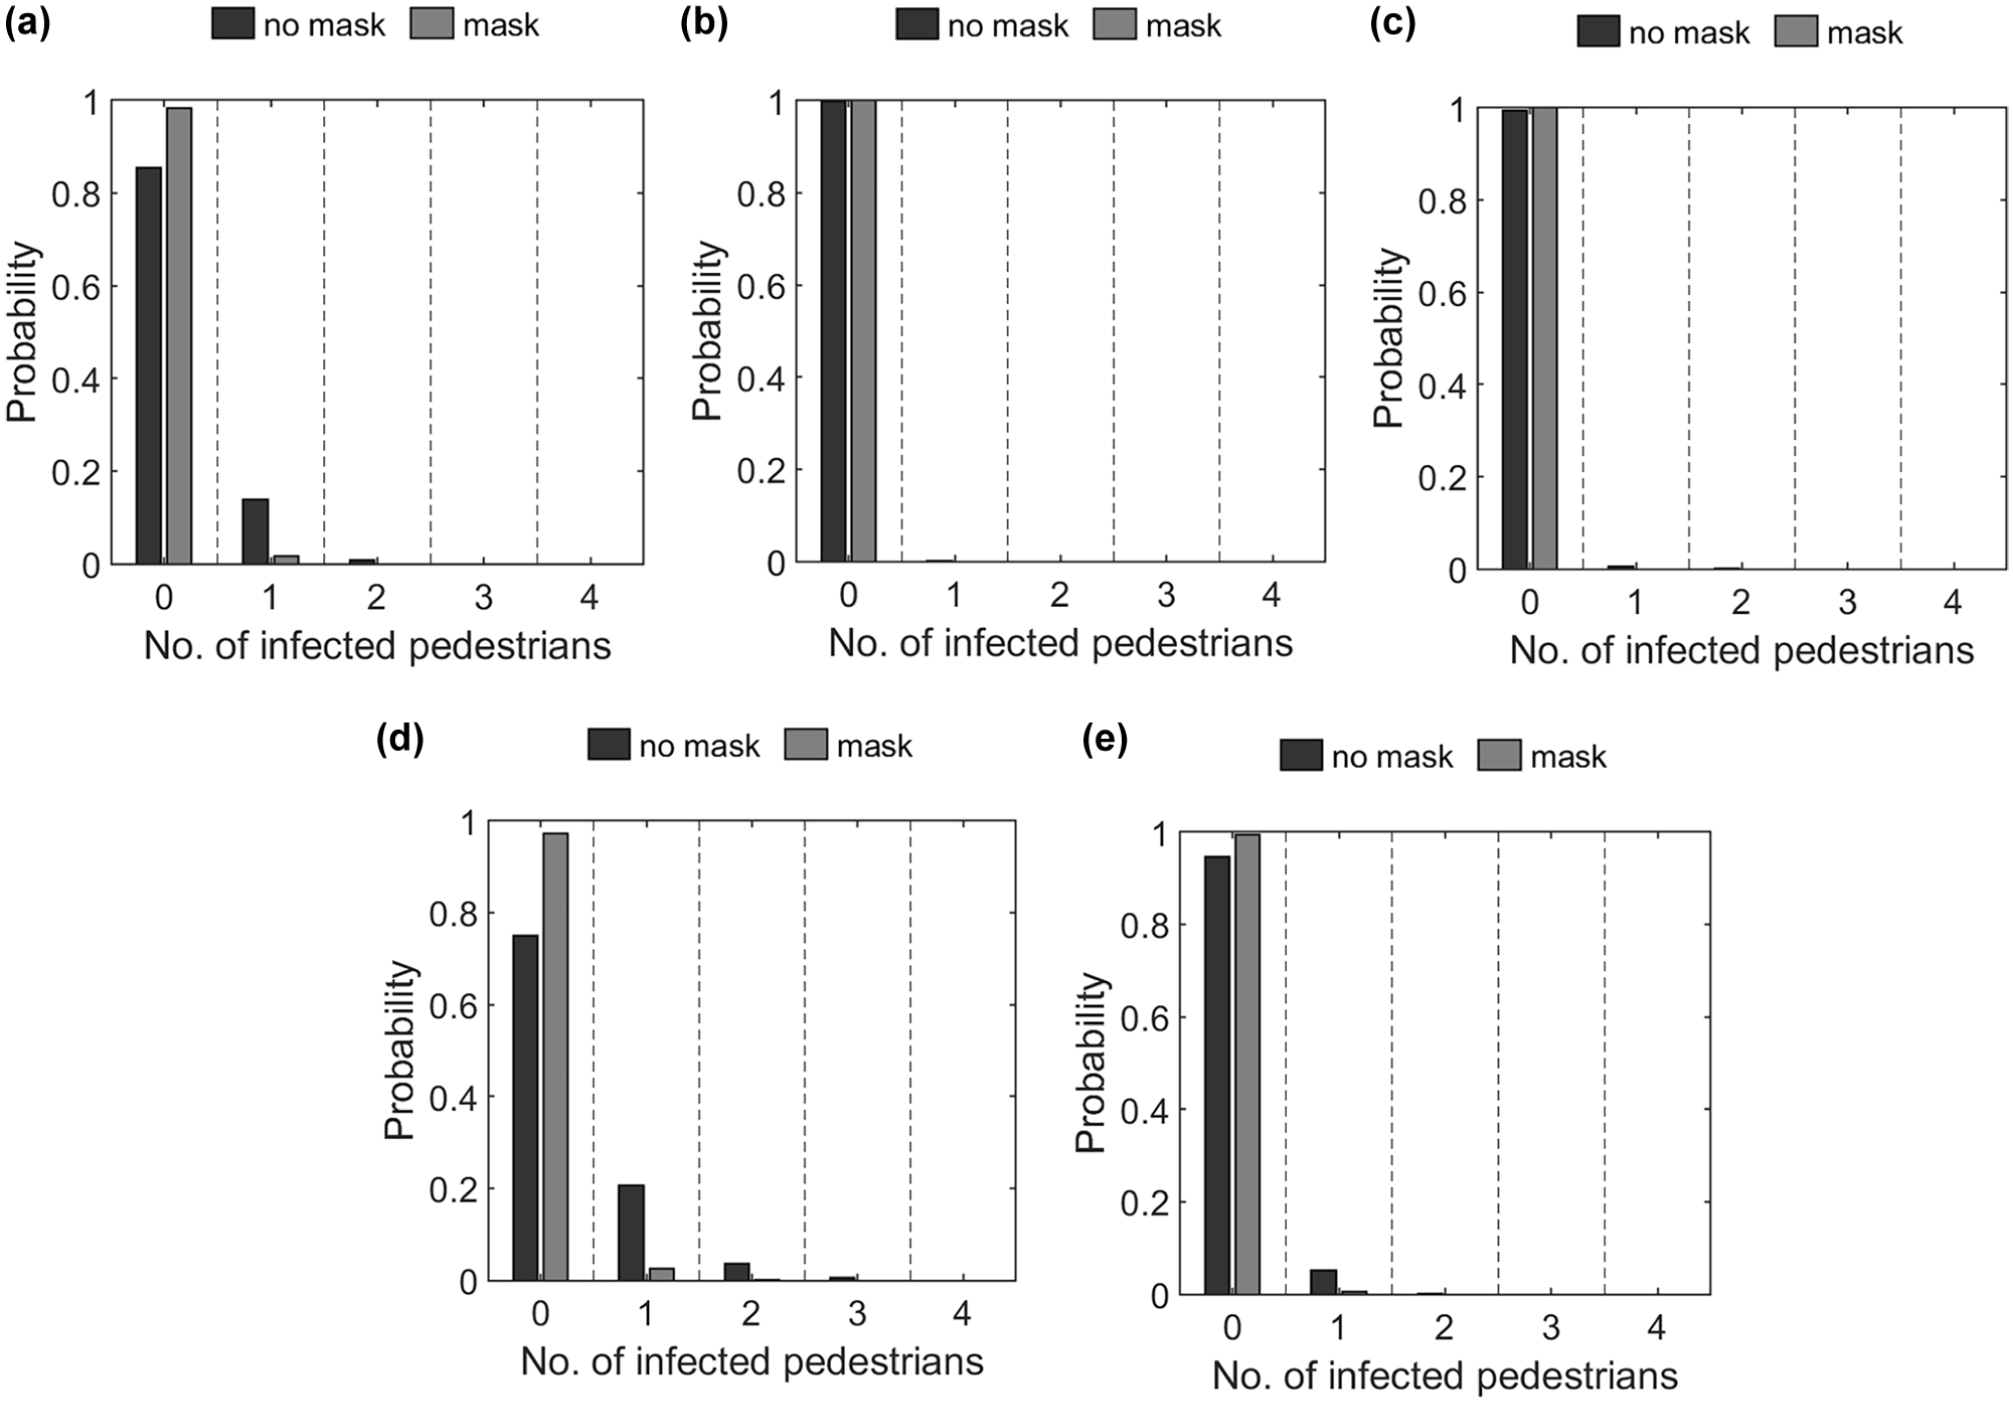
Probability density function of number of infected pedestrians per run for five scenarios (i.e., [a] ticketing, [b] check-in, [c] corridor, [d] platform, and [e] train) where individuals either all wear masks (‘mask’) or no one wears a facial mask (‘no mask’).
The only major effects of the masks are seen in the ticketing scenario. Here, the probability of producing one or more infections in a run decreases from approximately 32.3% to 2.7% of the runs. Most likely, this counter-intuitive result has two causes. First, the infection risk in the check-in and corridor scenarios is limited under all circumstances as interaction times are limited and interaction distances are high, so the use of facial masks is not going to make a difference here.
Impact of Ventilation
Besides that, more and more attention is paid to the ventilation of spaces (see Figure 8). Thus, we also specifically studied the impact of ventilation in four scenarios, namely the check-in, ticketing, platform, and train scenario. As expected, the impact of ventilation is limited in the check-in scenario (0.3%), as the virus particles have has little time to accumulate in space and most other individuals have only short interactions with the infectious individual or the remaining virus. In both the ticketing and platform scenarios, large impacts of ventilation are established: that is, 9.4% and 21.8%, respectively. Moreover, the probability of an infectious individual infecting more than one other individual decreases as well. Surprisingly, also in the train scenario, little impact of the ventilation is found (1.25%). When studying the results more thoroughly, we find that short-range droplets (on which ventilation has little effect) infect most individuals that are infected in this scenario. Consequently, a positive impact of ventilation is especially present in the ticketing scenario. This is probably because under high ventilation circumstances the virus dissipates more quickly, thus limiting the cloud of aerosols (i.e., very small virus particles) that can build up at the location of the queue.
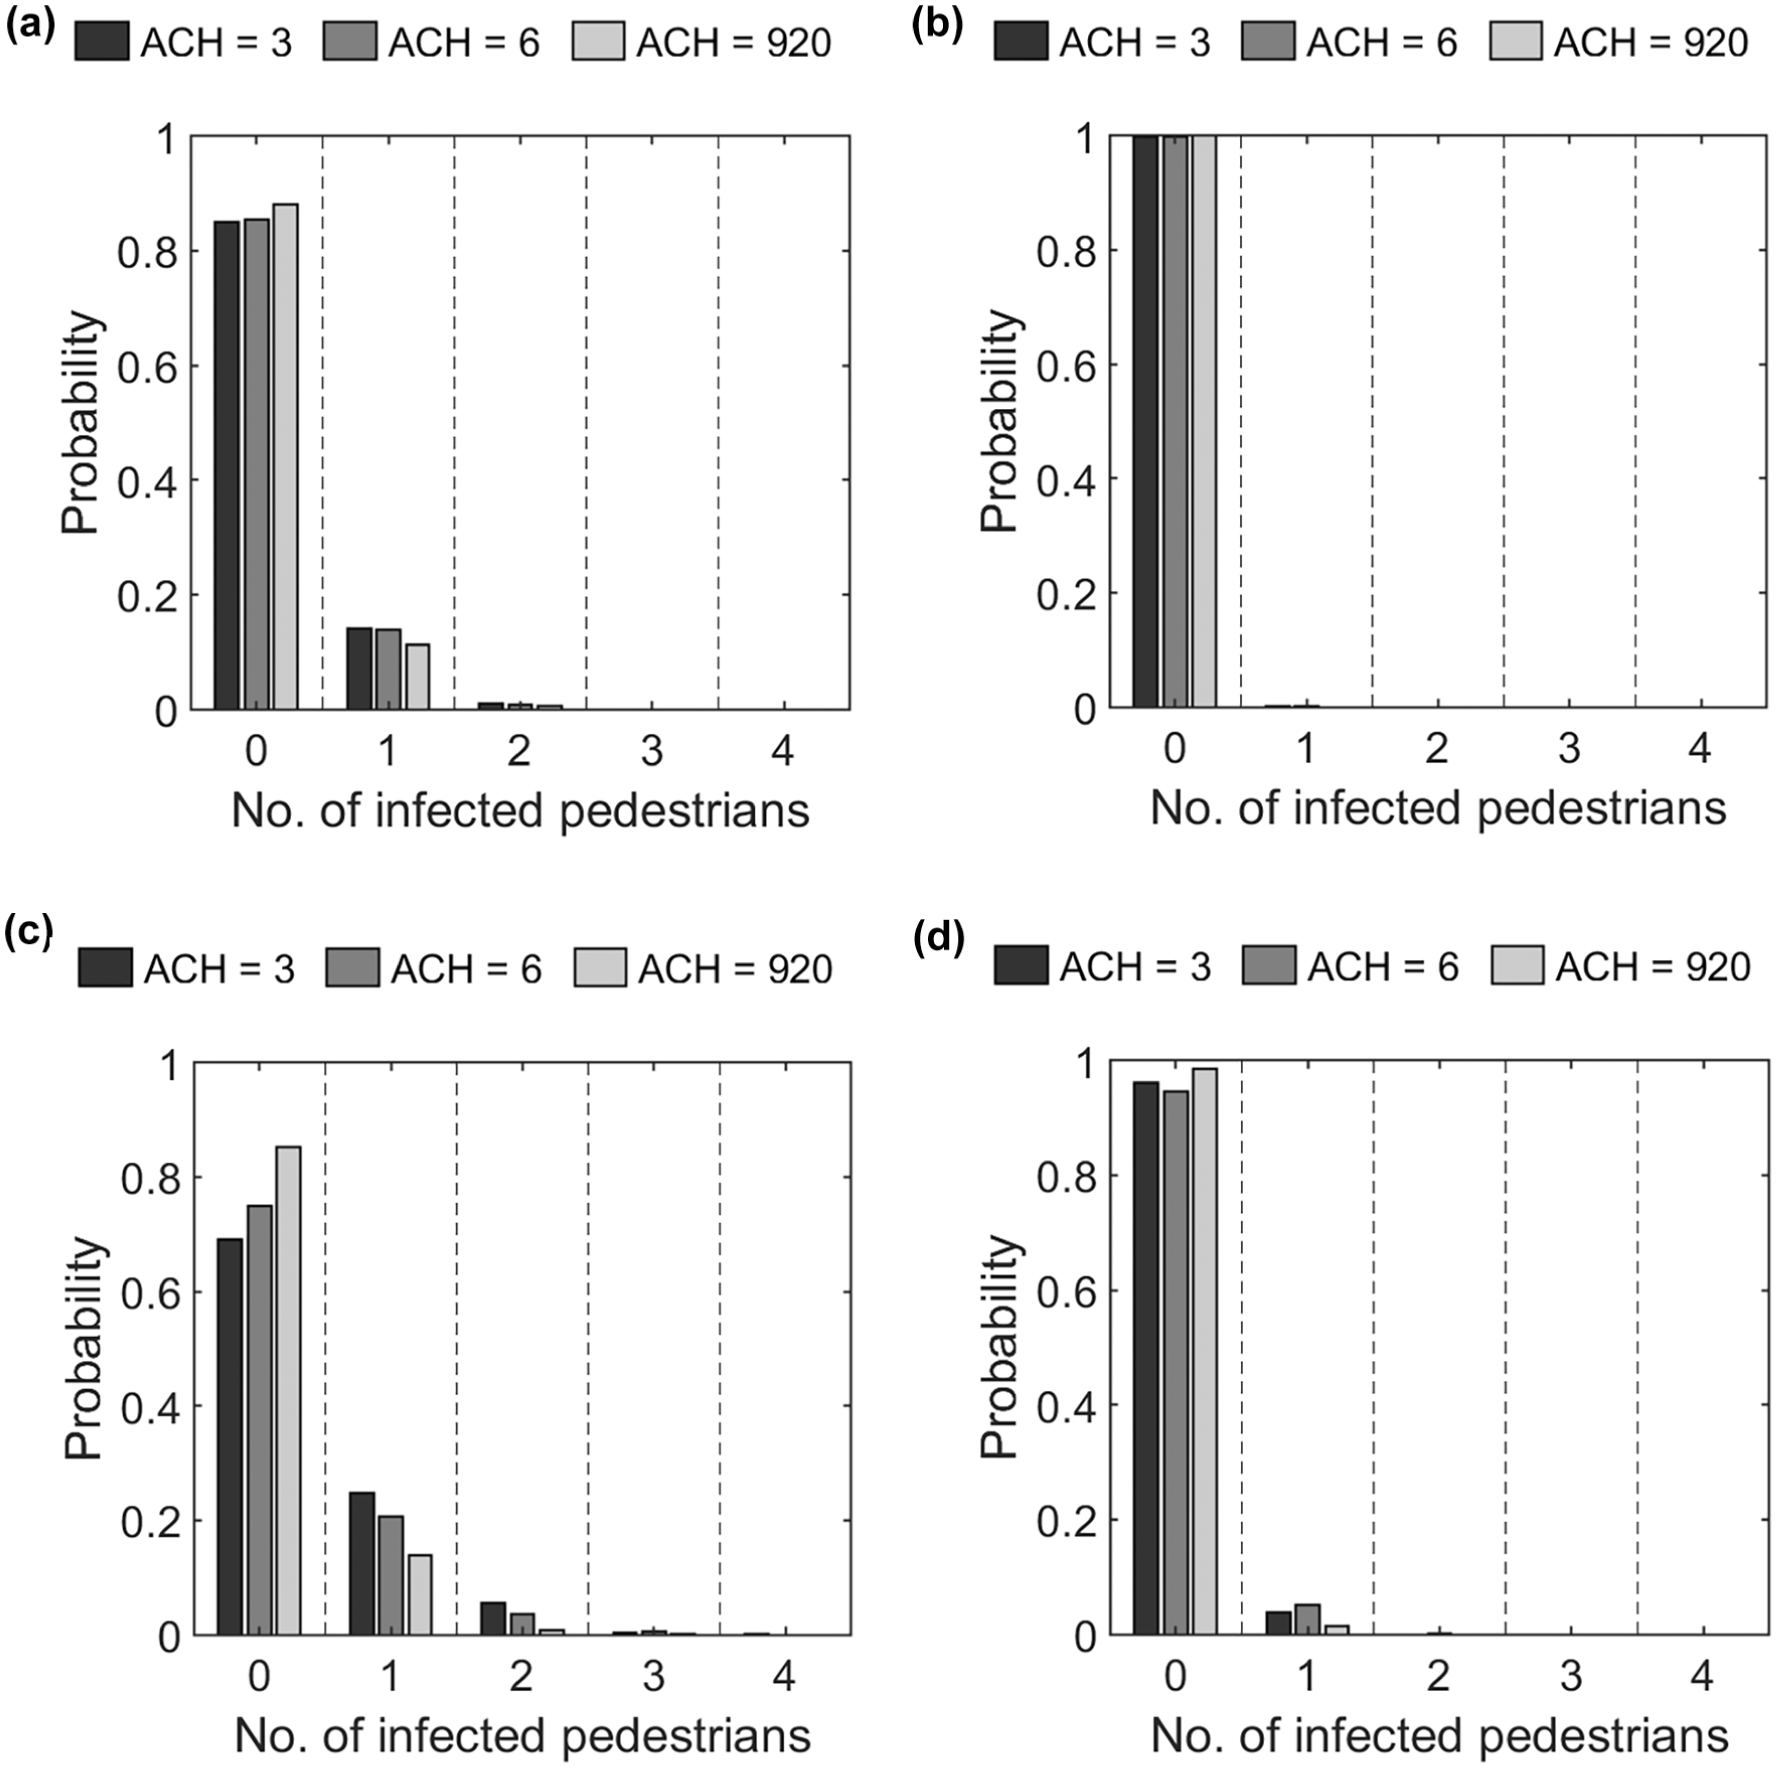
Probability density function of the number of infected pedestrians per run for several scenarios (i.e., [a] ticketing, [b] check-in, [c] platform, and [d] train) and varying levels of ventilation.
Interaction Distance and Duration versus Infection Risk
Besides deriving the probability of several new infections using PeDViS, we also derived the number of infections using the common manner that most crowd modeling studies up to this point have identified infection risk. In particular, we set two deterministic thresholds for an individual to get infected, namely a cumulative interaction duration of larger than 15 min and an interaction distance smaller than 1.5 m. Using the deterministic thresholds only in the platform and train scenarios lead to infections.
When studying the interaction distances and duration of the agents in the PeDViS simulation more carefully (see Figure 9), we see that almost no interaction distances arise that are smaller than 0.7 m, and in all cases, the maximum interaction time is less than 60 s, even in the train scenario (except for when a person is sitting directly next to you). Thus, the use of this popular deterministic threshold seems to lead to fewer infections than when we derive the probability of infection using PeDViS.
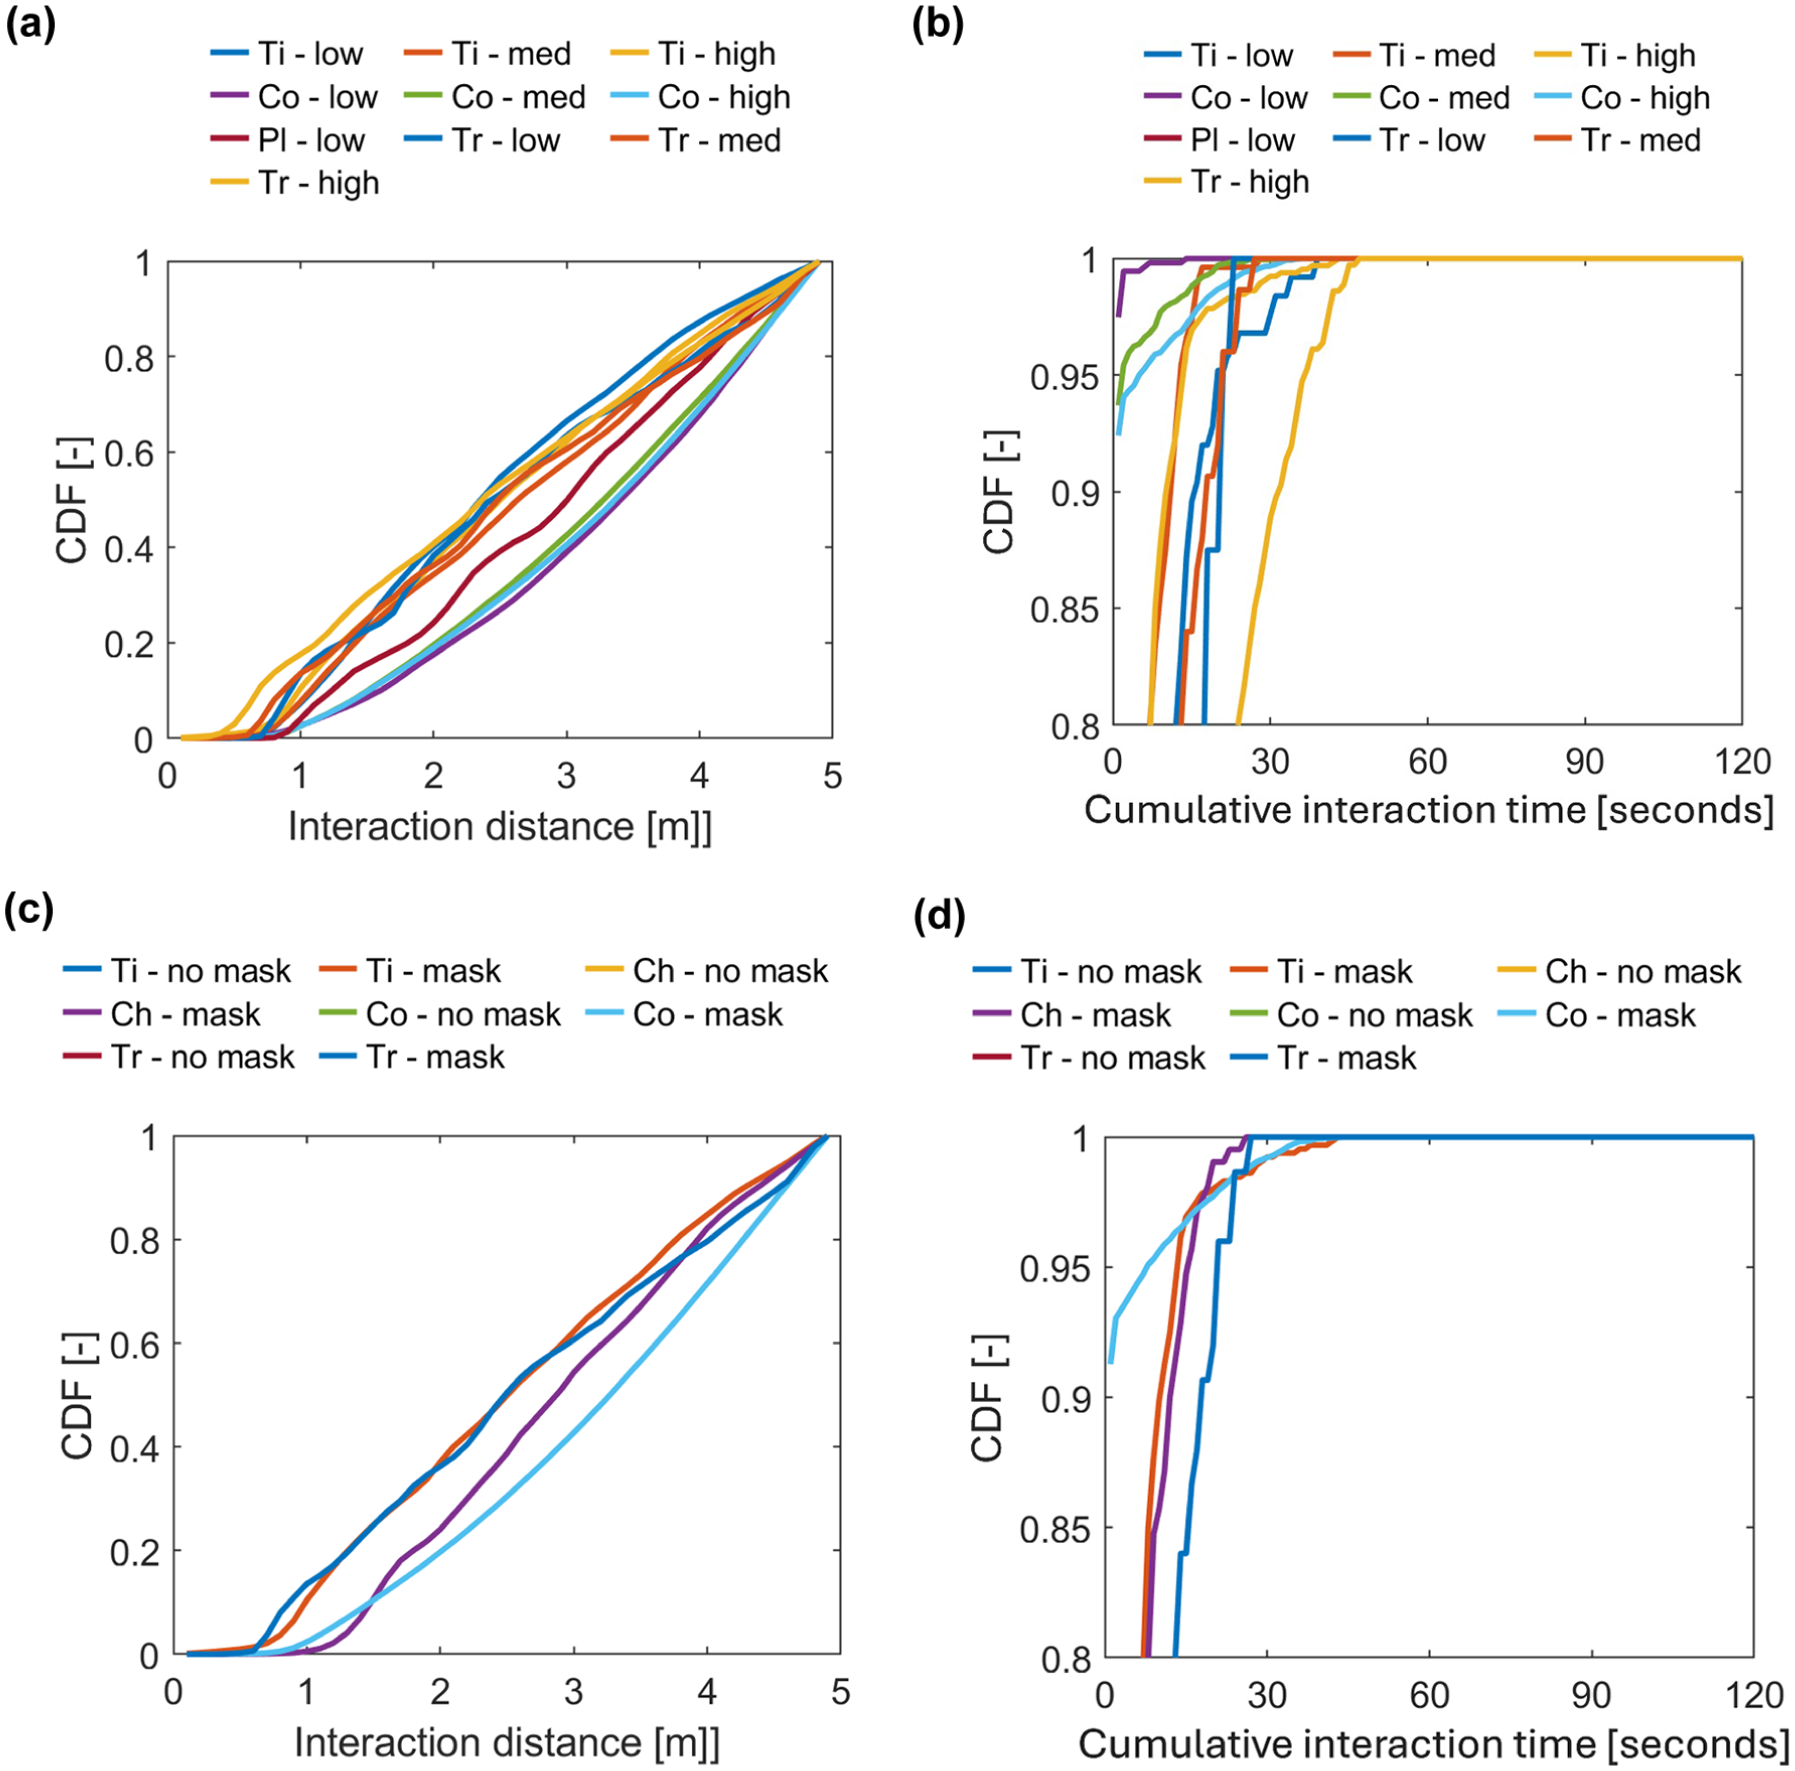
Cumulative Distribution Function (CDF) of interaction distance and interaction duration for four scenarios and two non-pharmaceutical interventions (NPIs). (a) distance—impact of demand, (b) duration—impact of demand, (c) distance—impact of masks, and (d) duration—impact of masks.
We hypothesize that the difference in the number of infections can be attributed to a low, but existing, probability of getting infected with a relatively low virus dose or through virus particles that are still airborne while the infectious individual already left the premises. In both cases, the distance and time thresholds would not capture these infection cases. Consequently, one should be careful in applying deterministic thresholds to study SARS-CoV-2 spread, or the impact of NPIs and designs on the number of infections, as one might underestimate the number of infections owing to virus traces lingering in the environment.
Conclusions and Future Work
Two years ago, a new virus named SARS-CoV-2 emerged. Since its introduction, it rapidly spread across the globe and has greatly affected societies ever since. Yet, questions such as “What is the risk of SARS-CoV-2 infection in a particular scenario?” and “Which NPIs limit virus transmission most effectively?” remain challenging to disentangle. Also in the mobility sectors, questions on the effectiveness of NPIs and crowd management are being raised. Simulation models can provide preliminary insights into the do’s and don’ts of NPI application in mobility scenarios.
This paper provides a preliminary answer to both questions for five public transit scenarios using a new hybrid virus spread model PeDViS. This model links an existing validated crowd movement dynamics model (NOMAD) with a new specialist SARS-CoV-2 virus spread model (QVEmod). We have simulated virus spread in five scenarios that often occur in public transit, namely walking through a corridor, buying a ticket, going through a set of ticket gates, waiting at a platform, and riding on a train. The impact of four elements on virus spread and the probability that one infectious individual infects one or more other individuals, namely demand, waiting times, wearing facial masks, and the use of ventilation, was studied.
Based on these results, multiple conclusions can be drawn. First, the impacts that were expected based on theory and literature, are also corroborated by this study. That is, ventilation and facial masks decrease the probability that one infectious individual infects at least one other individual. Moreover, waiting time and higher demand levels increase this same probability. Second, and maybe more interestingly, the largest positive impacts of these measures on the number of infections are found in scenarios where long queues, delays, or waiting times are materializing in conjunction with high demands and crowd densities. In parallel, in cases where interaction times and interpersonal distances can be maintained, ventilation and facial masks render limited additional positive results. That is not to say that they have no effect. Instead, the scenarios themselves pose little infection risk from the onset. Third, pertaining to the use of models to identify infection risk, we also conclude that crowd simulation models with a stringent threshold for interaction time and distance, are very likely to underestimate the number of infections. That is, a study of the cumulative distribution of the interaction duration of contacts within 1.5 m illustrates that in most scenarios, a crowd simulation model would not identify any additional infections, while the PeDViS model does find new infections as a result of indirect, aerosol accumulation over time in areas that the infectious individual visited in previous time steps.
The results of this study imply that the risks of virus spread in public transit are predominantly located at locations where people accumulate, ventilation is bad, and waiting times are large. Consequently, to limit infections in the public transit system, especially NPIs are of interest that limit the occurrence of these three contextual variables and ensure that they do not occur in conjunction. For instance, optimized scheduling to limit demand, vehicle delay minimization measures, or increasing the number of ticket machines to limit waiting times can all be NPIs to limit SARS-CoV-2 spread and related infections in transportation systems worldwide.
PeDViS presents the next step in the model-based assessment of virus spread and infection risk in indoor spaces. The underlying flexible pedestrian dynamics model NOMAD makes it quite easy to simulate SARS-CoV-2 spread in different types of pedestrian infrastructures. Amenities featuring very specific operational dynamics, routing, or scheduling processes might require slight functional improvements to the NOMAD. Examples of these types of amenities are queueing in densely populated areas, routing and scheduling in supermarkets, and group formation while walking and stepping on escalators. Moreover, the modular design and the high level of parameterization of PeDViS allow researchers to also quickly adjust the model to simulate other types of airborne viruses. The trickier part of repurposing PeDViS for other viruses is the correct calibration of the epidemiological models for a new virus with potentially different dynamics. This requires very specific data concerning the prevalence of the virus in society, the dynamics of the virus particles (during emission, air travel, and reception), the availability and effectiveness of pharmaceutical interventions, and the dose–response model of the particular virus.
At the same time, the PeDViS model is also still undergoing rapid development. The parameters of the two underlying sub-models have been calibrated on the little available data pertaining to physical distancing dynamics, SARS-CoV-2 virus spread, and the dose–response curve for SARS-CoV-2. We will keep working on PeDVis to further calibrate the model using the newest insights pertaining to the behavior of the people and the virus particles under these interesting circumstances. In addition, airflow dynamics in this model are simplified, thereby not incorporating flows resulting from people movements among others. These may substantially affect the role of aerosols in “semi-indoor” settings like train stations. Moreover, this study provides five very stylized cases of public transit scenarios with a limited number of variables. More research is required to incorporate all factors that influence each of these scenarios, such as crowd movement dynamics and grouping behavior. Further, the scenarios consider one infected individual per run. Scenarios with more individuals have a larger likelihood of including more than one infected individual, particularly when levels of transmission in the overall population are high. These factors should similarly be considered to judge the need for NPIs during the ever-changing epidemiological context. Most importantly, PeDViS is designed to provide insight into the relative differences in virus spread and infection risk between slightly varying scenarios (with NPIs). Consequently, the current results cannot be used to quantify the actual infection risk in practical scenarios but should be interpreted as a guide to compare different scenarios under the same conditions.
However, we are confident that insights into the relative impacts of NPIs can also be helpful for practitioners who strive to create safe transit experiences for their travelers during the COVID pandemic.
Footnotes
Author Contributions
The authors confirm contribution to the paper as follows: study conception and design: D. Duives, X. Wang; data collection: D. Duives; analysis and interpretation of results: D. Duives, X. Wang; draft manuscript preparation: D. Duives, M. Sparnaaij, Q. Ten Bosch. All authors reviewed the results and approved the final version of the manuscript.
Declaration of Conflicting Interests
The authors declared no potential conflicts of interest with respect to the research, authorship, and/or publication of this article.
Funding
The authors disclosed receipt of the following financial support for the research, authorship, and/or publication of this article: This publication is part of the project SamenSlimOpen (with project number 10430022010018 of the research program COVID-19), which is financed by the Dutch Research Council (NWO) and ZonMw.