
Abstract
Pavements constructed on frost-susceptible subgrades are often subjected to distress because of cyclic freeze–thaw (F–T) conditions resulting from seasonal temperature variations. Cyclic frost heaving significantly affects the long-term performance of pavements, particularly during the thawing phase, where excess water weakens the subgrade. Numerous solutions have been studied to mitigate these issues, including soil stabilization, soil replacement, and drainage improvements using geosynthetics. Traditionally, many woven and non-woven geotextiles have been used to remove excess water; they are effective at draining water under saturated conditions. However, they are ineffective at removing moisture under unsaturated conditions because they cannot provide sufficient capillary suction. A new type of geotextile—the wicking geotextile—has been introduced, with finer, deeper grooves to generate higher capillary suction, aiding the extraction and transport of excess moisture even in unsaturated conditions. In this paper, a research study was designed to evaluate the performance of the wicking geotextile under cyclic F–T conditions. Large-scale laboratory tests with an unreinforced control section (CS) and a reinforced section (RS) were designed using frost-susceptible soils. The test setup was subjected to two F–T cycles under controlled temperature conditions with freezing temperature set at −18°C (−0.4°F). The results showed the wicking geotextile effectively removed and transported moisture, thereby reducing water content in the RS subbase by 51% and in the subgrade by 7% compared with CS. It also helped redistribute moisture uniformly across the pavement layers and maintained steady drainage even after cyclic F–T, indicating consistent performance under harsh environmental conditions.
Introduction
Pavements are an integral part of global transportation infrastructure networks, playing a crucial role in facilitating the movement of goods and people, thereby significantly influencing national economic productivity. Therefore, optimizing the pavement network becomes crucial to minimize economic losses. However, the long-term performance and serviceability of pavement structures are often compromised because of mechanical and environmental stressors ( 1 ). Pavement distress can manifest in various forms, including differential settlement, frost heave, and moisture-induced distress, which collectively contribute to the degradation of pavement structural integrity and performance ( 2 ).
Pavement distresses are prevalent and severe in cold climatic conditions because of cryogenic processes. Frost-heave affects a significant portion of the U.S., with more than 50% of states experiencing pavement distress from this phenomenon. However, the severity and frequency of frost-induced pavement distress vary across the country. Pavements in central states often experience more frequent distress than northern states. The difference is attributed to the higher frequency of freeze–thaw (F–T) cycles in central states compared with prolonged freezing periods in northern regions ( 3 ).
Because of cyclic F–T, geomaterials undergo significant volumetric strains, causing significant damage to pavement structures. During cold weather, pore water within the soil transforms into ice. As a result of this cryogenic phenomenon, the pore water in the void expands by approximately 9% by volume, exerting significant uplift pressures on the pavement ( 1 , 4 ). Subsequently, during hot weather, the ice thaws back into water, resulting in excess moisture retention in the soil layers, reducing the soil’s strength and stiffness properties ( 5 , 6 ). Therefore, timely removal of excess moisture from the pavement is essential for ensuring long-term performance and durability of the pavement system ( 6 ).
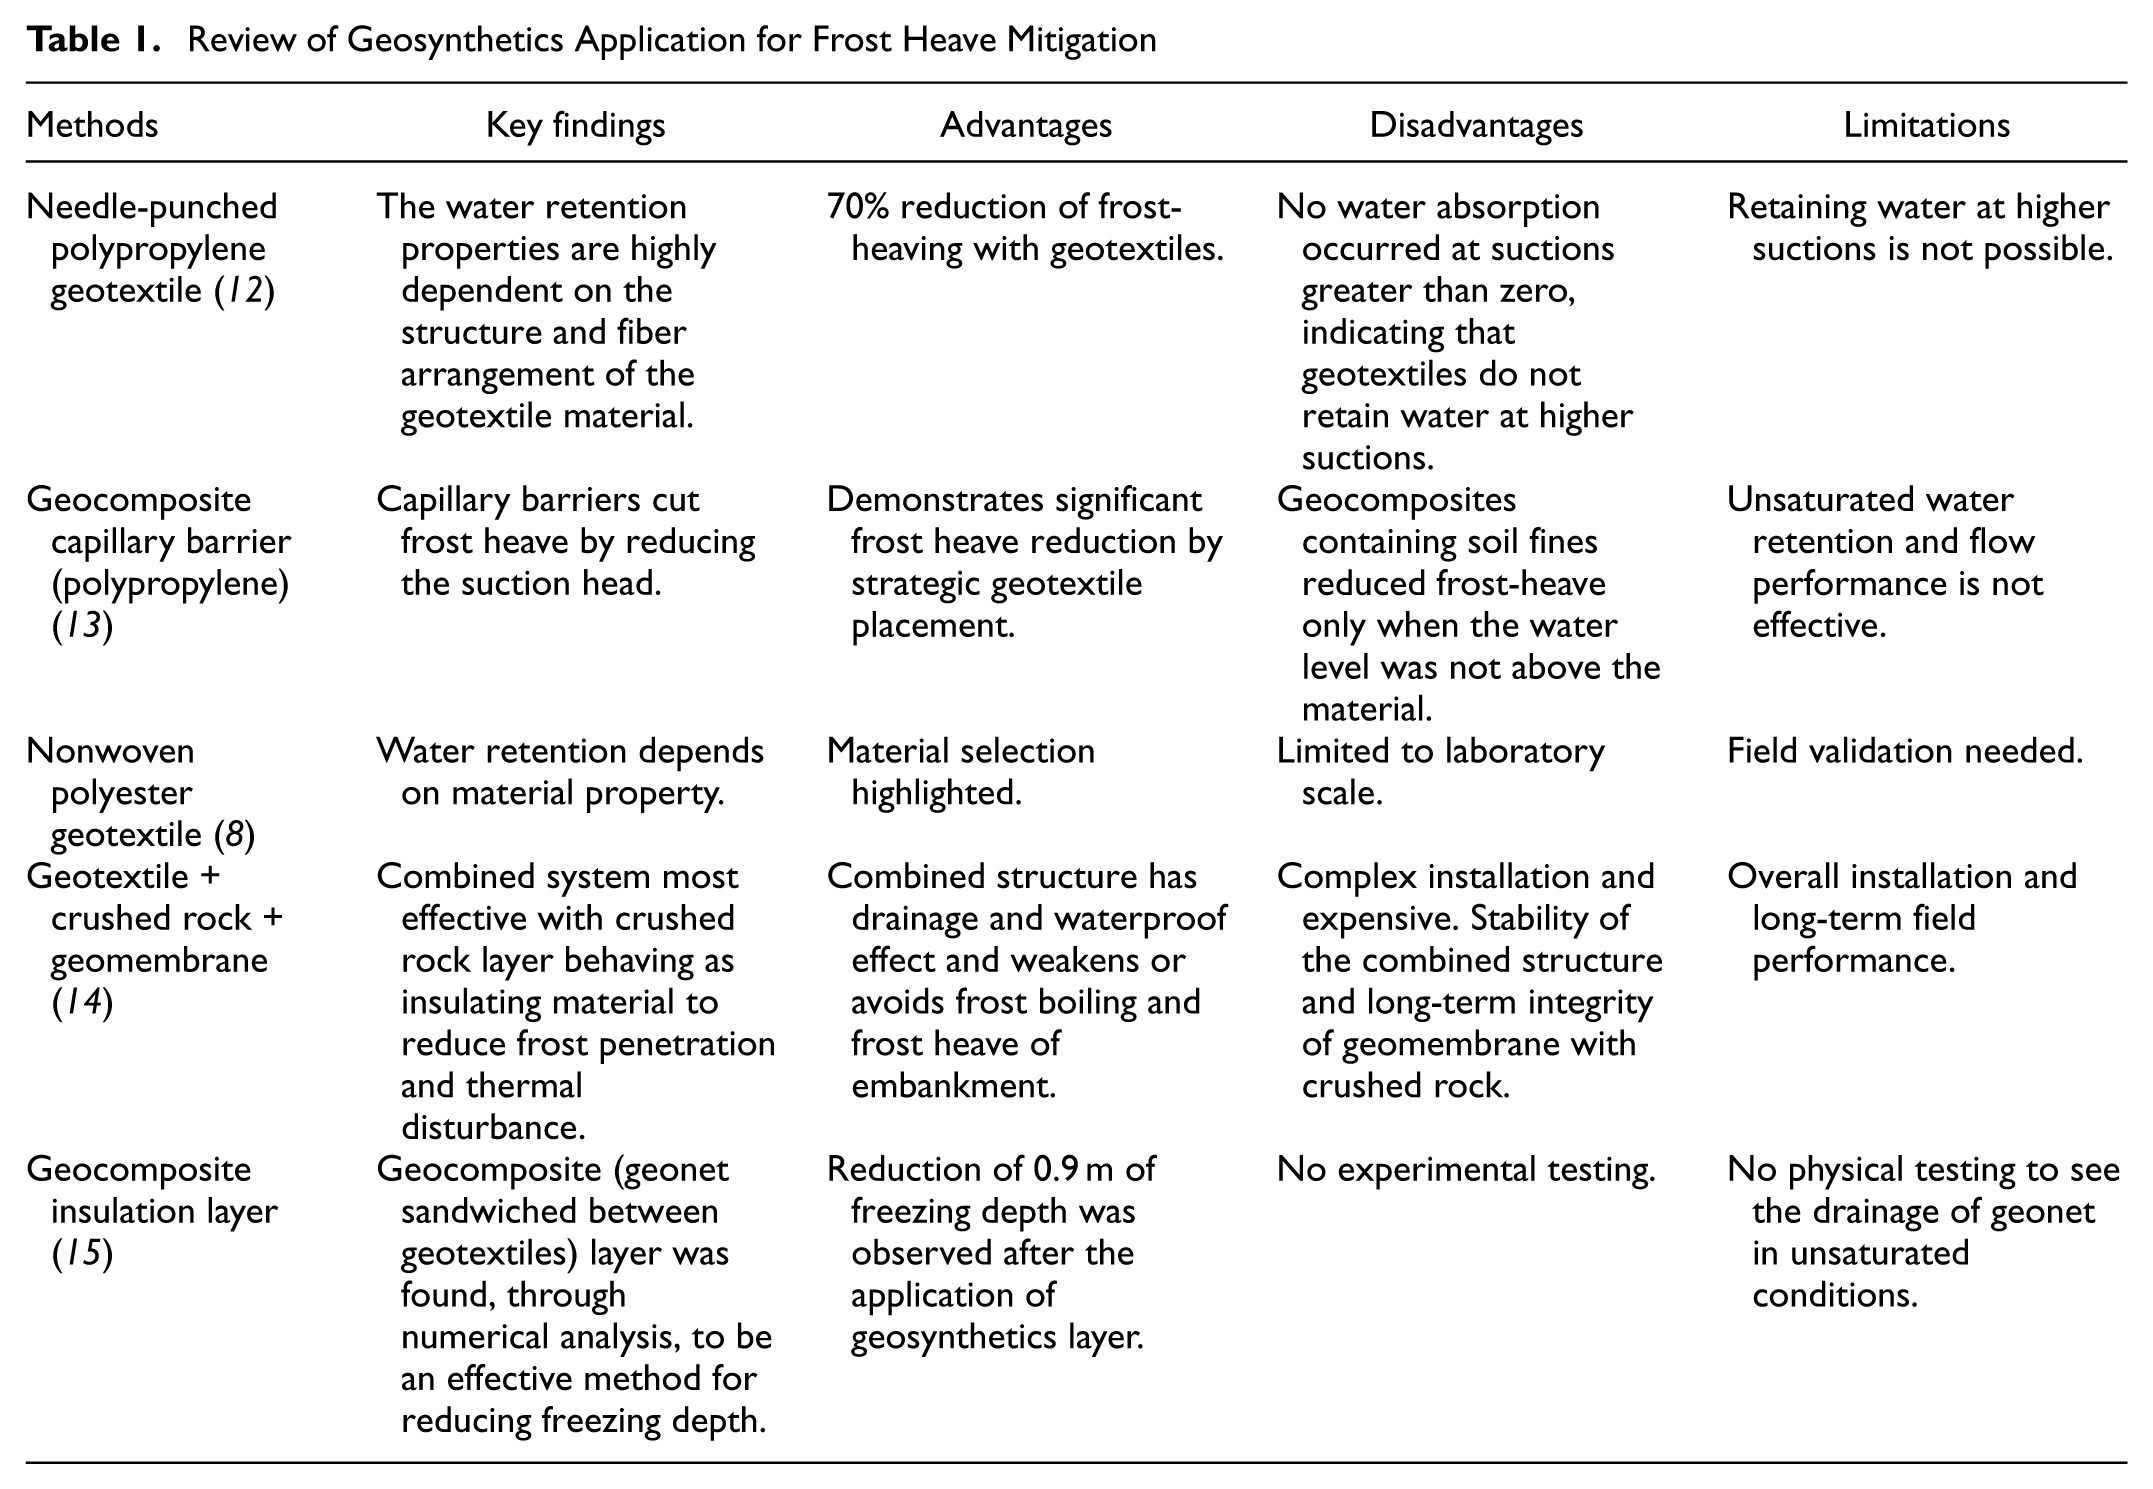
Numerous geotechnical solutions have been developed and implemented to mitigate the detrimental effects of excessive retained moisture under the pavements, such as the utilization of superior quality geomaterials, chemical stabilization of soil, and the installation of geosynthetics for stiffness and drainage capacity ( 7 , 8 ). Both woven and non-woven geotextiles have traditionally been used in pavements to provide reinforcement, separation, and drainage functions ( 9 ). These geotextiles have demonstrated efficacy in water absorption and gravity-driven transport, providing optimal drainage in saturated conditions ( 10 , 11 ). However, traditional geotextiles are ineffective under unsaturated soil conditions, primarily because they lack sufficient capillary action. Table 1 summarizes key findings from previous research studies on frost-heave mitigation in cold regions using geosynthetics and highlights the limitations of conventional geosynthetics.
Review of Geosynthetics Application for Frost Heave Mitigation
To address the limitations of conventional geotextiles in unsaturated conditions, a novel class of geosynthetics, known as “wicking geotextiles,” has been introduced ( 16 ). The wicking geotextile consists of hydrophilic and hygroscopic nylon and polyethylene fibers with deep groves that aid in enhancing the capillary suction (Figure 1). The enhanced suction properties of wicking geotextiles enable it to effectively collect and transport moisture under unsaturated conditions ( 17 ). The moisture captured with the help of a wicking geotextile is transported in the in-plane direction and disposed of from the exposed portion of the geotextile outside the pavement ( 6 , 7 ). At this interface, evaporation occurs, creating a suction gradient between the exposed portion and the section installed beneath the pavement. The suction differential serves as the driving force for continuous moisture migration from the pavement layers to the external environment ( 18 ).
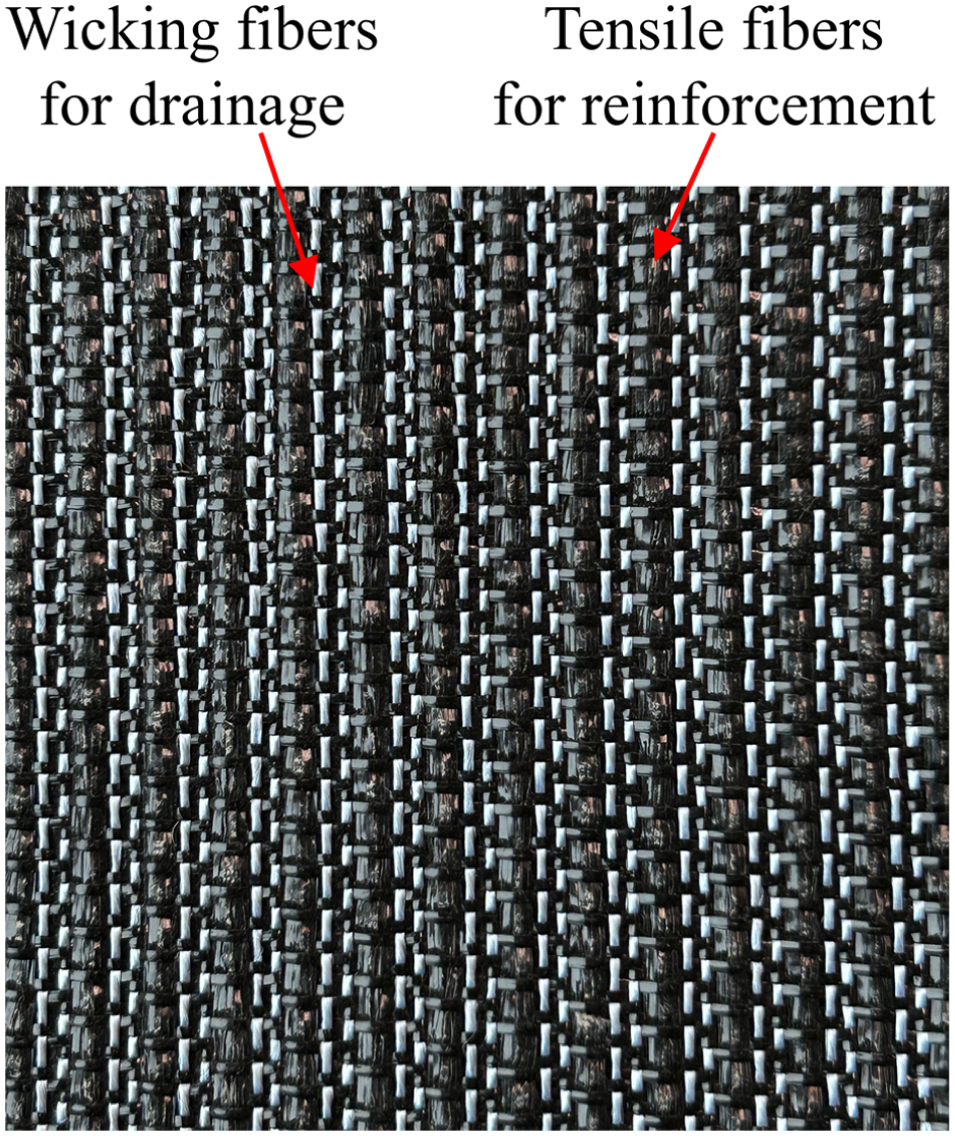
Photograph of wicking geotextile.
Laboratory and field studies on the wicking geotextile have shown that it effectively brings down moisture in soils below the optimum moisture content (OMC), regardless of the initial moisture content, increasing the unsaturated strength of the soil ( 19 , 20 ). However, the influence range for the capillary action of the geotextile was found to be limited ( 11 ). The influence depth was found to vary depending on the type of geomaterial and geometry of pavement structures, such as cross-slope and exit ditch setup. The geotextile was observed to have a higher range of influence in fine subgrade materials than in coarse base and subbase materials ( 21 , 22 ). Nevertheless, geotextile was observed to affect coarse materials in removing moisture more effectively as compared to finer materials. In addition, it has also been determined that installing the wicking geotextile at the interface of subgrade and subbase/base is highly effective in reducing the water content and improving the pavement performance ( 7 ). The geotextile’s performance is affected not only by the type of geomaterials used but also by the surrounding conditions such as temperature and relative humidity (RH) ( 22 ). The rate of water removal is observed to increase with an increase in temperature and decrease with an increase in RH at the exposed portion of the geotextile ( 16 , 23 ).
The primary objective of this study is to evaluate the drainage performance of wicking geotextile in improving pavement performance by mitigating the distress generated by cyclic F–T conditions. A large-scale laboratory test setup was designed using frost-susceptible geomaterials and an open water system under controlled temperature conditions. This study consisted of an unreinforced control section (CS) and a reinforced section (RS) installed with wicking geotextile at the subgrade-subbase interface. A constant water supply was provided from the bottom layers to the top, while temperature flow was maintained from top to bottom, replicating the field conditions. To understand the flow of temperature and moisture with changes in surrounding conditions, the test sections were installed with moisture sensors, thermocouples, and shape accel array (SAA) sensors.
Laboratory Setup
Materials
The geomaterials used in this study for three layers of pavement (i.e., subgrade, subbase, and base) were obtained from an existing pavement site in Minnesota, as these are naturally frost-susceptible soils. The base material consists partly of reclaimed asphalt pavement material and was classified as well-graded gravel according to the Unified Soil Classification System (USCS). Subbase material was classified as well-graded sand with gravel, with sand constituting about 56%. The subgrade material was classified as low-plastic clay according to the USCS classification, with a liquid limit of 33% and a plasticity index of 14%. According to the Minnesota Department of Transportation (MnDOT) specifications, the subbase and base were classified as class 5Q and class 5, respectively. The grain size distribution curves of the geomaterials are shown in Figure 2, and their basic characterizations are listed in Table 2.
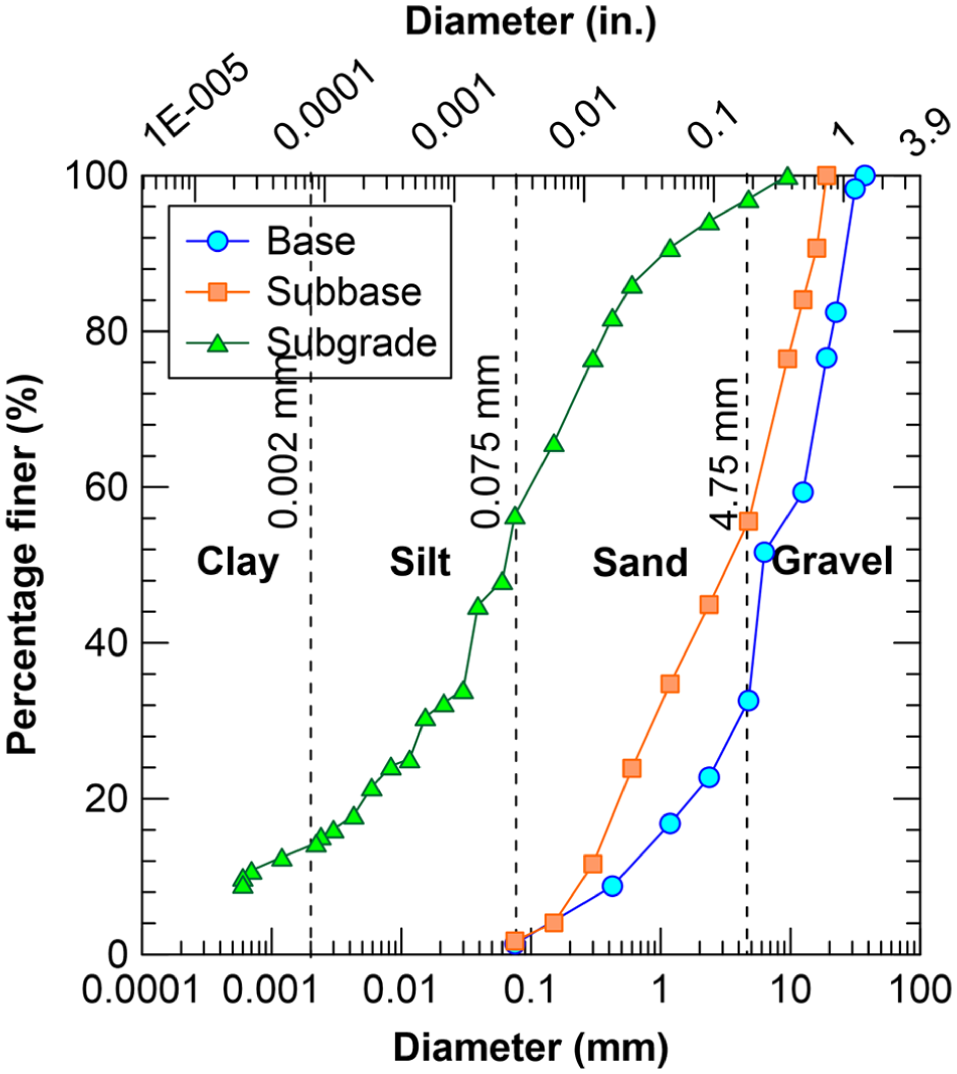
Grain size distribution of geomaterials.
Basic Characterization of Construction Materials
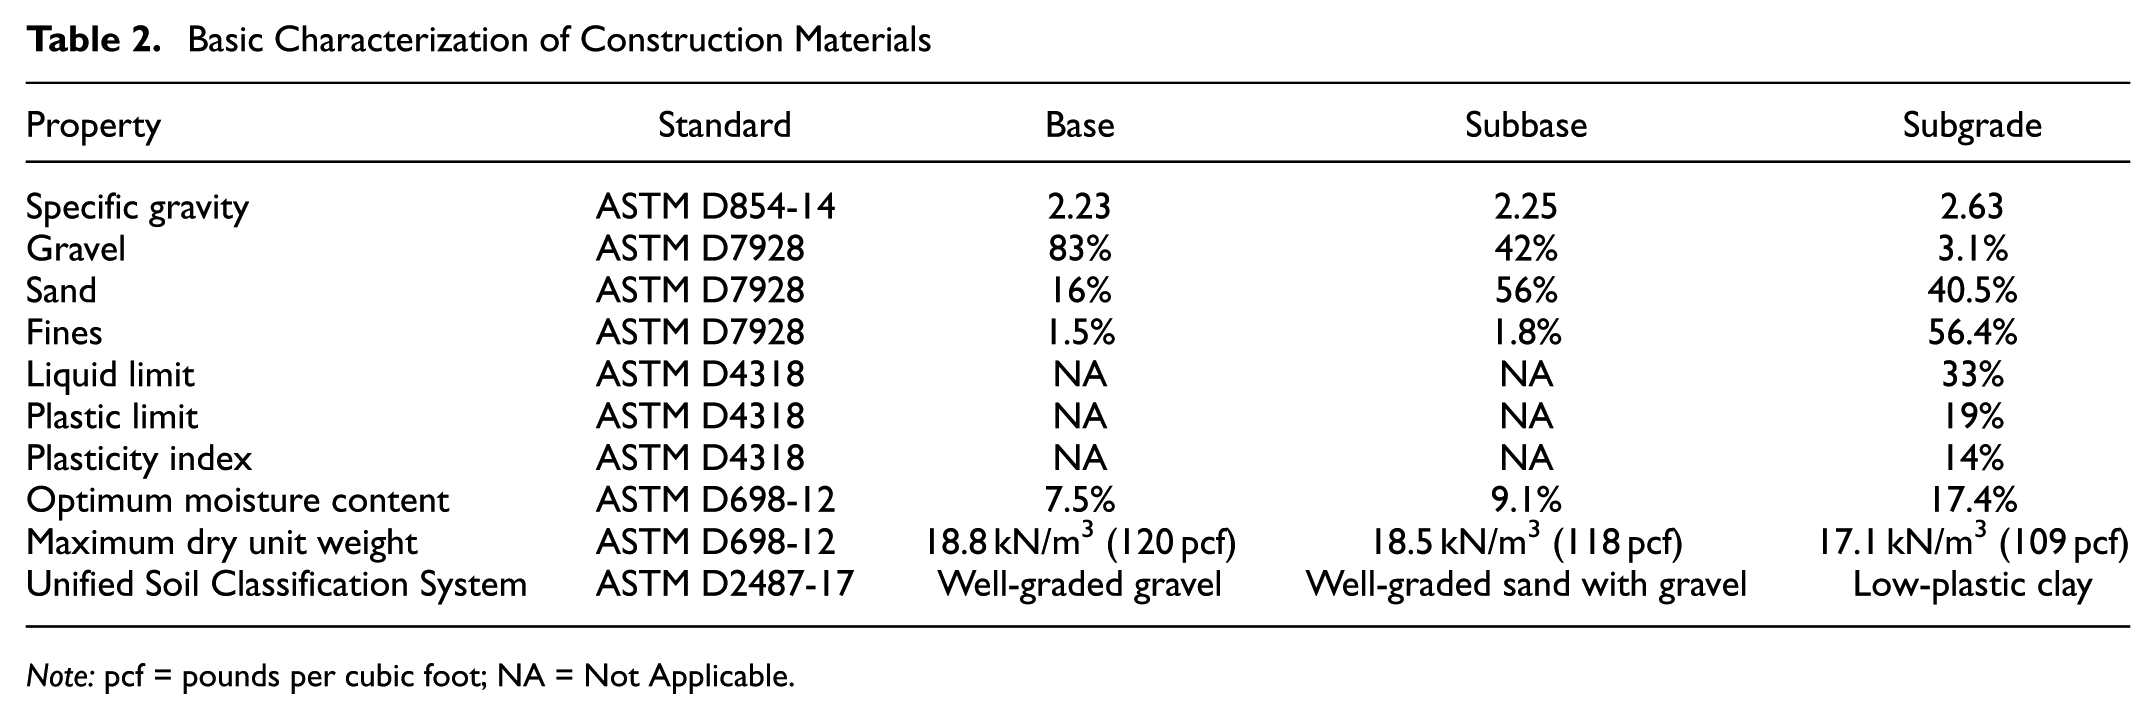
Note: pcf = pounds per cubic foot; NA = Not Applicable.
The wicking geotextile used as the reinforcement is a woven geotextile consisting of multiple wicking fibers made of nylon and polyethylene. The wicking fibers have four deep groove channels, which provide additional capillary suction helping moisture drainage. The geotextile shows a higher transmissivity in the in-plane direction because of the woven fabric arrangement. Additional engineering properties of the geotextile provided by the manufacturer are listed in Table 3.
Engineering Properties of Wicking Geotextile (Obtained from Manufacturer)
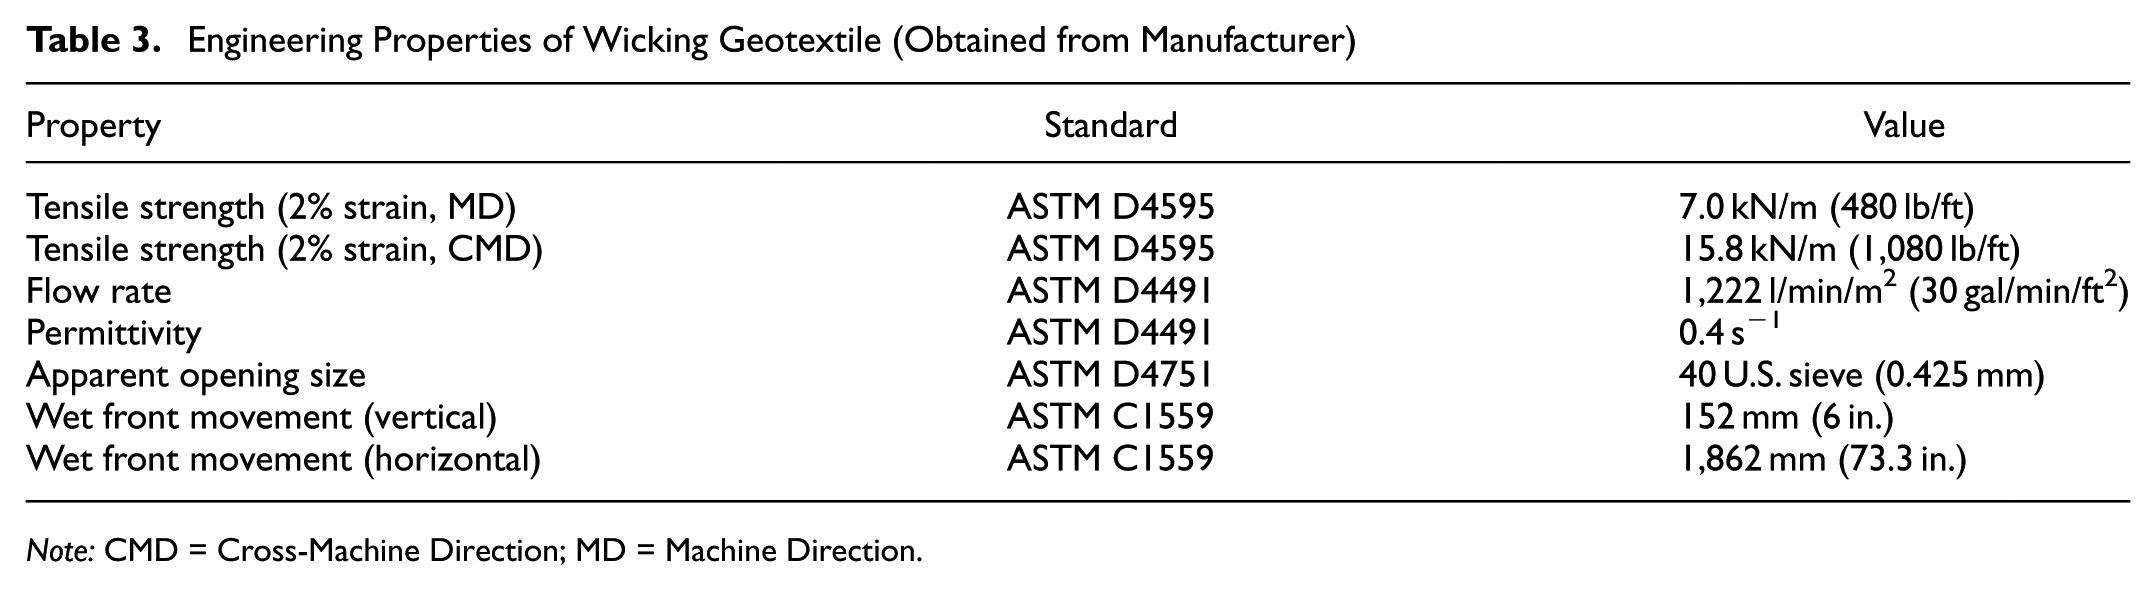
Note: CMD = Cross-Machine Direction; MD = Machine Direction.
Methodology
A large-scale laboratory test setup was designed to evaluate the drainage properties of the wicking geotextile under F–T conditions. Two test sections were constructed—CS (an unreinforced section) and RS (a wicking geotextile section)—and tested under similar temperature conditions. Each test section was designed to replicate three layers of field pavement sections in Minnesota, and the layer thickness was maintained at the same ratios in the field: subgrade 254 mm (10 in.), subbase 203 mm (8 in.), and base 127 mm (5 in.). The test setup was equipped with different types of sensor to monitor the moisture variation, temperature change and surface movement. For this, Terros 10 moisture sensors were used to monitor the volumetric water content (VWC) variation, K-type thermocouples were used for temperature variation, and Measurand SAA were used to monitor the vertical deformation. Figures 3 and 4 show the schematics of both the test section CS and RS, respectively, depicting the positions of each sensor in the pavement layers. The subbase and subgrade were equipped with five moisture sensors each 76.2 mm (3 in.) from the subbase-subgrade interface to monitor the spatial variation of moisture with time. Each layer was installed with a moisture sensor at the center to observe the vertical variation in VWC, including an additional one in the subgrade 76.2 mm (3 in.) from the bottom, specifically to monitor the water supply from the bottom. During the testing, sensors were calibrated by varying the moisture content of the soil specimens, starting from oven dry sample to fully saturated sample values including the frozen conditions ( 24 ). Thermocouples were installed to monitor the vertical temperature change at the center of each layer, and the temperature variation was monitored at 1 Hz frequency. The SAA sensors were installed with the help of flexible pipes in the base layer; they were installed to monitor the vertical movement of the pavement layer caused by frost heaving. All these sensors were tested with the soil in rapid freezing conditions to ensure their operational reliability in changing temperature conditions.
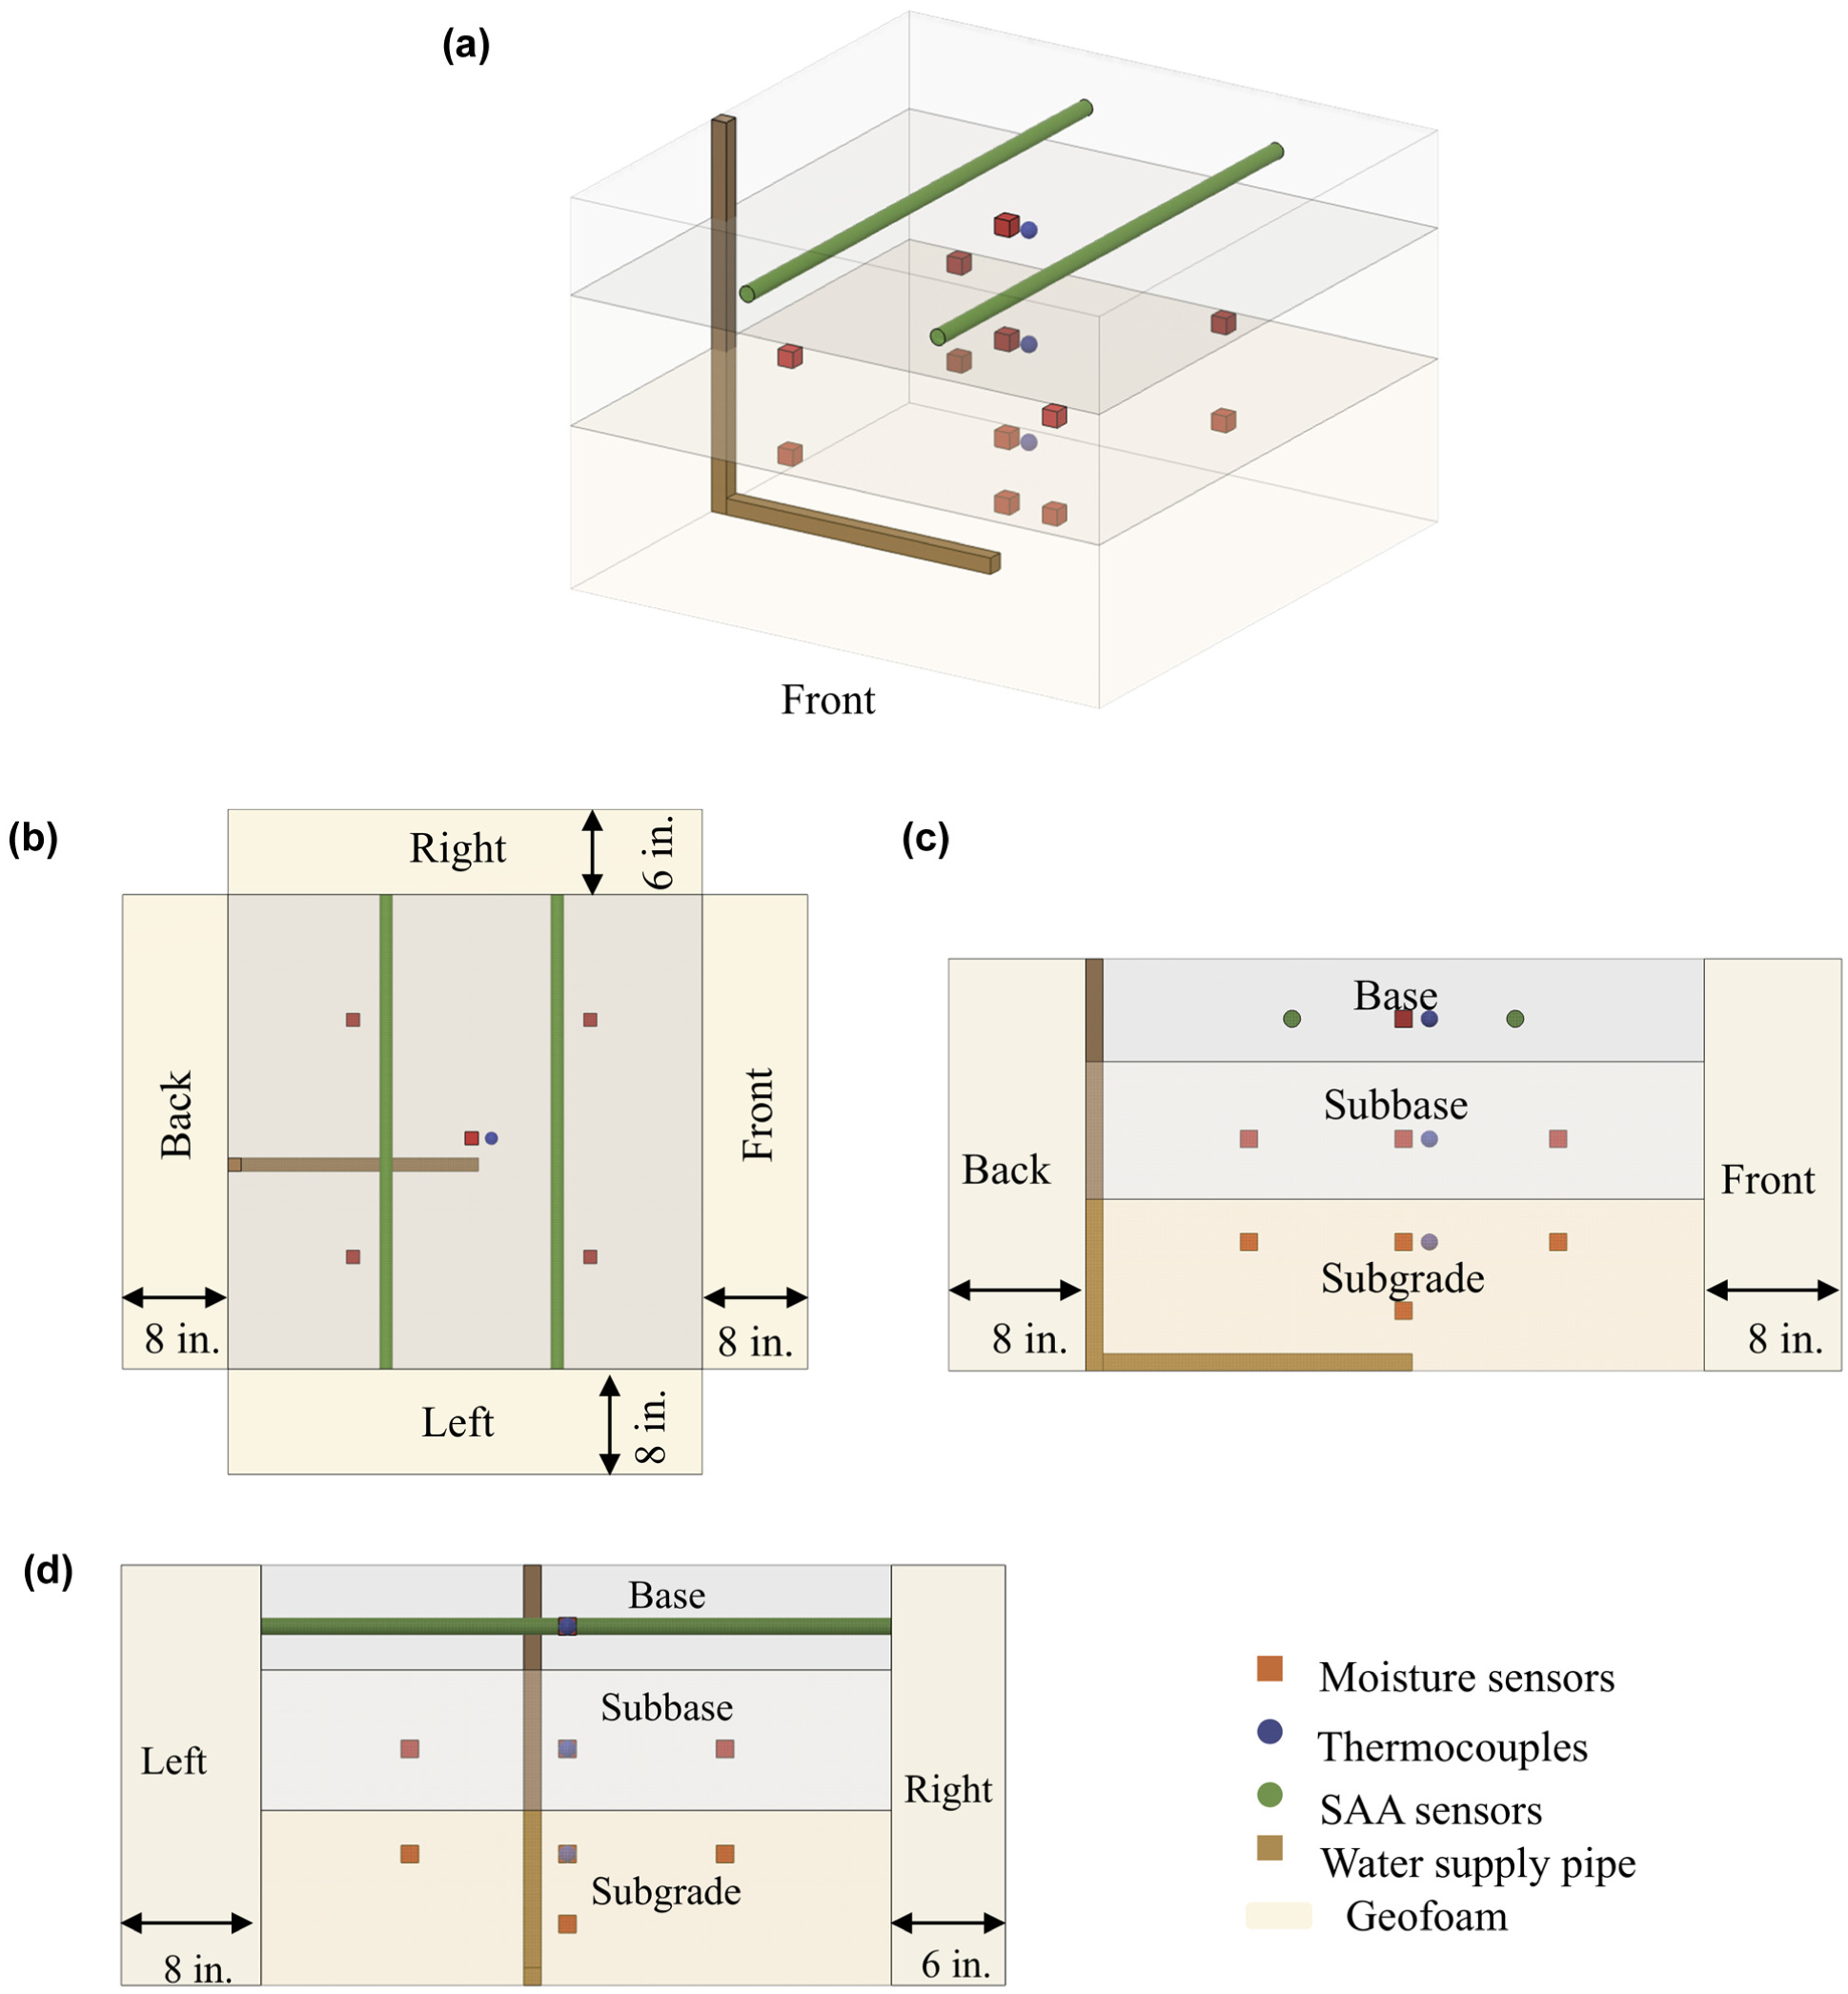
Schematic representation of control section: (a) isometric view, (b) top view, (c) side view, and (d) front view.
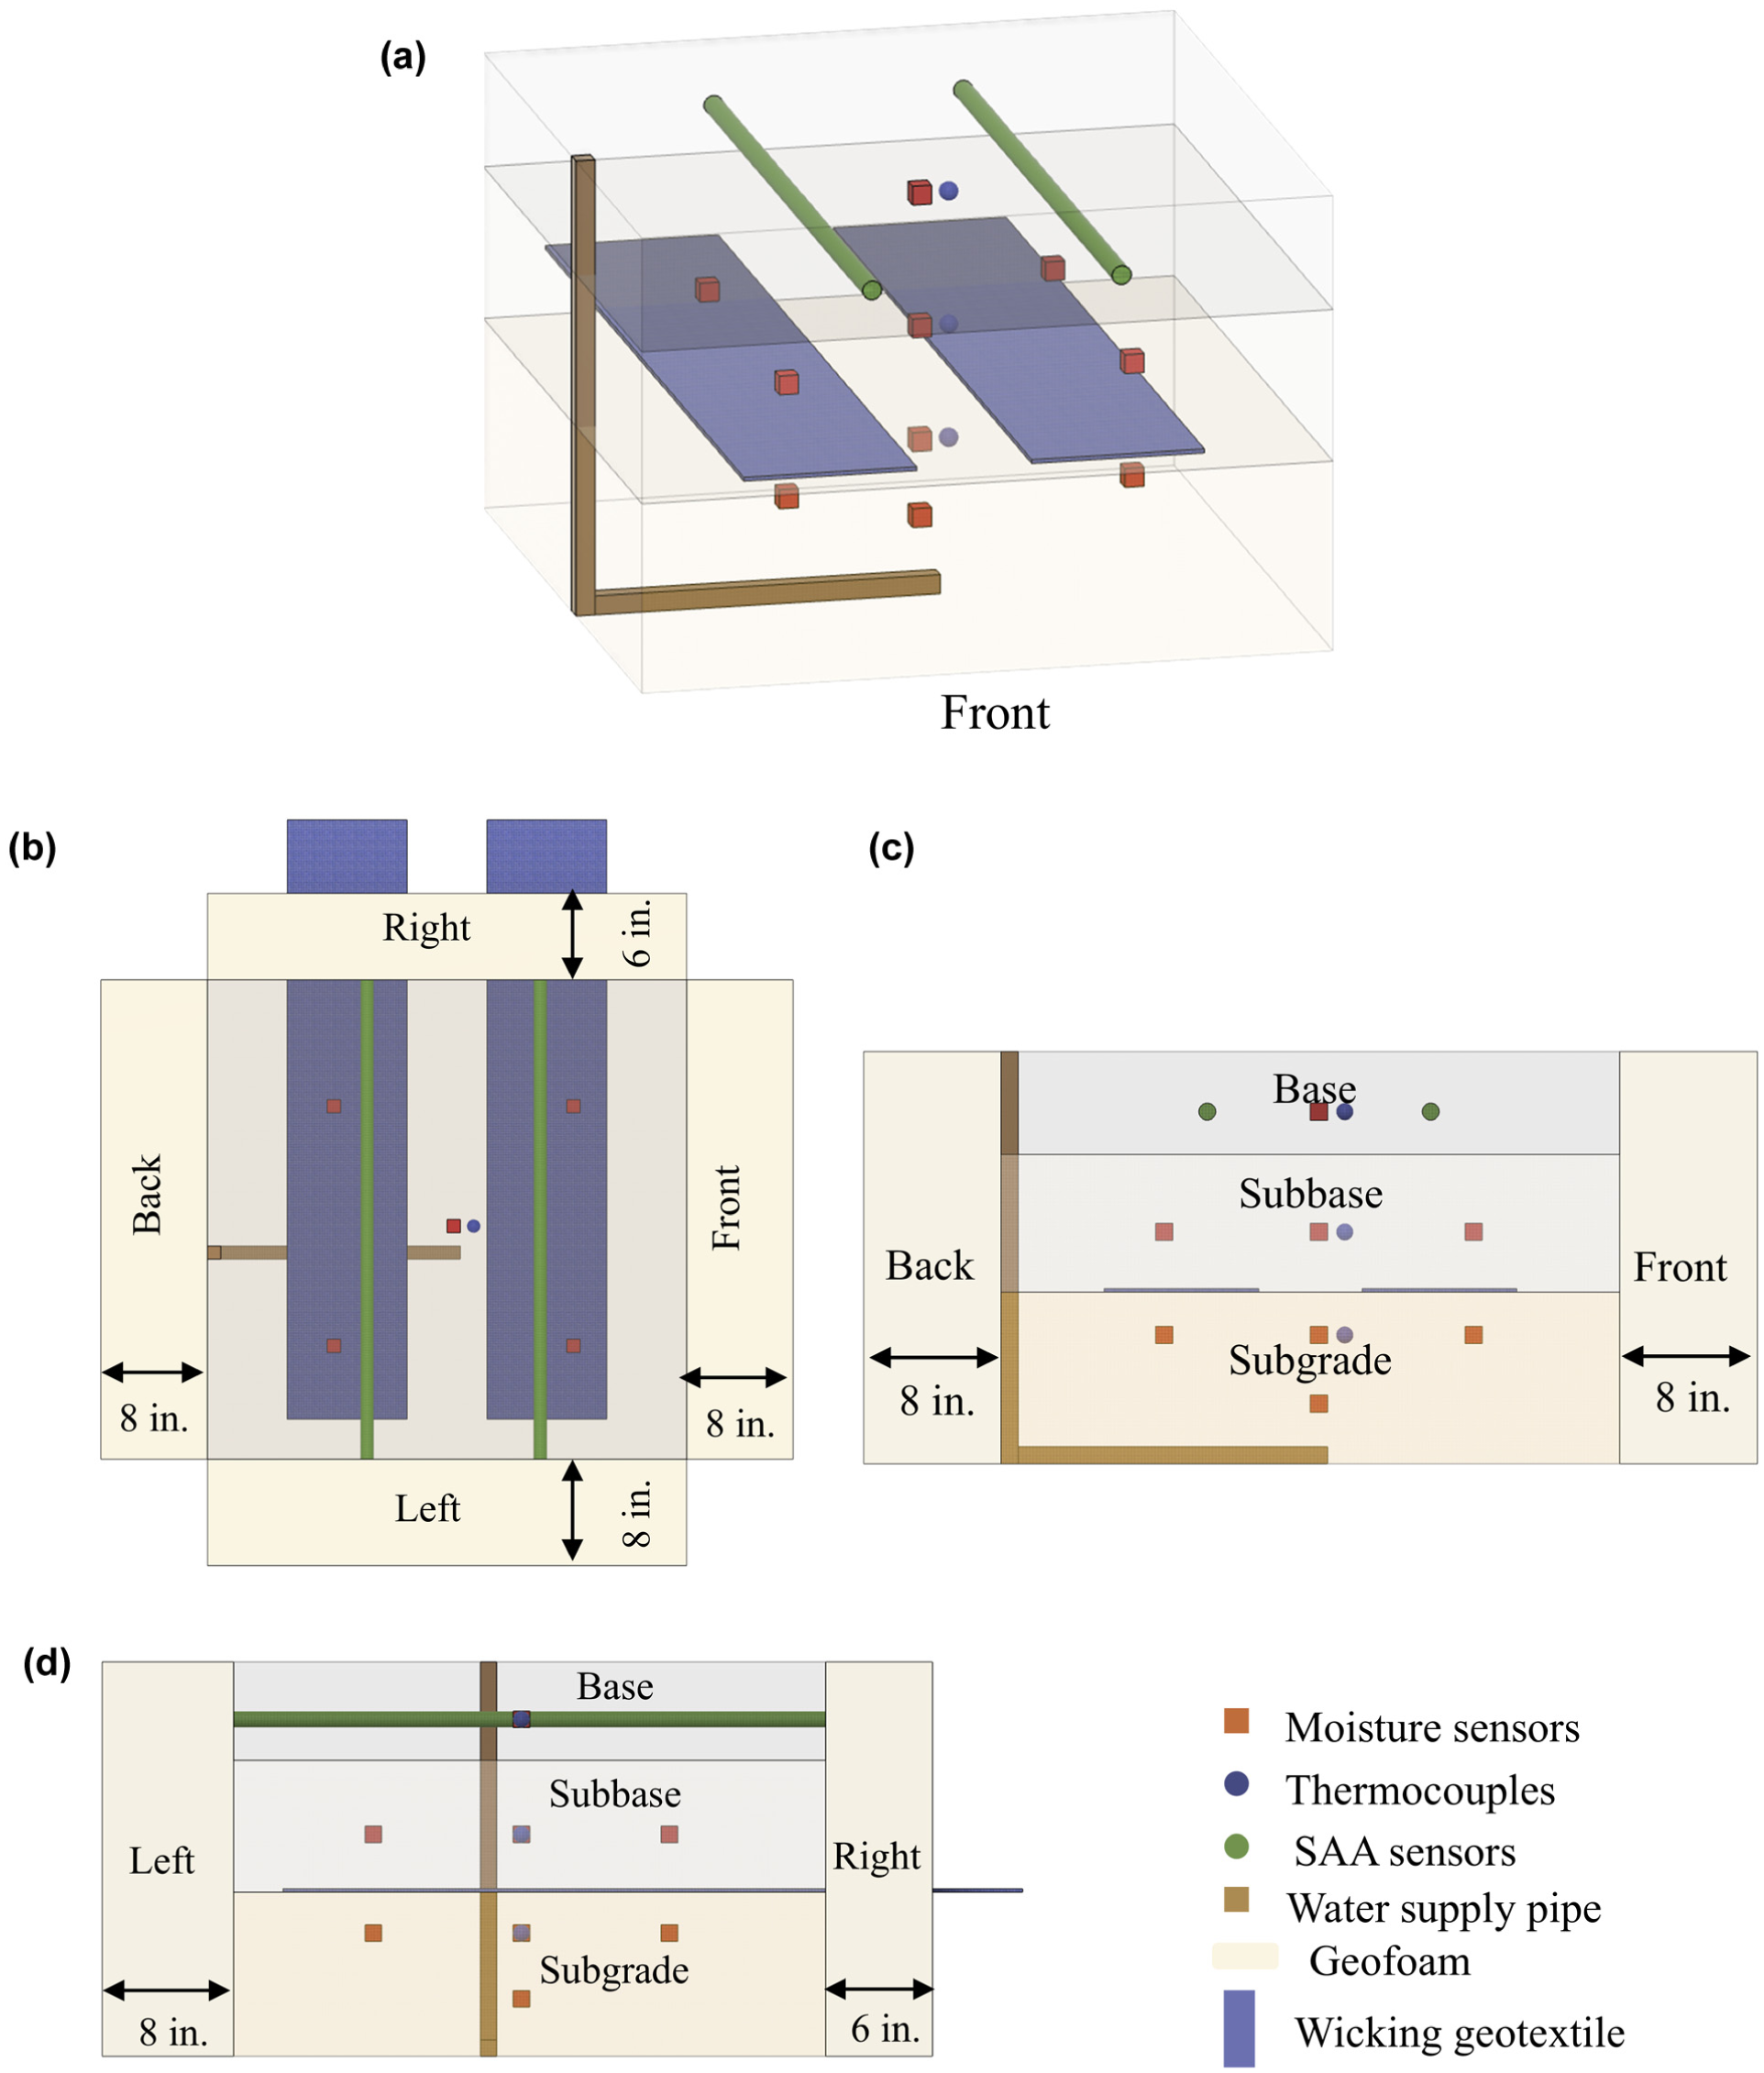
Schematic representation of reinforced section: (a) isometric view, (b) top view, (c) side view, and (d) front view.
This study aims to evaluate the drainage capability of wicking geotextile when subjected to distress under F–T conditions with readily available moisture from underneath. To replicate the water table, tests were carried out in an open water system with the help of a water supply pipe installed at the bottom, ensuring a continuous water supply with a constant head. The moisture sensors captured the VWC from the readily available water in the soil volume around the sensor. These sensors read a lower value when surrounded by ice instead of water, which helped identify the freezing phase at the installed depth. The variation in VWC is helpful in comparing the behavior of CS and RS. The test sections were also equipped with SAA sensors in the base layer to monitor any deformation. The wicking geotextile reinforcement was installed at the interface of the subgrade and subbase, that is, 254 mm (10 in.) from the bottom, for optimum performance. It was extended out of the box about 305 mm (12 in.) from the bottom to be exposed outside to the surrounding temperature and RH (Figure 4d). Also, the geotextile was placed in such a way that the edge of the geotextile had a 6 in. clearance from the face of the test box. This clearance was maintained to avoid any influence of the wall on the geotextile’s performance and to avoid an easy drainage path for moisture movement near the face of the box.
The constructed test sections with sensors were subjected to two F–T cycles—each cycle consisted of one freezing phase and one thawing phase. The freezing phase continued until the freezing front reached the subbase-subgrade interface, and the thawing phase was maintained for a time equal to that of the freezing phase to facilitate thawing and provide sufficient time for drainage. To simulate freezing conditions, the entire test setup was placed in a temperature-controlled environmental chamber maintained at −18°C (−0.4°F). For the thawing cycle, the setup was kept at a room temperature of about 27°C (80.6°F), and the top surface was covered to maintain similar conditions across the cycles. To simulate the temperature flow conditions from top to bottom, as in the field, the box was installed with 203 mm (8 in.) thick geofoams on all four faces and the bottom, exposing only the top face to the surrounding temperatures. As an additional layer of insulation against the surrounding temperature, the setup was also equipped with heating cables on the box faces to provide heat in the event of a drop in surrounding temperature.
Construction of Large-Box Test Setup
The steps involved in constructing the test setup are illustrated in Figure 5. A cubical box with 0.91 m (36 in.) dimensions was constructed with a cast iron frame and 12.7 mm (0.5 in.) thick polycarbonate sheets for the box faces. The faces of the box consisted of polycarbonate sheets with front, back, and bottom faces fixed with 0.91 x 0.91 m (3 x 3 ft) (Figure 5a), and sides were installed with two 0.3 m (1 ft) panels. The right-side top panel was modified to accommodate the deformation sensors by cutting two apertures of 25.4 mm (1 in.) diameter, at 76.2 mm (3 in.) from the top edge of the box and 508 mm (20 in.) from the bottom of the box. The elevation of these apertures was selected so that the sensors could pass through the base layer to capture any deformation caused by the ice formation. The panels were glued with acrylic glue, and the inner edges of the box were waterproofed with silicon sealant. As an additional layer of safety for waterproofing, a geomembrane was installed to a height of 0.61 m (2 ft) from the bottom (Figure 5b).
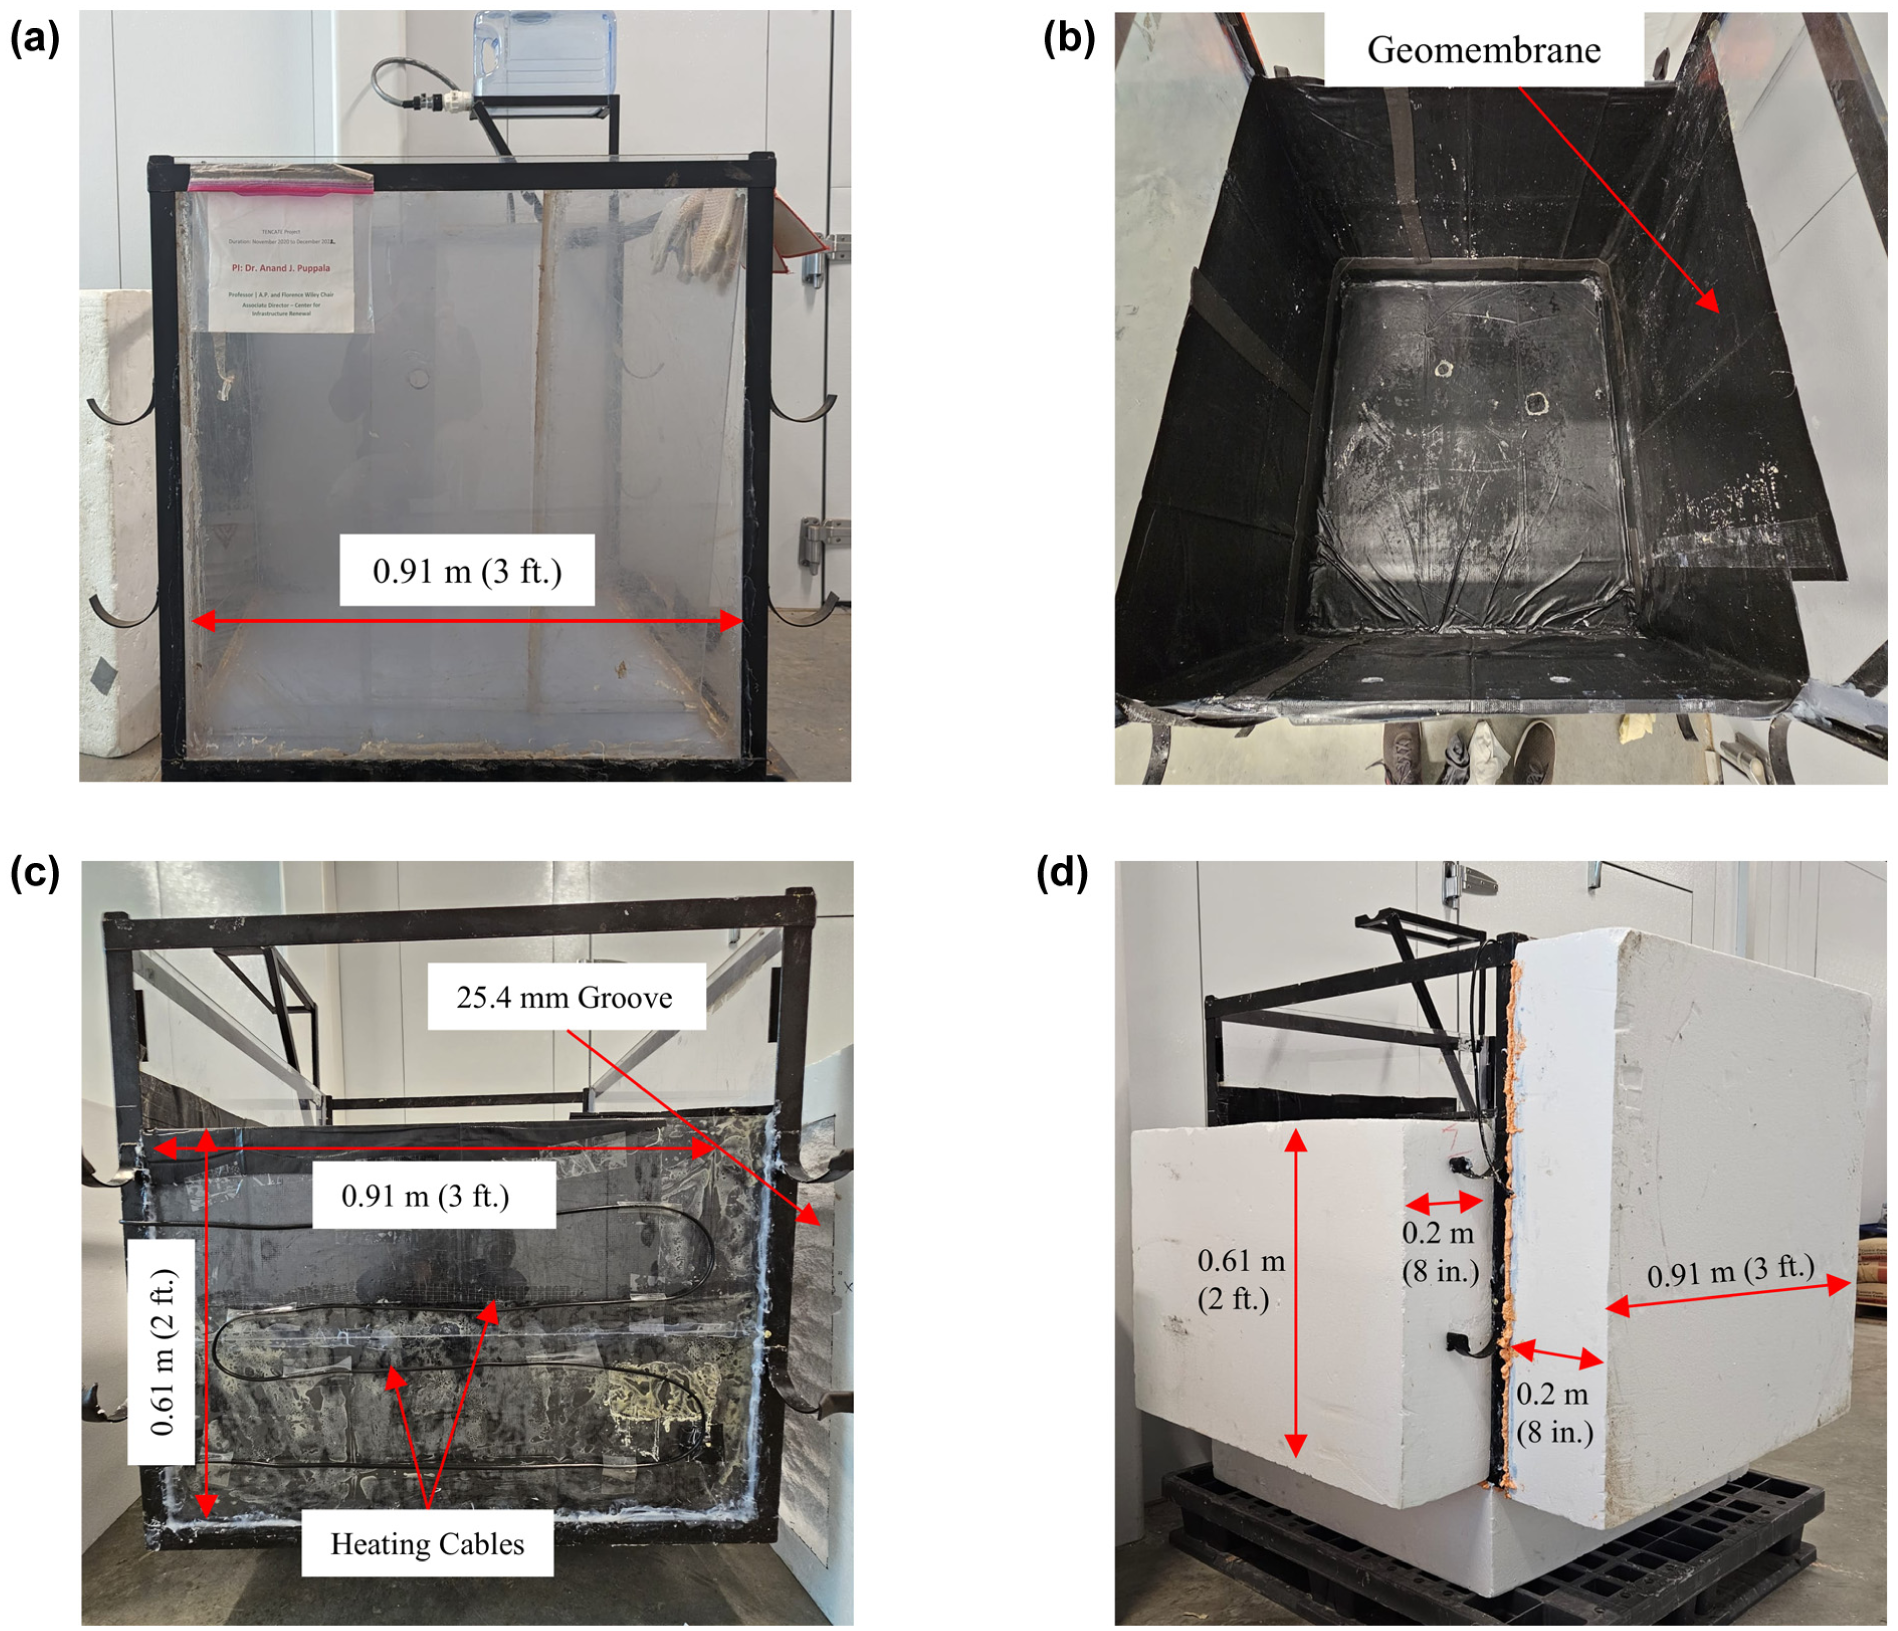
Steps involved in box preparation: (a) box frame with polycarbonate panels, (b) waterproofing box with geomembrane, (c) heating cables surrounding the box, and (d) box with insulating geofoams.
After preparing the interior of the box setup, heating cables were installed on the outside faces to maintain a surrounding temperature of 4°C (39.2°F) and prevent freezing flow from the sides (Figure 5c). These heating cables were connected to a controller equipped with a sensor that activated them as the temperature fell below the desired level. Geofoams were installed on all sides over the heating cables to restrict the temperature flow from the sides (Figure 5d). To ensure the heat from the heating cable circulates inside the geofoam, 25.4 mm (1 in.) grooves were made on the inside face of each geofoam. The edges of the geofoams were sealed with foam insulation to ensure no additional gaps for the air to propagate.
Figure 6 shows the steps involved in the preparation of test sections. A water supply pipe with a flow-controlling valve was installed to ensure a continuous water supply from the bottom of the test section, passing along the back face at the center of the bottom face. The exit of this pipe was tightly covered with a non-woven geotextile to prevent any clogging in the pipe (Figure 6a). The water supply pipe was also equipped with a heating cable to throughout its length to prevent water from freezing during the freezing cycle. The exposed part of the pipe was covered with foam insulation along with the heating cable (Figure 6b).
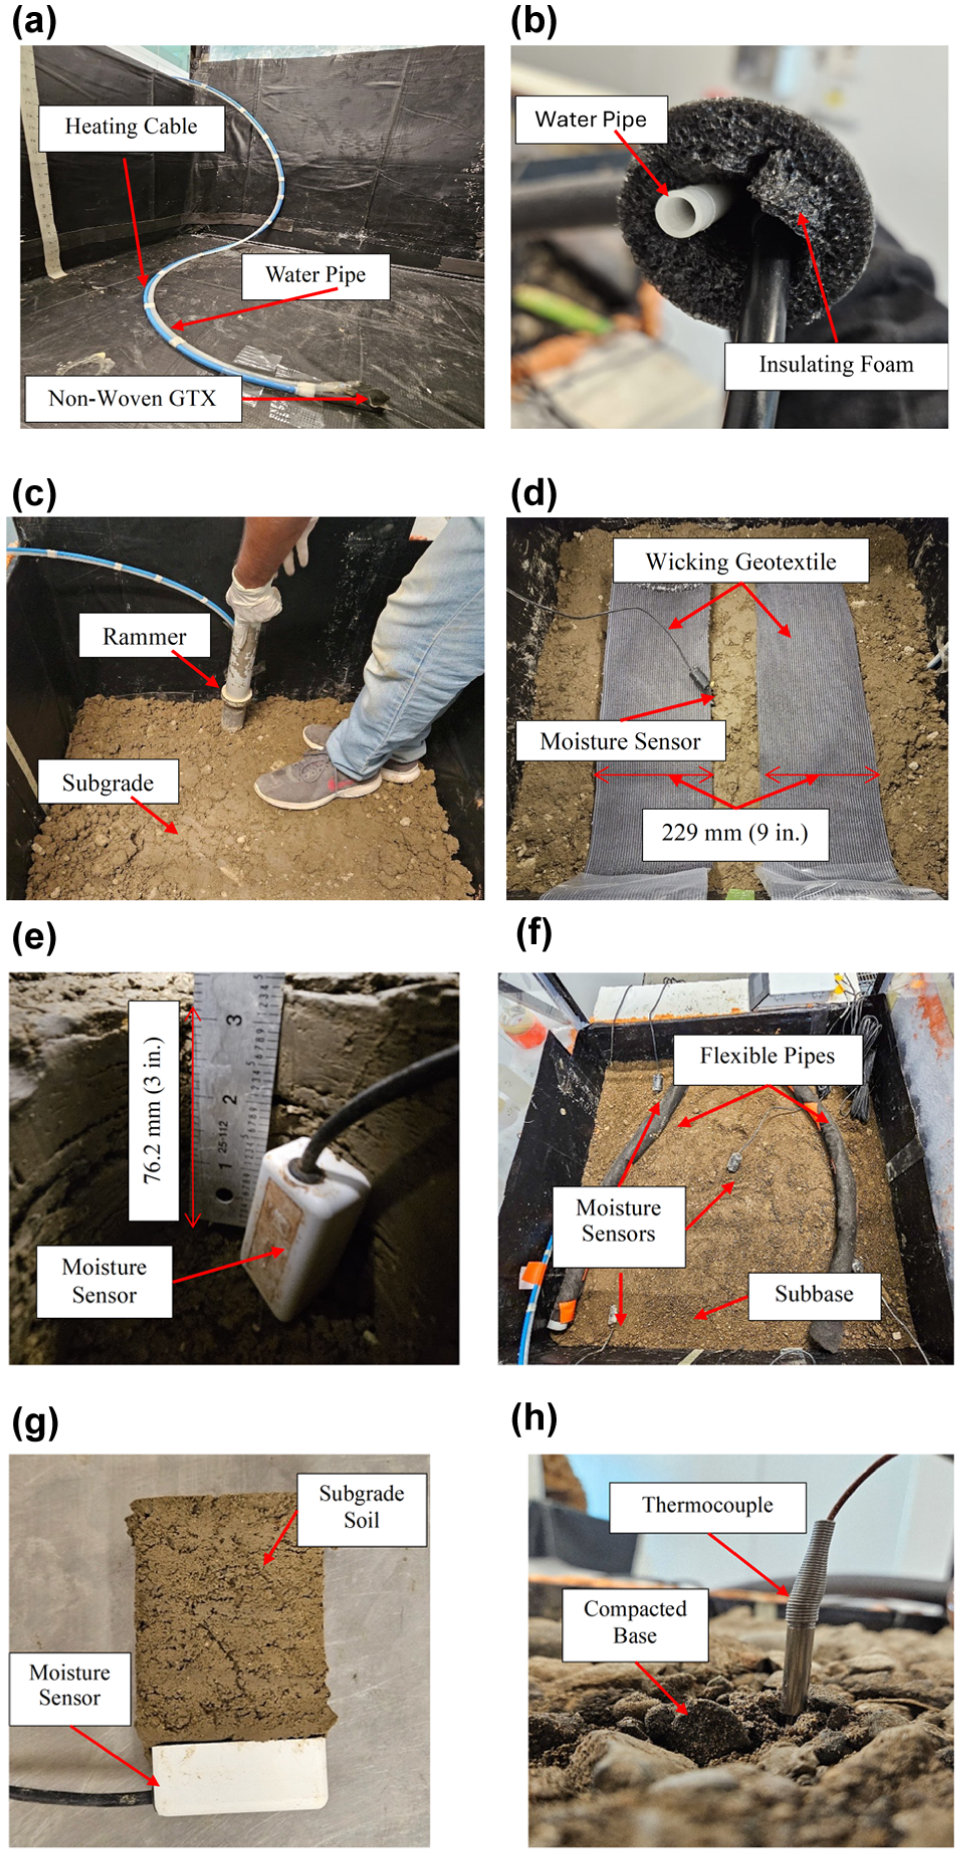
Steps involved in the construction of test setup: (a) water supply pipe with heating cable, (b) external insulation for water pipe, (c) subgrade layer compaction, (d) installation of wicking geotextile at the interface, (e) moisture sensor 72.6 mm (3 in.) below the interface, (f) compacted subbase layer, (g) moisture sensor preparation for subbase, and (h) compacted base with thermocouple.
The test sections consisted of three layers and were constructed layer-wise to their respective targeted densities. The subgrade soil was air-dried for 48 h, and large chunks were manually crushed with a mallet and mixed with water at OMC. The base and subbase soils were similarly dried and mixed with water. After mixing, the soils were compacted to a density of 90% maximum dry unit weight with a standard proctor rammer to attain uniform compaction across the test sections (Figure 6c). In the RS, in addition to the above procedure, two 229 mm (9 in.) wide strips of wicking geotextile were installed after the compaction of the subgrade (Figure 6d). For an effective performance of the wicking geotextile, the strips were placed at the interface at height of 254 mm (10 in.) and raised to a height of 305 mm (12 in.) from the bottom, and were extended out to expose the end portion ( 7 ).
To monitor the temperature flow and moisture variation in the test sections, each soil layer was equipped with thermocouples and moisture sensors (Figures 3 and 4). The subgrade was installed with six moisture sensors, five at a depth of 76.2 mm (3 in.) from the subbase interface and one at 76.2 mm (3 in.) from the bottom of the layer to monitor the water inflow. The moisture sensors in the subgrade were installed after the compaction by making a small hole at the targeted location and depth. The five sensors in the subbase layer were placed 76.2 mm (3 in.) from the subgrade interface. Unlike the subgrade sensors, the sensors in the subbase were inserted into an externally compacted subgrade material to ensure proper contact and were installed into the subbase layer in the box at the prefixed locations ( 25 ). The sensor in the base layer was inserted by replacing a small portion of the base at a depth of 76.2 mm (3 in.) from the top with fine subbase material to ensure complete contact. After compacting the base layer, the SAA deformation sensors were placed in position through prefixed plastic pipes (Figure 6f).
In the CS, a thermocouple was installed in the base layer at the same depth as the moisture sensor to monitor the temperature variation (Figure 6g). The RS was equipped with three thermocouples in the three layers, each near the center moisture sensor of its respective layer.
Figure 7a shows the temperature-controlled environmental chamber at the Center for Infrastructural Renewal at Texas A&M University that was used for this study. The environmental chamber is constantly maintained at −18°C (−0.4°F) throughout the study. Figure 7, b–e, displays the CS and RS test setups placed in F–T conditions, equipped with all the sensors and data acquisition systems.
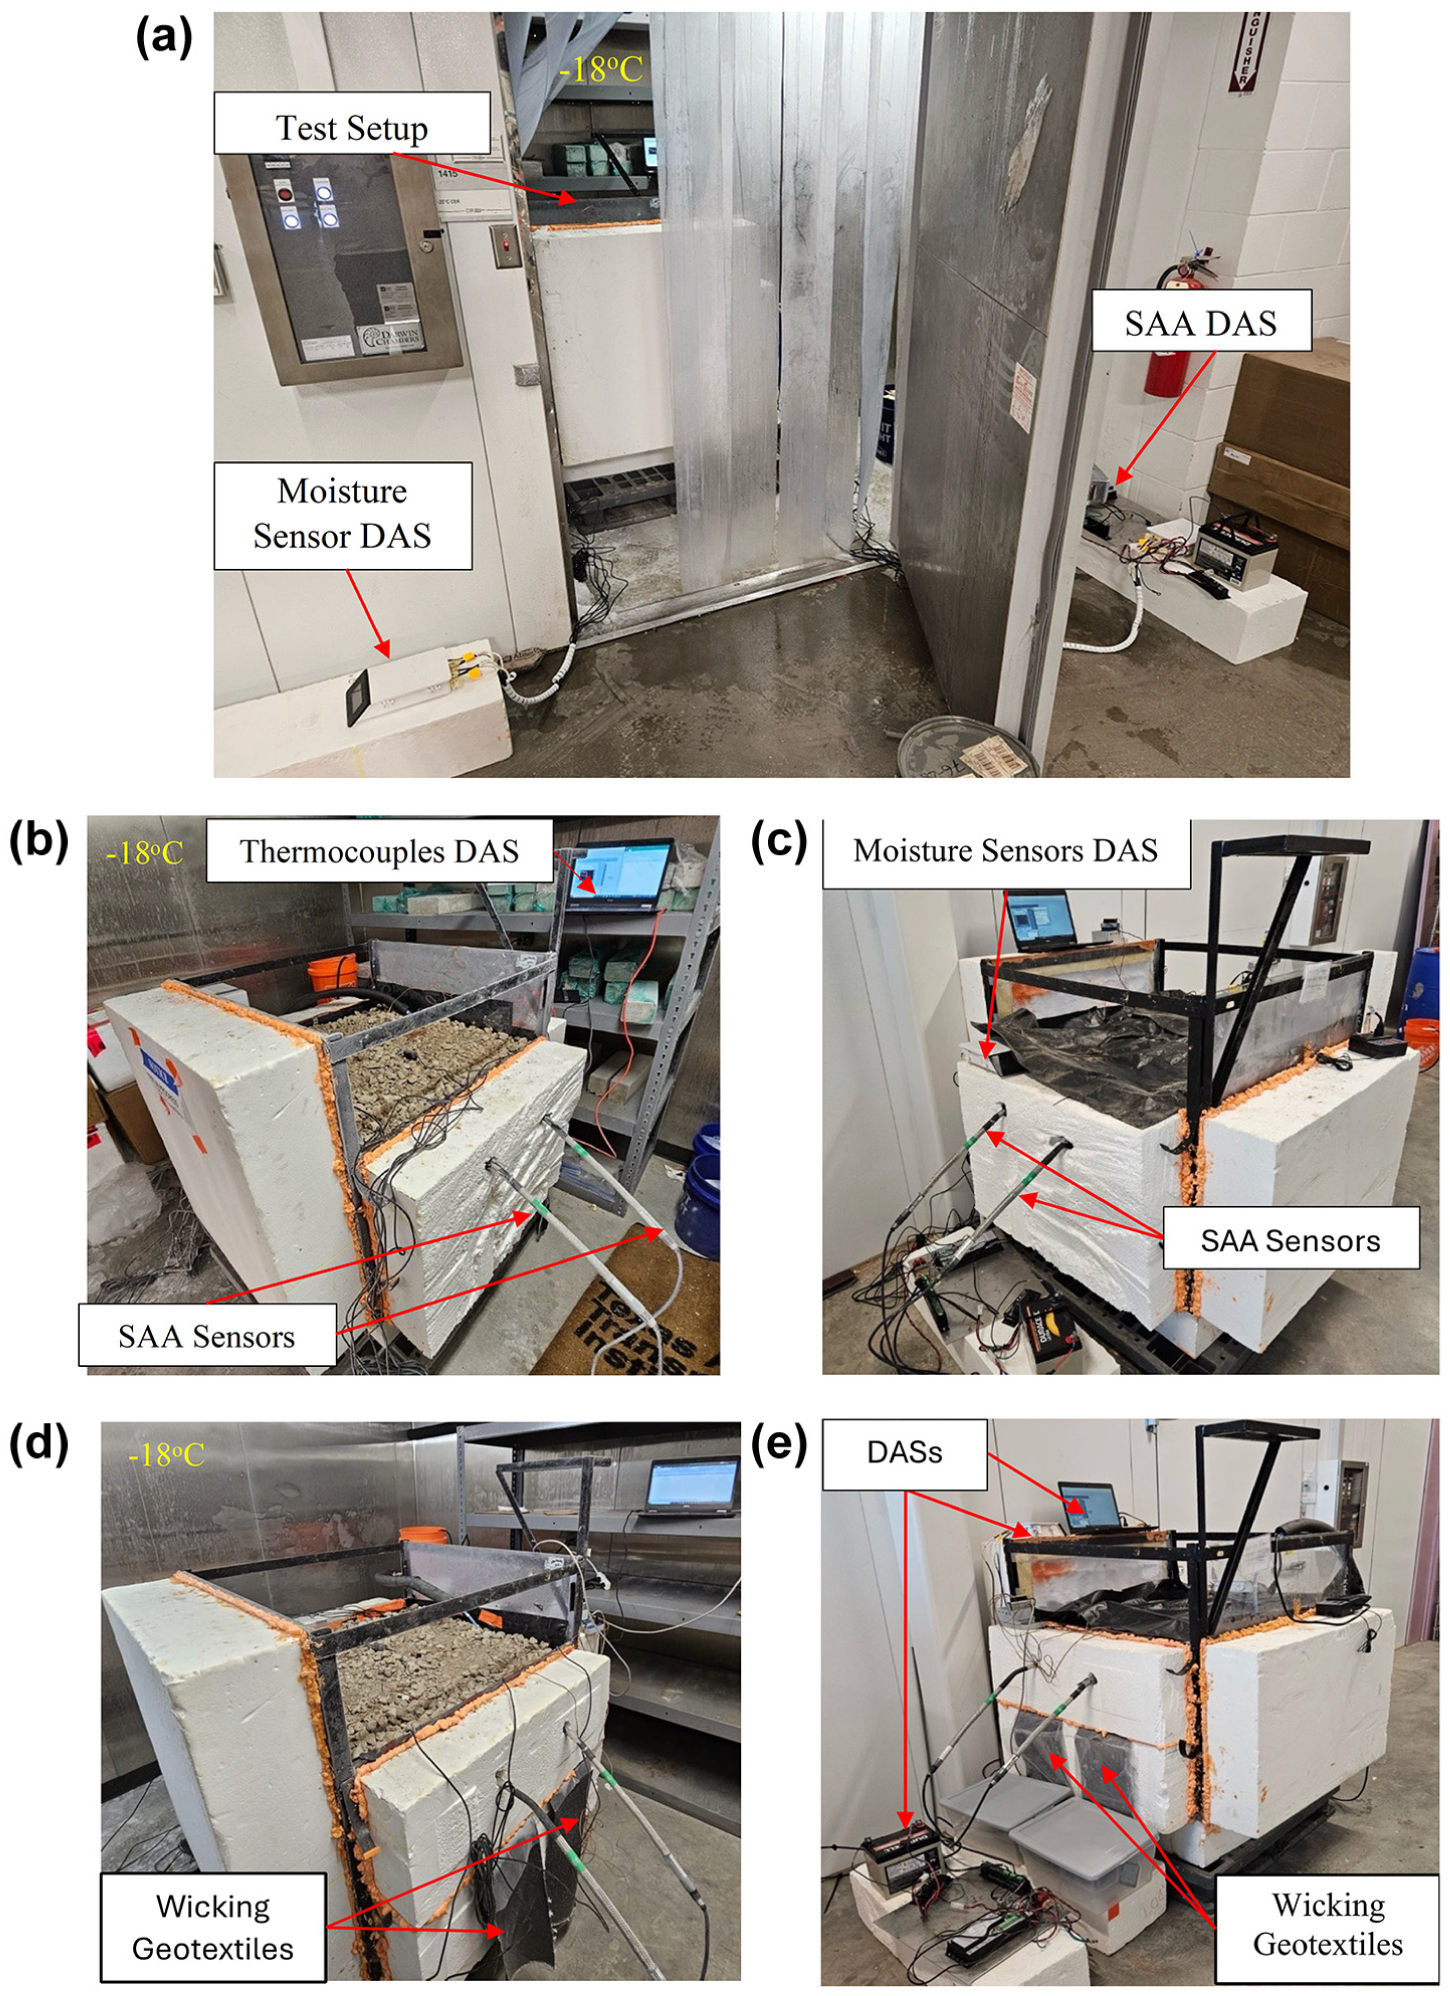
Test setup: (a) freezing chamber, (b) control section (CS) setup in freezing chamber, (c) CS setup in thawing condition, (d) reinforced section (RS) setup in freezing chamber, and (e) RS setup in thawing condition.
Quality Control
To ensure uniform soil compaction across both test sections during construction, samples were collected to determine the density of each layer. Figure 8 compares the average calculated densities from four samples at each layer for the CS and RS to the targeted density. The base and subgrade layers show slight deviations in both sections, each less than 0.7%, and the values are close to the targeted densities in both cases. However, both sections in the subbase layer show deviations of more than 1% from the targeted density but exhibit less than 0.2% deviation from each other, indicating a similar level of compaction in both cases.
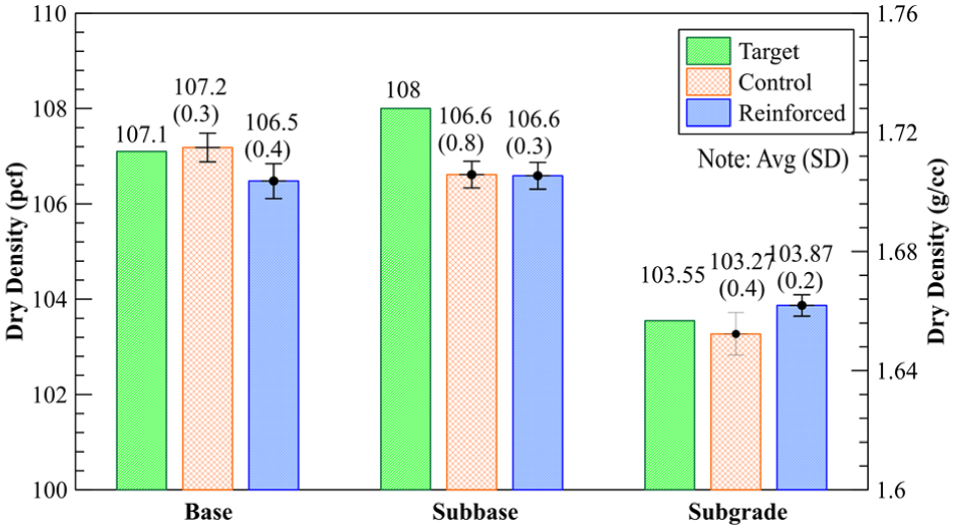
Average calculated densities for control section and reinforced section.
Results and Discussions
Analysis of Cyclic Temperature Conditions
The F–T testing was conducted under controlled environmental conditions and monitored for about 49 days (1,176 h), with varying durations for each F–T phase. During the freezing phase, the test setup was placed in a room at a temperature of −18°C (−0.4°F) with the top surface exposed. However, during the thawing phase, the setup was placed at room temperature, about 27°C (80.6°F), and the surface was covered with a geomembrane to provide consistent surface temperature conditions across various thawing phases, regardless of room temperature. Figure 9 illustrates the temperature variation of both test sections with time, including the phase changes. The temperature variation in the soil layer with changes in surrounding conditions in both test sections followed a similar trend, with slight differences in the temperature values. At the start of the freezing cycle, the soil temperature drops steadily and stabilizes gradually after falling below a freezing temperature. However, during the thawing cycles, the temperature increased gradually throughout the phase. Figure 10 shows the variation in surficial temperature and RH during the thawing phase. Although the temperature and RH were slightly higher in the CS, the trend and rate of increase were similar, indicating that the test sections experienced similar conditions during the thawing cycles. In the CS, the second freezing cycle was longer than the first. This trend was observed because the ice formation during the first freezing cycle created pore openings, slowing the propagation of temperature through the gaps. In the RS, unlike in the CS, both freezing cycles were nearly the same duration. This was assumed to happen because of less pore opening resulting from the action of the wicking geotextile in reducing the readily available moisture.
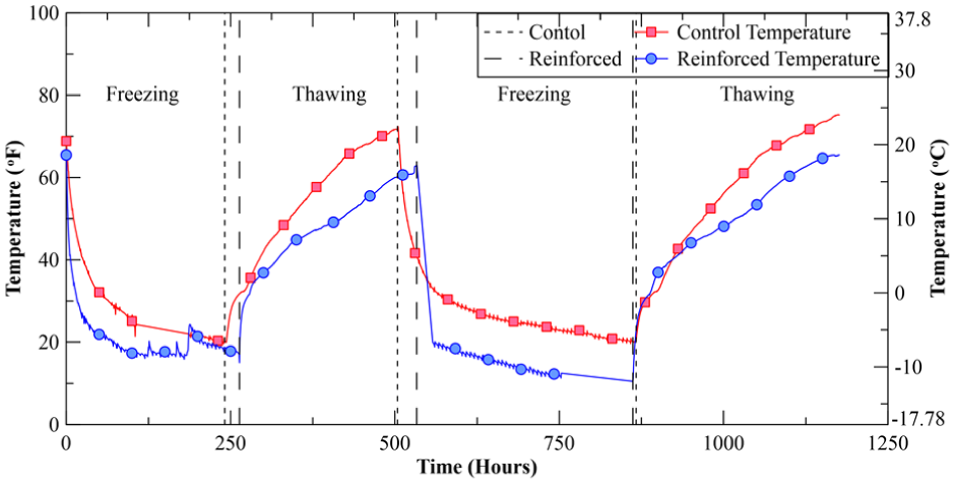
Soil temperature variation in control section and reinforced section.
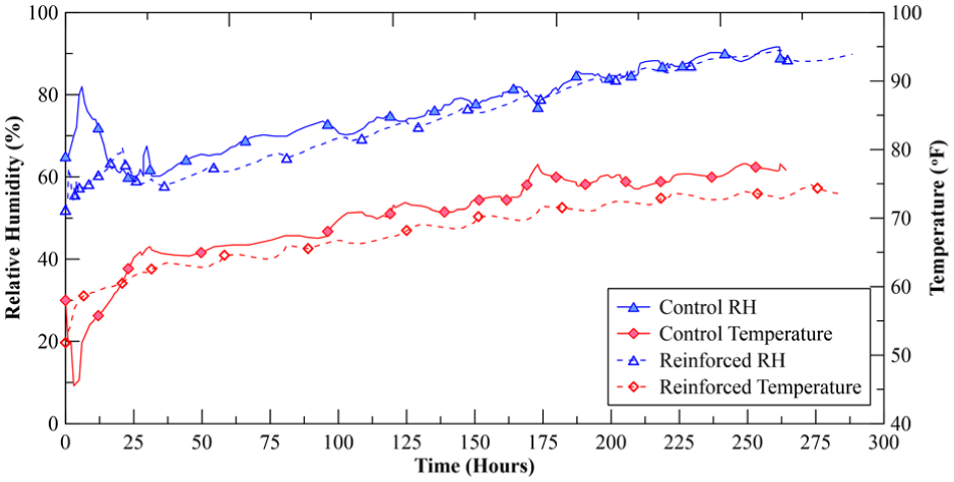
Surface temperature and relative humidity (RH) variation in thawing.
Figure 11 shows layer-wise variation in the temperature across all phases in the RS. It was observed that the base layer responds immediately to changes in surrounding temperature in all phases. The temperature was subsequently changed in the subbase, followed by the subgrade. This indicates that the temperature changes (i.e., freezing and thawing) propagated from the top to bottom as intended to simulate the field conditions.
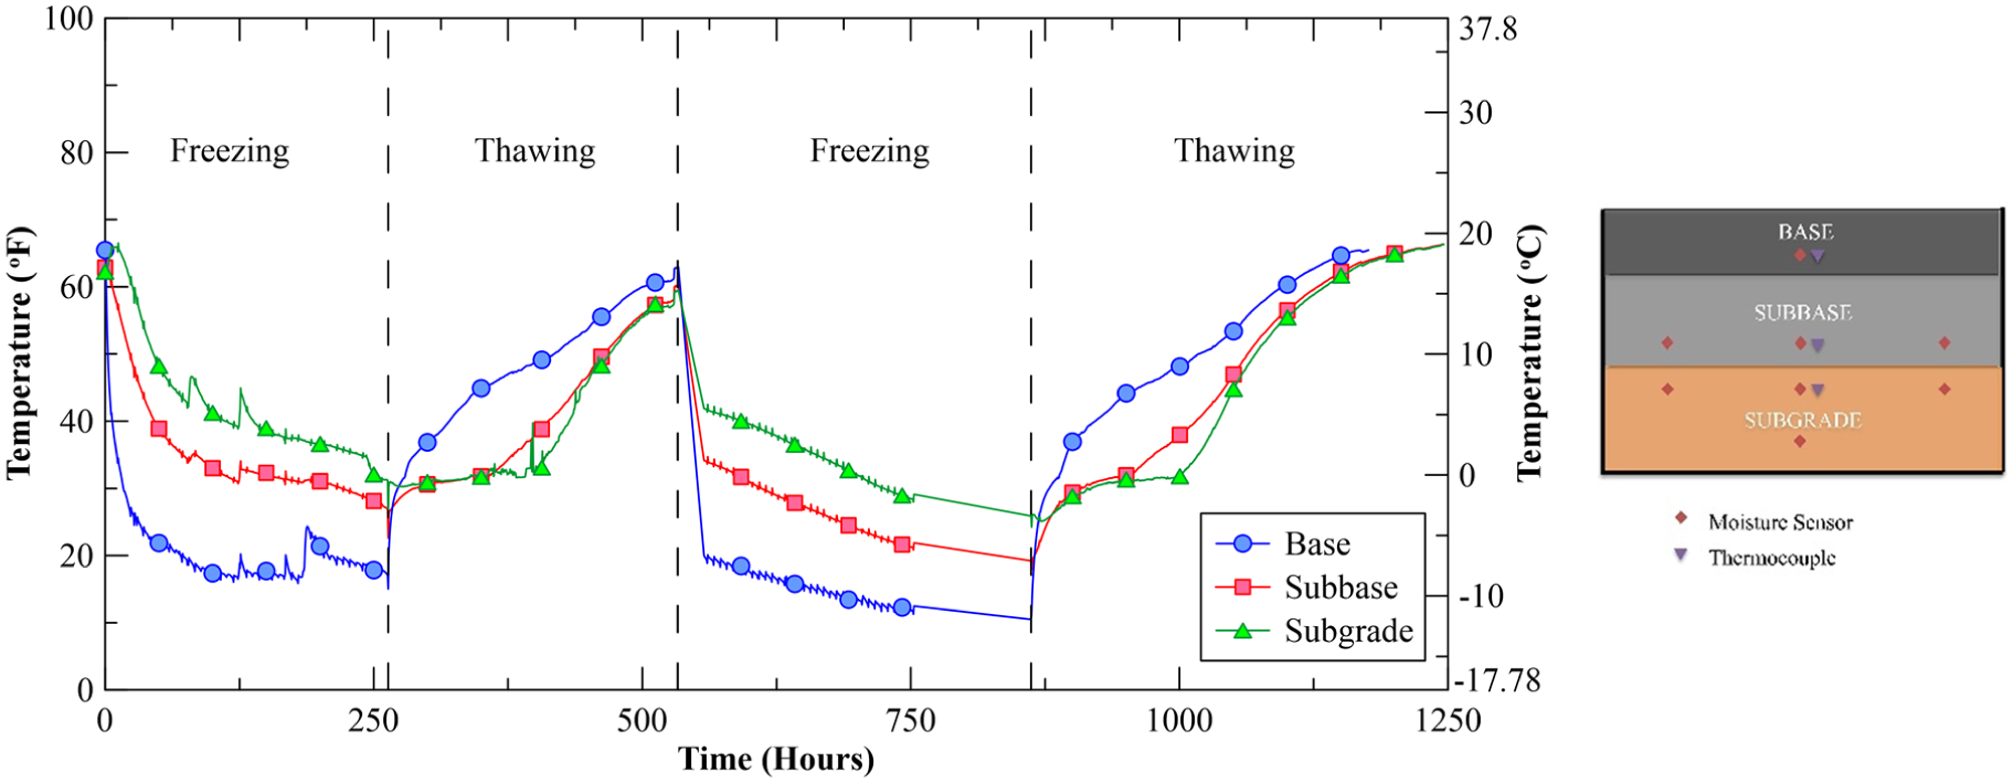
Layer-wise temperature variation in the reinforced section.
A temperature sensor was placed between the box’s polycarbonate face and the surrounding geofoam to monitor the surrounding temperature and verify the effectiveness of the geofoam insulation and heating cables. The heating cables were connected to a control device set to activate when the temperature dropped below 4°C (39.2°F). Figure 12 depicts the variation in the surrounding temperature of the box faces over time. Initially, it shows a gradual drop in temperature, then maintains a steady temperature of 4°C (39.2°F), the set condition for the surrounding temperature propagation. The surrounding temperature propagation demonstrates that installing geofoams effectively insulated the test setup from surrounding freezing conditions for a longer duration, and surrounding heating cables helped maintain a steady temperature after the freezing propagated through the geofoams. This satisfied the aim of simulating field conditions to prevent temperature propagation from side faces.
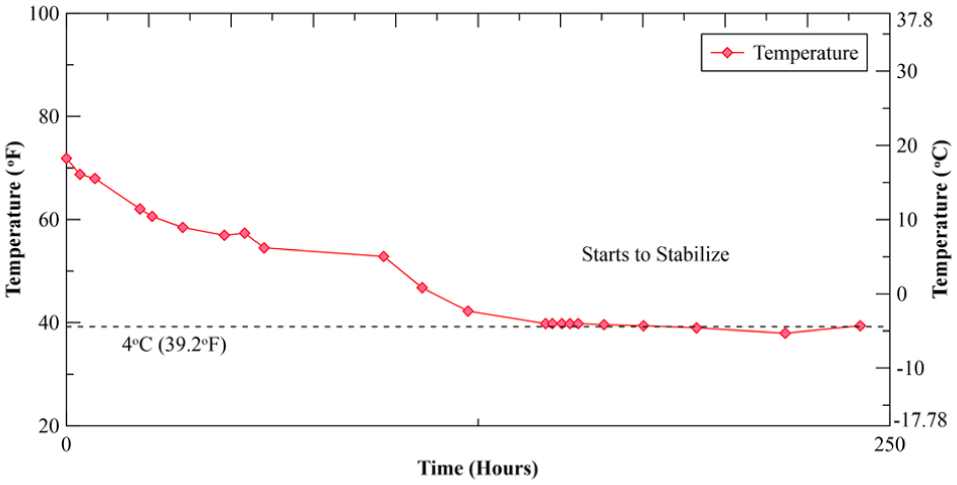
Surrounding temperature profile.
Cyclic Moisture Migration Analysis in Pavement Layers
The moisture profiles of each layer were obtained using multiple moisture sensors installed at various locations in each pavement layer. The moisture sensors measure the VWC by determining the soil’s dielectric constant. Depending on material properties, the VWC at dry and saturated conditions varies across geomaterials. For the materials used in this study, saturated VWC values ranged from 40%–45% for the subgrade, 35%–40% for the subbase, and 25%–30% for the base materials. When ice formed, because of a lack of readily available water, the VWC reading approached a minimum and asymptotes to the x-axis over time. Three of the 12 installed moisture sensors malfunctioned in the RS; therefore, the analysis for the RS was based on moisture data from nine sensors.
The water inflow to the test sections was continuously monitored and controlled using a graduated reservoir with an 11 in. diameter to ensure accurate flow rates throughout the experiment. Since the reservoir’s cross-sectional area was known, changes in water level could be used directly to determine the volume of water. The water level drop (h) in each cycle was monitored, and the corresponding inflow volume was calculated as 95.03 × h (in. 3 ). From the monitored data, an 8 L excess inflow was observed in cycle 1 of the RS, and this additional inflow was compensated for in the second cycle by reducing the water supply in the RS. Figure 13 compares the water inflow through the supply pipe for each test cycle in both test sections. RS was supplied with nearly 17 L instead of 23 L as in CS during the second cycle. However, toward the end, the water inflow was similar, with a slightly higher value in RS.
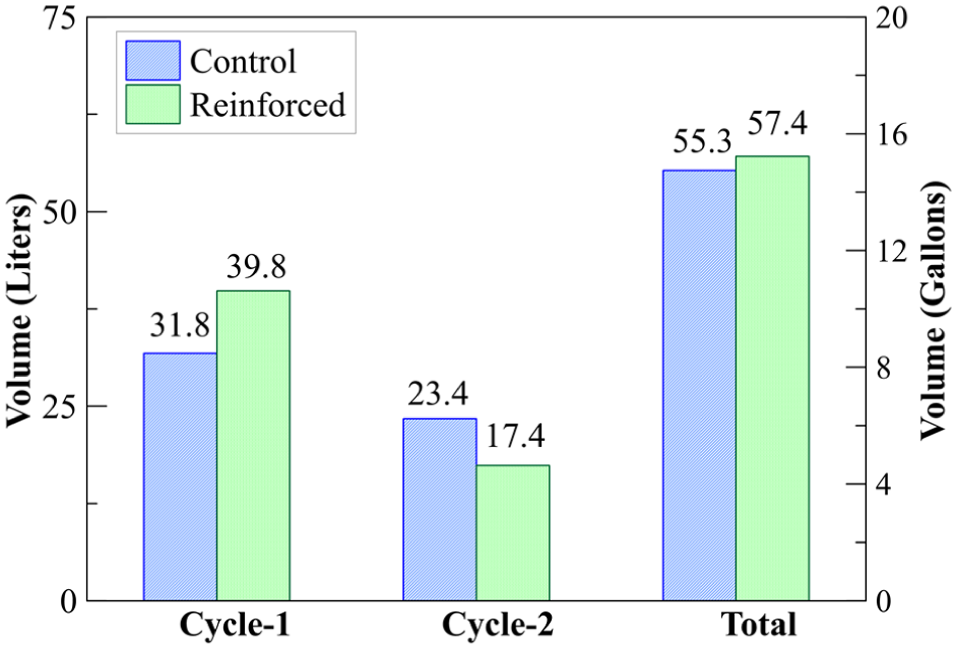
Cyclic cumulative water inflow in test setup.
Figure 14 shows the VWC variation in the base layer for CS and RS. The moisture profile showed a pattern similar to that of temperature, with initial conditions changing immediately and gradually stabilizing. As the base layer reached freezing temperature, the VWC became asymptotic to the x-axis, indicating ice formation at that stage. A similar trend of increased VWC was observed in both test sections after each freezing phase, compared with the initial VWC value. This increase in VWC was caused by moisture condensing on the open top face of the temperature-controlled environmental chamber during the thawing phase. The RS section shows a slightly higher VWC at the end of the test because of the higher moisture at the compaction at the start of the test. However, the trend in VWC change was similar in both cases, as the geotextile was not expected to have any influence at the base layer level.
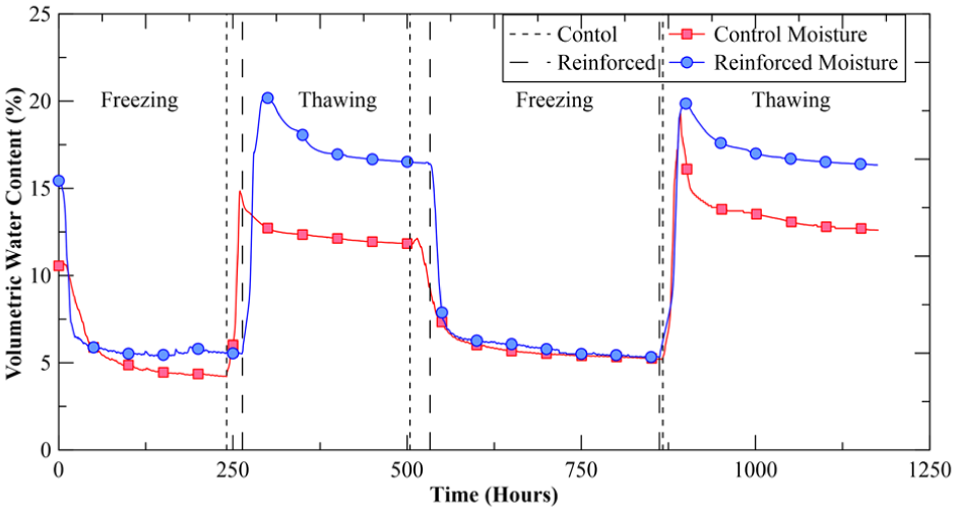
Comparative moisture variation in base.
Figure 15 shows the VWC variation for all the sensors installed in the subbase layer for the CS and RS. In the CS, it was observed that the front sensors froze faster, followed by the middle and back sensors, in both freezing cycles. This was because of the influence of the heating element installed with a water supply pipe at the back face. Although the front sensor froze quickly in the RS, a slight deviation from this pattern was observed; the right sensor in the back froze before the front sensor. This change in pattern was because of a slight leftward inclination of the heating element near the subbase layer. The VWC for both test sections was observed to be similar to the initial value at the end of the first cycle, with no intrusion of the water table into the subbase layer. However, moisture redistribution was observed in the second cycle for the CS, with the VWC of the front sensors increasing, indicating higher moisture in the front section and lower moisture in the rest of the sensors. This moisture redistribution was attributed to the pattern in which the front sensors froze faster than the back sensors. Ice formation generates cryogenic suction, disrupting moisture distribution. In contrast, the moisture content at the end of the test in the RS was nearly uniform because of the wicking geotextile, which redistributes moisture and maintains uniformity in the layer.
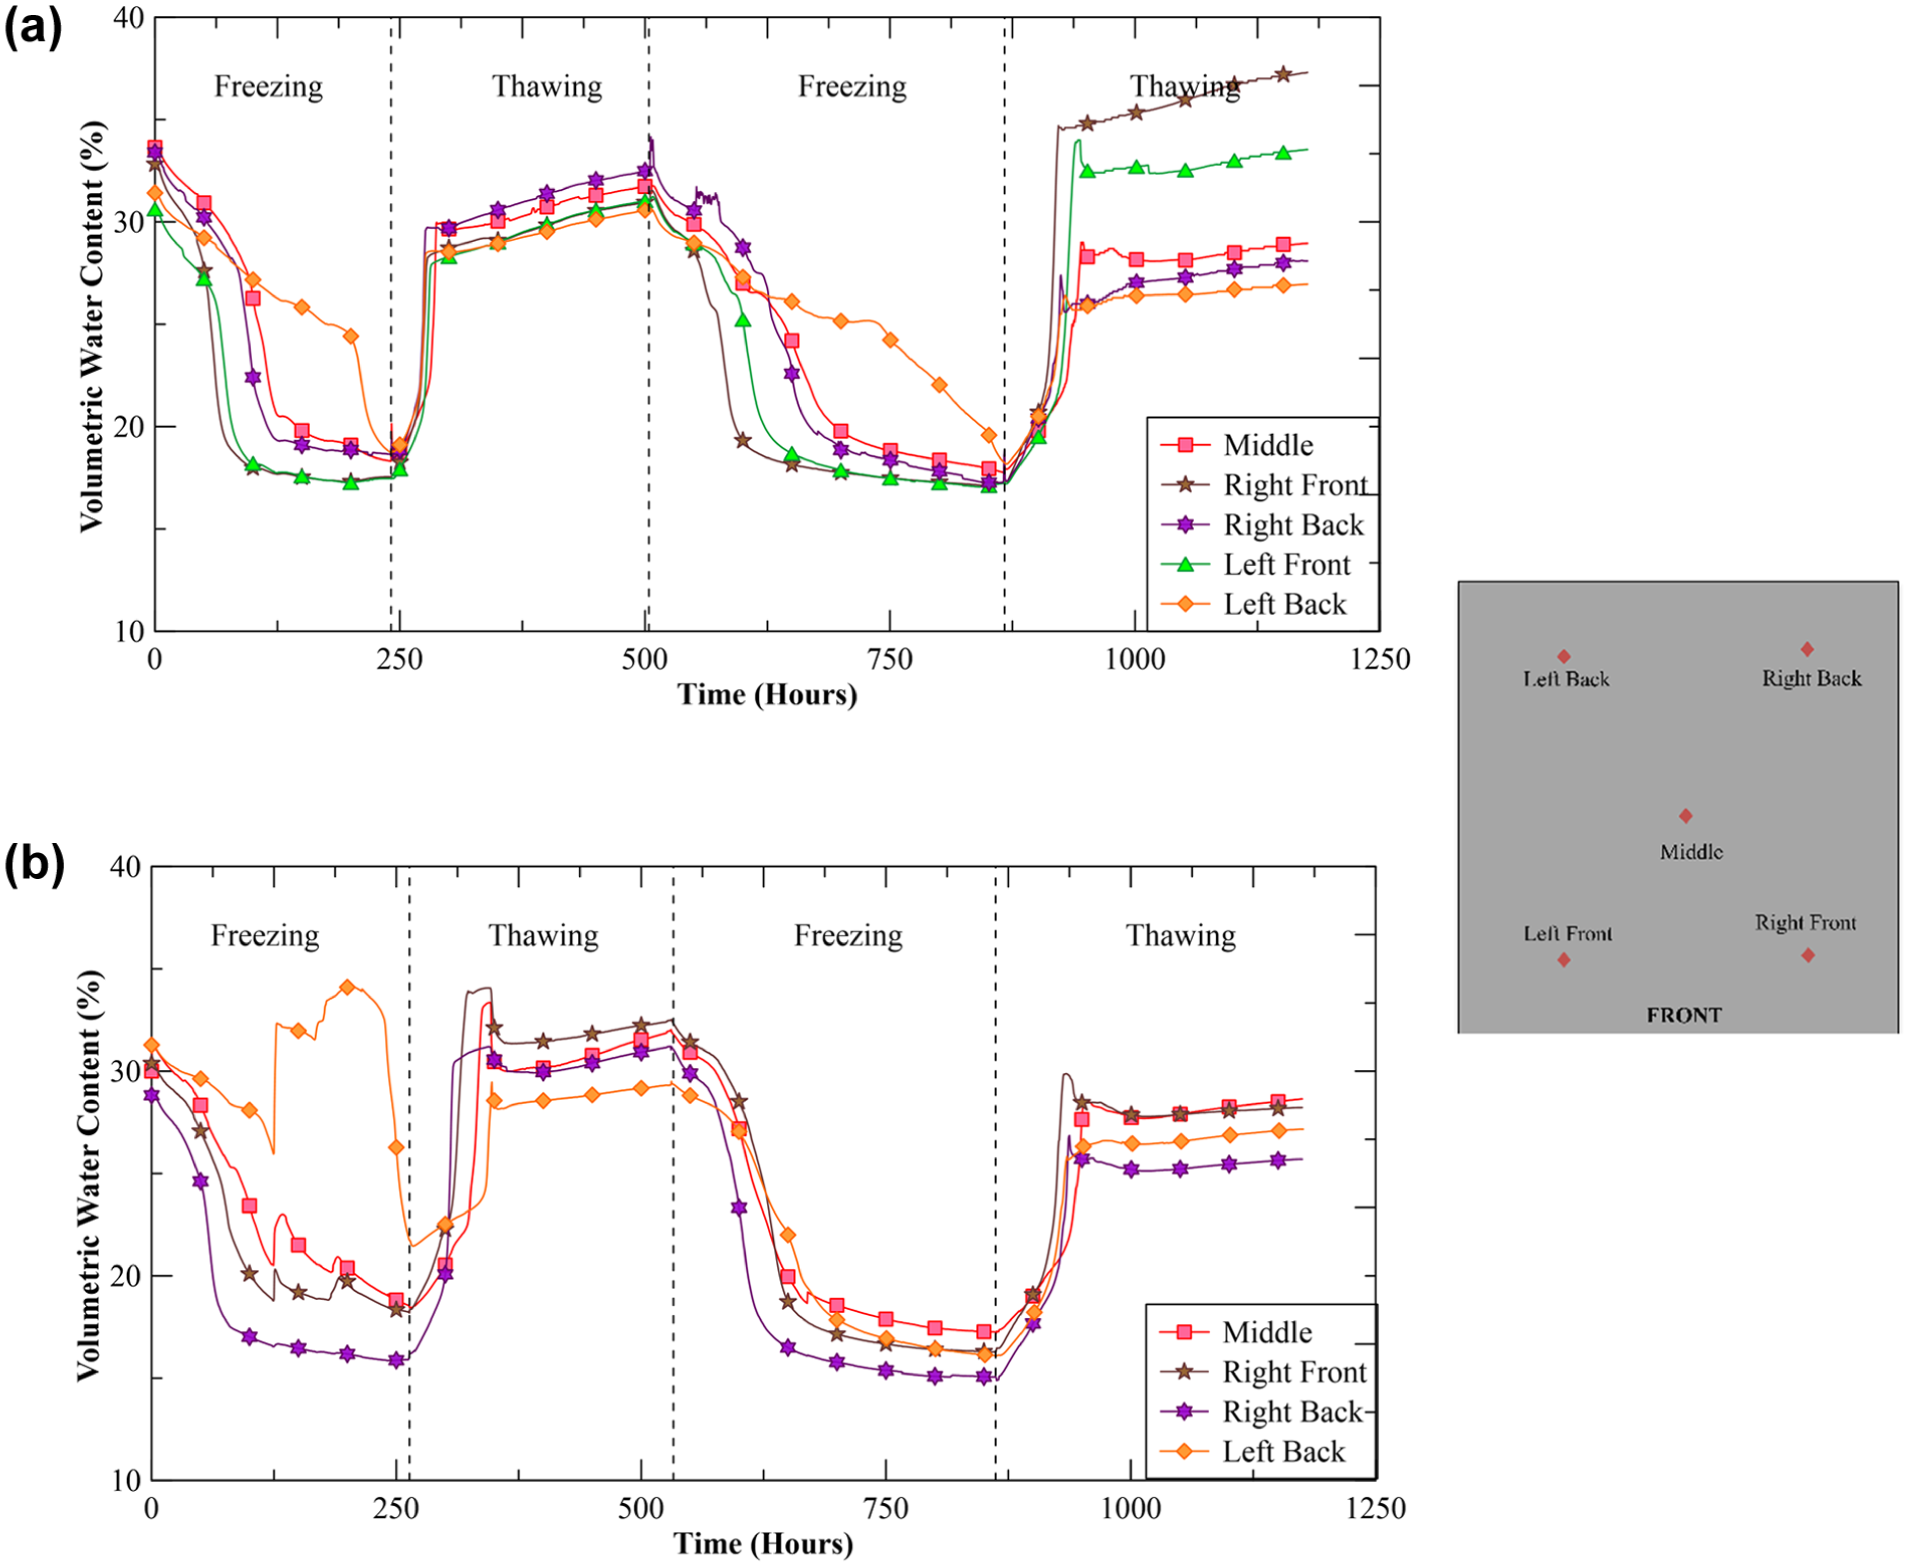
Soil moisture variation in subbase: (a) control section and (b) reinforced section.
The VWC of each test section from all the moisture sensors has been averaged and compared (Figure 16). Similar initial VWC values were observed in both test sections at the start of the first cycle. However, the test sections displayed different patterns at the end of the second cycle. The VWC for the CS remained constant, despite the non-uniform VWC (Figure 15a), indicating that the change in individual VWC was because of moisture redistribution rather than external water inflow or change. At the end of the second cycle, the VWC in the CS remained the same as the initial value; however, the RS showed a decrease in moisture throughout the cycle because of the wicking of the geotextile. The decrease in moisture in the subbase resulted from the combined action of gravity drainage and geotextile suction, as the geotextile was installed below the layer. Gravity drainage drained free water onto the geotextile, which helped transport it out of the pavement. In addition, capillary suction was generated by the wicking fabric acting on the soils at the interface, which can enhance the rate of free water flow and also generate suction to drain capillary water from the soils.
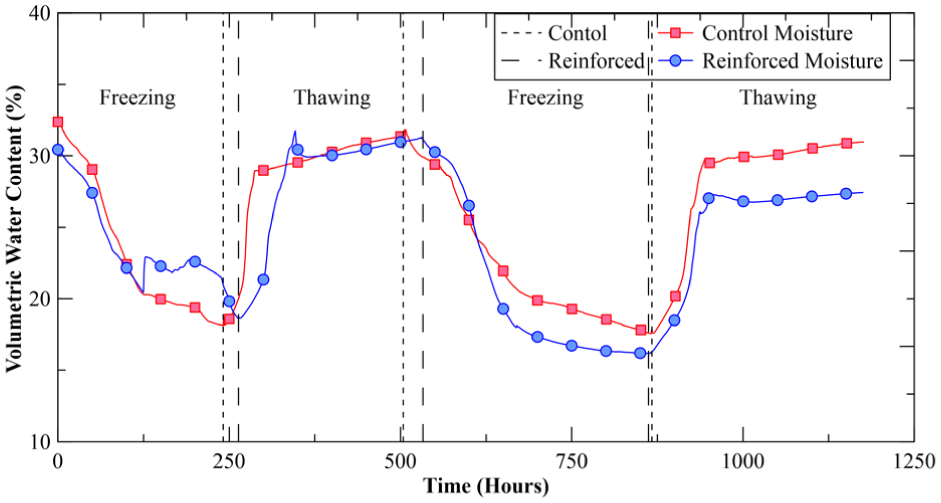
Comparative moisture profile in subbase.
Figure 17 shows the variation of VWC for the subgrade layers in both test sections. It was observed that the bottom sensor showed increased VWC before the rest of the subbase sensors, indicating that the water flow was from bottom to top in both cases, validating the objective of simulating field water conditions. In the CS, the sensors near the interface showed an increase in VWC by the end of the first cycle. However, the sensors in the RS showed an increase in VWC during the first cycle because of excess water inflow. The front sensors froze first, followed by the back sensors, because of interference from the heating element, similar to the case with the subbase. As in the subbase, a similar pattern of uniform soil moisture distribution was observed in the RS.
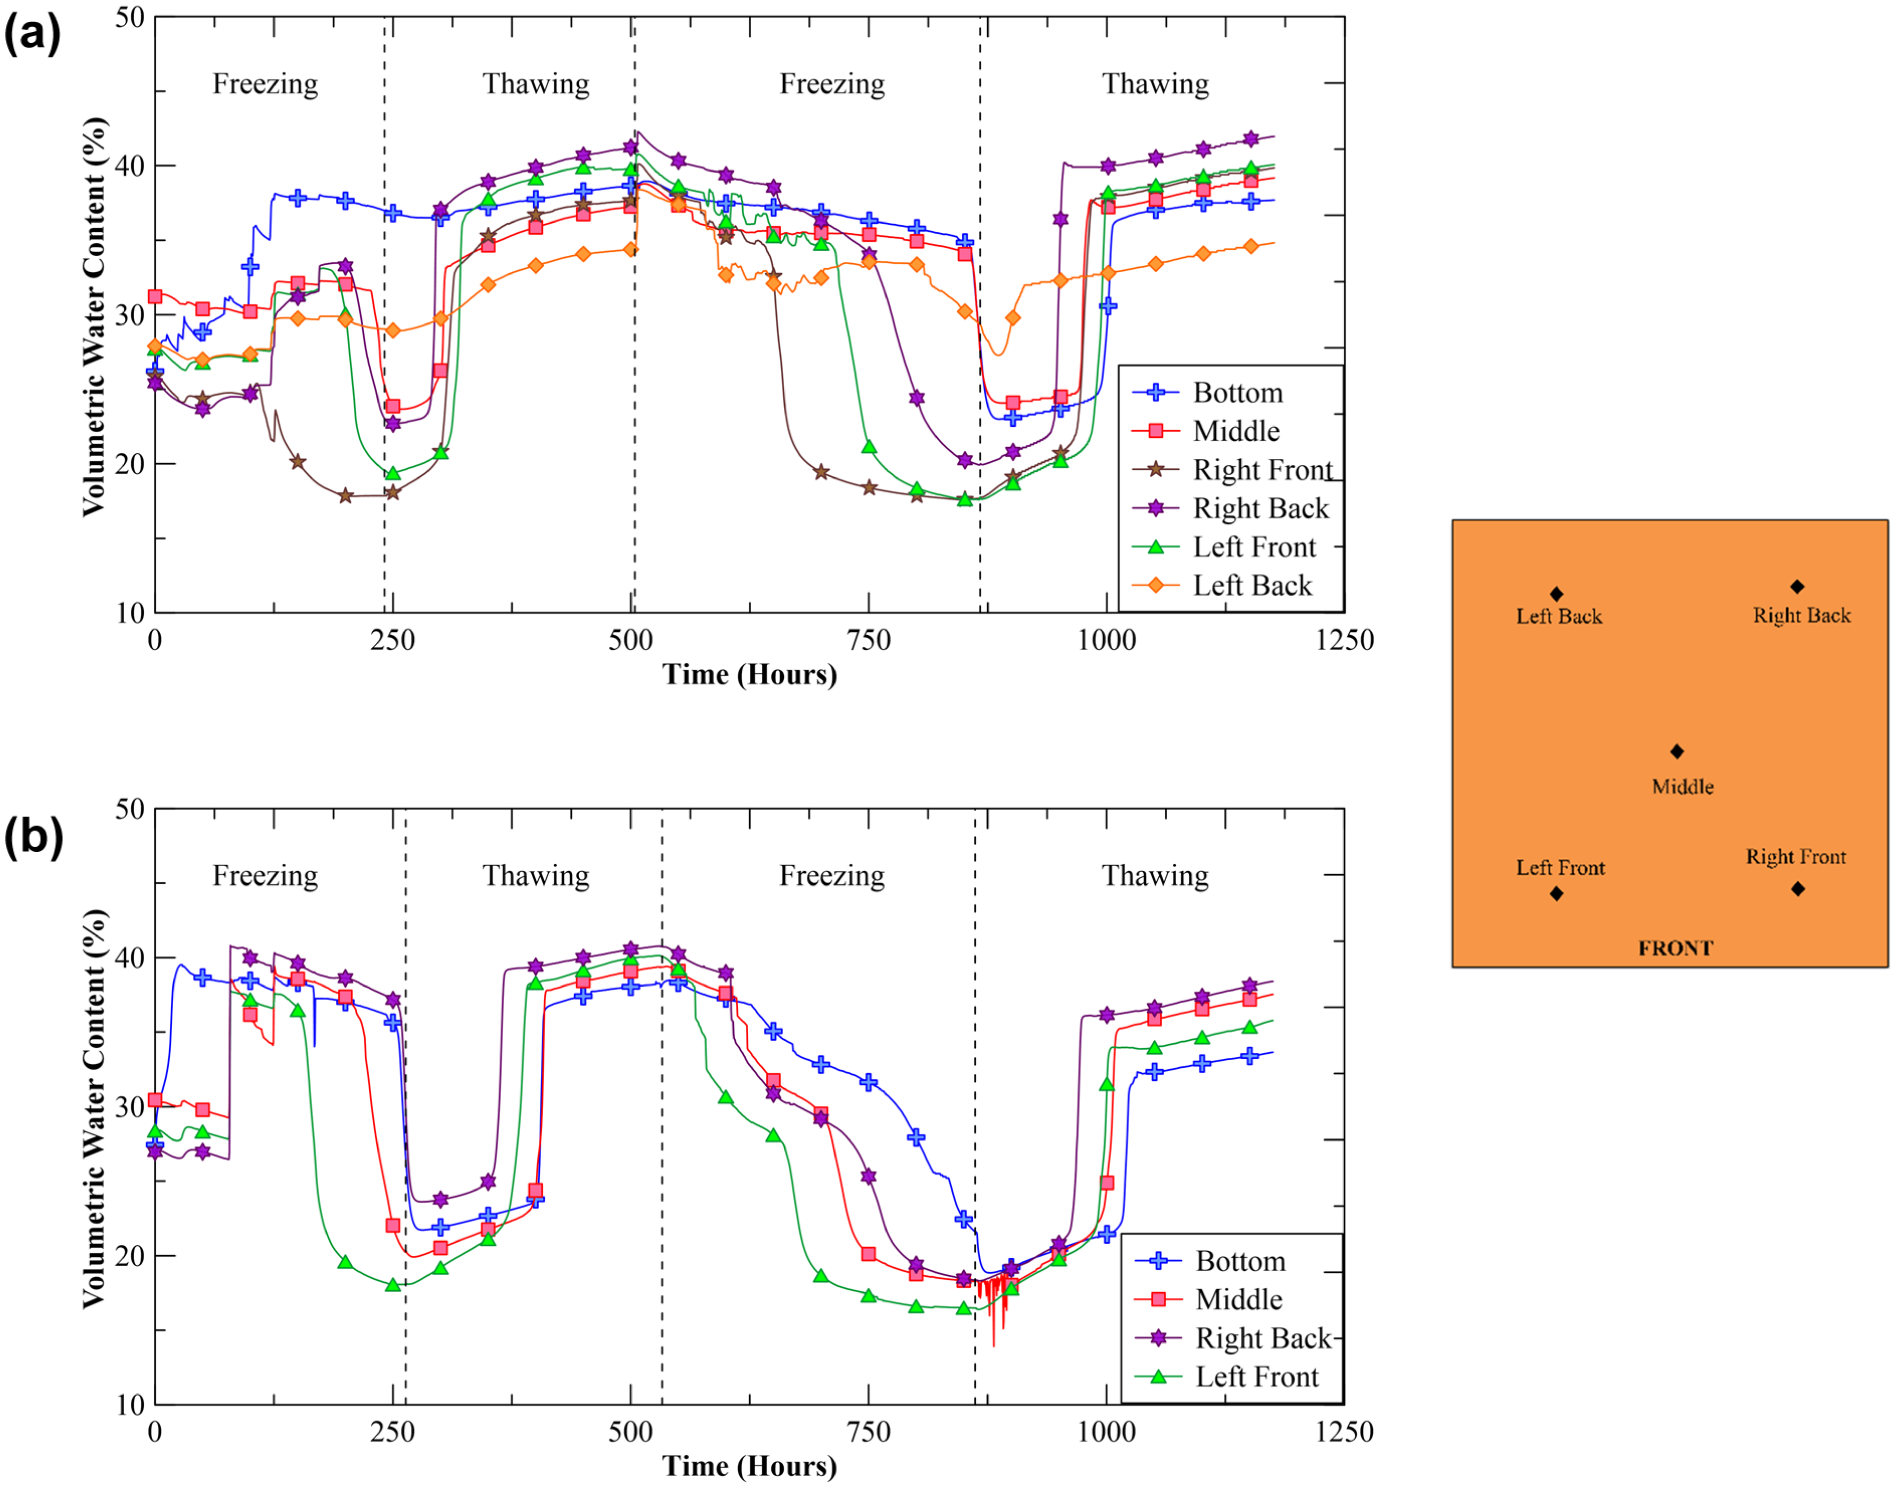
Soil moisture variation in subgrade: (a) control section and (b) reinforced section.
Figure 18 shows the comparative plots for VWC values between CS and RS. It was observed that there was an early increase in VWC for the RS, and higher VWC was noticed by the end of the first cycle because of excess water inflow in cycle 1 (Figure 13). However, by the end of the second cycle, the VWC in the RS was observed to be lower than that in the CS, despite higher overall water inflow because of wicking. Unlike in the subbase layer, the subgrade’s moisture reduction was due solely to capillary suction generated by the geotextile, extracting water from soil pores and transporting it out of the pavement. This moisture variation behavior demonstrates the effectiveness of the wicking geotextile in fine subgrade materials by generating additional capillary suction.
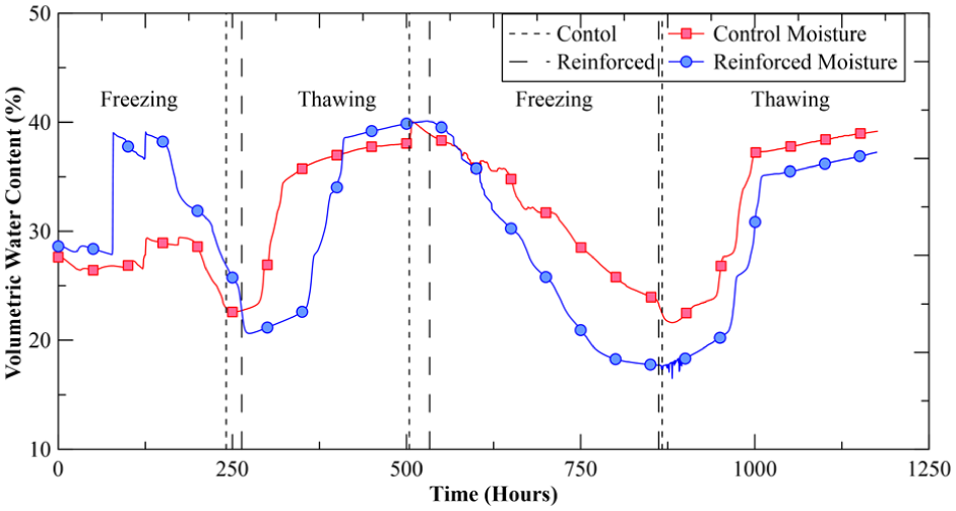
Comparative moisture profile in subgrade.
Moisture Variation Post Freeze–Thaw (F–T) Cycles
To further assess the geotextile’s performance during thawing after two F–T cycles, moisture variation was monitored in the RS for an additional 1,050 h under thawing conditions. Figure 19 illustrates the long-term change in moisture across all layers. It was demonstrated that the geotextile reduced moisture content in the RS at a steady rate. During this period, the VWC values from all the moisture sensors showed a steady change in both the subbase and subgrade layers. It was observed that the moisture reduction in the middle sensors was slightly lower than that in the corner sensors. This pattern was observed because the geotextile strips were placed toward the sides, leaving the middle sensors uncovered; therefore, they had less influence than the other sensors.
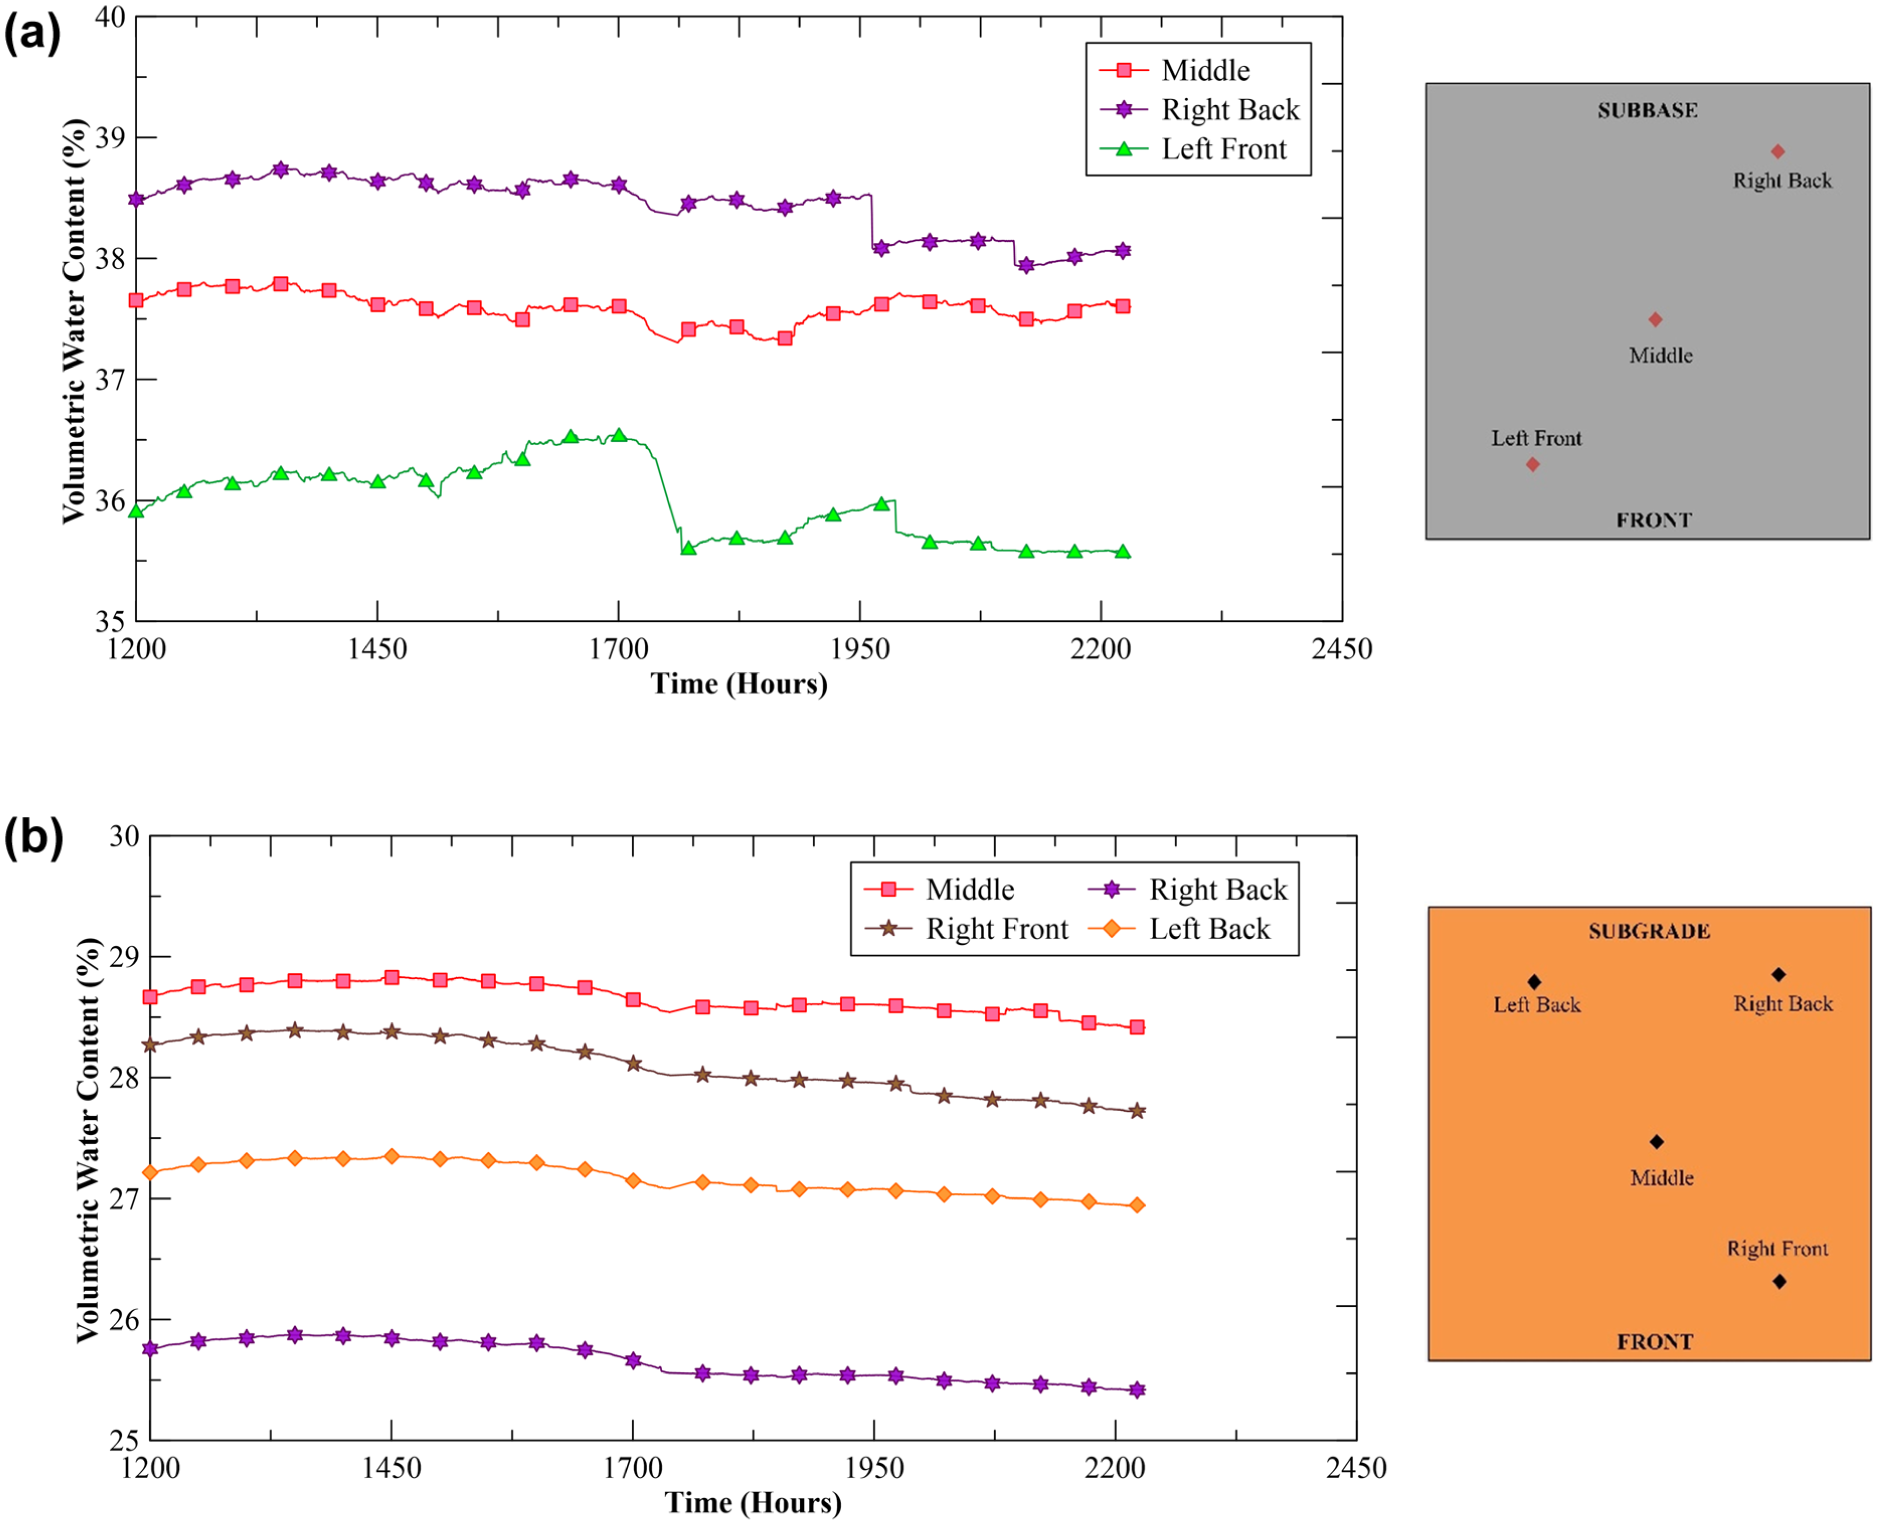
Post freeze–thaw moisture variation in reinforced section: (a) subgrade and (b) subbase.
Moisture Condition at the End of the Tests
To understand the physical implications of VWC change, multiple core samples were collected at the end of the test from all layers at various points near the moisture sensors. Table 4 shows the average moisture content for multiple samples in each layer for CS and RS. The increase in moisture from the OMC at construction was because of the water inflow provided to the system. It was observed that the moisture content in the subbase and subgrade layers decreased in the RS compared with the CS, indicating the geotextile’s effective performance in moisture transport. The subbase layer showed a significant reduction in the water content compared with the subgrade layer, demonstrating that the geotextile effectively reduces moisture in coarse material. The reduction in moisture content was not observed in the base layer, where the geotextile’s influence was limited; in contrast, a slight increase in moisture was observed, which could be related to the slight increase after each thawing cycle because of surrounding condensation.
Layer-Wise Moisture Content (MC)
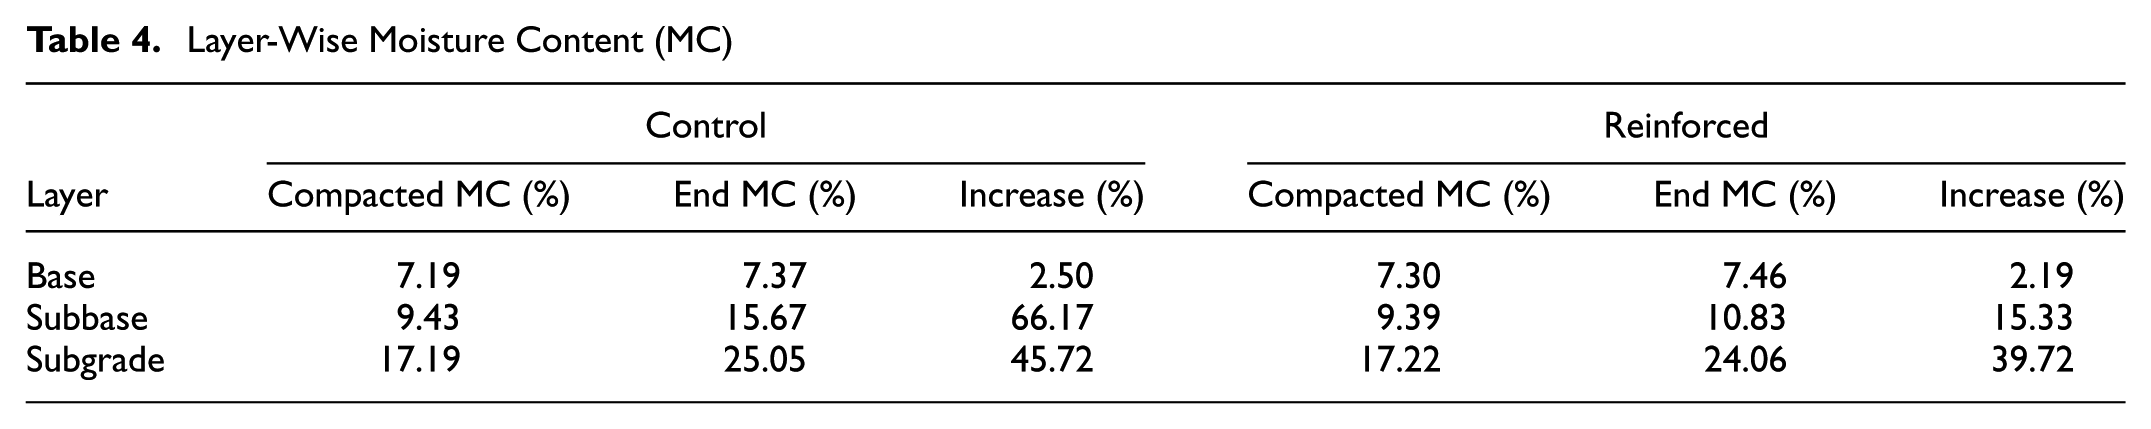
Figure 20 shows the physical observations of the moist soil at the interface between the subbase and subgrade after the test ended. Visual observation showed that the CS had significant water at the subgrade interface, while the RS showed a dry surface, validating the moisture sensor and end moisture data trend.
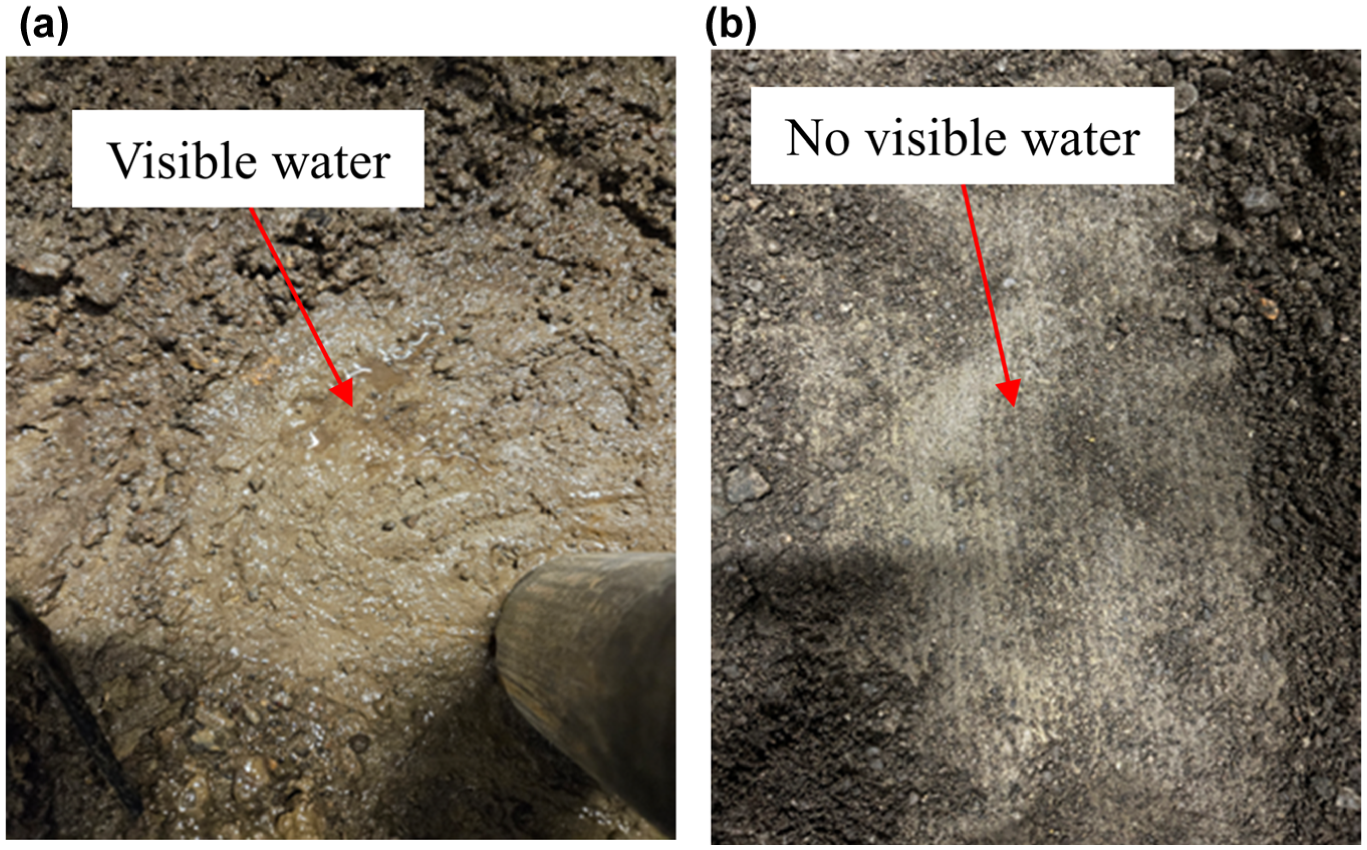
Subgrade condition at the end of the test: (a) control section showing accumulated water and (b) no water accumulation in the reinforced section.
Figure 21 illustrates the schematics of moisture movement in the RS. The wicking geotextile has very fine fibers that generate capillary suction on both faces, providing suction to both the subbase and the subgrade ( 16 ). In addition to the generated capillary suction, gravity drainage occurs from the subbase onto the geotextile. This is because of the subbase’s material property, being sandy soil, which is relatively highly permeable, and the placement of geotextile below this layer. However, in the subgrade, only capillary action can be observed, as it remains below the geotextile. These mechanisms explain the higher moisture drainage in the subbase (51% less than CS) compared with only 7% less than CS in the subgrade layer. Overall, the flow of water in soils reinforced with wicking geotextile is governed by a combination of capillary action and gravity drainage, which together ensure efficient moisture removal and evaporation across a range of environmental conditions.
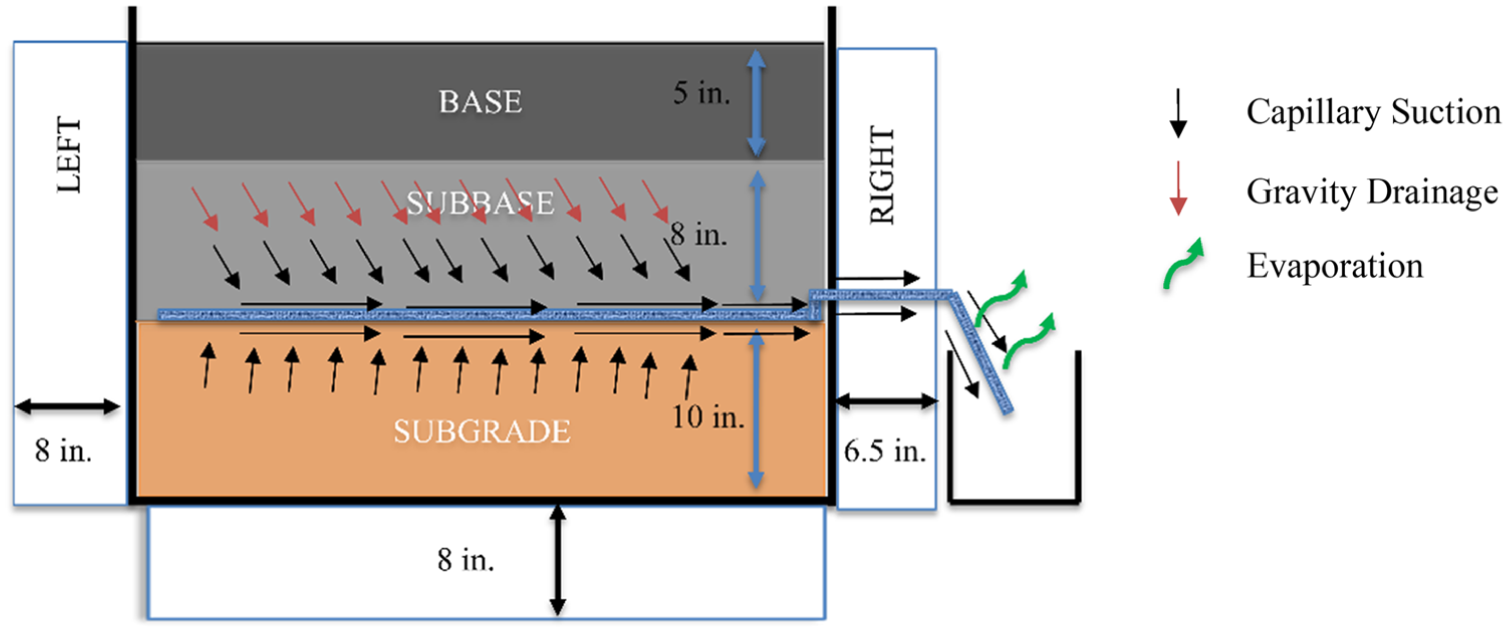
Moisture movement in the reinforced section.
Pavement Layer Strength before and after Tests
To assess the improvement in pavement performance with the reduction in moisture, a series of variable energy dynamic cone penetrometer (VE-DCP) tests were performed before and after the start of the test. In the CS, the DCP test was performed at four locations. In the case of RS, the DCP tests were limited to two locations because of the geotextile placement. Figures 22 and 23 show the plots for tip resistance with depth for CS and RS, respectively. A decrease in tip resistance was observed at the end of the test compared with the resistance before the F–T cycles in both test sections. This was directly related to the increase in moisture during the testing as part of the open water system.
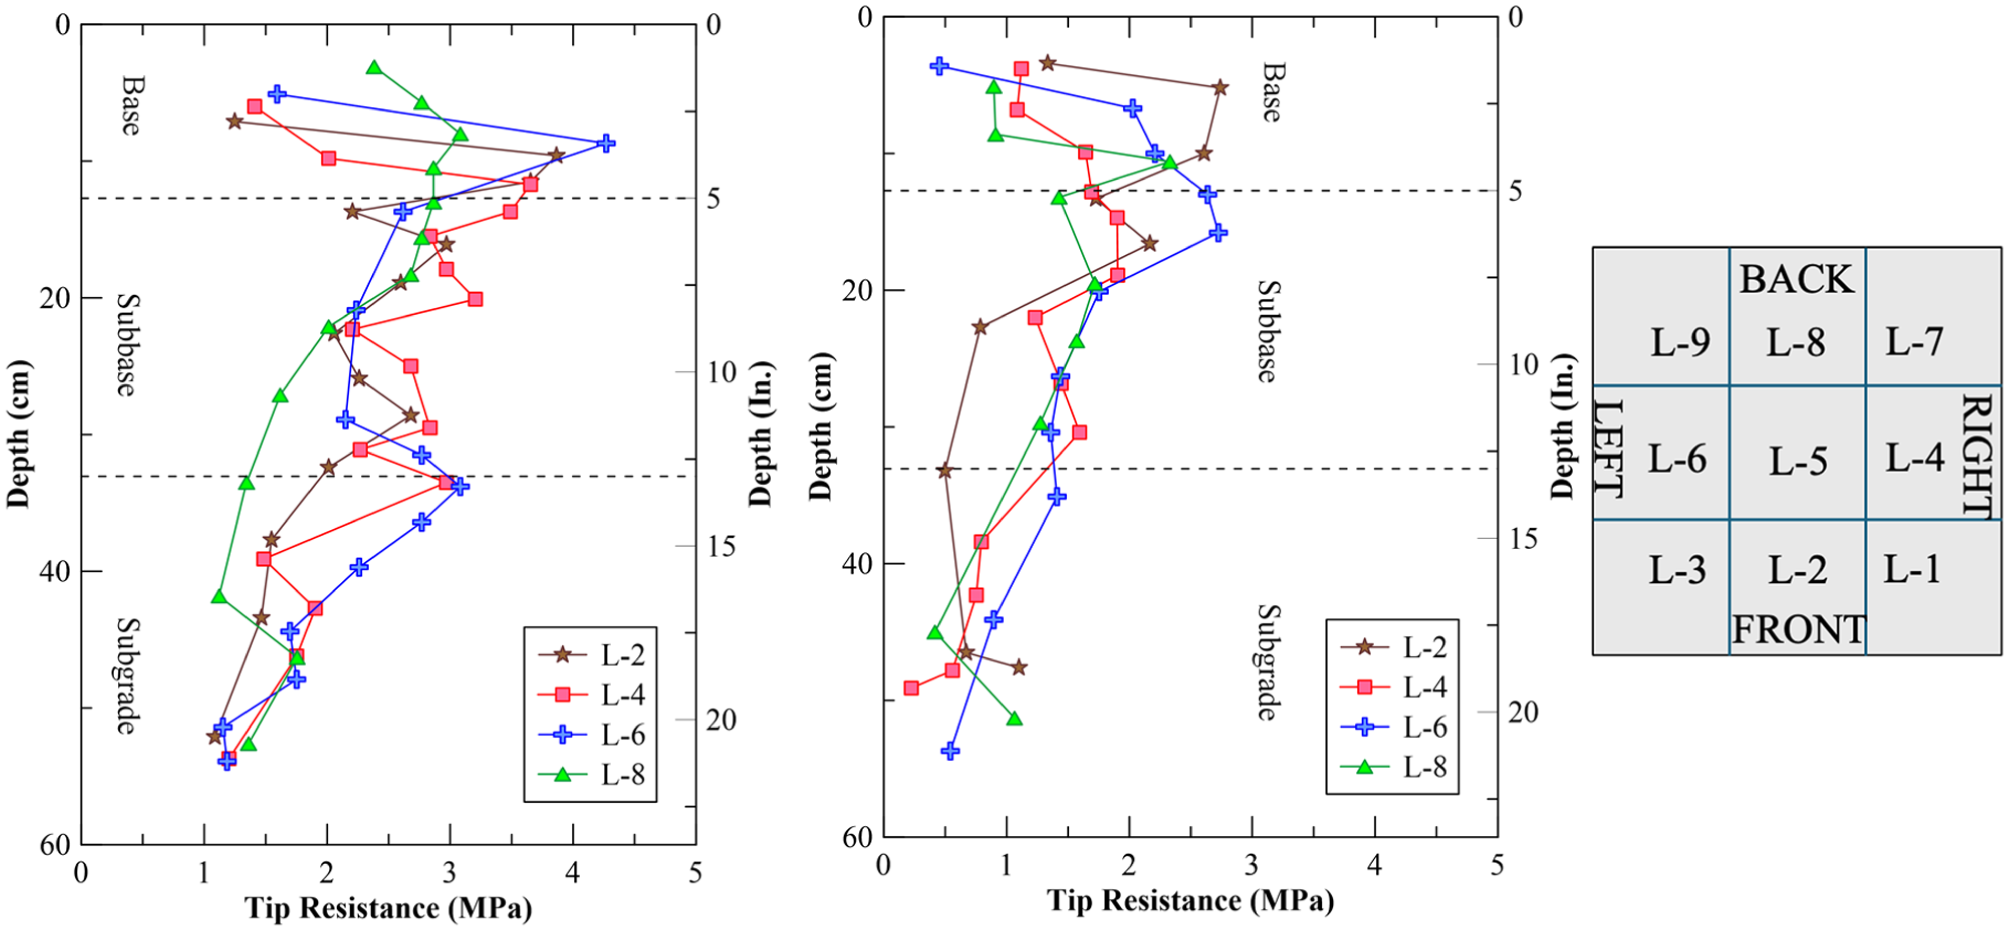
Tip resistance in control section: before freeze–thaw (F–T) cycles (left) and after F–T cycles (right).
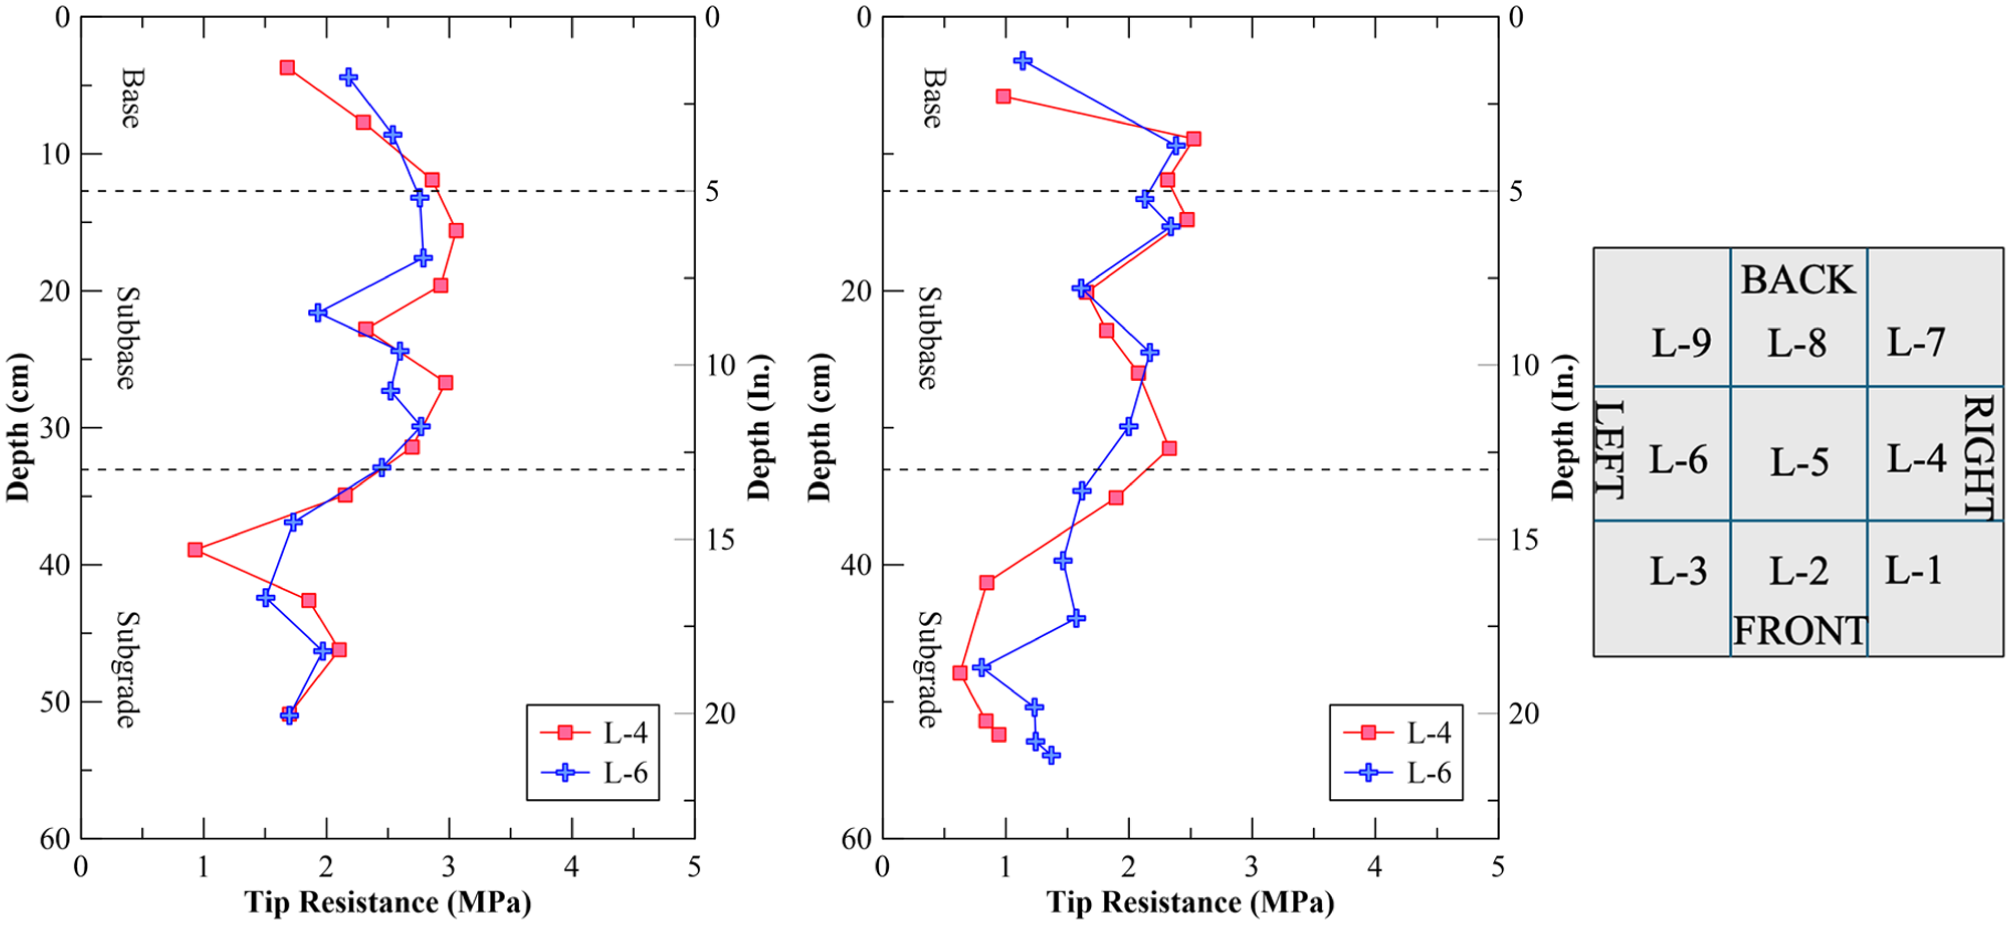
Tip resistance in reinforced section: before freeze–thaw (F–T) cycles (left) and after F–T cycles (right).
The tip resistance from VE-DCP testing directly correlates with the California bearing ratio in strength comparisons. The subgrade was observed to have a 77% reduction in strength in the CS and a 47% reduction in the RS, indicating a significant improvement. A similar performance improvement was evident in the subbase layer, where a 19% reduction in RS was observed, compared with a 41% reduction in CS. This significant improvement in the subbase layer was directly correlated with the improvement in water drainage observed in the end moisture content. It was observed that the base layer also showed a lower reduction in resistance because of its lower initial strength in the RS and a similar post-strength in both cases.
Field studies conducted on pavements under wet-dry conditions have shown that wicking geotextile is effective at draining moisture from the subgrade, leading to improved pavement stiffness and strength ( 7 , 26 ). The current laboratory study provides additional insights under cyclic F–T conditions, offering additional solutions to mitigate the effects of frost heaving. However, the tests have been performed under rapid-freezing conditions, and moisture infiltration rates can vary with different geomaterials. A detailed field-scale study is necessary to observe regionally specific performance. However, through its well-planned experiment program, the current laboratory study effectively demonstrated that, by placing a wicking geotextile at the subbase-subgrade interface, effective moisture drainage is possible and that it significantly reduces subgrade and subbase moisture levels, even under cyclic F–T conditions. These findings are extremely valuable for effectively extending the application of wicking geotextiles to frost-susceptible regions.
Summary and Conclusions
This research study was conducted to evaluate the performance of wicking geotextile in draining water from pavement layers under F–T conditions, as a solution to mitigate the effects of cyclic frost heaving in frost-susceptible soils. For this, a large-scale test setup was constructed with two test sections—CS and RS—each consisting of three pavement layers of frost-susceptible soils. The RS was installed with wicking geotextile at the interface of the subbase and subgrade, while the CS had no additional reinforcement.
The test sections were subjected to two F–T cycles under controlled environmental conditions, with conditions maintained throughout. Freezing was simulated in a −18°C (−0.4°F) environmental chamber until the freezing front reached the subbase-subgrade interface. To replicate the field conditions by ensuring the propagation of freezing from top to bottom, surrounding insulation was installed. Thawing was simulated at room temperature, and the duration was maintained to equal the respective freezing cycle. During the testing, a water supply was provided from the bottom, maintaining a constant head to simulate field water conditions. The following observations were made from this study:
The wicking geotextile was proven effective at transporting and removing excess water from the subgrade and subbase layers during the F–T cycles, reducing water content by 51% and 7%, respectively, compared with the CS.
The geotextile was more effective in the subbase (coarse) than the subgrade (fine) materials, when installed at the interface because of the combined action of gravity drainage in the coarse material and capillary suction generated by the geotextile.
The wicking geotextile effectively distributed the moisture uniformly in the subgrade and subbase compared with the CS test conditions.
During two rapid F–T cycles, the subbase’s material property (i.e., sandy soil, which is relatively highly permeable) and the placement of the geotextile below thaw cycles with the specified thermal and hydraulic boundaries, the RS retained lower end-of-cycle moisture and experienced less strength loss than the CS because of the wicking effect of the geotextile. The subgrade was observed to have a 77% reduction in strength in the CS and only a 47% reduction in the RS, despite the water inflow, showing a significant improvement compared with the VE-DCP tests.
Post-cyclic F–T drainage performance of the geotextile shows steady drainage in the pavement layers, indicating that it is effective at transporting moisture after two F–T cycles.
Overall, the use of wicking geotextile to drain water and mitigate the effects of cyclic frost heaving in cold regions can be a promising solution. The wicking geotextile not only enhances drainage and provides hydraulic stability but can also improve mechanical performance. It is also essential to consider the mechanical improvement provided by the geotextile’s stiffness, in addition to the stiffness improvement from moisture reduction.
Footnotes
Acknowledgements
The authors would like to acknowledge: Dr. Emil Bautista, PE, and the MnDOT team for their support in this study; Mr. John Lostumbo, PE, from Solmax, for providing support with the geotextile; and Gustavo Hernandez Martin at Texas A&M University for his support in the construction of the test setup.
Author Contributions
The authors confirm contribution to the paper as follows: study conception and design: N. Biswas, A. Puppala, S. Gonnabathula, K. Ramineni, M. Sadiq, C. Bora; data collection: S. Gonnabathula, K. Ramineni; analysis and interpretation of results: S. Gonnabathula, N. Biswas, K. Ramineni; draft manuscript preparation: S. Gonnabathula, N. Biswas, K. Ramineni, A. Puppala., M. Sadiq, B. Cetin, R. Velasquez. All authors reviewed the results and approved the final version of the manuscript.
Declaration of Conflicting Interests
The authors declared the following potential conflicts of interest with respect to the research, authorship, and/or publication of this article: Anand J. Puppala and Nripojyoti Biswas are members of Transportation Research Record’s Editorial Board.
Funding
The authors disclosed receipt of the following financial support for the research, authorship, and/or publication of this article: This research was supported by the National Road Research Alliance (NRRA) (Project no. RC113760 – TAMU) (Contract no. 1036336-WO3).