
Abstract
This paper employs Bayesian negative binomial models to examine the effects of curb extensions on traffic safety through their implementation as part of a stormwater management program in the City of Philadelphia. Although widely deployed to promote traffic safety, the effects of curb extensions on traffic safety are poorly understood. Between 2011 and 2023, the Philadelphia Water Department installed 156 vegetated curb extensions that protruded into the street and initiated the design of 342 curb extensions to be built by 2029. Although pre-existing crash data featured in the selection of treated locations, the focus on stormwater management and long list of treated and untreated intersections provide unique, quasi-experimental conditions under which to examine the effects of curb extensions. After matching these curb extensions to intersections and removing midblock interventions, we created a dataset of 94 treated intersections and 269 control intersections installed between 2013 and 2023. Each intersection included a single curb extension. We matched these spatially to annually aggregated crash data from 2012 to 2024. We also matched these to data on the roadway width, roadway class, signalization at the intersection, and expected acres of drainage associated with stormwater management. Analysis suggested that curb extensions reduced the incidence of reported crashes by around 13% at a typical intersection. However, the 95% credible interval ranged from a 35% decrease to an 18% increase. Findings suggest that a single curb extension may reduce collisions and injuries but that additional studies are needed from fully treated intersections.
Introduction
Installing curb extensions, also known as bump outs or bulb outs, is a widely implemented traffic safety intervention. By extending the sidewalk into the roadway, curb extensions shorten pedestrian crossing distances, enhance visibility, and encourage slower vehicle speeds by reducing vehicle turning radii ( 1 – 4 ). Policymakers have credited a combination of curb extensions and lower cost plastic delineators at intersections with helping Hoboken, NJ, a dense city of 50,000, reduce its traffic fatality rate to zero ( 5 ). Despite widespread adoption, there is limited direct study of the effects of curb extensions on crashes or traffic injuries. The Federal Highway Administration has identified research into the effects of curb extensions on crashes as a high priority area for empirical research ( 6 ).
In 2011, the City of Philadelphia launched a 25-year program, Green City, Clean Waters, to build Green Stormwater Infrastructure to reduce combined stormwater overflows and protect Philadelphia’s waterways ( 7 ). The plan was aimed at reducing combined sewer overflow pollution by 85% and focused on managing the first inch and a half of stormwater runoff from 9,564 acres of impervious surface. To help meet these goals, the Philadelphia Water Department planned, designed, and built a portfolio of green stormwater infrastructure systems. These systems capture, filter, and store stormwater runoff utilizing subsurface trenches, and often have vegetated features, from raingardens to street trees, that mimic natural processes where possible.
As part of this program, the Philadelphia Water Department built 156 stormwater curb extensions between 2011 and 2023, and initiated designs to build 342 more by the end of 2029. These extensions typically have small, vegetated portions that protrude into the street at mid-block or intersection locations. The Water Department selected sites for these curb extensions primarily based on subsurface and utility clearance concerns, width of the right of way, proximity to the city’s designated High Injury Network, and the level of trash accumulation along the corridor. Due to a focus on stormwater management, the Water Department generally only installed a single curb extension on one corner of each intersection.
By comparing the effects of these curb extensions over time relative to similar roadways where curb extensions have not yet been installed, this study offers a causally valid approach to identifying the effects of curb extensions on traffic safety. Although pre-existing crash data featured in the selection of treated locations, the focus on stormwater management and long list of treated and untreated intersections provide unique, quasi-experimental conditions under which to examine the effects of curb extensions. Yet despite their widespread deployment to improve traffic safety, little is known about curb extensions' effects on crashes or how these effects may vary by roadway conditions, location, or other features.
The remainder of this paper is structured as follows. Section 2 examines the related literature on the effects of curb extension on crashes, injuries, and driver and pedestrian behavior. Section 3 describes our research approach, data, and models. Section 4 presents statistical findings and an overview of limitations. Section 5 concludes with a summary and takeaways for public policy.
Effects of Curb Extensions on Crashes
Policymakers and researchers have long considered installing curb extensions as an effective intervention to improve traffic safety, particularly for pedestrians ( 1 , 3 , 8 – 13 ). Despite their widespread adoption and theoretical benefits, the Federal Highway Administration included curb extensions on its 2019 and 2023 most wanted lists for crash modification factors ( 6 ). These lists highlight areas where there is a need and an interest in additional and improved empirical research. While substantial work has examined the effects of traffic calming, the built environment, and traffic safety interventions more generally ( 14 – 19 ), only a small number of studies focus specifically on curb extensions. Few are peer-reviewed ( 9 , 20 ) and many lack appropriate sample sizes ( 9 , 21 – 24 ).
Early studies of curb extensions tended to focus on driver and pedestrian behavior at a small number of intersections, frequently without appropriate control intersections or temporal data. For example, Huang and Cynecki ( 9 , 21 ) evaluated the effects of curb extensions in Cambridge, MA, and Seattle, WA, on pedestrian wait times, driver yielding behavior, and crosswalk compliance using video footage. The authors found no substantial improvements in the three behaviors. However, the study had an extremely small sample size, no control intersections, and a focus on behavior rather than safety outcomes. Compared with control intersections in Greensboro, NC, and Richmond, VA, the authors found decreased median driver speeds in Greensboro but increased speeds in Richmond ( 21 ). The study only included two treated intersections and two control intersections in each city. Johnson ( 24 ) compared yielding behavior at a single intersection with curb extensions to another similar nearby intersection without curb extensions in Albany, OR. Drivers yielded more frequently to pedestrians waiting at the treated intersection than at the control intersection. In addition to having a sample size of just one treated intersection, the study included no observations before the installation of curb extensions. Differences were also statistically insignificant for other measured forms of yielding. In a study of eight intersections with traffic calming treatments in New Zealand, Turner et al. ( 23 ) found increased pedestrian activity at two of the four intersections with curb extensions. The authors also reported that pedestrians viewed curb extensions as less relevant for safety than zebra crossings or crossing guards.
Four studies have examined the relationship between curb extensions and collisions over time. King ( 22 ) looked at 10 years of crash data before and after curb extensions at six intersections in New York City. Crashes decreased at four sites but increased at another two. Of the three intersections with statistically significant changes in serious crashes, two saw a decrease in crash severity with a substantial increase at the third. The study, however, included no control intersections or other statistical controls. In another more detailed study from New Zealand, the Land Transport Safety Authority New Zealand ( 25 ) reported a 37% reduction in pedestrian collisions at 33 intersections with curb extensions installed relative to regional changes in pedestrian collisions.
Of the four studies, just two included larger samples with before and after data. Batomen et al. ( 20 ) examined the effects of traffic calming measures at 1,658 locations in Montreal on traffic collisions and injuries at the intersection- and Census-tract level. Traffic calming measures included curb extensions, crosswalks, diverters, flashing crosswalks, midblock narrowing, raised crosswalks, and speed-activated signs. The authors found that traffic calming measures were associated with decreased fatalities and serious injuries at intersections on local roads with a median incidence rate ratio of 0.31. However, there was not a statistically significant effect on arterials where traffic calming measures were installed. While the study did not specifically focus on curb extensions, 28% of the identified traffic calming measures included curb extensions. The plurality of measures included speed humps (48%).
The New York Department of Transportation ( 26 ) compared changes in pedestrian collisions with changes at nearby control intersections. At the 189 intersections with daylighting using physical barriers, like posts or bollards, pedestrian injuries decreased by a statistically significant 0.14 per year. At the 14 intersections with curb extensions, pedestrian injuries decreased by 0.5, though the unit of decrease was unclear in the report. The report did not provide sufficient information on the underlying data or statistical model to estimate a percent change associated with these decreases. Moreover, based on the limited description of a “difference in differences” method, the underlying model is almost certainly relying on Ordinary Least Squares, which is an inappropriate estimator for rare events such as crashes or injuries at intersections.
At the time of writing, there were no peer-reviewed studies of the effects of curb extensions on traffic safety with appropriate before-and-after data and appropriate control intersections for comparison.
Research Design
Treatment and Controls
The final dataset included 94 intersections where curb extensions were installed between 2013 and 2023. Of these, roughly 80% were installed between 2019 and 2022 with between 18 and 20 intersections treated in each of the four years. Figure 1 maps the location of intersections with curb extensions installed or planned (the control intersections in the study) as part of the stormwater management program. The Water Department’s capital funding rules limit spending to water, wastewater, stormwater, and other related investments with an emphasis on minimizing capital costs. Curb extensions were often built in coordination with tree trenches and other subsurface investments across a project area. Given the focus on stormwater management and cost considerations, the curb extensions in the dataset were one corner. On average, the curb extensions are 45 feet long and protrude 7 to 11 feet into the right of way. This corresponds roughly to the size of two parking spaces at the treated corner of the intersection. At the time of writing, the Water Department had plans to add a second curb extension to an intersection where a curb extension was installed in 2022.
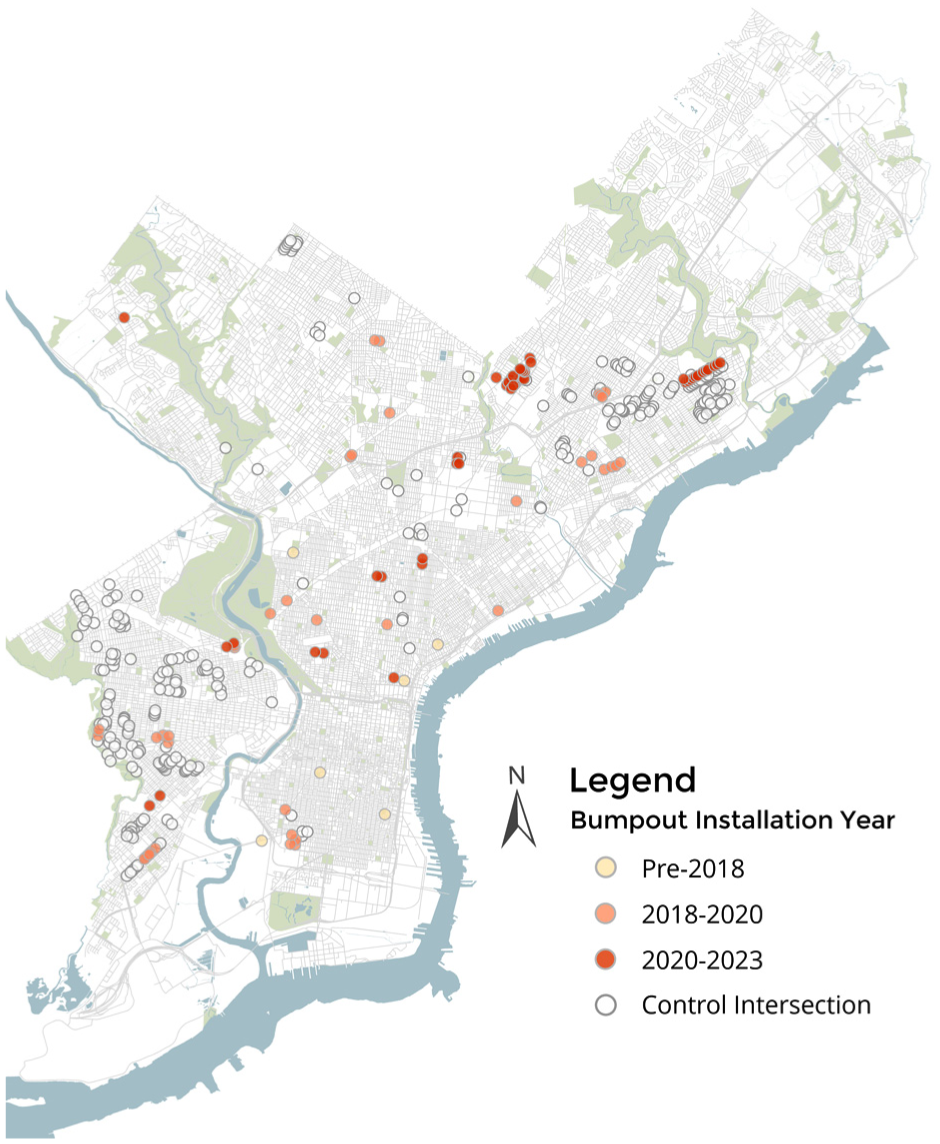
Location of built curb extensions by installation period and the control intersections that are in design as part of Philadelphia’s stormwater management program.
Figure 2 shows a typical installation at the northwest corner of the intersection of Lehigh Ave, Chalmers Ave, and 30th St in North Philadelphia. The curb extension shortened one of four pedestrian crossings, reduced turning radii for two of six vehicle turning actions (30th St is one-way headed south), and narrowed the roadway for one out of three movements straight through the intersection. All curb extensions also included new curb cuts and five installations (two arterials and three local roads) in the dataset were coordinated with other safety improvements, such as back angle parking and new signal timing. Two of the local intersections also had bike lanes installed as part of a larger bicycle plan. Results were robust to removing the intersections with additional treatments from the sample.
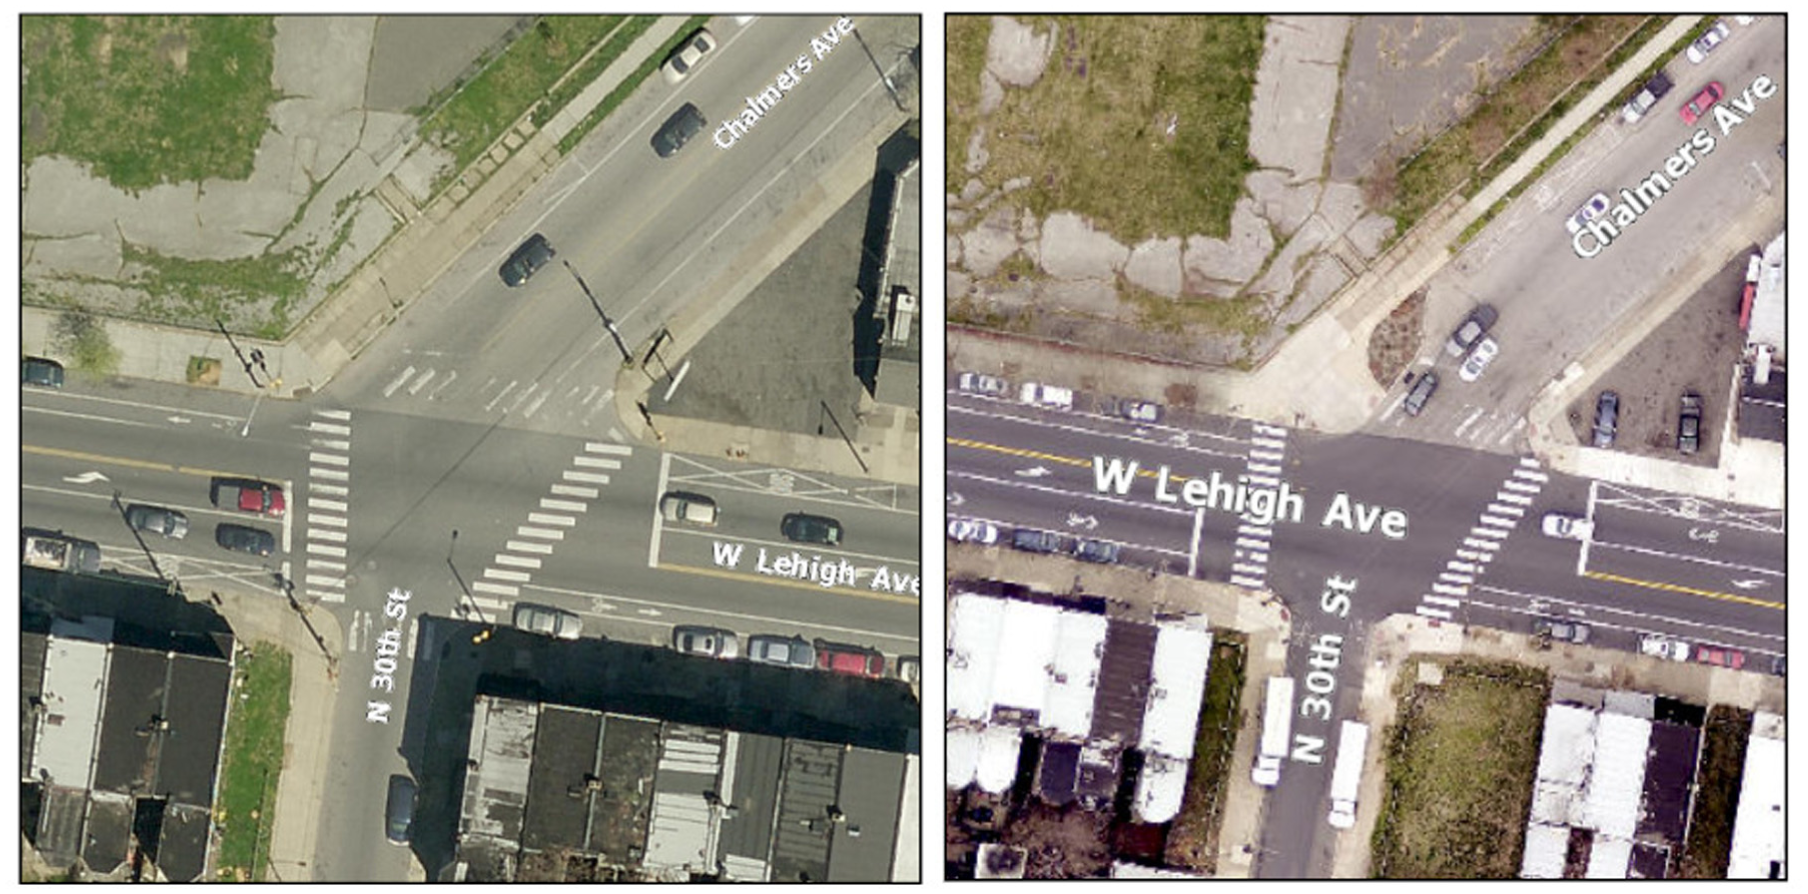
Before and after imagery of curb extension at northwest corner of Lehigh Ave, Chalmers Ave, and 30th St in North Philadelphia.
At each intersection, moreover, planners selected where to build curb extensions based on underground utilities, such as gas lines, available void space, and the ability to capture and store stormwater runoff. In short, the overall location and design of the curb extensions in the dataset were based primarily on stormwater management parameters rather than traffic safety considerations. Although the policy shift did not affect our dataset, the Water Department changed installation guidelines in 2022 to require additional analysis and vetting before the installation of curb extensions on high-traffic arterials based on concerns with traffic, maintenance, and the safety of work crews ( 27 ).
Table 1 compares the change in crashes, pedestrian-involved crashes, and crashes resulting in a fatality or serious injury between the 94 intersections that had curb extensions installed and the 269 intersections that did not have curb extensions installed between 2013 and 2023. Reported crashes and injurious crashes decreased at all intersections with a relatively stronger decrease at intersections where curb extensions were installed. A relatively small share of crashes involved pedestrians or serious injuries, making changes in these types of crashes difficult to interpret. For example, crashes involving a fatality or serious injury (KSI crashes) increased from 0 to 5 at untreated intersections while decreasing from 1 to 0 at treated intersections.
Reported Crashes at Intersections that Received Curb Extensions (Treated) Between 2013 and 2022 and Those that Did Not (Untreated)
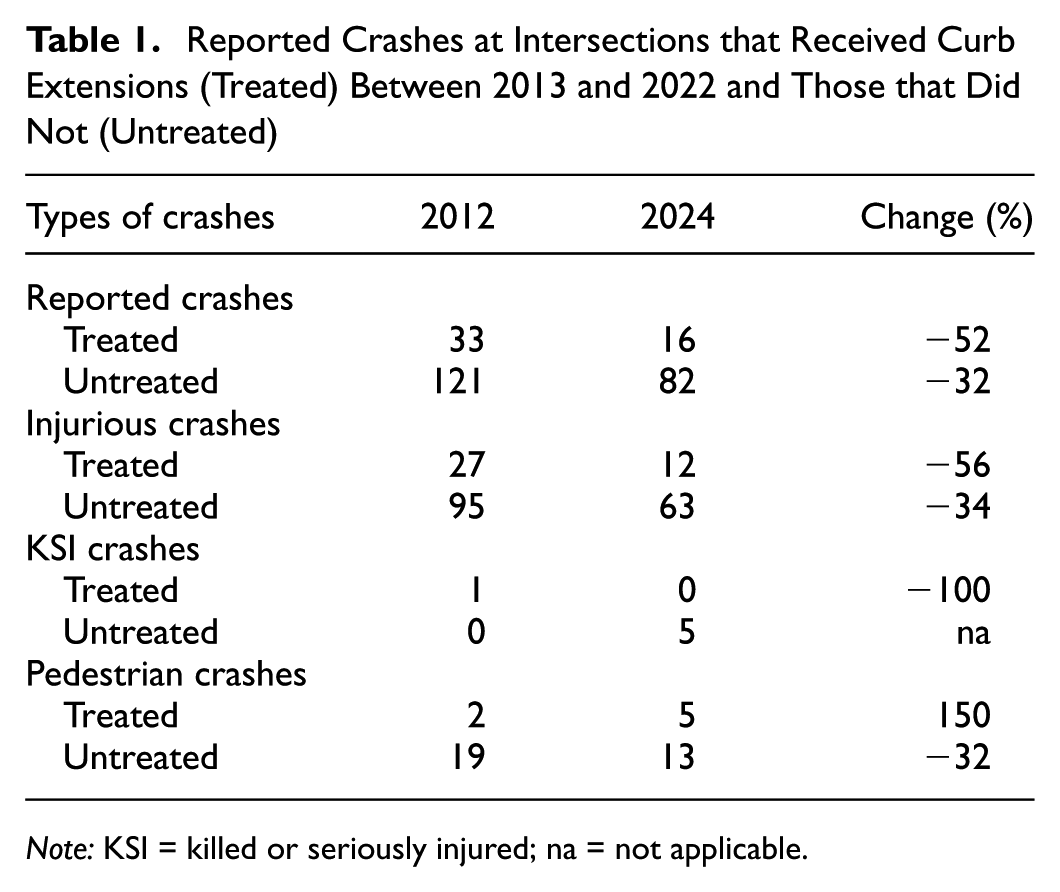
Note: KSI = killed or seriously injured; na = not applicable.
Traffic crashes and injuries were reported by PennDOT’s online crash reporting system ( 28 ). A reported crash involved an injury, fatality, or the towing of a vehicle, and therefore excluded minor collisions or unreported incidents. A traffic fatality was reported if someone involved in the crash died from injuries within 30 days. Serious injury involved “severe laceration, significant loss of blood, broken or distorted extremity, crush injuries, suspected skull, chest or abdominal injury, significant burns, unconsciousness, or paralysis” ( 29 ). We use the terms crash and collision interchangeably throughout the text.
Table 2 provides summary statistics on the annual collisions at all intersections as well as the width of the roadway and total drainage acres at the intersections. Road width refers to the curb-to-curb distance of the widest roadway as reported in the State Roadway Management System ( 30 ) at each intersection. We assigned a value of zero width to the 20% of intersections that did not include a roadway with an assigned state route in the management system. We created a dummy variable for the 75% of intersections with four or five road segments approaching the intersection and the 18% of intersections with a traffic light. Drainage acres refer to the amount of impervious surface area on a street block that a green stormwater treatment would manage and was a key factor in determining the placement of curb extensions in the study. The larger the runoff area, the higher the priority for stormwater management and a curb extension.
Mean/Share of Crashes and Predictor Variables Included in Dataset (4719 Observations)
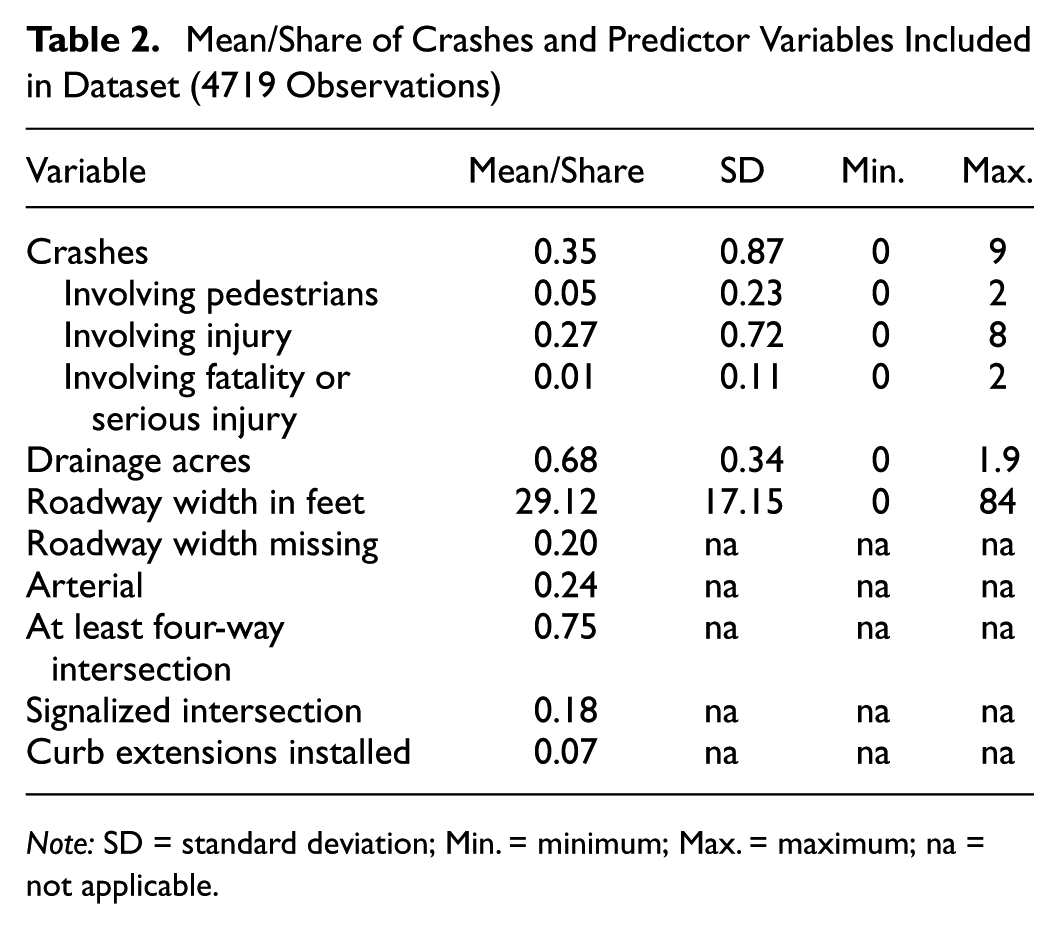
Note: SD = standard deviation; Min. = minimum; Max. = maximum; na = not applicable.
We matched crashes to intersections based on a 50-foot buffer to the centroid of treatment and control intersections. We then summed the number of crashes by type and by year at each intersection. In total, there were an average of 0.35 crashes per intersection per year in the entire sample. Of these, roughly three quarters resulted in a reported injury. Only 3.6% resulted in a reported fatality or serious injury. Around 13% of all collisions involved a pedestrian. We do not report findings from models on serious injuries as the small number of occurrences meant these models failed to converge reliably across the specifications tested.
Model Specification
Our final reported models examined whether annual reported traffic crashes decreased at intersections where curb extensions were installed relative to other intersections where curb extensions were under consideration but had not yet been installed between 2012 and 2023. The reported models employed Bayesian negative binomial estimators with non-informative priors and random intercepts for treated intersections and their most similar control intersections ( 31 ) using the rstanarm package ( 32 ) in R version 4.4.2 ( 33 ). We also included a random intercept to account for spatial correlations in error terms within each of the 32 zip codes in the dataset. Likelihood ratio and overdispersion tests both indicated that negative binomial models outperformed Poisson models.
The reported models predict the estimated crashes as follows:
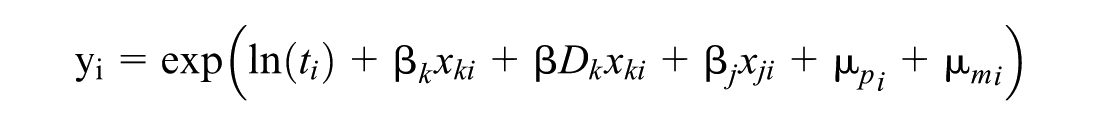
where:
y i is the estimated number of crashes at intersection i during time period t;
t i is the annual time period of exposure;
β k x ki is the vector of parameter estimates βk for each predictor variable xk at intersection i;
β D k x ki is the vector of parameter estimates βxki interacted with Dk which is an indicator variable for time periods after curb extension installation;
β j x ji is the vector of indicator variables representing the year;
μ p i is the zero centered normally distributed random effect for each intersection i and its group of control intersections p; and
μ m i is the zero centered normally distributed random effect for each intersection i and other intersections in the same zip code m.
We matched treatment intersections to control intersections using propensity score matching based on roadway features, drainage acres, and the Euclidean distance to the geographic center of the treated intersections using the MatchIt package ( 34 ). We tested a variety of specifications, including models with fewer years of data since most curb extensions were installed after 2017, and models with only single matched control intersection. These models produced similar results, as did models that only examined changes over time within matched pairs of intersections. Given the similarity in parameter estimates associated with curb extensions, we reported the models with the largest data sample that also allowed parameter estimates for time-invariant features, such as roadway class, roadway width, and geographic location.
Findings
Table 3 presents the results of our models predicting the effects of curb extensions on reported crashes, injurious crashes, and pedestrian crashes. The installation of curb extensions was associated with small decreases in the number of crashes and injurious crashes relative to untreated intersections in the study, though these decreases were statistically insignificant. Taking the exponent of the parameter estimates indicated that the curb extensions were associated with around a 13% decrease in the incidence of crashes at a typical intersection, but a 95% credible interval ranging between a 35% decrease and an 18% increase in collisions. The average effect for injurious crashes was smaller with an even wider 95% credible interval. Unsurprisingly, the small number of pedestrian crashes meant the estimated average effect size for pedestrian collisions was close to zero with an even wider credible interval.
Estimated Differences in Crashes, Injurious Crashes, and Pedestrian Crashes Using Multilevel Bayesian Negative Binomial Models with Random Intercepts a
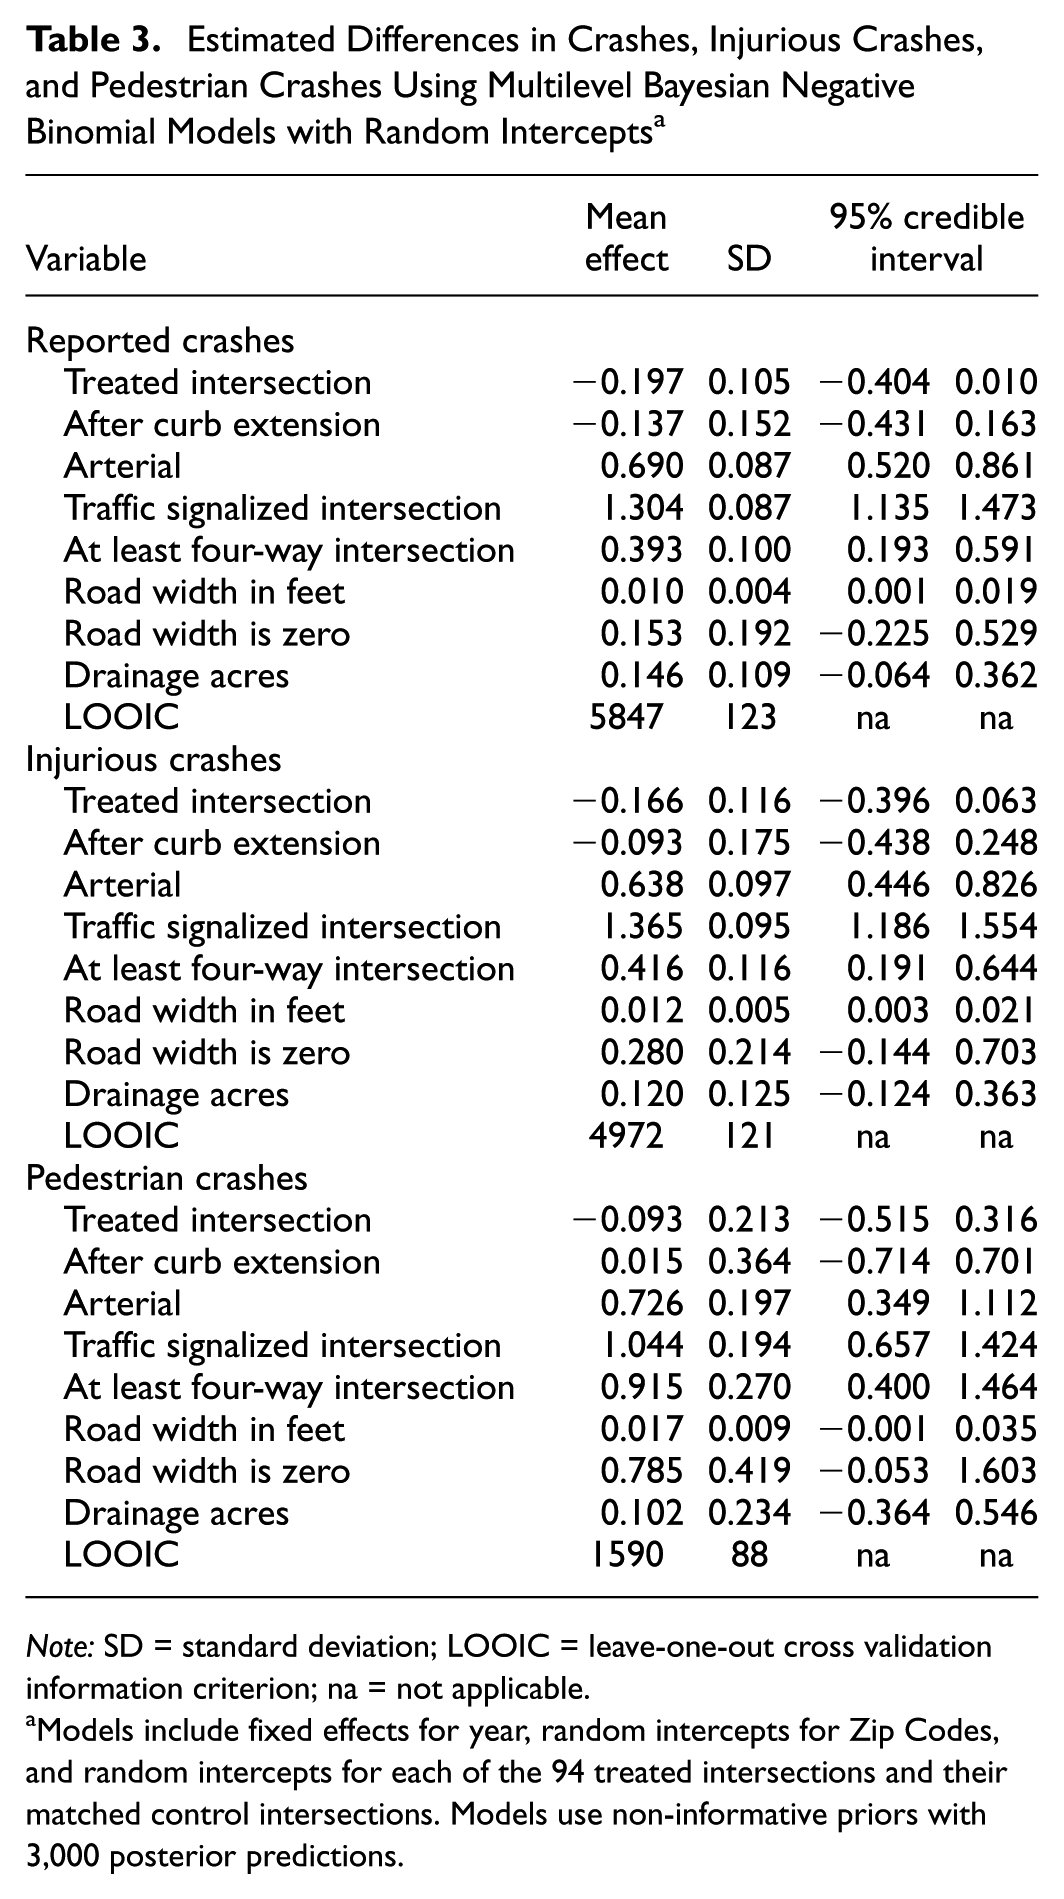
Note: SD = standard deviation; LOOIC = leave-one-out cross validation information criterion; na = not applicable.
Models include fixed effects for year, random intercepts for Zip Codes, and random intercepts for each of the 94 treated intersections and their matched control intersections. Models use non-informative priors with 3,000 posterior predictions.
Despite important differences in context, research design, and outcome measure, the overall findings were generally consistent with existing studies using before and after data with a control group ( 20 , 25 , 26 ). Curb extensions were associated with reductions in some types of crashes. Given the installation of curb extensions at just one corner of each intersection, moreover, small effect sizes that contain zero within the 95% credible intervals are unsurprising. As discussed in the research design, there were insufficient pedestrian crashes or crashes associated with serious injury to expect to find a meaningful statistical relationship. Across the entire dataset of 13 years, there were only two crashes involving a fatality at any of the 94 intersections where curb extensions had been installed by 2023.
In addition, wider roadways were associated with higher rates of collisions and injuries. Each additional foot in roadway width, for example, was associated with around a 1% to 2% increase in crashes. Dividing the coefficient for missing value by the coefficient for each foot of roadway width (0.153/.010) suggests that the average width for the missing data is relatively narrow at around 15 feet. Arterials, intersections with more connecting roadways, and signalized intersections were all associated with higher number of crashes, pedestrian crashes, and injurious crashes. These associations likely relate to faster, more dangerous roadway conditions as well as higher traffic volumes. The table also presents leave-one-out cross validation information criterion (LOOIC) as a measure of fit. Plots of Bayesian posterior predictions against measured crashes and injurious crashes are available by request. These plots compare one hundred simulated predictions (y rep) of incidents against the distribution of actual incidents (y) and show where predictions are most similar and different to actual crashes and injurious crashes.
Crash Modification Factors and Economic Analysis
Based on the models presented above, we also simulated the number of crashes and injurious crashes that would have been expected without any curb extensions installed. Figure 3 presents the resulting estimated crash modification factors from 6,000 posterior predictions of crashes and injurious crashes at the 94 intersections where curb extensions were installed by 2023. The average crash modification factors of 0.89 (95% CI: 0.62 to 1.22) and 0.93 (95% CI: 0.61 to 1.36) indicate that a single curb extension at intersections reduced reported crashes and injurious crashes by 11% and 7% respectively. Although the range of uncertainty crosses a crash modification factor of 1, the results nevertheless contribute to the small academic literature indicating the curb extensions likely reduce crashes and injurious crashes. Applying the Crash Modification Factors Clearinghouse’s Star Rating System ( 35 ), the analyses score four out of five stars.
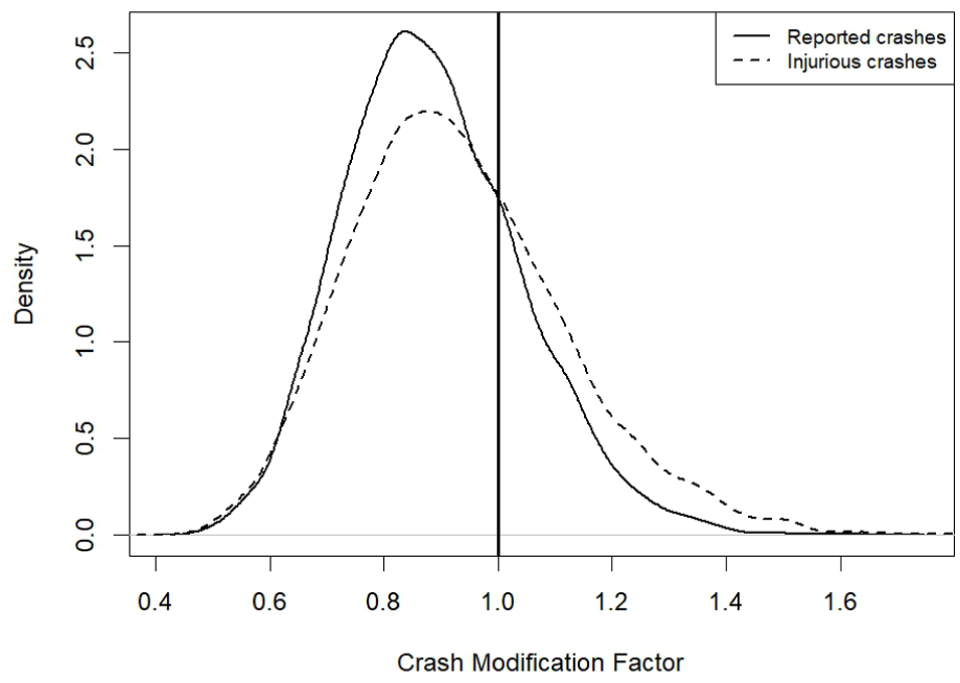
Posterior predicted crash modification factors for single curb extension at 94 intersections in Philadelphia.
The average result applied to the latest year of crash data indicates that the 94 curb extensions likely prevented just under two injurious collisions in 2024. Assuming an infrastructure life of 30 years, a 5% discount rate, consistent effects over time, and the Pennsylvania Department of Transportation’s ( 36 ) estimated average economic cost of $562,522 per injurious crash, the safety benefits of curb extensions were worth around $175,000 per curb extension. Since the share of serious and fatal injurious collisions was lower at the intersections in the dataset than throughout Pennsylvania and the costs of the most serious crashes were highest, we also applied localized crash severity weights based on the distribution of injurious crashes from 2012 to 2024. This resulted in an estimated safety benefit of $140,000 per curb extension. Assuming no serious injuries or fatalities, the value would drop to around $86,000.
All three estimates compare quite favorably with Zegeer et al.’s ( 4 ) estimated installation cost range of $2,000 to $20,000 per curb extension. At an estimated cost of $500,000 to $650,000 per drainage acre, Philadelphia’s stormwater-management-oriented curb extensions were substantially more expensive at nearly $350,000 per installation. These higher costs were associated with the subsurface drainage systems which required substantially more labor and material than installing a curb extension to a new or newly rebuilt roadway intersection. City staff estimated that a curb extension without stormwater management systems cost around $45,000 on average in Philadelphia in 2025.
Limitations
In addition to the typical limitations of before-and-after studies with controls, this statistical analysis had several specific limitations that may limit generalizability. Unlike with most traffic-safety-oriented curb extensions, the curb extensions in this study were only installed at one corner of each intersection. Thus, statistical results are likely to be on the lower end of what might be expected from full intersection daylighting with curb extensions at each corner of an intersection. The 95% credible intervals should thus be considered with caution, especially in light of findings from New York, Montreal, and New Zealand ( 20 , 25 , 26 ).
The focus on stormwater management, while ideal from the perspective of understanding the effects of installing curb extensions, may also have reduced the applicability to other contexts where installations are focused on traffic safety. In general, public agencies with limited budgets are much more likely to target curb extensions at the places where they are most expected to reduce traffic collisions and injuries. While random selection may be the gold standard for causal inference, policies are not implemented randomly, and random selection is unlikely to produce safety benefits that are as pronounced as targeted and intentional selection with a safety focus. The design and placement of individual extensions, moreover, may differ somewhat when focused on collecting stormwater as opposed to reducing speeds, turning radii, and pedestrian crossing distances. Future research could examine whether the single curb extension affects the safety of specific turning movements or traffic directions.
Perhaps as a result of this difference in sample and in contrast with other studies ( 20 , 25 , 26 ), this study did not provide information on the relationship between curb extensions and collisions involving pedestrians or more serious injuries. The sample was simply too small with just 57 collisions involving a serious injury across 363 intersections over 13 years. For context, the 10 most dangerous intersections in Philadelphia experienced 75 fatal or serious injury crashes over the same period. Since a reported crash requires injury or a towed vehicle, the findings also do not provide insight into the effects of curb extensions on minor crashes, such as fender-benders.
Finally, data limitations prevented the inclusion of estimates of vehicle or pedestrian volumes over time in the study. While there is little reason to believe that drivers are more likely to avoid or pedestrians more likely to seek out intersections with curb extensions relative to the control intersections, shifts in traffic volumes could potentially influence the reported parameter estimates.
Conclusion
In this paper, we examined the relationship between curb extensions and changes in traffic crashes and crashes involving injury. Based on posterior predictions from our estimated models, we found that intersections where curb extensions were installed saw 11% and 7% fewer reported crashes and injurious crashes over time than would have been expected without curb extensions. Although reductions were not statistically different from zero with a high degree of confidence, findings contribute to a small but growing body of evidence that curb extensions reduce crashes and injuries. Data limitations prevented us from providing statistically reliable estimates for crashes involving pedestrian injuries or fatalities and serious injuries. These reductions likely have a causally valid interpretation because of a selection process related to stormwater management and the research design. However, unlike with the Water Department’s program, safety interventions are generally located and designed more specifically to reduce traffic crashes and injuries. As a result, a more safety-focused program with full treatment of all corners of dangerous intersections would be expected to see more substantial reductions in crashes and injuries. Future research could examine differences in findings across intervention approaches that focus on safety rather than stormwater management.
From a policy perspective, the results of this study suggest that even single curb extensions at intersections may result in safety improvements. Programs designed to improve safety are likely even more effective. Curb extensions also appear to be generally cost-effective and likely to have a high benefit-to-cost ratio. Examining the number of collisions that the program likely prevented, the economic costs of collisions, and the costs of curb extensions, it appears that the safety benefits of curb extensions likely outweigh their average costs by a substantial margin. This finding also suggests that there are important synergies between traffic safety planning and green stormwater management infrastructure. Installing additional safety-oriented curb extensions in coordination with the Water Department’s efforts, for example, would likely improve safety outcomes beyond the likely cost of additional curb extensions. The program also provides an opportunity to test lower cost interventions, like the daylighting bollards deployed throughout Hoboken, NJ, as part of the city’s traffic safety plan. In any case, there is thus almost certainly some added value to coordinating safety improvements and stormwater management on city streets with the Streets Department and the Mayor’s Office of Transportation and Infrastructure Systems.
Despite the economic benefits of reduced crashes and injuries, installation and maintenance costs remain a budgetary challenge. At the current rate of 100 miles of city streets and roadways per year, it would take the city over 25 years to repave its 320 bridges and 2,525 miles of streets and highways ( 37 , 38 ). This is far longer than the repaving work can be expected to last. One suggested approach is to raise revenues from illegal parking in intersections to support investments in curb extensions. In work examining dynamic pricing for parking, for example, Shoup ( 39 ) found that business owners and residents were much more likely to support increased parking fees so long as new revenues went to local improvements.
Supplemental Material
sj-png-1-trr-10.1177_03611981261425971 – Supplemental material for The Effects of Curb Extensions on Traffic Crashes and Injuries
Supplemental material, sj-png-1-trr-10.1177_03611981261425971 for The Effects of Curb Extensions on Traffic Crashes and Injuries by Erick Guerra, Yihong Hu and Ariel Ben-Amos in Transportation Research Record
Footnotes
Acknowledgements
Marco Gorini (Philadelphia), Maureen McQuilkin (Philadelphia), Khulan Enkhbold (Penn), and Zhanchao Yang (Penn) provided data and other support. We used ChatGPT 5.2 for spellchecking the final version of the paper.
Author Contributions
The authors confirm contribution to the paper as follows: study conception and design: E. Guerra, Y. Hu, A. Ben-Amos; data collection: E. Guerra, Y. Hu, A. Ben-Amos; analysis and interpretation of results: E. Guerra, Y. Hu, A. Ben-Amos; draft manuscript preparation: E. Guerra, Y. Hu. All authors reviewed the results and approved the final version of the manuscript.
Declaration of Conflicting Interests
The authors declared no potential conflicts of interest with respect to the research, authorship, and/or publication of this article.
Funding
The authors disclosed receipt of the following financial support for the research, authorship, and/or publication of this article: Funding support was provided by the Safety21 National University Transportation Center (USDOT Award No. 69A3552344811 and No. 69A3552348316).
Supplemental Material
Supplemental material for this article is available online.
References
Supplementary Material
Please find the following supplemental material available below.
For Open Access articles published under a Creative Commons License, all supplemental material carries the same license as the article it is associated with.
For non-Open Access articles published, all supplemental material carries a non-exclusive license, and permission requests for re-use of supplemental material or any part of supplemental material shall be sent directly to the copyright owner as specified in the copyright notice associated with the article.