
Abstract
Efficient crowd management is crucial for municipalities to ensure public safety and enhance visitor experience, particularly in tourist-centric areas, such as Scheveningen Beach. Scheveningen Beach faces challenges because of the limited precision of visitor count data and the lack of accurate forecasts. Currently, crowd safety managers use their professional experience to forecast based on factors such as weather, events, and holidays, leading to inaccuracies, highlighting the need for accessible data and advanced analytics to enhance crowd management strategies. This study evaluates machine learning and deep learning models for multi-horizon hourly pedestrian crowd count forecasting, addressing the limitations of current manual prediction methods. Historical crowd data, weather, and holidays were integrated to train eXtreme gradient boosting, categorical boosting (CatBoost), light gradient boosting machine (LightGBM), long short-term memory (LSTM), and Temporal Fusion Transformer models for short-term (1-day), mid-term (7-day), and long-term (30-day) horizons. Models were developed for individual locations and as a unified multilocation approach. Performance was assessed using the coefficient of determination, root mean square error, normalized root mean square error, symmetric mean absolute percentage error, mean absolute error, and normalized mean absolute error metrics. The results showed that CatBoost was best for short-term forecasts, CatBoost and LightGBM for mid-term forecasts, and LSTM and LightGBM for long-term forecasts. Forecast performance decreases over longer time horizons in many locations, suggesting different applications: short-term forecasts for immediate operational decisions and long-term predictions for general trend analysis and strategic planning. Individual location models generally outperformed the unified approach, but at a higher computational cost. This study reveals significant spatial and temporal variability in crowd dynamics, which is crucial for optimizing resource allocation and enhancing preparedness in crowd management at Scheveningen Beach and similar tourist destinations.
Keywords
Introduction
The prevalence of crowd-related accidents has increased significantly over the past 120 years, highlighting a growing concern in urban and event management ( 1 ). This increase can be attributed to various factors, including increased population, rapid urbanization, and the inherent limitations of existing infrastructural capacities ( 2 ). Crowds are a common feature at events across various contexts, including religious, sports, entertainment, and political events, posing unique challenges for safety and risk management ( 3 ). Crowds are inherently prone to various hazards, such as stampedes, collisions, panic reactions, trampling, suffocation, and dehydration. Moreover, the complexity and variability in crowd dynamics can occur in any location or circumstances, making accurate estimation and forecasting of crowd-related risk particularly challenging ( 4 ).
Managing thousands of visitors at Scheveningen Beach, The Hague, Netherlands, is complex. This complexity arises from the need to balance visitor enjoyment with safety measures and the availability of emergency services. Accurate forecasting of pedestrian numbers over short-term (1-day), mid-term (7-day), and long-term (30-day) horizons is critical for optimizing daily, weekly, and monthly resource allocation and enhancing crowd management preparedness. For example, short-term hourly forecasting can assist crowd safety managers in the immediate real-time distribution and allocation of personnel and resources, such as security staff, medical teams, and crowd control barriers across different beach zones, which are crucial for identifying and managing immediate potential risks and preventing incidents. Similarly, mid-term and long-term hourly forecasting can help effectively plan resources and mitigate traffic congestion, parking issues, and overcrowding.
A significant challenge in crowd management at Scheveningen Beach (and other crowded areas) is the limited availability of precise data on visitor numbers. Crowd safety managers primarily rely on their professional experience to create manual crowd predictions based on weather information, scheduled events, and holiday calendars. This reliance can lead to inaccuracies in anticipating visitor volume and movement. To improve crowd management and planning strategies, there is a pressing need for accessible, precise data and advanced data analytics. Adopting a data-driven approach will enable crowd managers to plan, allocate, and manage crowds more effectively.
Numerous studies have focused on applying statistical modeling, machine learning, and deep learning techniques for traffic forecasting in the transportation sector. There is a notable gap in multi-horizon pedestrian crowd forecasting in outdoor settings across various locations. Most existing research has been tailored toward predicting vehicular traffic patterns, which, although similar, pose different challenges and require distinct approaches compared with pedestrian crowd forecasting. Pedestrian dynamics in environments such as beaches, parks, and urban plazas are inherently more complex and influenced by variables, including weather conditions, special events, holidays, and social behavior patterns ( 5 ). This complexity is especially noticeable in these environments, where the factors influencing crowds are more variable and less predictable than in structured road networks. There is an evident need for forecasting models that provide accurate predictions and are generalizable across diverse environments and time horizons.
In this study, various machine and deep learning models are evaluated for forecasting hourly pedestrian crowd counts at different locations on Scheveningen Beach for the short-term (1-day-ahead), mid-term (7-day-ahead), and long-term (1-month-ahead) horizons. Historical crowd data, weather information, and holiday periods are integrated to train machine learning (eXtreme gradient boosting [XGBoost], categorical boosting [CatBoost], and light gradient boosting machine [LightGBM]) and deep learning models (long short-term memory [LSTM] and Temporal Fusion Transformer [TFT]) for individual locations and a unified multilocation model to assess the generalizability of the model. The models’ performance was evaluated using the coefficient of determination (R2), symmetric mean absolute percentage error (SMAPE), root mean square error (RMSE), mean absolute error (MAE) metrics, normalized mean absolute error (NMAE) and normalized root mean square error (NRMSE) by evaluating varying input and prediction window sizes.
The main contributions of this study are as follows.
Comprehensive multi-horizon model evaluation: Machine and deep learning models are evaluated for short, mid, and long-term pedestrian crowd count forecasting and their generalizability across different locations and forecasting horizons is demonstrated.
Integrated data sources: Historical crowd data, weather information, and holiday periods are integrated to enhance the forecasting models’ performance.
Performance insights and resource optimization: Best-performing models for different forecasting horizons (CatBoost was best for short-term forecasts, CatBoost and LightGBM for mid-term forecasts, and LSTM and LightGBM for long-term forecasts) are identified, and insights are provided for crowd management and planning.
This study progresses through key sections: Related Works, Research Approach, Results, Discussion and Conclusion. A comprehensive literature review is performed, and then details of the methodological framework, including data set analysis, feature selection, engineering, and experimental design, follow. The Results section presents and analyzes experimental outcomes, and the final section interprets the findings, discusses implications, summarizes this study, and proposes future research directions, aligning with the initial objectives and discoveries.
Related Works
Previous studies on pedestrian crowd forecasting have employed a range of methods, from traditional statistical approaches to advanced machine learning and deep learning models. This section reviews the relevant literature on pedestrian crowd forecasting, focusing on methodologies that are promising for handling multi-horizon predictions and multivariate outputs.
Traditional statistical methods have long been used as the baseline for time series forecasting, including pedestrian crowd forecasting. Among these, the Naive Seasonal Model (weekly and yearly) stands out as a simple yet effective baseline for comparison ( 6 ). This model assumes that the forecast for a given period will equal the last observed value from the same season (e.g., the same day of the week or the same day of the year). It often serves as a strong benchmark, especially in data sets with strong weekly or annual seasonality. Traditional statistical methods, such as linear regression, autoregressive integrated moving average (ARIMA), and seasonal autoregressive integrated moving average (SARIMA), have been widely used for short-time series forecasting in various domains, including pedestrian crowd count ( 7 , 8 ). However, these models assume linear relationships between past and future values, which do not always hold in pedestrian crowd dynamics on beaches, where dynamics can be highly nonlinear because of sudden events, weather changes, or social interactions. In addition, ARIMA and SARIMA rely on the target variable’s historical values and struggle to incorporate external variables. These methods provide a solid baseline, but they often struggle to capture nonlinear relationships in crowding data, limiting their effectiveness for multi-horizon forecasting.
Machine learning approaches have demonstrated superior performance in capturing nonlinear patterns and handling multiple input and output variables. Random forest has been successfully applied to pedestrian count prediction in Melbourne, Australia ( 9 ), demonstrating the potential of ensemble methods in this domain. Building on this success, gradient-boosting algorithms have emerged as powerful tools for time series forecasting. XGBoost has shown significant performance in predicting pedestrian crowd counts ( 10 ) at Scheveningen Beach when trained with weather attributes. Similarly, LightGBM was used to forecast short-term traffic flow at several road sections in Changsha City ( 11 ). This success suggests that other advanced gradient boosting algorithms, such as CatBoost, may also be effective.
Deep learning models have also shown significant potential for capturing complex temporal dependencies in time series data. LSTM has been successfully applied to long-term pedestrian crowd forecasting and traffic flow prediction ( 12 – 14 ) because of its ability to capture long-term dependencies in sequential data. Other models, such as spatiotemporal graph convolutional networks ( 15 ) and graph-convolution-embedded LSTM ( 16 ), have shown strong performance in traffic forecasting. However, they often have complex data requirements that may not be readily available or applicable in all pedestrian crowd forecasting scenarios. Recent advances in deep learning have led to the development of more sophisticated architectures. The TFT ( 17 ) represents a significant step forward in multi-horizon forecasting. The TFT combines the strength of transformers in capturing long-range dependencies with the ability to handle different inputs and outputs for multi-horizon forecasting.
Several studies have highlighted the importance of integrating diverse data sources for improved forecast accuracy. For instance, incorporating environmental conditions, such as wind speed, temperature, and rainfall, alongside traffic flow data has enhanced prediction quality ( 9 – 11 ). This study builds on this approach by integrating historical crowd data, weather information, and holiday periods.
The literature reveals a gap in studies that evaluate model performance across multiple forecasting horizons (short, mid, and long-term) and assess generalizability across different locations. Significant progress has been made in pedestrian crowd forecasting, but further research is needed on multi-horizon predictions, multivariate outputs, and the integration of diverse data sources to improve model accuracy and applicability across various environments.
Research Approach
This study employs a comprehensive research approach to forecast hourly pedestrian crowd counts at Scheveningen Beach. First, data collection, feature selection, and engineering are performed, utilizing historical pedestrian data, weather information, and holiday calendars. Then, multiple forecasting models are implemented and compared. Model training methods are elaborated on, focusing on multi-horizon, multivariate output forecasting using a sliding window approach. Finally, model performance is evaluated using multiple metrics. This structured approach allows different forecasting techniques to be analyzed and compared systematically.
Data Set
This study uses an extended version of the historical pedestrian crowd count data set for Scheveningen Beach, the weather data set (temperature, precipitation rate, precipitation chance, wind speed, wind direction, global radiation, and cloud cover) used by the study ( 10 ), and the Netherlands Public Holiday calendar for forecasting pedestrian counts. This study utilizes a data set with an hourly resolution from April 1, 2021, to November 17, 2023. The pedestrian crowd count data set, generated by RESONO (https://reso.no/), includes counts collected, preprocessed, and aggregated based on the number of smartphones detected at Scheveningen Beach using anonymous information from various mobile applications. Of note, these counts serve as an approximate proxy and do not represent real-time pedestrian crowd counts because they only account for smartphone detections. The weather data set was collected from the Royal Netherlands Meteorological Institute. The data set includes data for 17 locations at Scheveningen Beach, The Hague, Netherlands, namely the Beach Stadium, Central Boulevard, North Boulevard, South Boulevard, The Pier, Public Transport (Kurhaus), Public Transport (Strandweg), Public Transport (Zwarte Pad), Entire Scheveningen, Central Beach, North Beach, South Beach, Entrance Gevers Deynootweg, Entrance Kurhaus, Entrance Scheveningseslag, Entrance Zeekant, and Entrance Zwarte Pad, as shown in Figure 1. The location, Entire Scheveningen, spans the area of Scheveningen Beach, and the choice of the other 16 locations was strategic, ensuring diverse pedestrian social dynamics. The sites spanned various recreational areas and restaurants (The Pier), boulevards, several beach locales, entrances, public transportation, and the Beach Stadium.
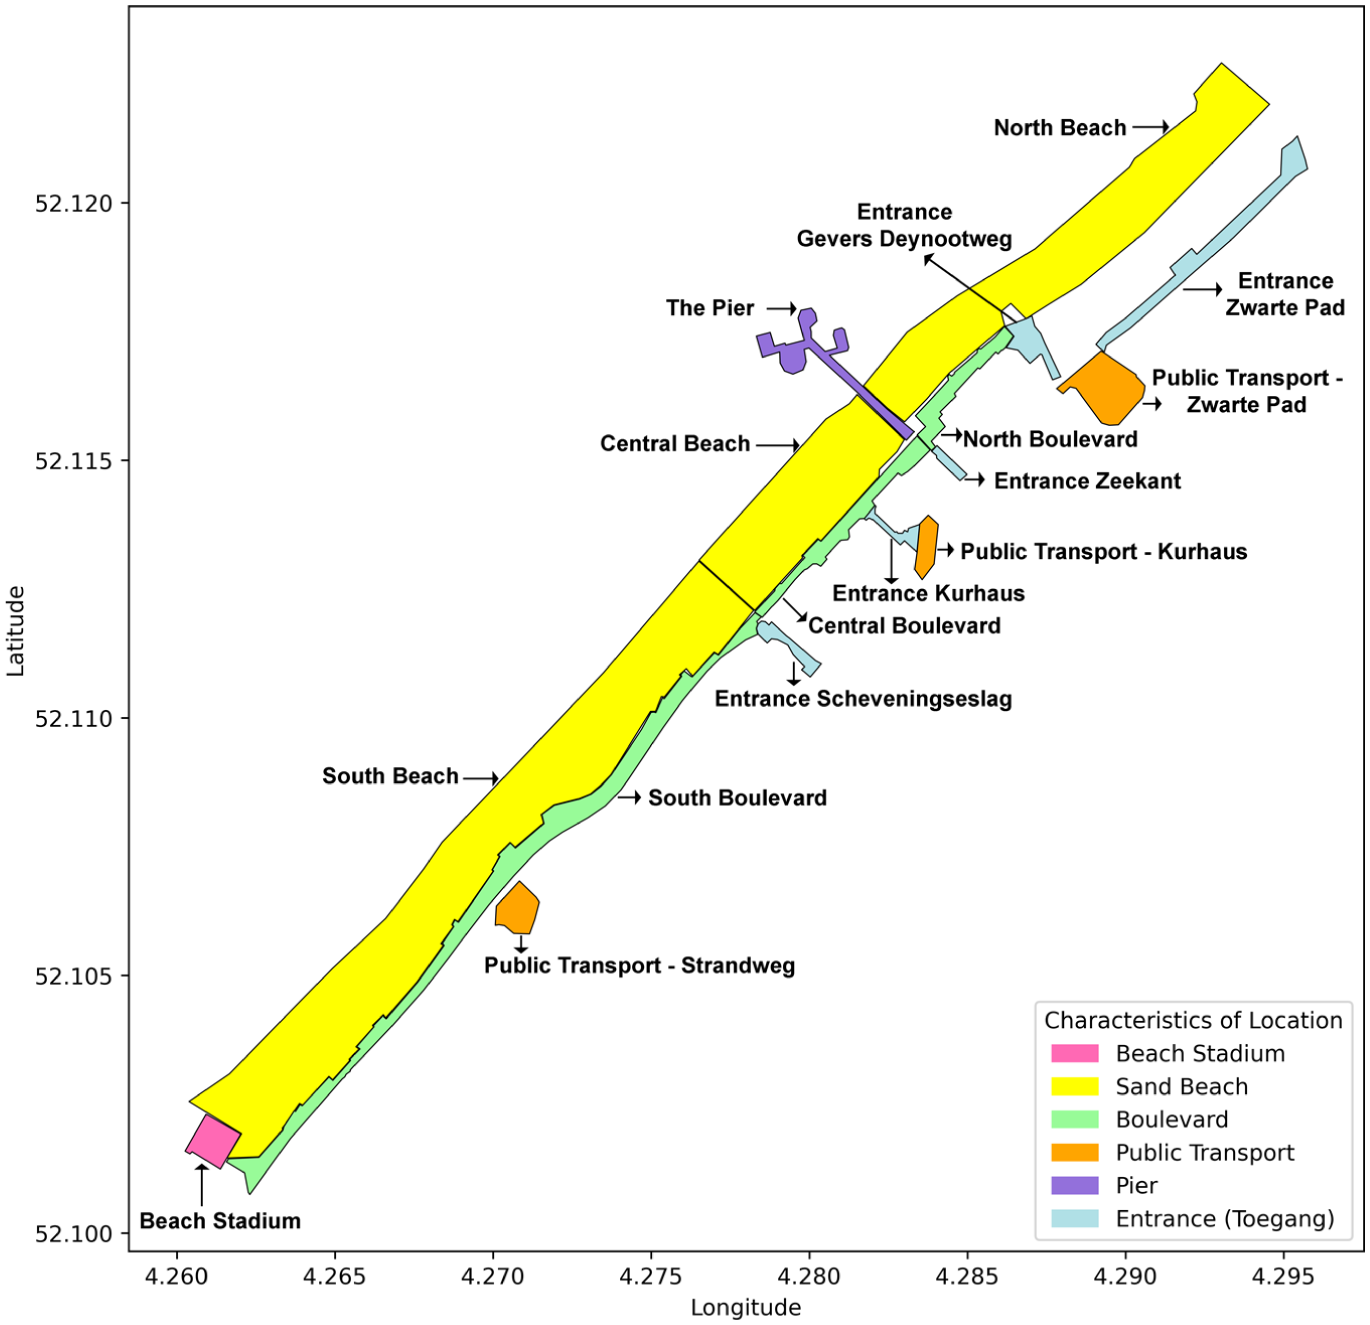
Map of Scheveningen Beach with locations based on different characteristics.
Feature Selection and Engineering
The selection of features for training influences forecasting performance. A systematic approach is followed to identify the most relevant features and create new ones to enhance the model’s performance. The feature selection and engineering process involves identifying potential influencing factors from the literature, assessing data availability, performing Spearman’s rank correlation analysis, selecting promising features, and engineering additional features.
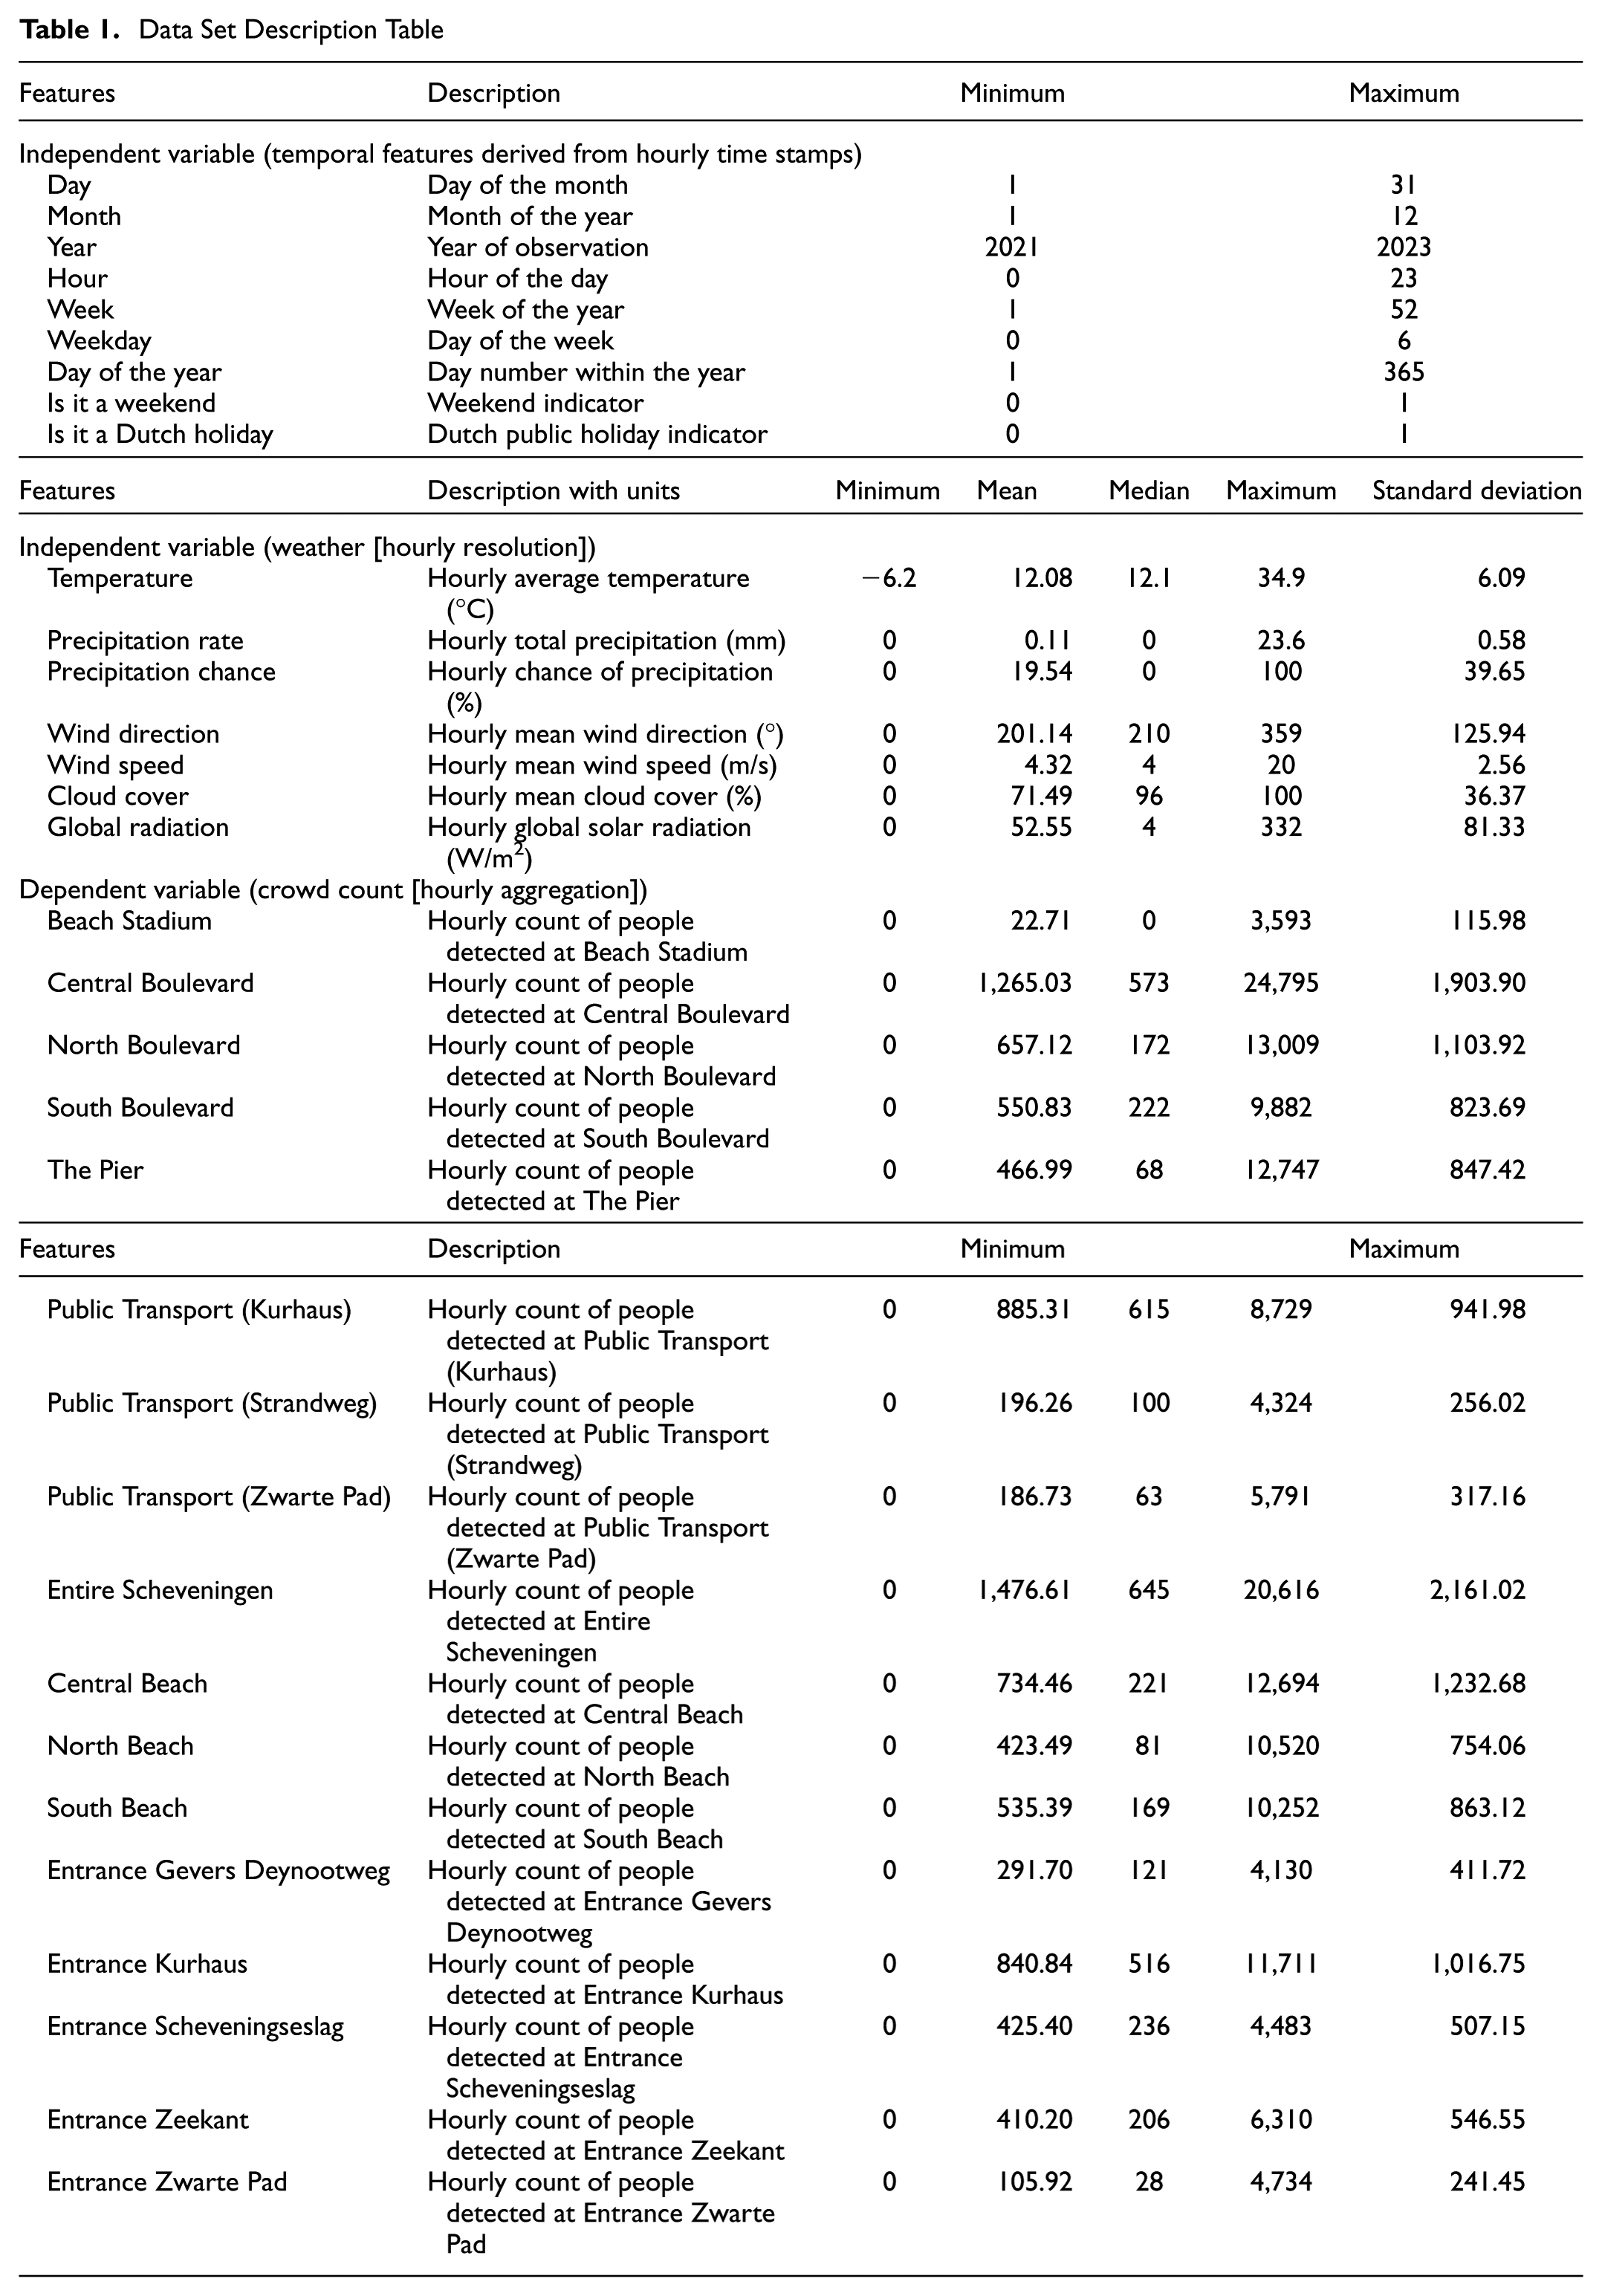
Based on previous studies, several factors that potentially influence pedestrian crowd counts at Scheveningen Beach were identified. These include temporal factors such as time of day, day of the week, month, season, and holidays; weather conditions such as temperature, precipitation rate, precipitation chance, wind speed, wind direction, global radiation, and cloud cover; and location-specific characteristics. Additional temporal features were created from the data set’s time stamps, including day, month, year, hour, week, weekday, day of the year, and whether it is a weekend. To provide a clearer understanding of the data set used, Table 1 summarizes the independent (temporal and weather) and dependent variables used in this study, reporting summary statistics and ranges for continuous weather, crowd count, and temporal variables.
Data Set Description Table
Spearman’s rank correlation analysis was performed to quantify the relationship between potential features and pedestrian crowd counts. This analysis helps to identify the strength of linear and nonlinear monotonic relationships between features and the target variable. Figure 2 shows a heatmap of Spearman’s correlation for specific features that affect various areas of Scheveningen Beach.
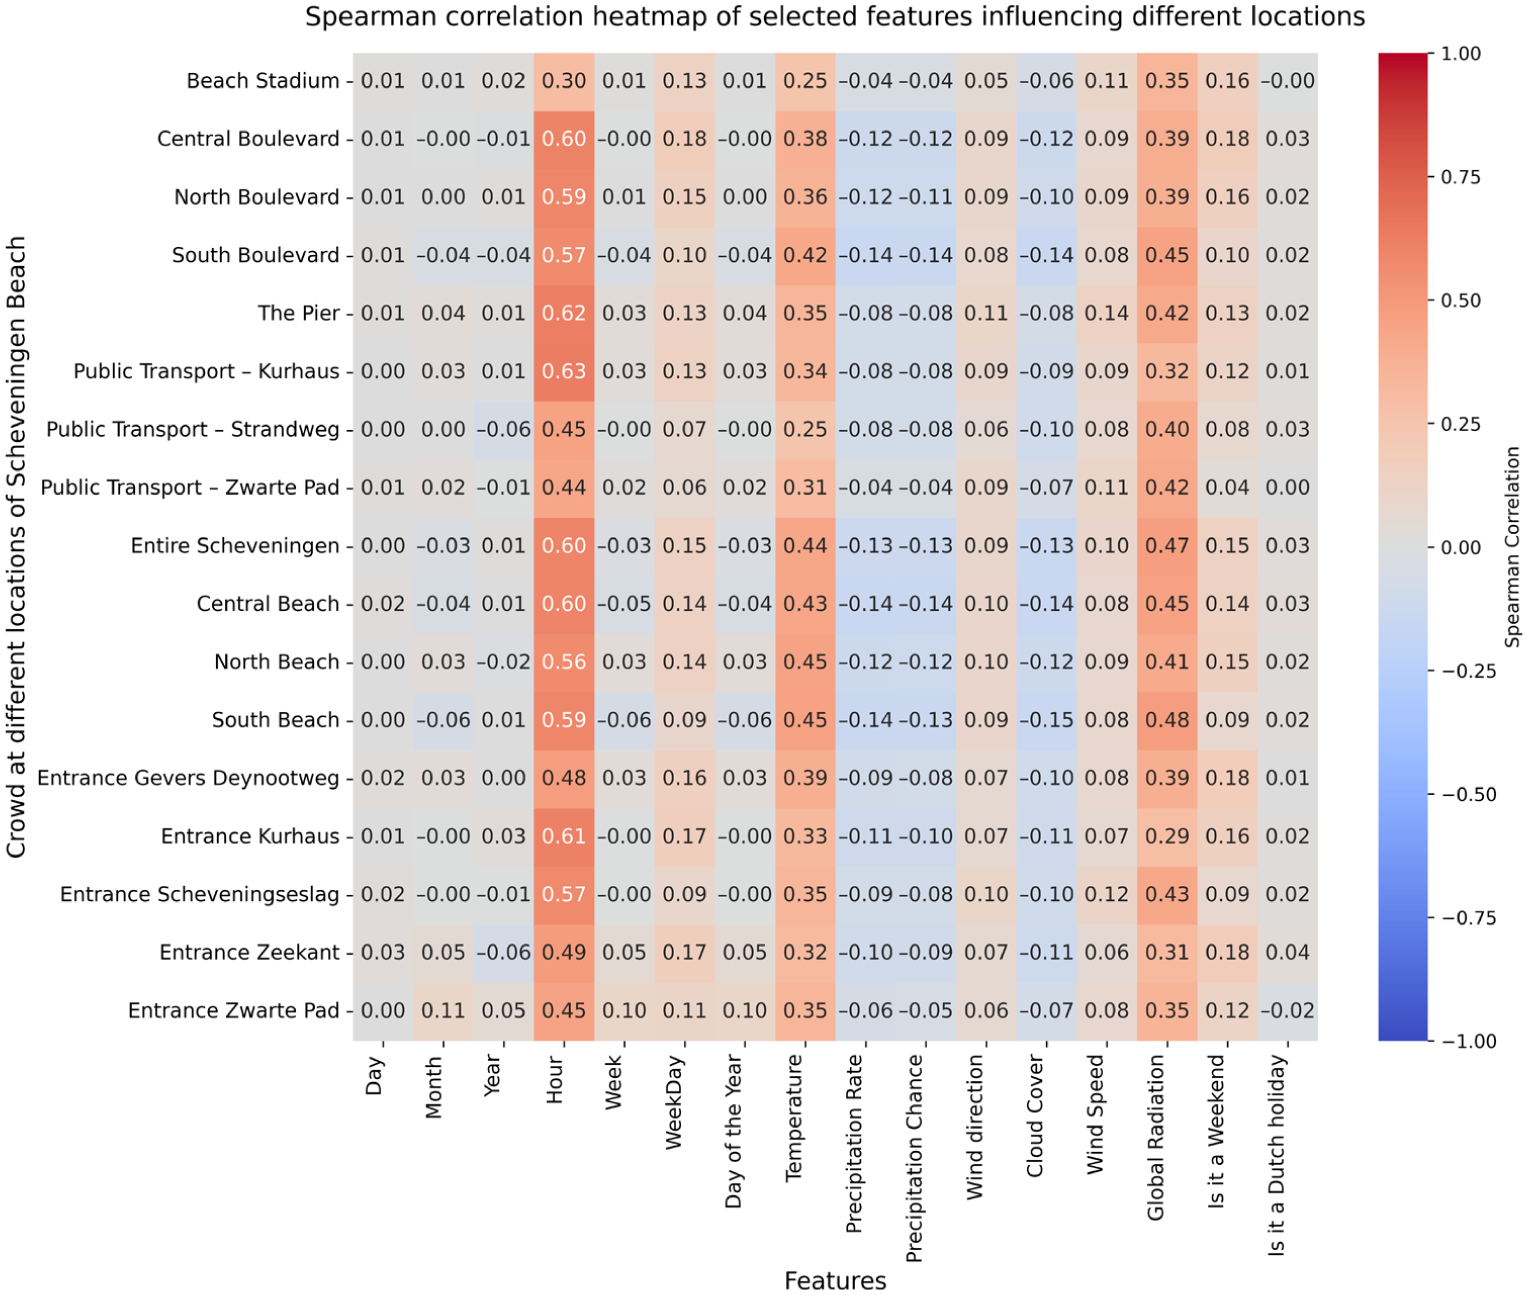
Heatmap illustrating Spearman’s correlation between selected features and crowd data from different locations on Scheveningen Beach.
Key findings from the correlation analysis revealed the highest correlations (close to 0.6) between the hour of the day and crowd counts at locations such as Public Transport (Kurhaus), The Pier, Entire Scheveningen, and Central Beach, suggesting that crowd levels are significantly influenced by the time of day. The positive correlations of temperature, global radiation, and whether it is a weekend with crowd counts reflect that warmer, sunnier weather and weekends tend to attract more people to Scheveningen Beach. Precipitation rate, precipitation chance, and cloud cover negatively correlate with crowd counts because rainy, overcast conditions typically discourage beach attendance. Day, month, year, and weekday showed weak correlations because crowd patterns are more directly influenced by immediate factors such as weather and weekends rather than by these broader temporal categories. Features with consistently weak correlations (day, month, year, and weekday) were discarded to reduce dimensionality and mitigate potential overfitting.
Then, to capture comprehensive temporal dependencies, lag features were created for all dynamic variables in the data set. Lag peaks identified with the autocorrelation function often yield the most accurate results when used as the input window size for forecasting ( 7 ). Autocorrelation analysis on the crowd count data revealed significant daily (24-h) and weekly (168-h) cycles, as shown in Figure 3.
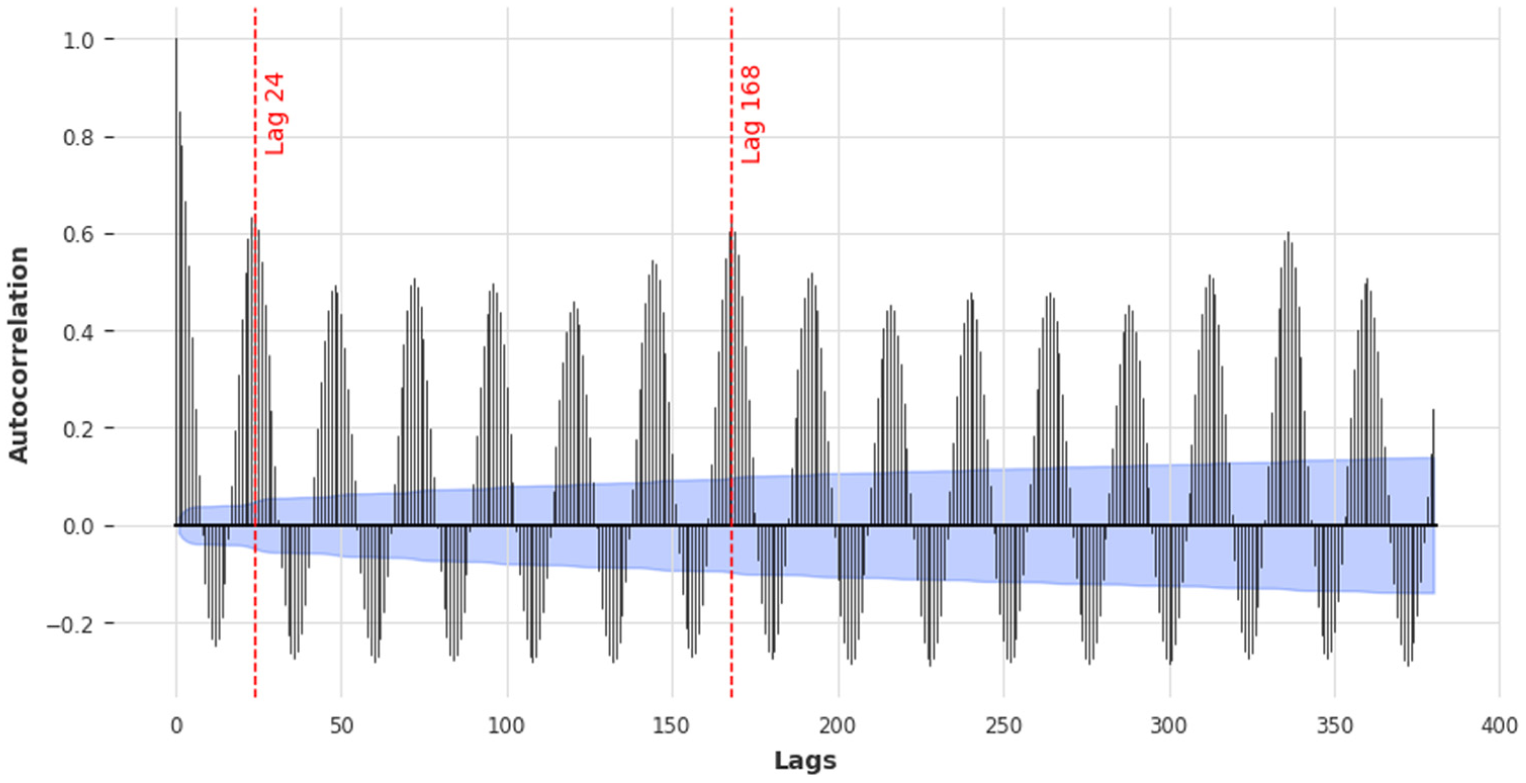
Autocorrelation plot highlights peak daily (lag 24) and weekly (lag 168) cycles in pedestrian crowd count at Entire Scheveningen, with a 95% confidence interval shown in blue.
Based on these findings, two distinct sets of lagged input features were constructed to test their effectiveness. The first set included all hourly lag values from the previous 24 h (i.e., lags 1, 2,…, 24 h), and the second set included all hourly lag values from the last 168 h (i.e., lags 1, 2,…, 168 h) of the crowd count, weather conditions, and temporal indicators. This approach allowed the empirical determination of whether a shorter or longer history of the target variable was more predictive across different forecasting horizons. The final feature set used for model training combined one of these two lag configurations with the engineered temporal features and weather-related features. This extensive feature engineering provides the models with a rich, multivariate historical context, enabling them to implicitly learn complex daily, weekly, and seasonal patterns from the collective behavior of all these variables, rather than relying solely on the recent history of the crowd count itself.
All the features (temporal, weather, and crowd count) were transformed using Z-score standardization, with parameters μ and σ computed on the training set to prevent data leakage, as shown in the following equation:

where μ and σ represent the mean and standard deviation of data x to compute the standardized value x*. Z-score scaling is preferred over normalization ( 18 ) because the latter compresses heavy-tailed, unbounded variables, such as crowd counts, into a narrow [0, 1] interval, hindering interpretability and transferability. Z-score standardization preserves linear relationships, yields dimensionless values, and remains fixed once μ and σ are set. Figure 4 shows a sample of the standardized weather and pedestrian crowd data for Entire Scheveningen Beach, plotted over 5 days (September 18–23, 2021). In Figure 4, the values are from roughly −2 (less crowded nights) to +4 (a busy, sunny afternoon on September 19), and most weather covariates lie within ±2. In addition, the interval [−2, 4] shown in Figure 4 arises naturally from the selected subset and is not an imposed scaling limit.
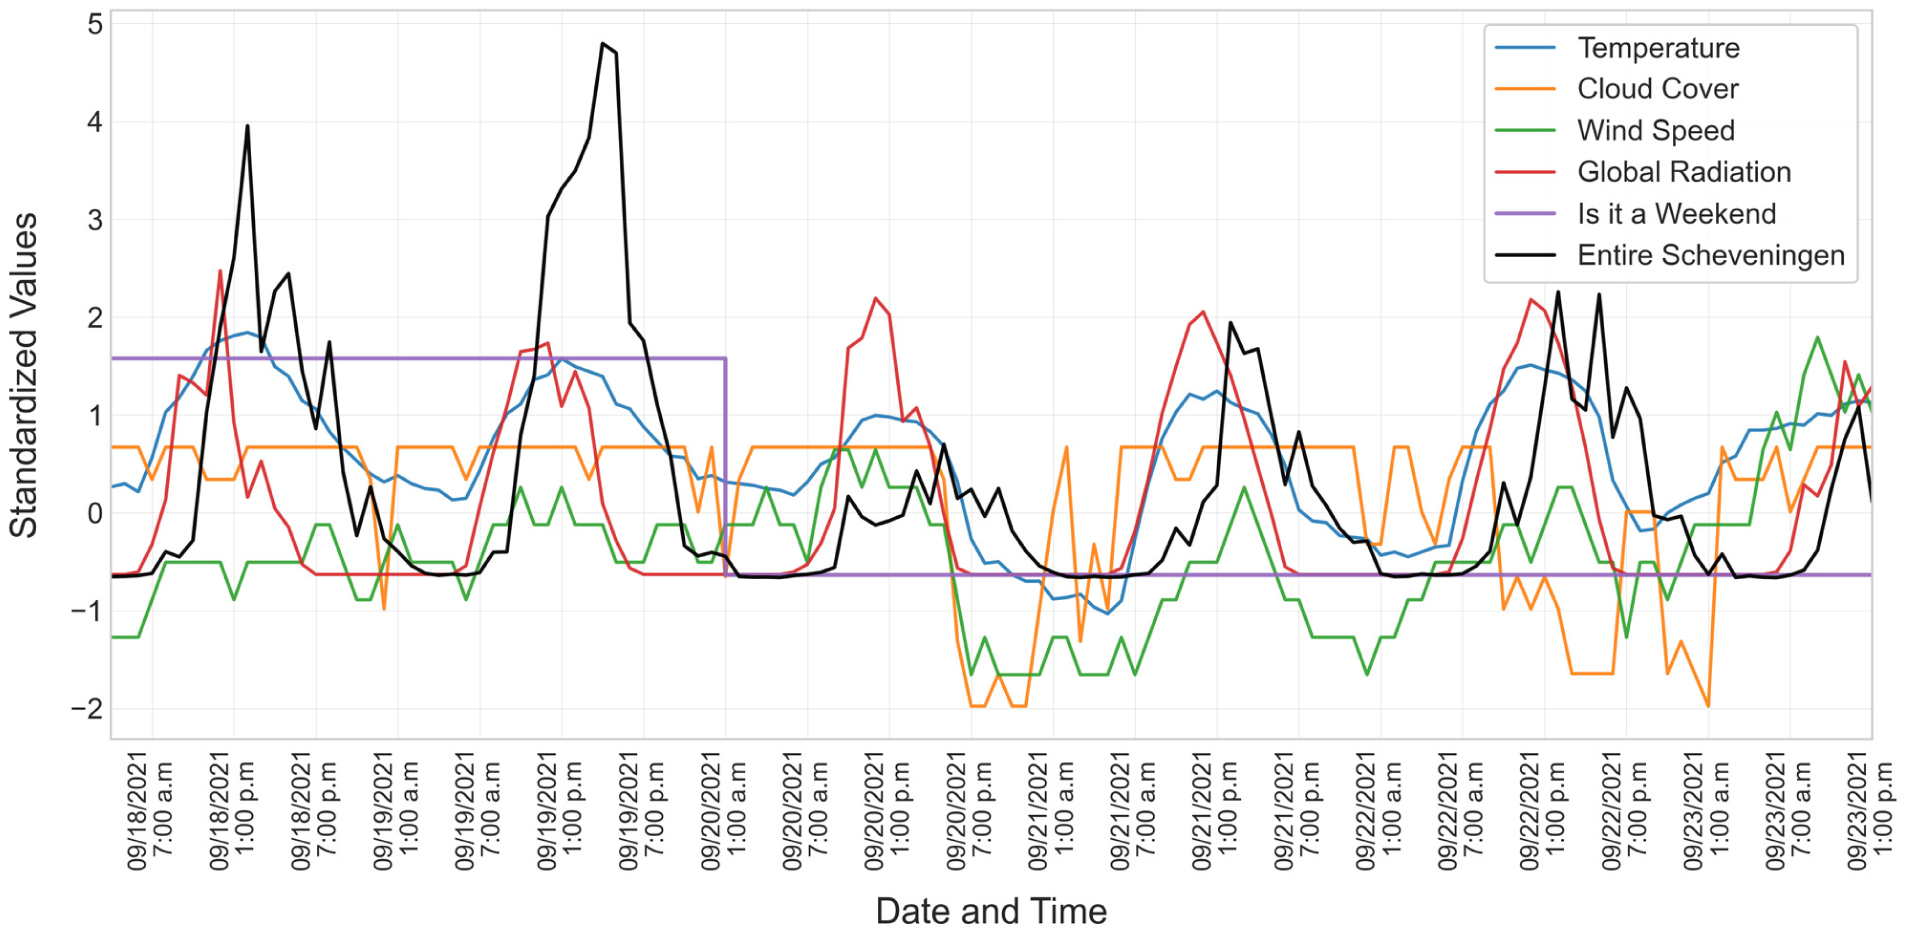
Standardized pedestrian crowd counts and weather data for 5 days for Entire Scheveningen Beach, with values standardized to a consistent scale (mean = 0) for comparison.
The final feature set included the lagged features (24 and 168-h lags) of selected temporal features (hour, week, day of the year, is it a weekend, and is it a Dutch holiday), weather-related features (temperature, precipitation rate, wind direction, cloud cover, wind speed, and global radiation), and crowd count data for different locations.
Model Implementation
This section provides an overview of the methods used to forecast pedestrian crowd counts, specifically tailored to the data set used in this study. Three techniques are employed to train and evaluate crowd forecasting results: (1) statistics-based models; (2) machine learning-based models; and (3) deep learning-based models. Based on the literature review, as discussed in the Related Works section, several models have been identified that warrant further investigation: (1) statistics-based models (Naive Seasonal Model); (2) machine learning models (XGBoost, CatBoost, and LightGBM); and (3) deep learning models (LSTM and TFT).
Statistics-Based Forecasting Model
Historically, statistics-based methods have formed the foundation of time series analysis and remain relevant for their simplicity, interpretability, efficiency, and ability to capture fundamental patterns in data. They offer a point of comparison for more complex methods and help to highlight their added value. In this study, seasonal naive forecasting methods are used as statistical baselines to benchmark machine learning and deep learning models.
Naive Seasonal Forecasting
Naive forecasting methods serve as essential benchmarks to validate the effectiveness of more complex models. A robust model should significantly outperform these simple, rule-based approaches. Based on the intense daily, weekly, and yearly cycles identified in the autocorrelation analysis, three naive models were implemented to serve as benchmarks for different forecast horizons.
Naive Daily Forecast: This model is used as the benchmark for the short-term (24-h) forecast horizon. It assumes that the crowd count for a specific hour will be the same as the crowd count at the same time on the previous day. For example, the forecast for 02:00 p.m. on Wednesday is the observed value from 02:00 p.m. on Tuesday (a 24-h lag).
Naive Weekly Forecast: This model serves as the primary benchmark for the mid-term (168-h) forecast horizon. It operates on the assumption that crowd patterns repeat every week. The forecast for a given hour and day of the week is the observed value from the same hour and day of the previous week (a 168-h lag). This benchmark is particularly relevant for capturing recurring patterns on weekends and weekdays.
Naive Yearly Forecast: To provide a broader context on long-term seasonality, a yearly model was implemented. The forecast for a specific hour and day is the observed value from the same hour and day in the previous year. The machine learning models in this study were not trained for yearly predictions; this benchmark helps illustrate the strength of annual patterns related to holidays and seasons.
It is important to note that a Naive Monthly Forecast (using a 30-day lag) was not considered because this is not a standard time series benchmark, and preliminary analysis showed a very weak correlation between hourly crowd counts with a 30-day lag. The Naive Daily and Weekly models provide the most direct and meaningful performance baselines for the short-term and mid-term forecasting scenarios, respectively.
Machine Learning-Based Forecasting Model
The machine learning-based approach started gaining attention because it can handle larger data sets and uncover more complex patterns than traditional statistical methods without requiring explicit specification of the underlying processes. Among various machine learning techniques, gradient-boosted methods, such as XGBoost, CatBoost, and LightGBM, were selected for this study because of their proven effectiveness in time series forecasting and their ability to handle large data sets with high-dimensional features efficiently.
Gradient boosting methods, such as XGBoost, CatBoost, and LightGBM, are ensemble learning techniques that build predictive models sequentially by combining multiple decision trees. The core idea behind gradient boosting is to iteratively reduce prediction errors by focusing on residuals, the difference between observed and predicted values. As shown in Figure 5, the process begins with training an initial decision tree T1 using the input data and calculating the loss (Step 1). A subsequent decision tree T2 is trained on the residuals (errors) of the first tree, aiming to minimize the loss further (Step 2). This process continues, where each new tree focuses on reducing the remaining residual errors from the previous iteration, and additional trees (T3,…, Tn) are added sequentially until the loss converges (Step 3). The predictions from all the trees are then combined to produce the final ensemble prediction. The iterative nature of gradient boosting enables the method to capture complex, nonlinear patterns in the data while progressively improving accuracy. This makes it particularly suitable for crowd forecasting tasks, where factors such as weather conditions, temporal variations, and crowd dynamics exhibit strong nonlinear relationships.
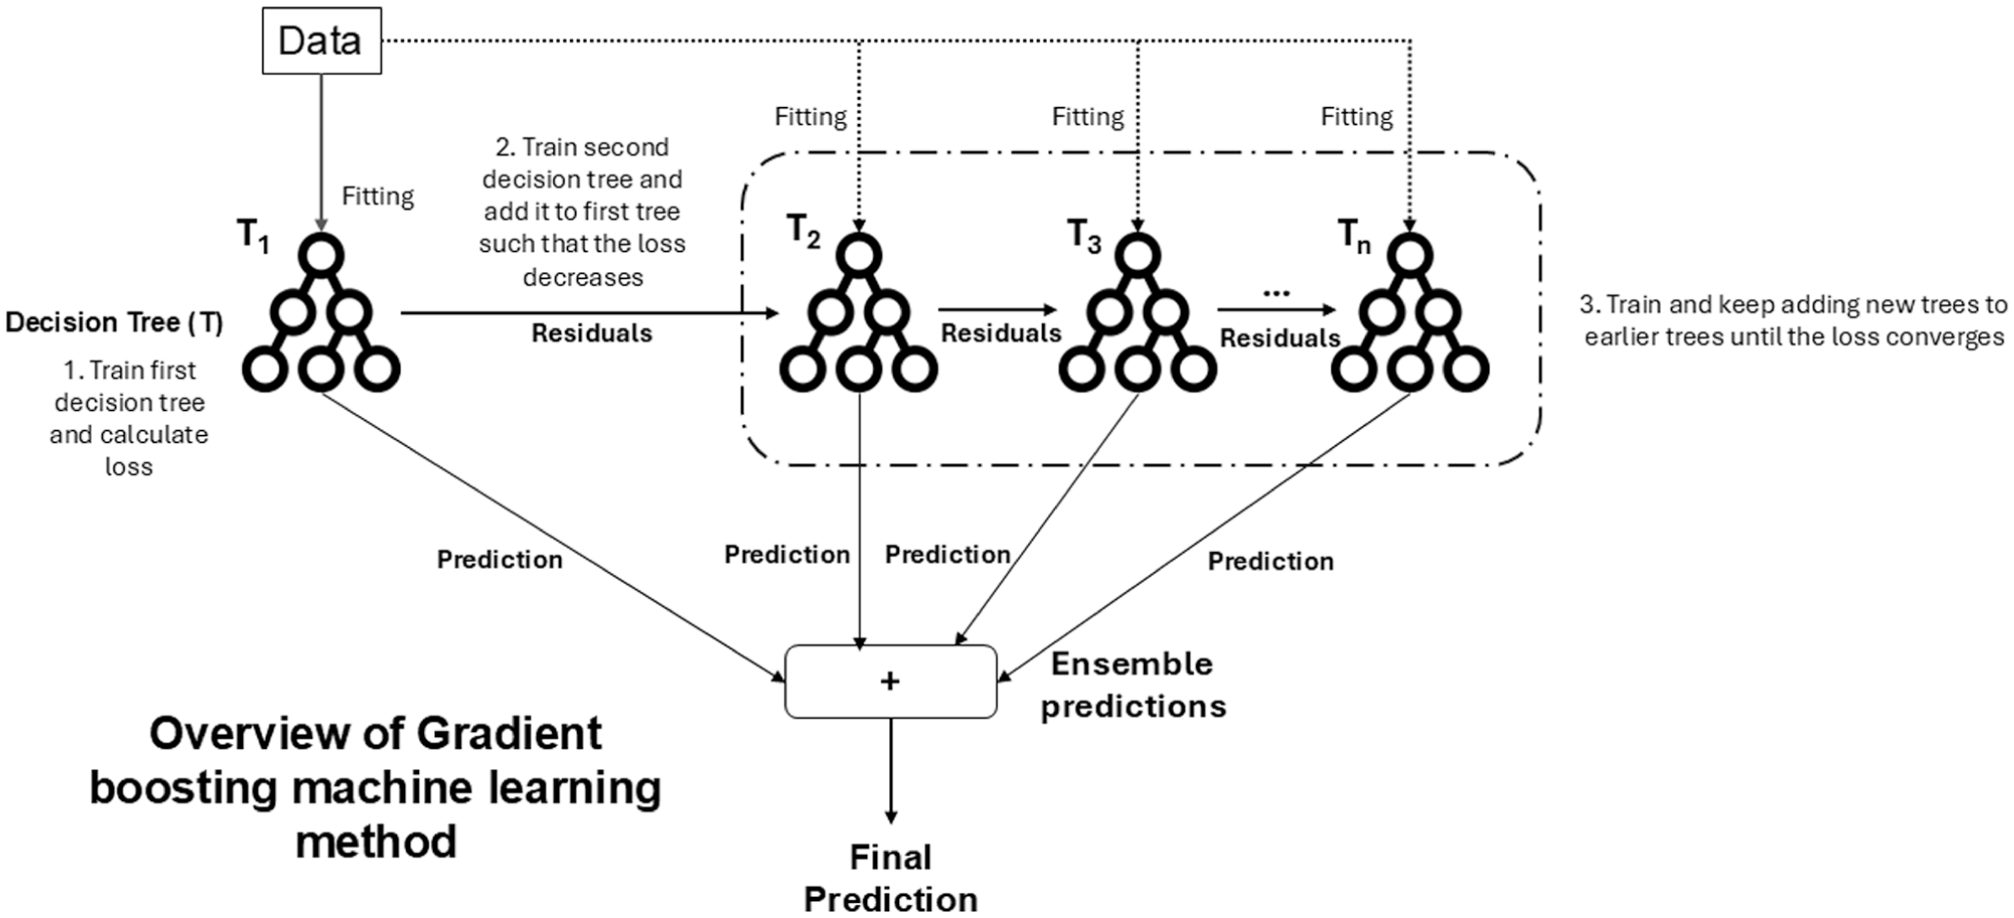
Overview of the gradient boosting process used in the machine learning models.
XGBoost, CatBoost, and LightGBM all share this foundational boosting principle; their internal architectures and optimization strategies differ significantly. These differences in tree construction, data handling, and computational efficiency are critical to their performance in different scenarios.
XGBoost ( 19 ) is a highly optimized and versatile implementation that is often considered a benchmark in machine learning competitions. It employs a level-wise (breadth-first) tree growth strategy, building the tree layer by layer and splitting all nodes at the current depth before proceeding to the next. This systematic approach can result in more balanced trees and may be less prone to overfitting on smaller datasets. XGBoost’s power stems from its advanced features, including built-in L1 (Lasso) and L2 (Ridge) regularization to control model complexity, a novel sparsity-aware algorithm that allows for the efficient handling of missing data, and a theoretically justified weighted quantile sketch for finding optimal split points on large data sets.
CatBoost’s ( 20 ) main distinguishing feature is its advanced and native handling of categorical features, which are prevalent in time series datasets (e.g., day of the week or holiday status). Traditional methods often require extensive preprocessing, such as one-hot encoding, which can lead to a “curse of dimensionality” with high-cardinality features. CatBoost addresses this with a novel algorithm called ordered boosting, a permutation-driven approach that significantly reduces prediction shift and overfitting caused by target leakage. Furthermore, CatBoost builds symmetric (or oblivious) decision trees, where all nodes at the same depth level share the same splitting criterion. This symmetric structure acts as a form of implicit regularization, preventing the model from becoming too complex and enabling extremely fast prediction times once the model is trained.
LightGBM ( 21 ): In contrast to XGBoost, LightGBM is engineered for exceptional speed and efficiency, particularly with large-scale data. Its primary architectural difference is the use of a leaf-wise (or best-first) tree growth strategy. Instead of growing horizontally, LightGBM expands the tree by splitting the leaf that yields the largest reduction in loss. This approach allows the model to converge much faster and often achieves a lower overall loss, although it can risk creating overly complex and deep trees that may overfit if not properly regularized. To achieve its remarkable efficiency, LightGBM introduces two innovative techniques: (1) gradient-based one-sided sampling, which reduces the data set size by focusing on instances with larger gradients (i.e., those that are poorly trained); and (2) exclusive feature bundling (EFB), which groups mutually exclusive features to reduce the feature space dimensionality without information loss.
Deep Learning-Based Time Series Forecasting
Recently, deep learning-based models have gained prominence for their ability to capture complex long-term dependencies in time series data. Unlike traditional methods or machine learning models that rely heavily on manual feature engineering, deep learning approaches can extract features directly from raw input data, making them highly effective for multi-horizon crowd forecasting tasks. In this study, we focus on two prominent deep learning architectures: LSTM networks and TFT, to assess their multi-horizon forecasting capabilities.
Long Short-Term Memory
LSTM ( 22 ) networks are particularly well-suited for time series forecasting because they can remember previous information for extended periods. LSTM networks are a type of recurrent neural network (RNN) designed to overcome the limitations of traditional RNNs, particularly the vanishing gradient problem, which hinders the learning of long-term dependencies. LSTMs achieve this by incorporating specialized memory cells and three gating mechanisms, input, forget, and output gates, that regulate the flow of information throughout the network. The input gate determines which new information is added to the memory cell, the forget gate decides which information is discarded, and the output gate controls what information is propagated to the next time step. This ability to selectively “remember” and “forget” information over long sequences makes LSTMs particularly effective for crowd forecasting, where short-term variations (e.g., daily crowd peaks) and long-term trends (e.g., weekly patterns) need to be captured. This enables LSTMs to capture short- and long-term patterns in pedestrian crowd data, which is crucial for accurate multi-horizon pedestrian crowd forecasting.
Temporal Fusion Transformer
TFT ( 17 ) represents a significant advancement in deep learning for time series forecasting, particularly relevant to multi-horizon pedestrian crowd prediction at Scheveningen Beach. This architecture ingeniously combines elements from traditional forecasting methods with the attention mechanism popularized by transformer models in natural language processing. The architecture includes several key components that enhance its performance. Variable selection networks dynamically select the most relevant input features, ensuring that the model focuses on the most influential predictors while reducing computational overhead. Static covariate encoders capture fixed attributes, such as location-specific characteristics, which remain constant over time. Temporal self-attention layers allow the model to identify critical time steps within the input sequence, enabling it to focus on short-term events or anomalies that influence future forecasts. In addition, gated residual networks facilitate smooth information flow throughout the model, improving its ability to capture nonlinear dependencies and enhancing overall interpretability. The TFT can process diverse inputs, including static, dynamic, and temporal features, and generate forecasts across multiple horizons. Its attention-based mechanism also provides insights into feature importance, helping identify which variables, such as temperature, wind speed, or day of the week, contribute most to the predictions. While computationally intensive, TFT’s flexibility, accuracy, and interpretability make it well-suited for multi-horizon forecasting, particularly valuable for predicting crowd sizes at future time steps at Scheveningen Beach, facilitating improved resource allocation and crowd management strategies.
Model Training
A sliding window methodology was adopted to prepare and process temporal data to train and test the forecasting models, as shown in Figure 6. The sliding window approach is essential for handling time series data, ensuring models learn patterns effectively using historical input windows to predict future outputs.
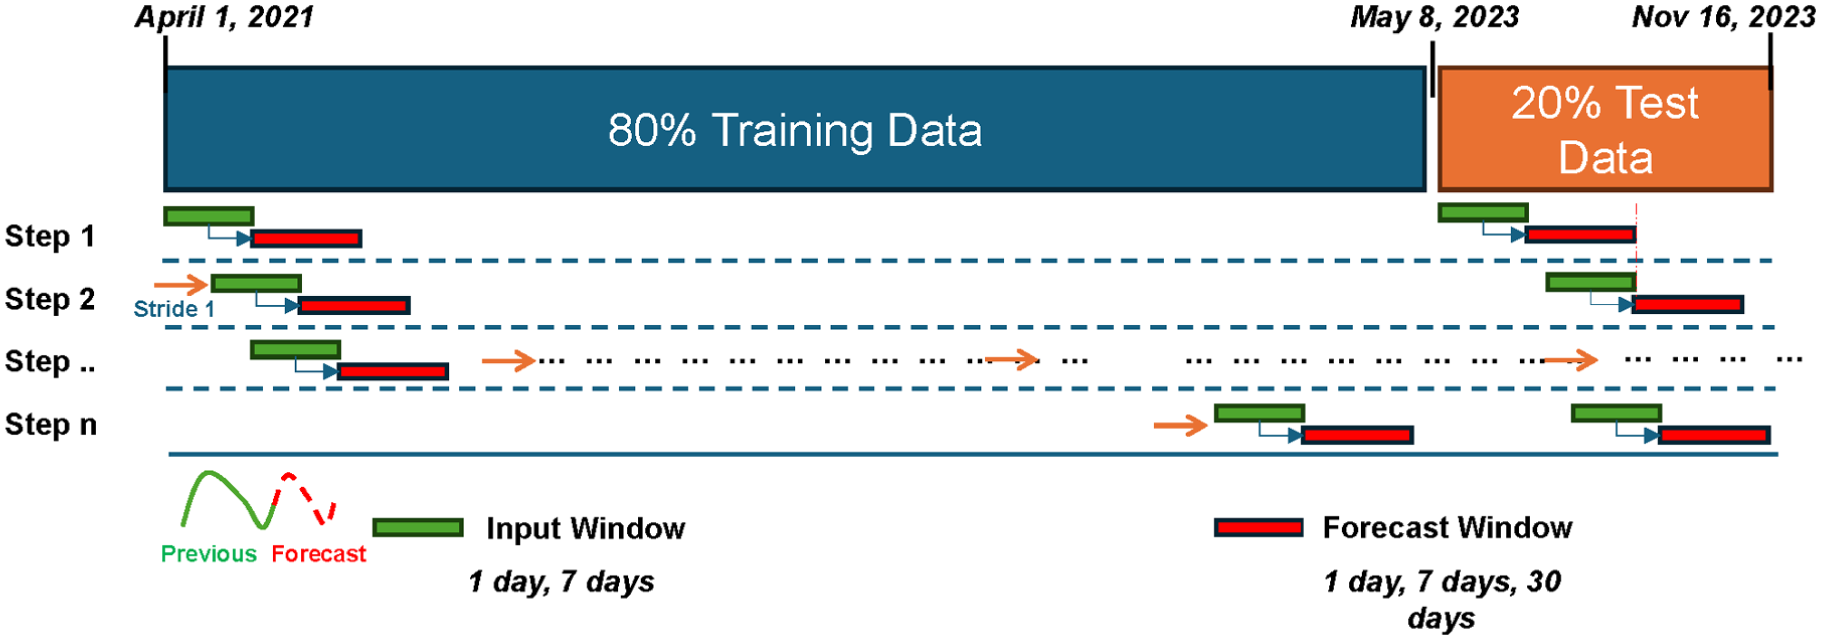
Sliding window method for training and testing crowd count forecasting models.
The data set was split chronologically into 80% (18,400 hourly time steps) for training and 20% (4,631 hourly time steps) for testing, with the split boundary on May 8, 2023. During the training period, a time-ordered validation split was created by setting aside the last 15% of the training data for validation and the first 85% for model fitting, to support hyperparameter tuning and early stopping without leaking future information. This split ensures that the models are trained on historical data and tested on unseen future data to assess generalizability. The sliding window technique works by systematically generating overlapping input and forecast windows. The fixed-size input (green) represents a fixed segment of historical data that serves as the model’s input features. Following the input window is the forecast window (red), which is the target segment the model aims to forecast. At each step, the input window advances through the time series by a fixed stride, set to one time step (1 h) in this study. The process continues sequentially, step by step, until the entire data set has been covered. This systematic movement ensures that all data points contribute to model training and evaluation, while allowing the model to learn patterns across different sections of the time series.
The lengths of the input and forecast periods are crucial to forecasting accuracy. The size of the input and forecast windows was chosen based on the temporal cycles observed in the data using autocorrelation analysis (Figure 3). For the input window, two lengths were used: (1) 24 time steps (representing 1 day of hourly data); and (2) 168 time steps (representing 7 days, or a weekly cycle). For each input window, the models were provided with a comprehensive set of historical inputs. This included all hourly lagged values (up to 24 or 168 h, respectively) for the crowd count itself, as well as all hourly lagged values for weather conditions and temporal indicators. This extensive multivariate input ensures that the models are equipped with detailed historical context and the relationships between lagged weather patterns and temporal dynamics. This capability is crucial for understanding recurring daily and weekly seasonality, enabling models to make robust predictions for horizons that may extend beyond the direct historical sequence of the target variable alone.
The forecast window was varied to assess the model’s performance across different forecasting horizons. The short-term forecast window spanned 1 day (24 time steps), the mid-term forecast covered 7 days (168 time steps), and the long-term forecast extended to 30 days (720 time steps). For the tree-based models (XGBoost, CatBoost, and LightGBM), a direct forecasting strategy was used by training a separate model for each forecast horizon (24, 168, and 720 h) to predict the full horizon directly from the input window. These window lengths were selected to effectively capture daily, weekly, and monthly patterns within the data. During model training, the input window serves as the input features, and the model learns to predict the corresponding forecast window. At each iteration, the model parameters are adjusted to minimize the error between predicted and actual values within the forecast window. This process is repeated for all overlapping windows in the training set, enabling the model to learn the underlying patterns in the data. Once training is complete, the model is evaluated on the test set using the same sliding window logic. The trained model generates predictions on unseen test data, and its performance is assessed by comparing the predicted values with the actual observations. By systematically moving the input and forecast windows across the data set, the sliding window methodology ensures that the model is exposed to various temporal patterns and dependencies.
Hyperparameter Tuning
To further enhance forecasting performance, Bayesian optimization was applied for hyperparameter tuning. The Bayesian optimization technique was implemented using the Optuna library ( 23 ), which efficiently identifies the optimal hyperparameters by modeling the model’s performance as a probabilistic function. Bayesian optimization streamlines the search for optimal settings by reducing the required function evaluations.
For each model, hyperparameters were selected that significantly influence predictive performance, complexity, and generalization. In all gradient-boosting models, the number of trees (boosting rounds) was not a fixed hyperparameter but was determined automatically via an early-stopping mechanism based on the model’s performance on a validation set. This prevents overfitting by stopping training once performance no longer improves.
Light Gradient Boosting Machine
Learning rate [learning_rate]: Governs the step size during each iteration, ensuring a balance between convergence speed and accuracy.
Number of trees [num_boost_round]: Sets the maximum number of trees to be built. The final number of trees was determined using an early stopping mechanism, selecting the iteration that yielded the lowest validation set error to prevent overfitting.
Number of leaves [num_leaves]: Controls the maximum complexity of the decision tree structure, with higher values increasing model flexibility but risking overfitting.
Maximum depth [max_depth]: Limits the tree depth to prevent overfitting on training data.
Feature fraction [feature_fraction]: Determines the proportion of input features randomly selected for training each tree, aiding in generalization.
Bagging fraction [bagging_fraction]: Specifies the fraction of data randomly sampled for each boosting iteration to enhance model robustness.
eXtreme Gradient Boosting
Learning rate [learning_rate]: Regulates the size of updates applied to model parameters during training.
Number of trees [num_boost_round]: Sets the maximum number of trees to be built. The final number of trees was determined using an early stopping mechanism, selecting the iteration that yielded the lowest validation set error to prevent overfitting.
Maximum depth [max_depth]: Sets the depth of trees to control model complexity and avoid overfitting.
Minimum child weight [min_child_weight]: Defines the minimum sum of instance weights required for a node to split, reducing the likelihood of overfitting small subsets.
Subsample [subsample]: Determines the fraction of training samples used in each boosting round to enhance generalization.
Column sample by tree [colsample_bytree]: Restricts the number of features considered during tree construction, which can improve diversity among trees.
Categorical Boosting
Learning rate [learning_rate]: Controls the step size for updating model parameters to balance training speed and accuracy.
Depth [depth]: Specifies the depth of each tree, balancing expressiveness and overfitting.
Number of trees [num_boost_round]: Sets the number of boosting trees. The final number of trees was determined using an early stopping mechanism, selecting the iteration that yielded the lowest validation set error to prevent overfitting.
L2 regularization [l2_leaf_reg]: Penalizes large leaf values to prevent overfitting.
Border count [border_count]: Defines the number of bins used for splitting numerical features, affecting model precision.
Long Short-Term Memory
Learning rate: Adjusts the rate of weight updates during optimization.
Batch size: Sets the number of training samples processed in each batch before updating the model.
Number of layers: Determines the depth of the LSTM network, which affects the model’s ability to capture sequential dependencies.
Neurons per layer: Controls the number of hidden units in each layer, influencing model capacity.
Dropout rate: Reduces overfitting by randomly deactivating units during training.
Number of Epochs [epochs]: Sets the maximum number of training epochs. The optimal number of epochs was determined using an early stopping mechanism based on validation loss to prevent overfitting.
Temporal Fusion Transformer
Learning rate: Governs the step size of parameter updates.
Hidden size [hidden_size]: Specifies the dimensionality of the hidden layers, which affects model capacity.
Number of attention heads [num_heads]: Controls the number of parallel attention mechanisms for capturing dependencies.
Dropout rate: Prevents overfitting by randomly zeroing out neurons during training.
Attention head size: Determines the size of each attention head, affecting how information is processed across attention layers.
Number of epochs [epochs]: Sets the maximum number of training epochs. The optimal number of epochs was determined using an early stopping mechanism based on validation loss to prevent overfitting.
These hyperparameters were chosen because they directly influence the models’ ability to balance learning complexity, training efficiency, and generalization to unseen data. The final optimized hyperparameter values for all models are provided in Tables S1 and S2 in the Supplementary Materials.
Model Evaluation: Performance Metrics
On completion of the training phase, the best-performing model was reported based on its forecasting performance on the test data set. Several metrics were used to evaluate performance, including R2, RMSE, SMAPE, and MAE. The R2 and RMSE assess model performance from a statistical viewpoint. The R2 is a statistical measure that quantifies the proportion of variance in a dependent variable that is explained by the independent variables. In addition, the RMSE indicates the magnitude of prediction errors. Higher R2 and lower RMSE values suggest better model accuracy. From a process perspective, SMAPE and MAE are crucial. The SMAPE evaluates the relative accuracy of forecasts in percentage terms, making it easy to interpret. The MAE provides the average absolute difference between predicted and actual values, indicating the average prediction error. To facilitate a fair comparison of model performance across different locations with varying crowd count scales, the MAE and RMSE were normalized (NMAE and NRMSE). The NMAE and NRMSE were calculated by dividing the MAE and RMSE by the mean of the observed crowd counts for each respective location (as listed in Table 1). These normalized metrics provide a relative error measure, which is more suitable for comparing model performance across data sets with different scales. These metrics ensure a comprehensive evaluation, capturing the statistical and practical aspects of model performance, which leads to a robust pedestrian crowd count forecasting model.
Results
In this section, a comprehensive evaluation of the trained crowd forecasting models is conducted, such as XGBoost, LightGBM, CatBoost, LSTM, and TFT, for the various horizons of 1, 7, and 30 days ahead on the test data set, evaluating the 24-h and 168-h input windows for each forecast horizon. To assess the multivariate output capabilities of the models, the forecasting models were trained in two distinct ways: (1) individually for each location (individual location models); and (2) collectively across all locations (unified multilocation models). In the unified approach, a single model per model family (XGBoost, CatBoost, LightGBM, LSTM, and TFT) is trained using data from all locations to learn generalized patterns and forecast crowd counts for all respective locations. Then, the performance of different model architectures was compared within this unified framework to identify the most effective approach.
Baseline Forecasting Model’s Performance across Various Locations
Table 2 presents the comparative performance of individual location crowd forecasting models trained on Naive Daily, Naive Weekly, and Naive Yearly models, evaluated using the MAE, NMAE, RMSE, NRMSE, and R2 metrics. The performance of these baseline models differs across locations and time horizons; however, they generally indicate the difficulty of capturing complex crowd dynamics with simple methods.
Comparative Performance of Individual Location Crowd Forecasting Models Trained on Naive Daily, Weekly, and Yearly Models on Test Data Set
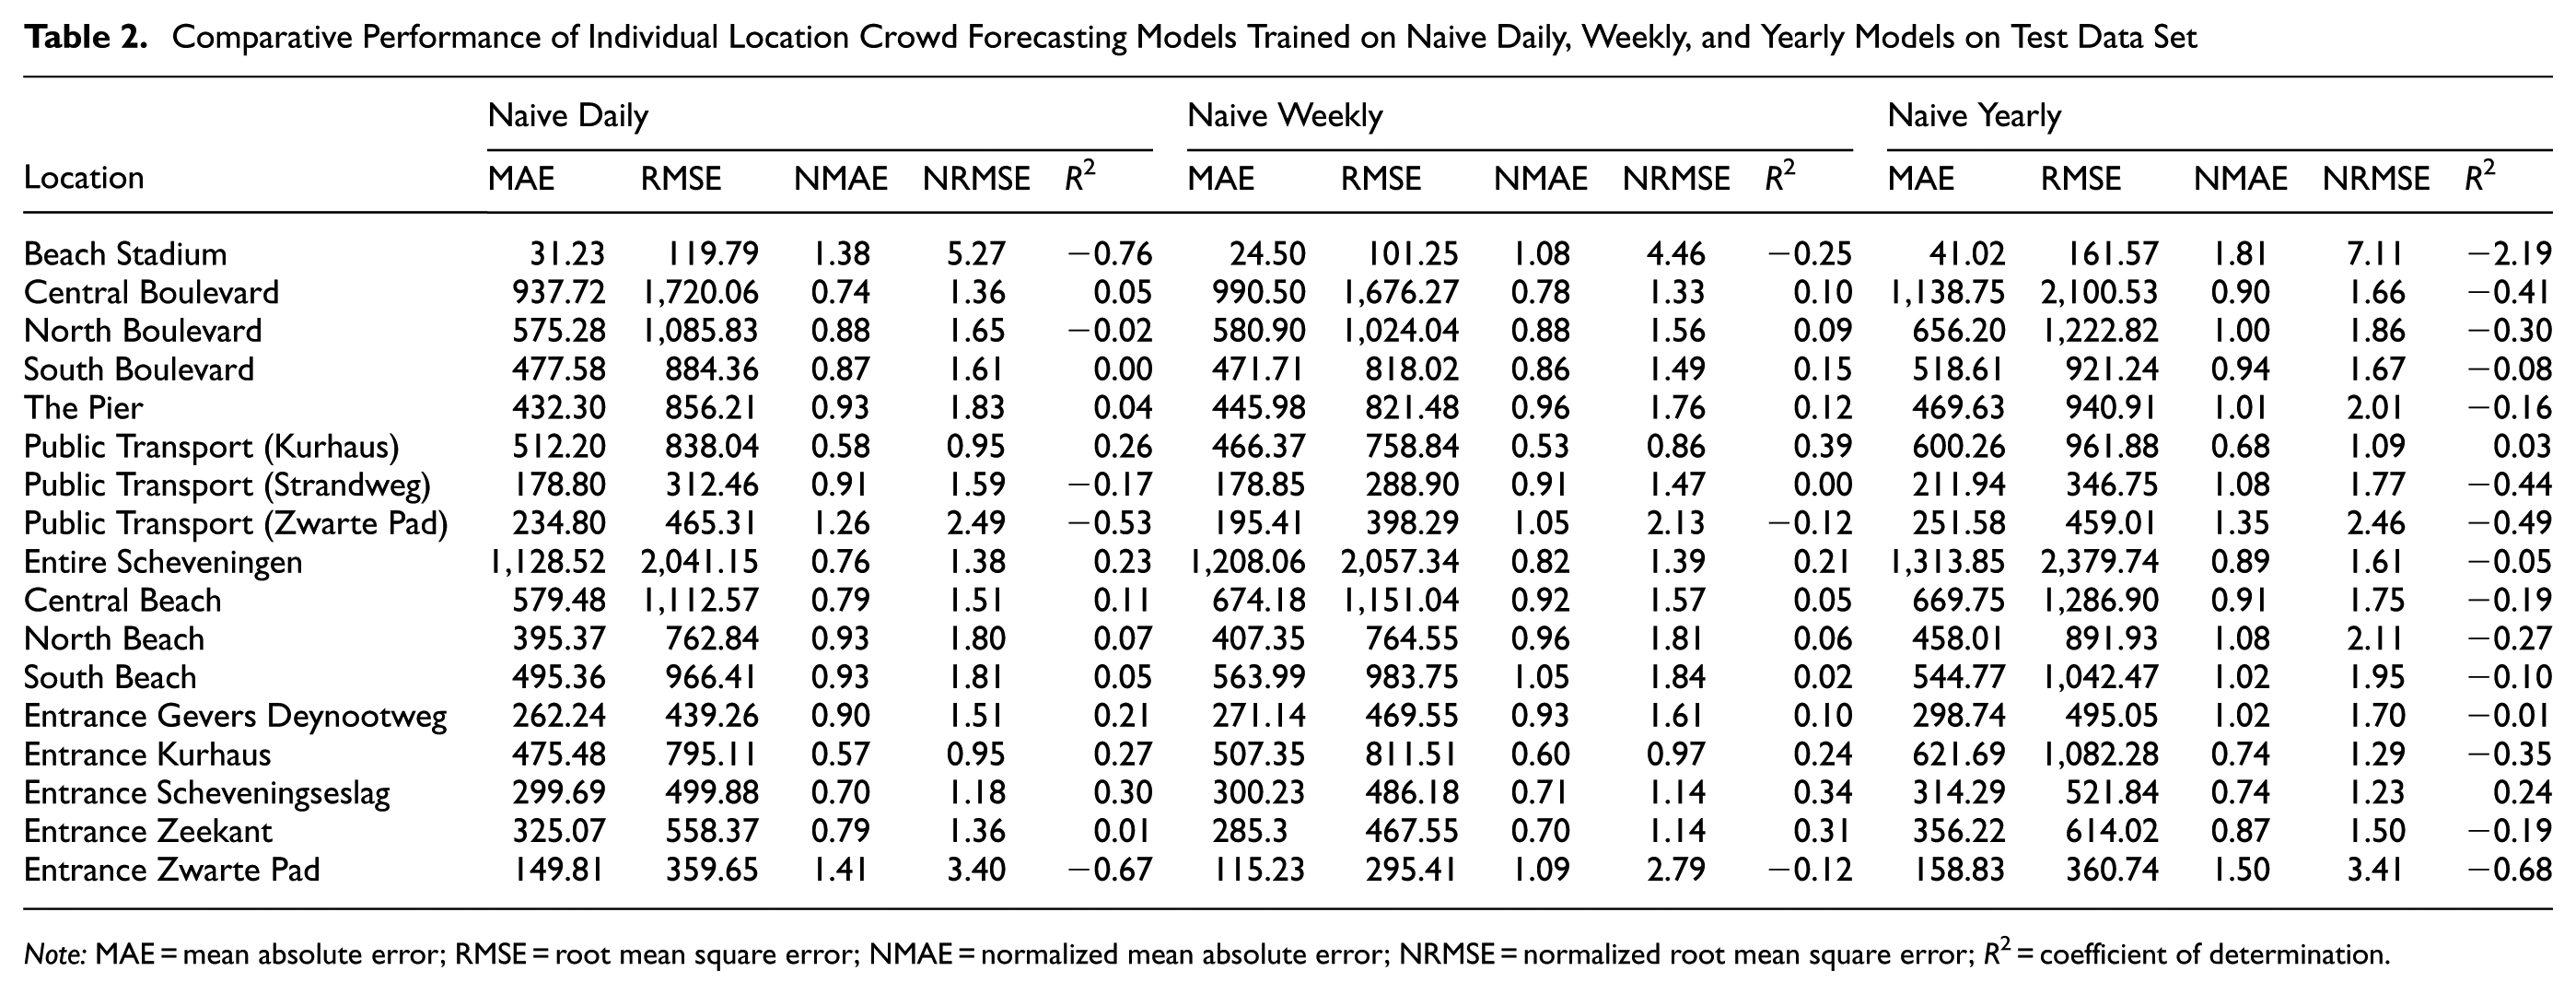
Note: MAE = mean absolute error; RMSE = root mean square error; NMAE = normalized mean absolute error; NRMSE = normalized root mean square error; R2 = coefficient of determination.
The Naive Daily model exhibits high absolute errors in high-traffic areas, such as Central Boulevard (MAE = 937.72) and the Entire Scheveningen area (MAE = 1,128.52). For locations with lower but more erratic crowd counts, such as Beach Stadium and Entrance Zwarte Pad, the NMAE is particularly high (1.38 and 1.41, respectively), indicating that the model’s predictions are poor relative to the average crowd size. This is further confirmed by negative R2 in many areas (e.g., −0.76 for Beach Stadium), signifying that the forecasts are less accurate than simply using the historical mean.
The Naive Weekly model offers slightly better performance in locations with strong weekly patterns, such as Public Transport (Kurhaus), where the R2 improves to 0.39. However, for most other locations, the improvements are marginal, or the performance degrades. The Naive Yearly model consistently performs the worst, with the highest MAE and RMSE across most locations, and a profoundly negative R2 (e.g., −2.19 for Beach Stadium and −0.41 for Central Boulevard). This indicates that simple naive forecast baselines fail to capture the evolving dynamics of crowd behavior. The high error metrics and predominantly low or negative R2 across all three naive models underscore their limited accuracy, establishing a clear need for more advanced forecasting techniques.
Multi-Horizon Forecasting Performance of Individual Location Models
Table 3 presents the performance metrics of the best models trained individually in various locations at Scheveningen Beach at various horizons, along with optimal input window, training time, and forecast time. The dominance of CatBoost in short-term forecasting across most locations suggests its strength in capturing immediate trends and local patterns. This could be attributed to its ordered boosting approach, which may be especially effective in modeling the day-to-day variations in crowd patterns at Scheveningen Beach. In addition, the preference for a 168-step input window at most locations in short-term forecasting suggests that weekly patterns play a crucial role in daily crowd forecasting and may capture effects such as weekday–weekend variations and weekly recurring events. The exceptions (Boulevard areas and Entire Scheveningen) preferring a 24-step input might indicate more rapid changes in crowd patterns in these areas because of the presence of recreational areas and restaurants.
Comparative Performance of Individual Location Crowd Forecasting Models Trained on Different Prediction Windows
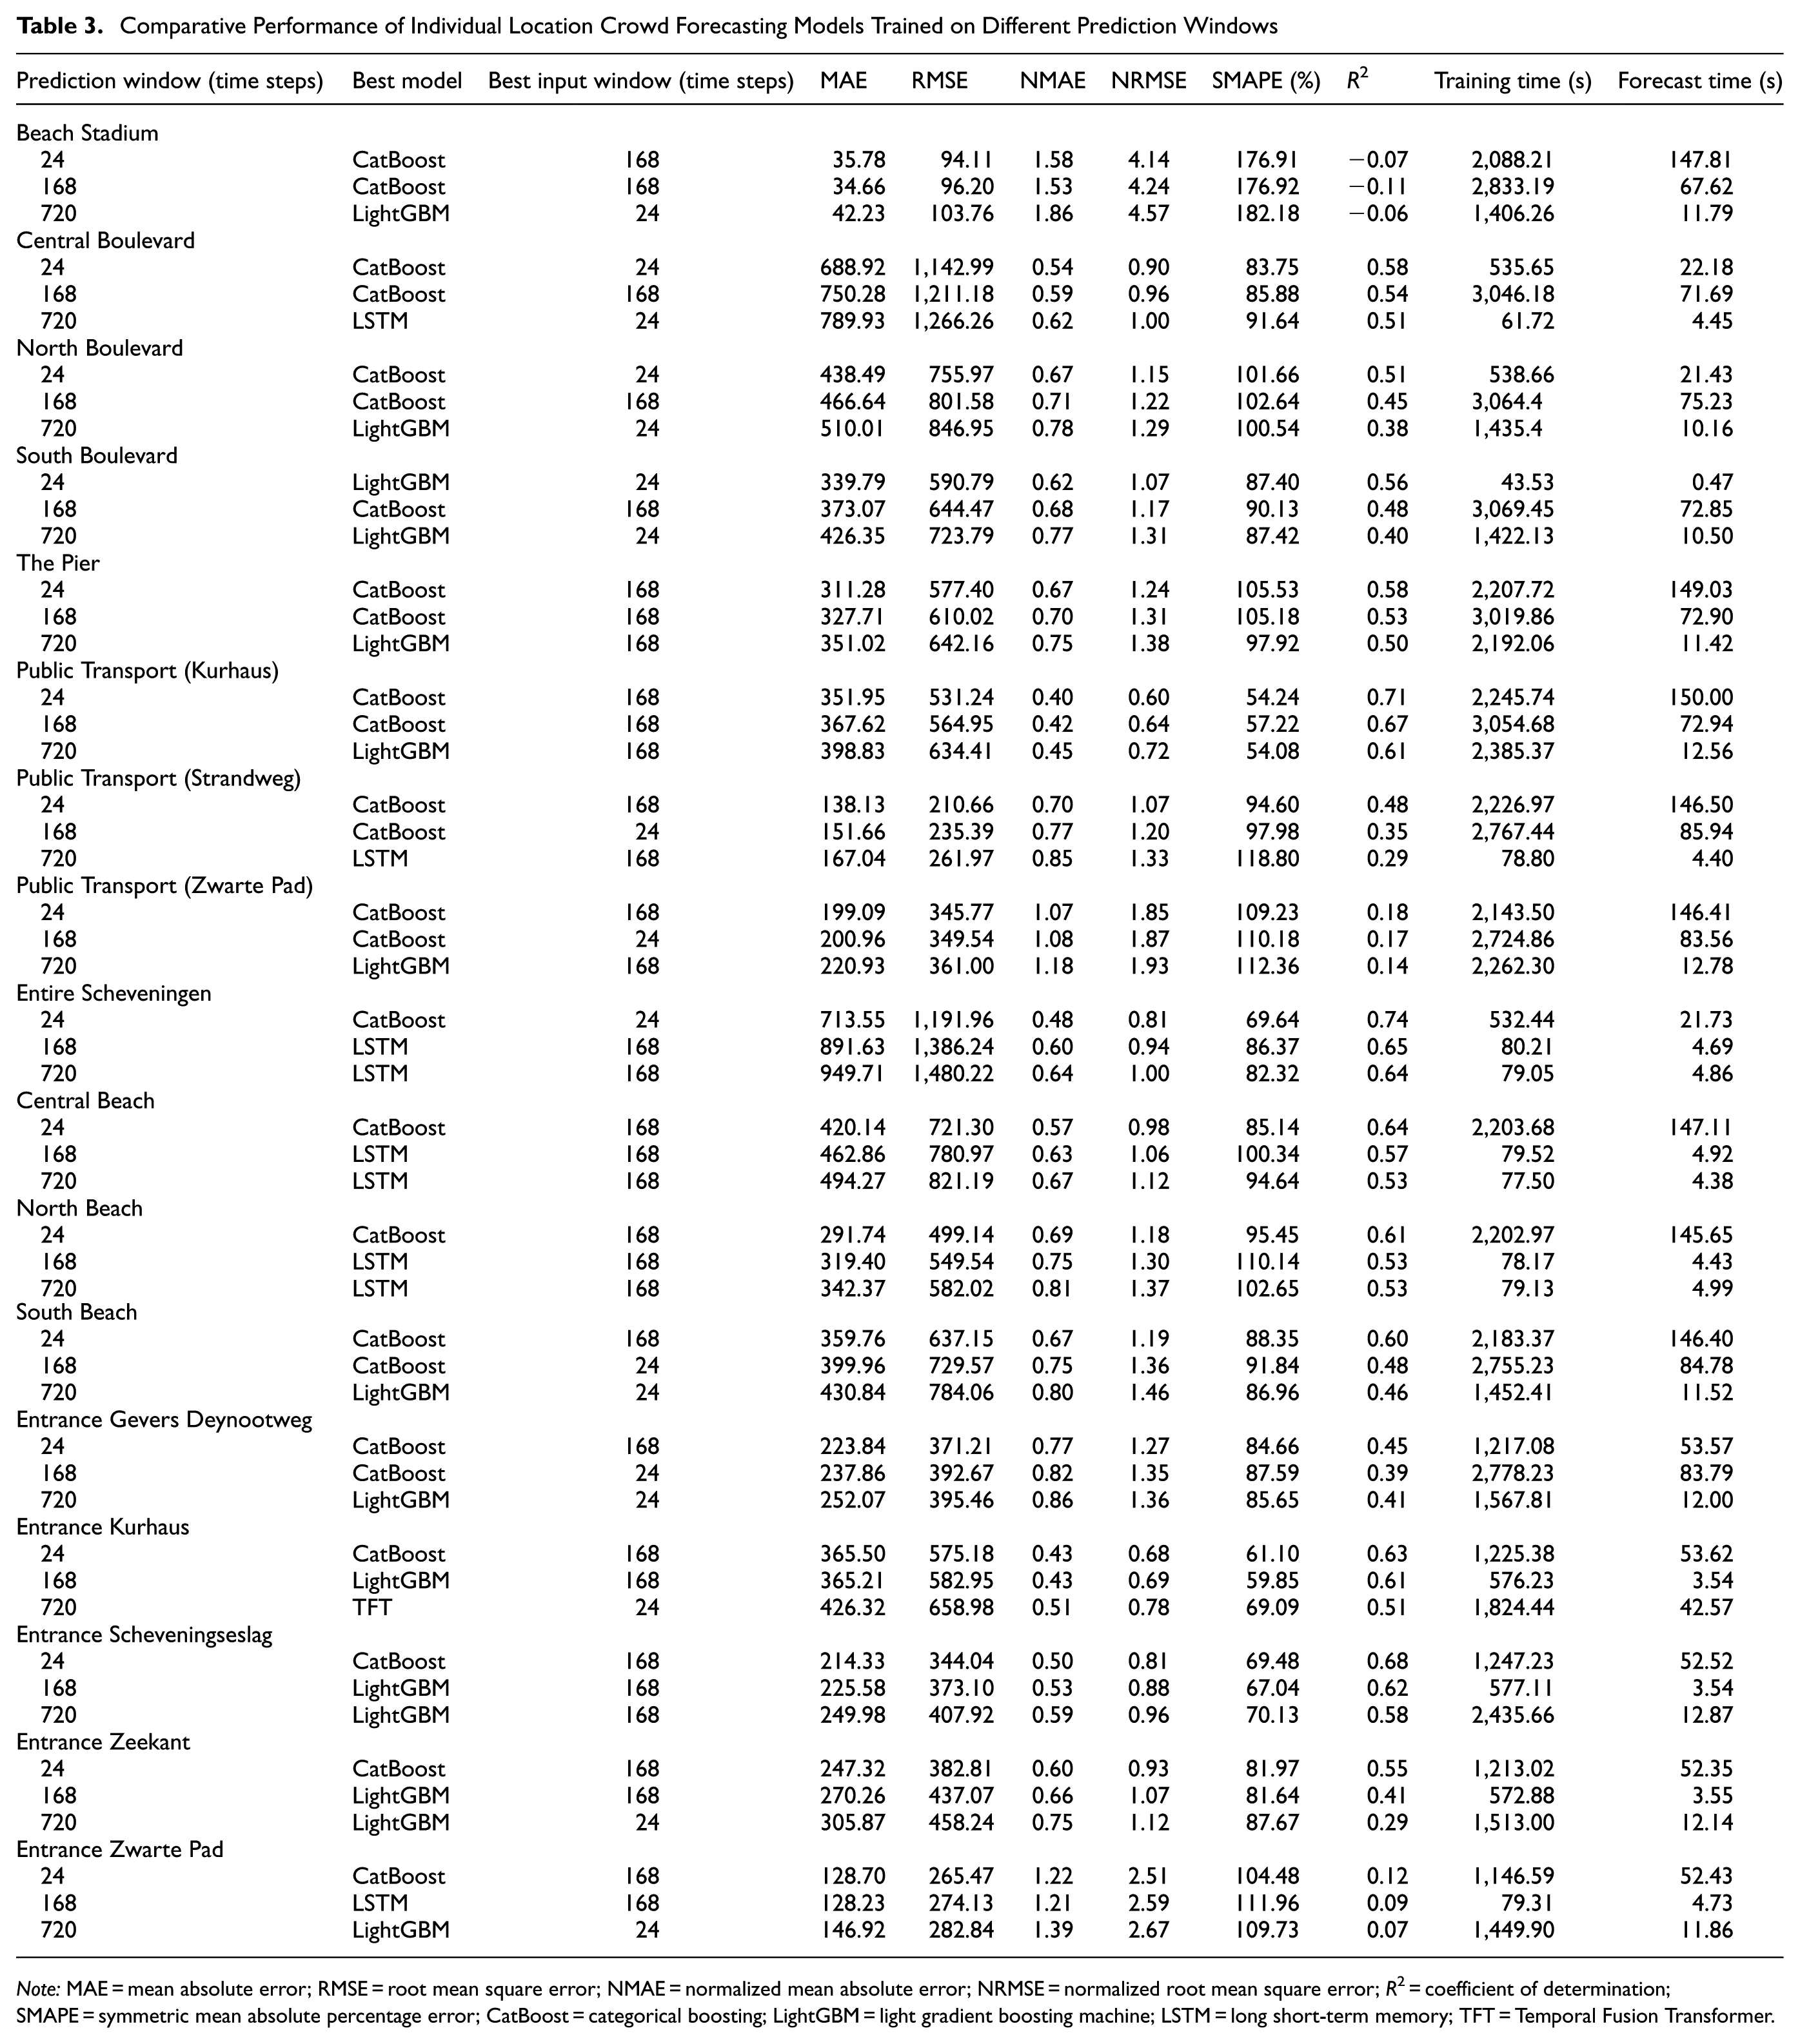
Note: MAE = mean absolute error; RMSE = root mean square error; NMAE = normalized mean absolute error; NRMSE = normalized root mean square error; R2 = coefficient of determination; SMAPE = symmetric mean absolute percentage error; CatBoost = categorical boosting; LightGBM = light gradient boosting machine; LSTM = long short-term memory; TFT = Temporal Fusion Transformer.
For mid-term forecasting, CatBoost was the best, followed by LSTM (Entire Scheveningen, Central Beach, North Beach, and Entrance Zwarte Pad) and LightGBM (Entrance Kurhaus, Entrance Scheveningseslag, and Entrance Zeekant). The continued strong performance of CatBoost in mid-term (1-week-ahead) forecasting, along with the emergence of LSTM and LightGBM in certain locations, reveals the increasing complexity of forecasting as the time horizon extends. The consistent preference for a 168-step input window in mid-term forecasting reinforces the importance of weekly patterns in crowd behavior. However, the exceptions (e.g., Public Transport [Strandweg], Public Transport [Zwarte Pad], South Beach, and Entrance Gevers Deynootweg) that prefer a 24-step input are intriguing and might indicate locations where very recent trends are more predictive of future crowds than longer-term patterns.
The shift toward LightGBM as the top performer for long-term forecasting, with LSTM excelling in some locations, followed by the TFT model, indicates a changing landscape of forecasting factors as the time horizon extends. The notable performance of LightGBM could be attributed to the gradient-based one-sided sampling and EFB techniques that better capture unique characteristics or data patterns for longer-term predictions. The variation in preferred input window sizes for long-term forecasting (split between 24 and 168 steps) suggests that different locations have distinct long-term crowd dynamics. This variability underscores the complexity of long-term crowd prediction and the need for location-specific modeling approaches.
Multi-Horizon Forecasting Performance of Unified Multilocation Model
For the unified multilocation approach, several model types were evaluated (XGBoost, CatBoost, LightGBM, LSTM, and TFT). Each model type was trained as a single, unified model on the combined data set from all locations, generating forecasts for all locations simultaneously. Table 4 presents the performance metrics of the best unified multilocation models trained on various locations at Scheveningen Beach at various horizons, with an optimal input window, training time, and forecast time. In short-term forecasting, CatBoost maintained its strong performance, comparable with individual location models. In addition, LightGBM and LSTM showed effectiveness for certain locations, indicating that varied approaches might benefit different beach areas within a unified framework. This preference suggests that recent trends are more universally informative when attempting to generalize the entire beach area. Location-specific observations revealed varying success. Beach Stadium showed poor performance with a negative R2, indicating challenges in generalizing crowd patterns. In contrast, high-traffic areas, such as Central Boulevard and the Entire Scheveningen area, maintained relatively good performance (R2 > 0.5), suggesting that the model captures general trends well in busier locations with more consistent patterns.
Comparative Performance of Unified Multilocation Crowd Forecasting Models Trained on Different Prediction Windows
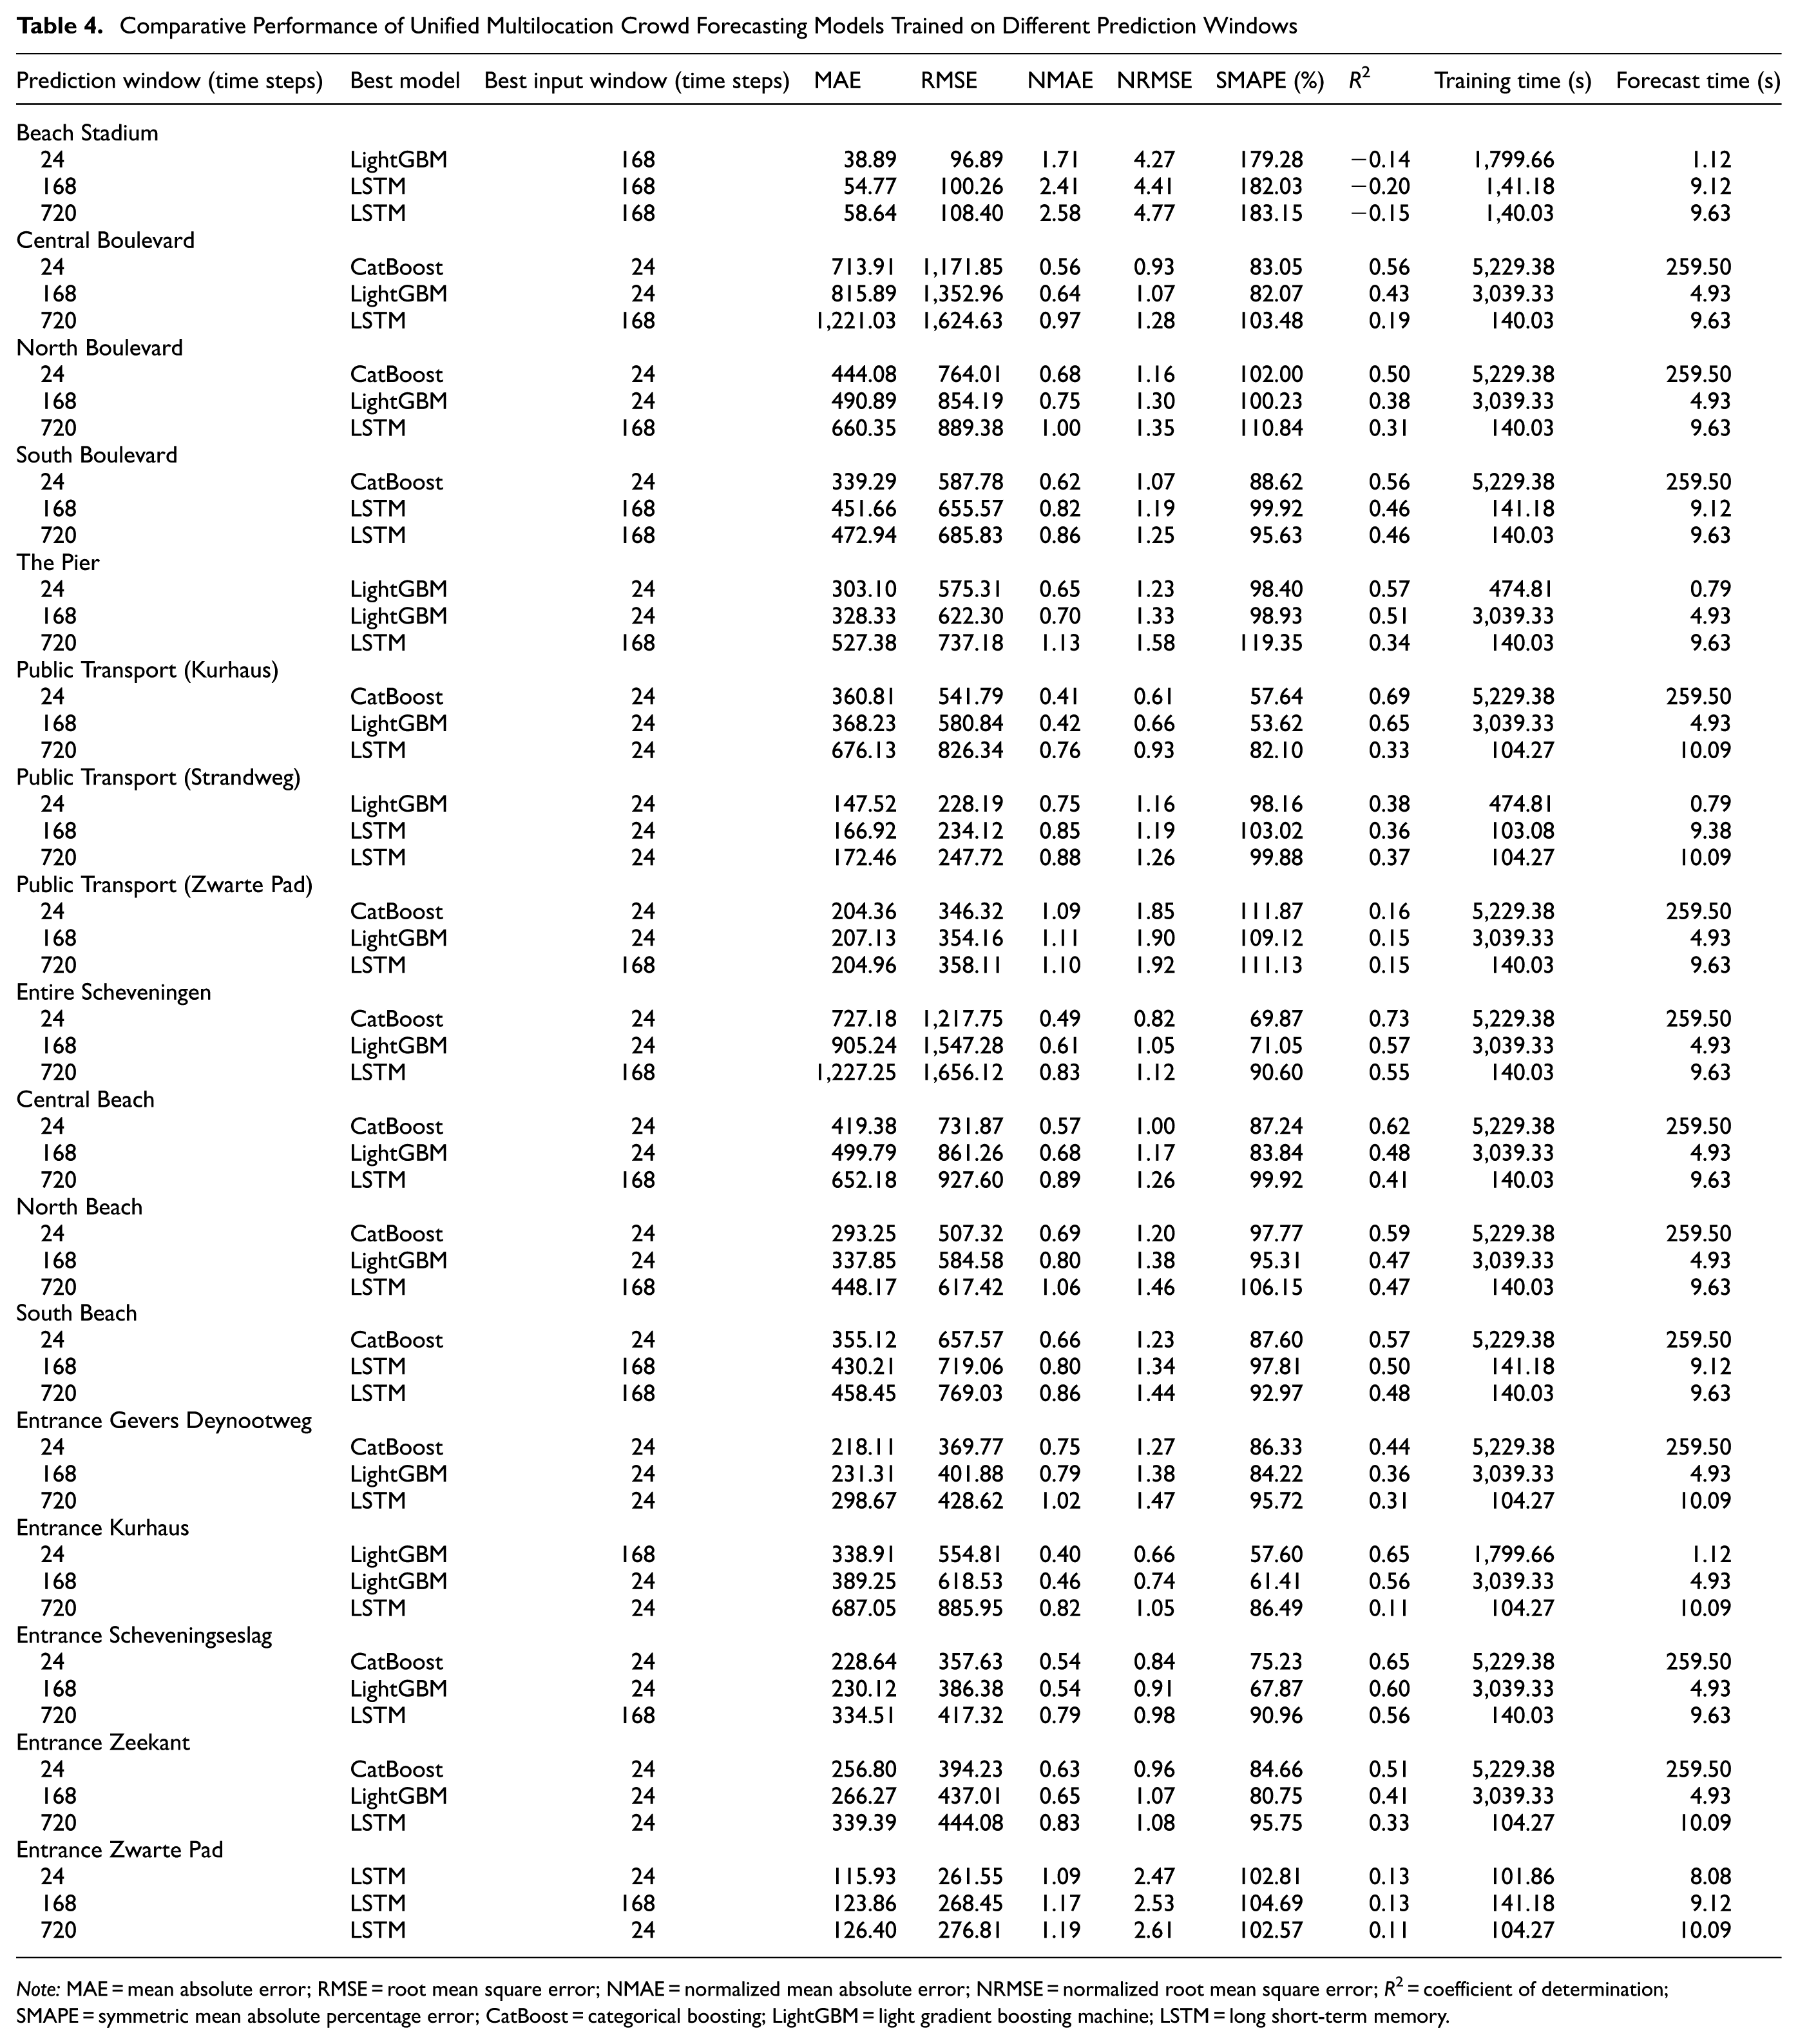
Note: MAE = mean absolute error; RMSE = root mean square error; NMAE = normalized mean absolute error; NRMSE = normalized root mean square error; R2 = coefficient of determination; SMAPE = symmetric mean absolute percentage error; CatBoost = categorical boosting; LightGBM = light gradient boosting machine; LSTM = long short-term memory.
In mid-term forecasting (1-week-ahead), a shift in model effectiveness is observed. LightGBM emerged as the top performer in most locations, and LSTM excelled in several areas. This transition from CatBoost to LightGBM suggests that LightGBM’s leaf-wise growth strategy allows for more nuanced tree structures, potentially capturing subtle mid-term trends more effectively than other models. LightGBM favored 24-step input windows, and LSTM preferred 168-step input windows. This suggests that LightGBM effectively extracts features from recent data, and LSTM captures extended temporal dependencies. Performance metrics showed a decrease in R2 and an increase in the MAE and RMSE values compared with short-term forecasts, indicating increased difficulty in predicting further into the future, with varying predictability across different beach areas.
Long-term forecasting (1-month-ahead) showed that LSTM consistently outperforms other models across all locations, highlighting the deep learning model’s ability to capture long-term dependencies and trends. Input window preferences varied, with about half the locations favoring 24 steps and the other half 168 steps, indicating distinct long-term patterns that benefit from different data ranges, even within a unified modeling approach. Performance metrics indicated a further decrease in R2 compared with mid-term forecasts, accompanied by an increase in the MAE and RMSE values, suggesting higher uncertainty in long-term predictions. In Beach Stadium, the high variability might be primarily because of the irregular patterns introduced by the frequent and diverse events hosted there, making long-term trend prediction challenging.
To visually compare the performance of the different modeling strategies, Figure 7 shows the 7-day-ahead hourly forecasts for the Entire Scheveningen Beach location. This figure shows two distinct visualizations. The results from the individual location models are shown first, followed by the forecasts from the unified multilocation models. In the initial plot of the individual models, the forecasts accurately capture daily visitor patterns, with clear daytime peaks. As noted in Table 3, the LSTM model was the best performer for this mid-term horizon, and the visualization confirms that its predictions closely track the actual visitor counts. In contrast, the TFT model appears more volatile, occasionally overestimating the peaks significantly. The second plot, which illustrates the unified approach, demonstrates that this method also successfully captures the overall weekly trends. For the unified models, Table 4 identifies LightGBM as the top performer. Visually, the LightGBM and LSTM models provide robust forecasts that align well with the actual data. Comparing the two visualizations reveals that while the best individual model (LSTM) offers a slightly more accurate fit, the best unified model (LightGBM) remains highly competitive. This direct comparison highlights the trade-off between the higher precision of specialized individual models and the generalized performance of a single unified model.
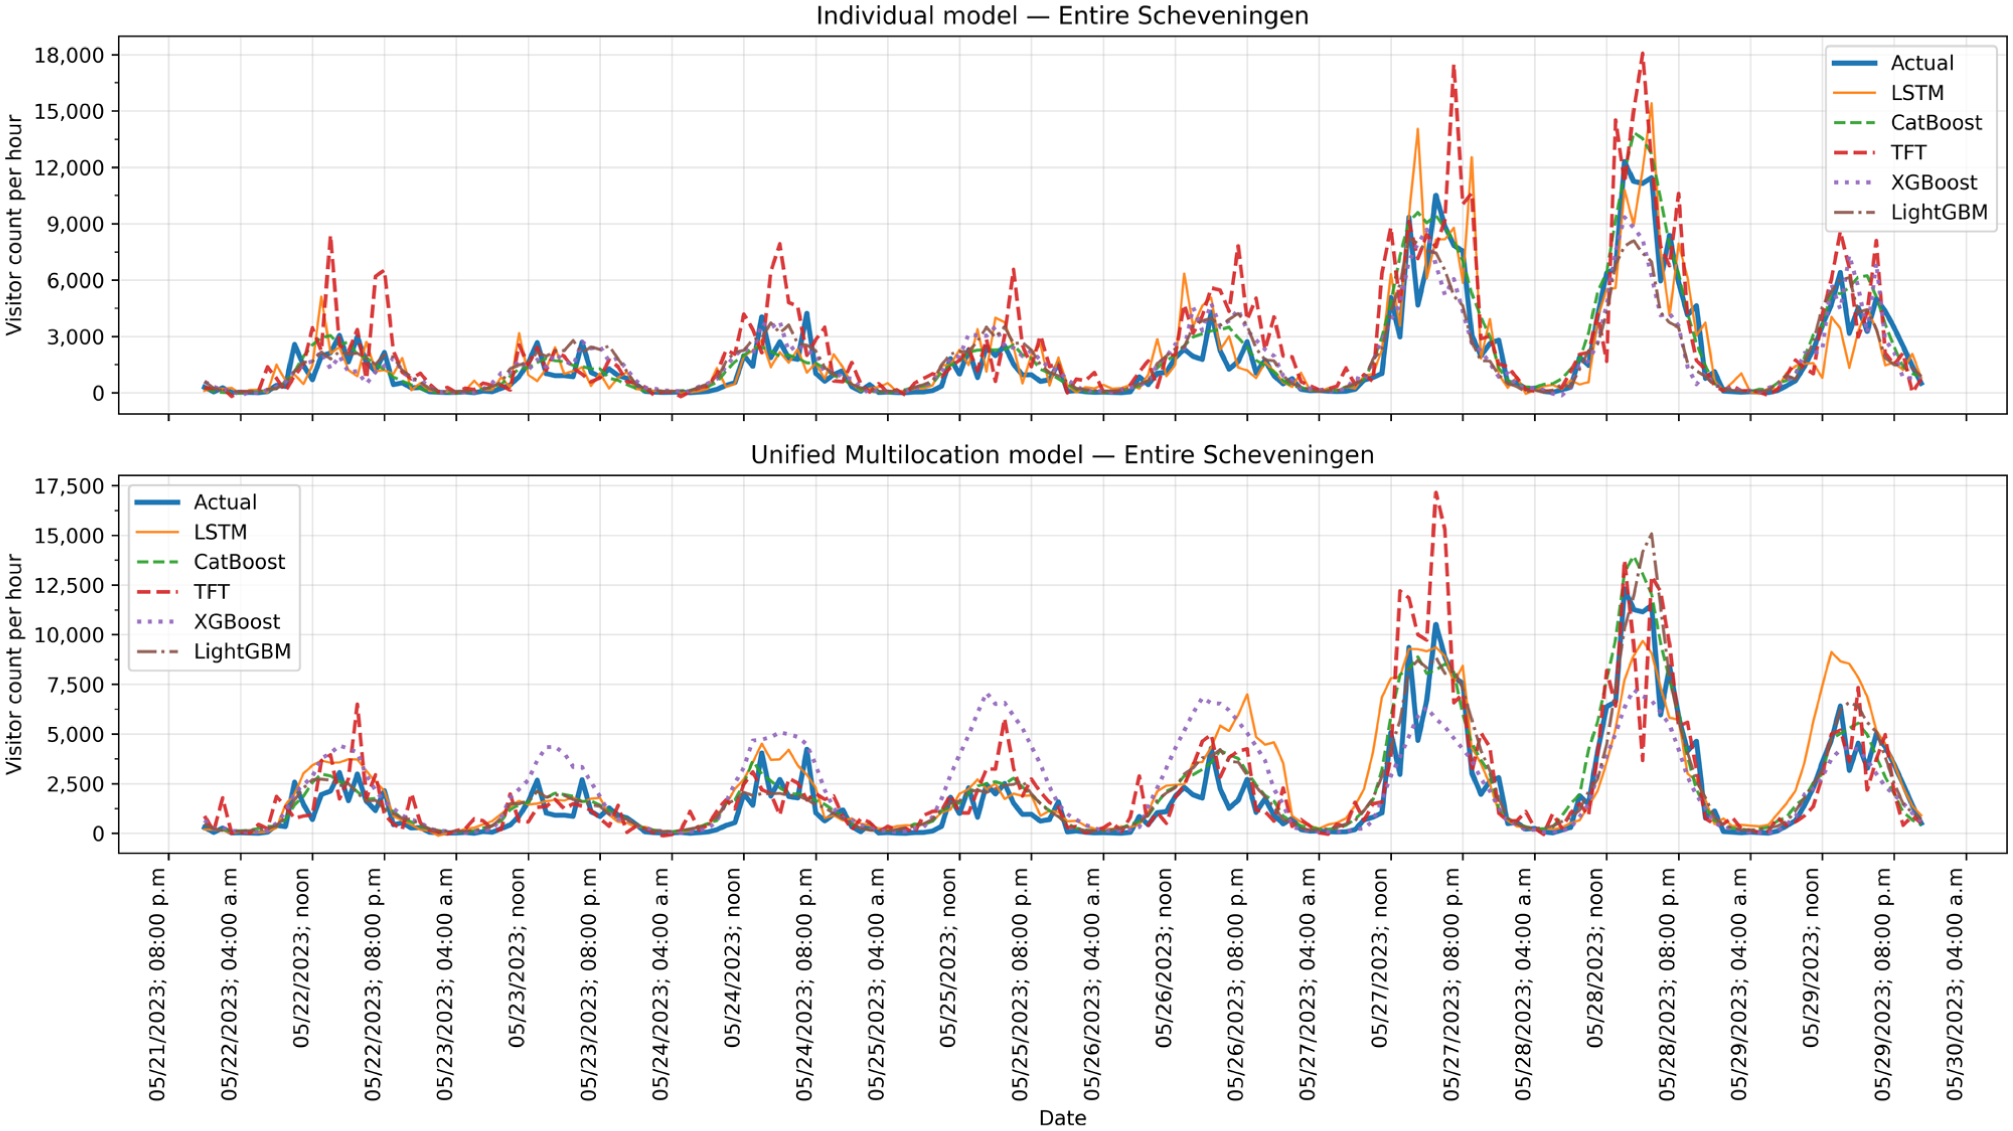
Visualization of 7-day-ahead hourly crowd forecasts for Entire Scheveningen location using individual and unified location models.
Comparative Analysis of Baseline, Individual, and Unified Multilocation Models
The comparative analysis of baseline, individual, and unified multilocation models revealed performance variations across different forecasting approaches for Scheveningen Beach crowd forecasting.
Naive baseline models, both weekly and yearly, consistently underperformed, often yielding negative R2 values (e.g., −0.25 for Beach Stadium in the weekly model), highlighting their inability to capture the complex spatiotemporal patterns in beach crowd dynamics. In contrast, machine learning and deep learning models demonstrated superior capabilities for locations driven by regular temporal and weather-related patterns. However, for locations with highly irregular, event-driven dynamics, such as the Beach Stadium, all models struggled to produce meaningful forecasts, as evidenced by consistently negative R2 in the individual (Table 3) and unified (Table 4) models. This indicates that the crowd dynamics at the stadium are governed by factors not present in the current feature set, such as a specific event schedule, which makes its attendance patterns fundamentally harder to predict without this crucial external data. For instance, the individual CatBoost model for Central Boulevard achieved an R2 of 0.58 for 24-h predictions, substantially outperforming the corresponding naive daily baseline (R2 of 0.05). Likewise, for the 168-h forecast horizon, the individual CatBoost model (R2 of 0.54) demonstrated a significant performance improvement over the naive weekly baseline (R2 of 0.1). The unified multilocation approach, while slightly less accurate than individual models in some cases, offered computational efficiency and more consistent performance across various locations. For the entire Scheveningen area in the 24-h prediction window, the unified CatBoost model attained an R2 of 0.73, compared with the individual model’s R2 of 0.74, demonstrating the unified model’s potential to leverage cross-location correlations and shared influencing factors. Figure 8 shows the MAE performance comparison between individual and multilocation models for forecasting crowd counts at different locations across three prediction windows: 24, 168, and 720 h. This demonstrates the varying performance of both approaches across various locations and time horizons. While individual models generally show lower MAE values, especially for shorter prediction windows, the unified multilocation model maintains competitive performance, particularly for longer-term forecasts in some locations.
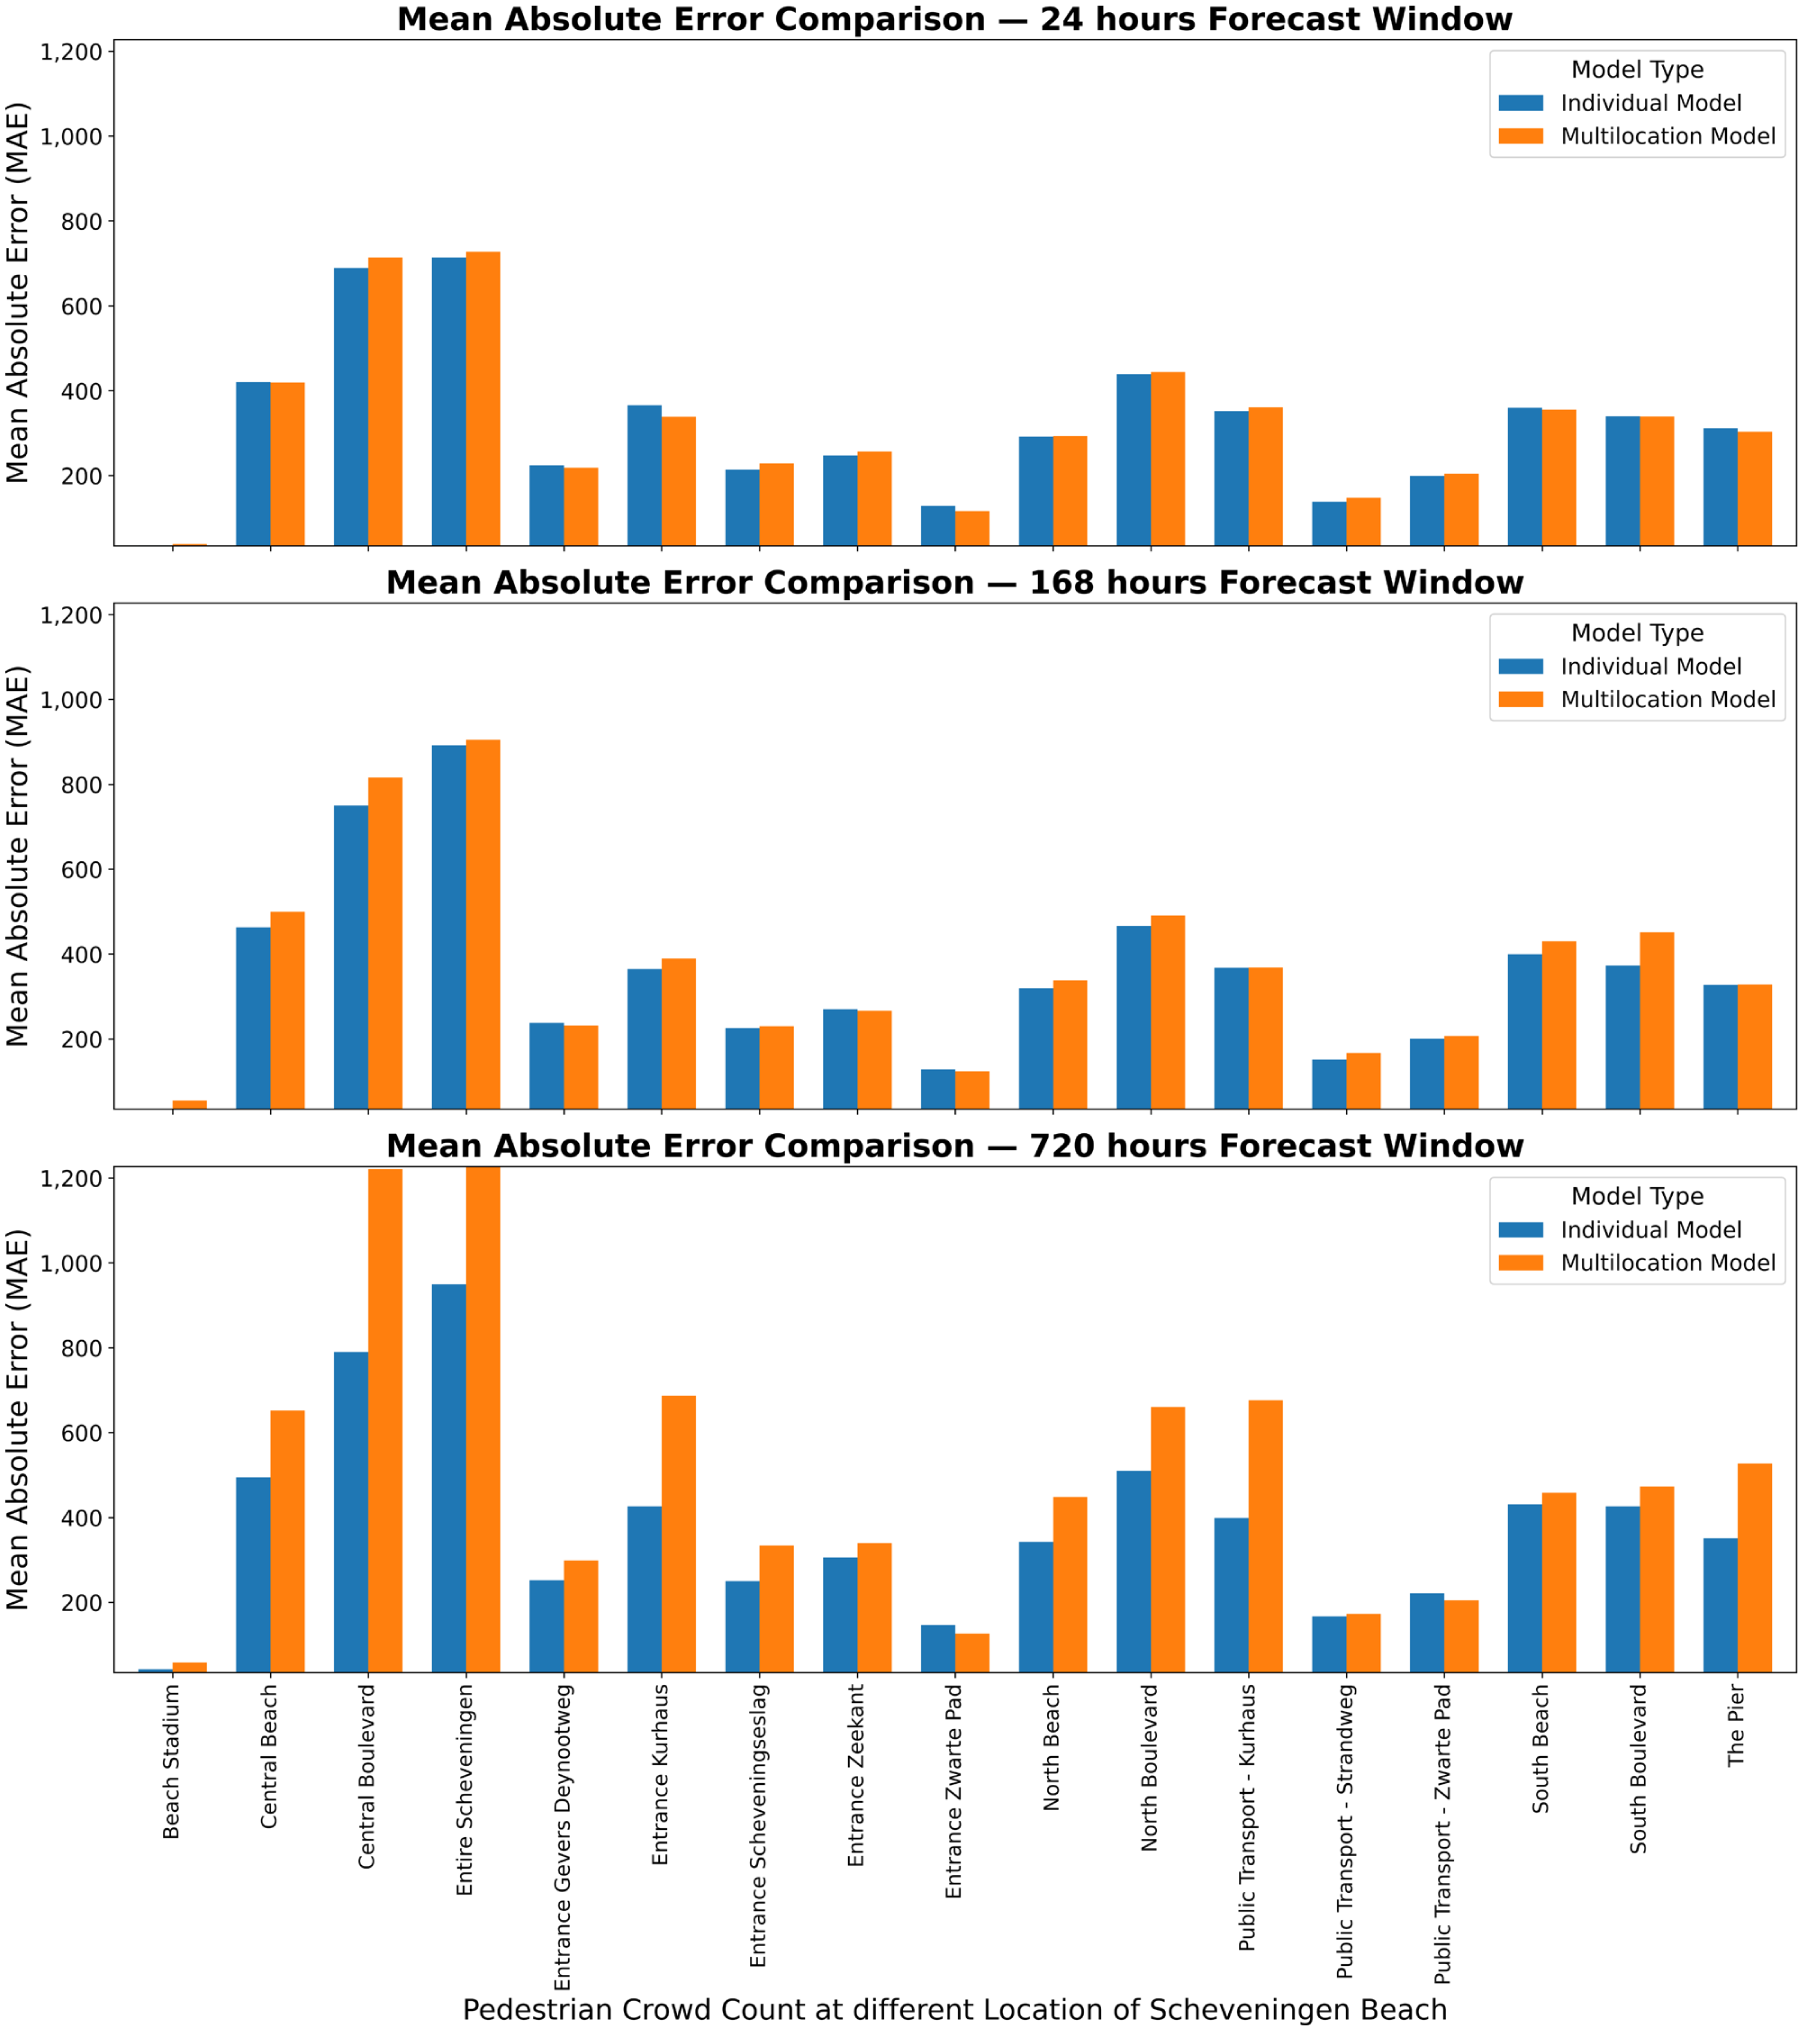
MAE performance comparison between individual and multilocation models for forecasting crowds at different locations across various prediction windows.
Analysis of the training and prediction times revealed variations between models and approaches. CatBoost models in the unified approach typically had longer training times (e.g., 5,229.38 s for Central Boulevard’s 24-h prediction) but faster prediction times (259.5 s). LightGBM models showed shorter training times (e.g., 474.81 s for The Pier) and extremely fast prediction times (0.79 s). The LSTM models in the unified approach showed moderate training times (around 140 s) and prediction times (around 9 s) for 720-h forecasts. In general, LightGBM and TFT provided a better balance between time efficiency and forecasting performance, and LSTM and CatBoost, although capable of high R2, required more time for training and forecasting. From a practical perspective, the choice between unified and individual models presents a classic trade-off between precision and operational efficiency. Individual models offer the highest accuracy and the ability to capture nuanced local patterns; they require more computational resources, more complex management systems, and potentially higher maintenance efforts. The unified model, although sometimes less accurate, provides a more streamlined, cost-effective solution that might be more feasible for large-scale implementation.
Discussion and Conclusion
This study presents a comprehensive evaluation of multi-horizon crowd forecasting models for Scheveningen Beach, revealing complex spatiotemporal patterns in crowd dynamics with significant implications for crowd management strategies and planning. The findings demonstrate a clear temporal hierarchy in model performance. Gradient-boosting models, particularly CatBoost, excelled in short-term forecasting (24 h-ahead), and the LightGBM and LSTM models showed increased efficacy for mid-term predictions (168 h-ahead). The LSTM models dominated long-term forecasting (720 h-ahead), highlighting the importance of capturing long-range temporal patterns for extended predictions.
The analysis revealed spatial heterogeneity in crowd dynamics, highlighting a trade-off between the statistical precision of location-specific modeling and the operational consistency of a unified approach. First, in short-term (24-h) forecasts, individual models often provided a tighter fit; for instance, Entrance Zeekant achieved a lower NMAE (0.60) compared with the unified model (0.63). Second, this performance gap became more pronounced as the forecast horizon increased. In the mid-term (168-h) forecast for Central Boulevard, the individual model produced R2 = 0.54 compared with the unified model’s 0.43. While the individual model captures local variance more accurately, the unified model still maintains reasonable predictive power and captures the general trend. Therefore, while individual models are statistically superior at specific high-variance locations, the error magnitudes are often comparable, suggesting that the unified approach remains a robust and computationally efficient alternative for general deployment across the beach.
Furthermore, the optimal model architecture often differed across locations, suggesting unique underlying data characteristics. For the mid-term forecast for Entire Scheveningen, the best-performing individual model was the LSTM; however, the best unified model was LightGBM. This divergence implies that a model optimized on data from all locations is not necessarily the best at capturing the specific temporal dynamics of a single area. The most extreme case of this heterogeneity was Beach Stadium, where event-driven crowds produced negative R2 across all models, indicating that its patterns cannot be generalized to other beach locations. Despite these variations, a unified model offers significant benefits for model maintenance and understandability. As the prediction horizon extended, forecast accuracy consistently decreased, highlighting the increasing uncertainty in long-term forecasts.
This suggests that an optimal forecasting strategy must align model selection with specific management goals. Short-term forecasts generally possess high accuracy; however, long-term planning must account for greater uncertainty. Therefore, short-term forecasts should guide immediate tactical decisions, such as opening specific beach entrances or deploying medical units. In contrast, long-term forecasts, despite higher uncertainty, are valuable for strategic baseline planning, such as scheduling waste management services or determining seasonal staffing budgets. Areas with better predictability might benefit from automated, data-driven resource allocation, and less predictable areas may require more flexible management approaches.
The proposed machine learning and deep learning models provide practical, actionable tools to enhance forecasting accuracy and improve real-world crowd management strategies. These models can be integrated into existing decision-support systems used by crowd safety managers, such as dashboards that consolidate historical crowd data, weather forecasts, and event schedules. Short-term forecasts (e.g., 1-day) generated by models such as CatBoost enable immediate operational decisions, including optimizing the allocation of security personnel, medical teams, and crowd-control infrastructure to specific zones. Mid-term forecasts (7-day horizon) using models such as LightGBM facilitate planning for peak-demand periods, including weekends and public holidays, by improving resource scheduling and anticipating traffic congestion. For long-term predictions (30-day horizon), models such as LSTM are particularly useful for strategic planning, including budgeting for staff, coordinating with public transportation services, and ensuring adequate infrastructure to accommodate expected crowds. As demonstrated at Scheveningen Beach, these methodologies can be extended to other crowded environments, such as large-scale events (concerts, festivals, and sports matches) and regularly crowded areas, such as inner cities. In both cases, crowd dynamics are influenced by similar factors. By training these models on location-specific data, the approach remains hiadaptable, offering accurate, data-driven predictions to support effective crowd management, resource allocation, and safety interventions.
Future research directions include exploring hybrid models and integrating additional data sources such as real-time public transportation schedules, parking occupancy data, and social media trends. This is particularly relevant for locations subject to event-driven volatility, such as Beach Stadium, where this study revealed a sparse time series characterized by low crowd counts and sharp, intermittent spikes. To address this, future studies should incorporate comprehensive event calendars to differentiate between standard daily patterns and exceptional gatherings. By adding variables that capture the occurrence, type, and expected attendance of scheduled events, models can better anticipate the extreme fluctuations associated with large-scale events. Furthermore, developing probabilistic methods to quantify forecast uncertainty and evaluate the potential effect of spatial autocorrelation, especially in complex beach environments, could enhance model performance. Creating models that dynamically adjust to real-time data inputs could improve forecasting accuracy and responsiveness.
In conclusion, this study validates the effectiveness of machine learning and deep learning for multi-horizon crowd forecasting in dynamic beach environments. Based on the findings, a strategy is recommended that balances precision with operational efficiency. For implementations where computational resources and maintainability are the priorities, a unified multilocation model is a robust, scalable solution. However, for critical locations requiring maximum precision, individual models (specifically CatBoost for short-term and LightGBM or LSTM for longer horizons) are recommended. Adopting a data-driven, multimodel framework provides a powerful tool to enhance public safety, optimize resource allocation, and improve the overall visitor experience at popular tourist destinations such as Scheveningen Beach.
Supplemental Material
sj-docx-1-trr-10.1177_03611981261422125 – Supplemental material for Evaluation of Machine Learning and Deep Learning Models for Multi-Horizon Crowd Forecasting at Scheveningen Beach, The Netherlands
Supplemental material, sj-docx-1-trr-10.1177_03611981261422125 for Evaluation of Machine Learning and Deep Learning Models for Multi-Horizon Crowd Forecasting at Scheveningen Beach, The Netherlands by Theivaprakasham Hari, Winnie Daamen, Sascha Hoogendoorn-Lanser, Jeroen Steenbakkers and Serge Paul Hoogendoorn in Transportation Research Record
Footnotes
Acknowledgements
We would like to acknowledge Dr. Yanan Xin, Assistant Professor, Department of Transport and Planning, TU Delft, for her valuable assistance in reviewing the manuscript during the revision process. We acknowledge the use of GPT-4o LLM for refining the text in the Introduction, Methodology, and Results sections.
Author Contributions
The authors confirm contributions to the paper as follows: study conception and design: T. Hari, W. Daamen, S. Hoogendoorn-Lanser, S.P. Hoogendoorn; data collection: J. Steenbakkers, S. Hoogendoorn-Lanser; analysis and interpretation of results: T. Hari, W. Daamen, S.P. Hoogendoorn; draft manuscript preparation: T. Hari, W. Daamen, S.P. Hoogendoorn. All authors reviewed the results and approved the final version of the manuscript.
Declaration of Conflicting Interests
The authors declared no potential conflicts of interest with respect to the research, authorship, and/or publication of this article.
Funding
The authors disclosed receipt of the following financial support for the research, authorship, and/or publication of this article: This research was funded by the EMERALDS project, which has received financial support from the European Union’s Horizon Europe program (Grant Agreement No. 101093051).
Data Accessibility Statement
The data sets and code used in this study are available from the corresponding author on request.
Supplemental Material
Supplemental material for this article is available online.
References
Supplementary Material
Please find the following supplemental material available below.
For Open Access articles published under a Creative Commons License, all supplemental material carries the same license as the article it is associated with.
For non-Open Access articles published, all supplemental material carries a non-exclusive license, and permission requests for re-use of supplemental material or any part of supplemental material shall be sent directly to the copyright owner as specified in the copyright notice associated with the article.