
Abstract
Transit agencies in the U.S. have faced significant challenges in recruiting and retaining bus operators, both before and after the COVID-19 pandemic. Bus driving often involves working long hours and performing physically demanding tasks involved with operating a large commercial vehicle, while constantly interacting with the public. The physically and mentally demanding nature of the job, coupled with increased personal safety concerns, further exacerbates retention issues. Additionally, a restrictive working environment and a lack of scheduling flexibility, coupled with competitive opportunities in ride-hailing and delivery services, contribute to high turnover rates. Existing research has not sufficiently addressed the role of work scheduling in affecting bus operators’ quality of life and retention rates. In this study, we conducted focus group studies with 213 Chicago Transit Authority bus drivers and analyzed their stated preferences about work schedule characteristics, combining this analysis with revealed preference data on duty selection to gain comprehensive insights into shift desirability. Overall, drivers’ top priorities include getting enough pay hours, reducing the incidence of split shifts, having sufficient recovery time built into the schedule, avoiding relief points outside of garages, and getting weekends off. Relief points, often called reliefs, are the points where operators start or end their shifts. These findings are translated into a series of scheduling recommendations to improve bus operators’ quality of life. Specifically, the recommendations focus on increasing the use of 4-day work weeks and rostering to allow for greater consistency, more days off, and longer duties for operators.
Introduction
Transit agencies in the U.S. struggle to recruit and retain bus operators, a longstanding challenge exacerbated by COVID-19. A 2022 survey of 29 U.S. Transit agencies found that the transit operator workforce shortage is severe and detrimental to agencies’ ability to provide reliable service, especially for agencies with the highest ridership, which are those serving the most urbanized areas ( 1 ). Several aspects contribute to these trends. An aging workforce has produced a “retirement cliff,” leading to unfilled vacancies and reducing the overall seniority of transit operations staff ( 2 ). The proliferation of job opportunities with ride-hailing and on-demand delivery services has attracted workers with relevant skills who desire or require more flexibility. The physically and mentally demanding nature of the job, coupled with increased personal safety concerns, contributes to high turnover in transit operator roles. Federal Transit Administration data show that the number of operator assaults per unlinked passenger trip increased fourfold from 2009 to 2020 ( 3 ). Within this challenging context, institutional factors, such as low pay, limited opportunities for advancement, and rigid work schedules, disincentivize many workers from establishing a long-term career in transit operations. An APTA survey of U.S. transit agencies found that work schedules and compensation issues were the primary drivers of operator departures. Transit agencies around the U.S. are using different strategies to try and recruit and retain their workforce, including offering nighttime pay differentials, increasing starting pay, offering wellness amenities, and eliminating restrictions on part-time employees ( 4 ). A few agencies, including RTD Denver, Indygo, and the Chicago Transit Authority (CTA) have experimented with the expansion of a 4-day, 40-hour workweek to improve retention ( 5 ). However, there is a lack of research to evaluate the relative tradeoffs of implementing these changes, as well as to discuss their efficacy.
CTA Background
The goal of this study is to examine the effect of crew scheduling practices on bus operators’ quality of life and retention issues through an ongoing research case study sponsored by the CTA. Crew scheduling refers to the process of allocating vehicle trips to the transit operators who operate them. A retention rate refers to the percentage of employees who have remained employed with an organization over a specified period and is often used as a way to measure employee satisfaction. The equation

shows how the retention rate at n months, r n , is calculated. Table 1 shows the 6-month, 2-year, and 5-year retention rates for full-time bus operators at CTA who were hired since 2015. Systemwide, only about half of hired bus operators at the CTA stay employed for longer than 2 years. These high turnover rates have necessitated intensified hiring, resulting in the agency’s least experienced transit operator workforce.
Retention Rates for Operators Hired after January 1, 2015
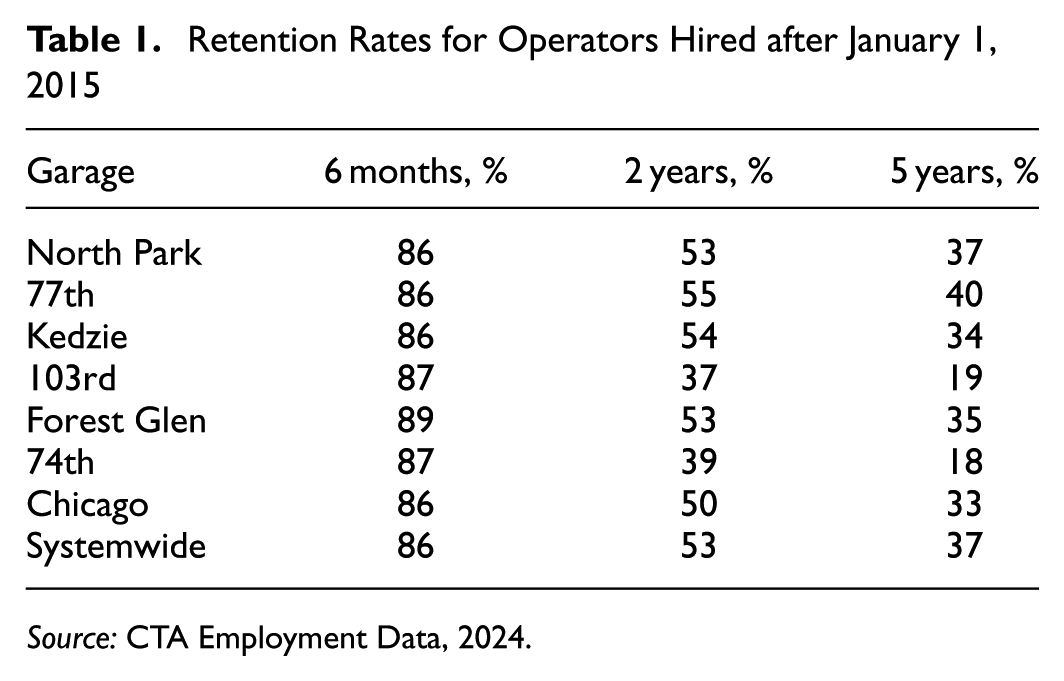
Source: CTA Employment Data, 2024.
Operator work shifts, known as “duties,” are typically structured to minimize labor costs, often resulting in undesirable characteristics. At the CTA, operators choose their work shifts for 3 months at a time during a work selection process called a “pick,” which occurs four times a year. Like many transit agencies nationwide, the CTA uses seniority-based shift selection, meaning the most senior operators select their work shifts first. This causes new drivers to get the least desirable duties, often without weekends or consecutive days off. As mentioned in the literature, shift undesirability can be a factor driving employees out of the bus operator profession, a relationship confirmed through conversations with garage managers and bus operators at the CTA. Many agencies globally package work assignments into weekly or quarterly “rosters” to balance duty desirability across operators. This part of the crew scheduling process is called “rostering” and occurs after vehicle trips have been distributed to duties. However, at CTA, collective bargaining agreements prohibit the use of rostering for most duties, except certain duties called block duties, which are approximately 10 h long and are packaged into 4-day workweeks (“rosters”) ( 6 ). Recognizing the need for more desirable work duties to improve job satisfaction, retention, and service reliability, agency planning staff seek more feedback on operators’ specific challenges and priorities. This study aims to bridge that gap by analyzing duty selection orders and operator feedback collected from focus groups held at all seven CTA garages. Operator feedback and revealed preferences about the 4-day, 40-h workweek are specifically examined to evaluate this type of schedule. The findings are translated into strategic recommendations for scheduling changes to improve the quality of life for operators at CTA.
Related Work
Previous studies have pointed to administrative improvements in onboarding, mentorship, and training as key levers to increasing transit operator retention ( 7 ). Others have emphasized the role of increased pay and retention bonuses ( 8 ). There is limited published research on the use of schedule changes to improve the bus operator experience. An APTA report briefly discusses Indygo’s strategies to improve their workforce shortage, including the successful trial of a 4-day, 40-h workweek and less successful attempts to reduce unpaid time in between parts of a shift, known as “split break time” ( 4 ). Other internal agency studies would be helpful to compare the results of previous similar evaluations, but these are generally not available to the public. Existing reports on transit operations workforce challenges have relied primarily on interviews with agency management and executives, involving relatively little direct engagement with operators. While interviews with management and agency executives provide valuable insights, they present an incomplete picture of the logistical challenges associated with delivering transit services. Management is inherently less affected by street conditions related to safety and service delivery and might not be aware of the specific challenges operators face on a daily basis. Owing to their position, they might also be less inclined or able to share candidly about problematic conditions at their organizations.
However, several qualitative studies have involved engaging bus operators directly to investigate fatigue, road safety, and retention. Biggs et al. ( 9 ) conducted focus group studies with bus operators in Australia to identify the factors influencing bus driver fatigue levels. Maynard et al. ( 10 ) conducted focus group studies and interviews with London bus drivers to understand how fatigue is managed in bus driving. Despite strong indications that work schedule characteristics are a major contributor to operator work satisfaction, research engaging operators directly on this topic is limited. One of the few studies specifically addressing operator work schedule preferences is that of Miranda et al. ( 11 ), who conducted a stated preference survey with Chilean bus drivers and trained a mixed logit model on the results to quantify the economic incentives needed to encourage acceptance of flexibly timed work duties. They found considerable heterogeneity in operators’ preferences but, overall, a significant willingness among operators to participate in flexible shifts.
In this work, these research gaps are addressed by engaging a significant portion of bus operators directly, and collecting quantitative feedback on their stated preferences. Another significant contribution of this work is the creation of a novel dataset relating scheduling characteristics and order of duty selection, providing a comprehensive view of the relative desirability of duties.
Methodology
In this study, we conducted focus group studies with 213 CTA bus drivers across seven garages, representing 7% of full-time bus operators employed by CTA at that time. We engaged these operators voluntarily in their garages (during their meal and other work breaks or before or after their work shifts) in a preference ranking activity to elicit stated preferences about their work schedule characteristics. Before and after engaging operators in this activity, researchers conducted unstructured interviews with operators about their work preferences, to gather more nuanced feedback on how their work schedules affect how they perceive their jobs and quality of life. To verify and provide additional context on operators’ stated preferences, we analyzed revealed preferences by constructing and analyzing a new dataset combining duty characteristics with metadata on the order of duty selection at pick time.
Garage Visits
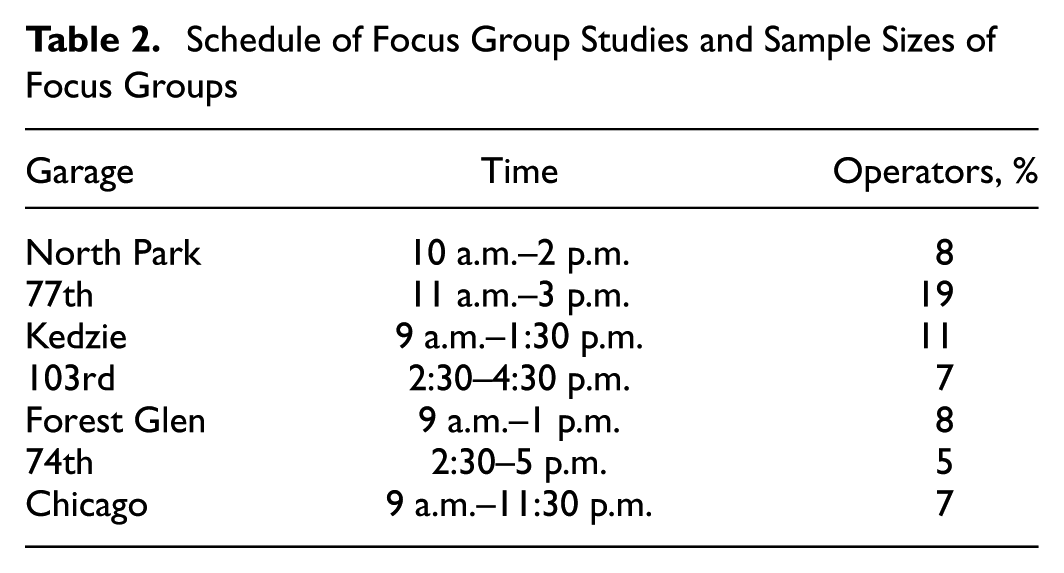
Researchers visited each of the CTA’s seven garages over 6 days in late January and early February 2024. These visits mainly occurred around mid-morning and lasted 3–4 h. The visits mostly occurred during operators’ lunch breaks or split breaks. In split duties (sometimes known as swing duties), the work shift is arranged so that an employee’s working hours are divided into two or more separate parts during the day, separated by an unpaid break that is often several hours long. Care was taken to ensure that the sample of operators involved in the study was as representative as possible, while keeping participation voluntary and minimally invasive to the operations of the garage. For this reason, all seven bus garages in the CTA system were visited within the same week-long period, and nearly every operator available during the time of our visits was engaged in some capacity with the researchers. Although the engagement process at each garage was identical, visit timings varied slightly, owing to scheduling constraints. Further, owing to the daytime timing of the visits, overnight operators were probably undersampled, and some garages had more operators available during visit hours than others. Most conversations were one-on-one, but some occurred in a group setting, with several operators sharing their responses to the same question in series. No audio or video recordings of the interviews were taken, to encourage candidness in the participants. Information about the operators’ seniority was recorded when it was thought relevant to the subject matter. Notes were taken during the interviews by hand on the operators’ responses, along with relevant detailed information about duty numbers, routes, and relief points that operators discussed. These notes were synthesized to identify recurring themes and concepts related to the operators’ preferences about shift selection and notable divergences in opinion between bus operators. Table 2 outlines the schedule of the focus groups and the sample size (number of operators) for each group.
Schedule of Focus Group Studies and Sample Sizes of Focus Groups
Operators across the seniority spectrum were engaged in the conversations. Seniority data were explicitly collected for 93 of 213 bus operators; the median seniority of this subset of participants closely matched the median seniority of the entire bus operator population (2016). Figure 1 shows the seniority distribution of all operators compared with focus group operators from whom seniority information was collected. One way to measure the representativeness of a sample is through the Kullback–Leibler (KL) divergence, which quantifies how much information is lost when the sampling distribution is used to approximate the full distribution of operators at the garage. The KL divergence between the distribution of the focus group operators and all operators at the garage is 2.07 natural units, a unit for information measurement when the natural logarithm is used in the calculation, which is considered a moderately good fit. For the purposes of generating representative responses from operators, it is not as important that the two distributions match exactly as that they are generally the same shape with respect to seniority. Although the median of each sample is identical, the least senior operators were somewhat underrepresented in our focus group sample. This is probably because of shift timing, as many of the least senior operators start their work later in the day. Nearly every available operator at each garage was engaged in some capacity, though these conversations were entirely optional. Operators with at least a few years of seniority tended to share a higher volume of and diversity of information, owing to their enhanced experience.
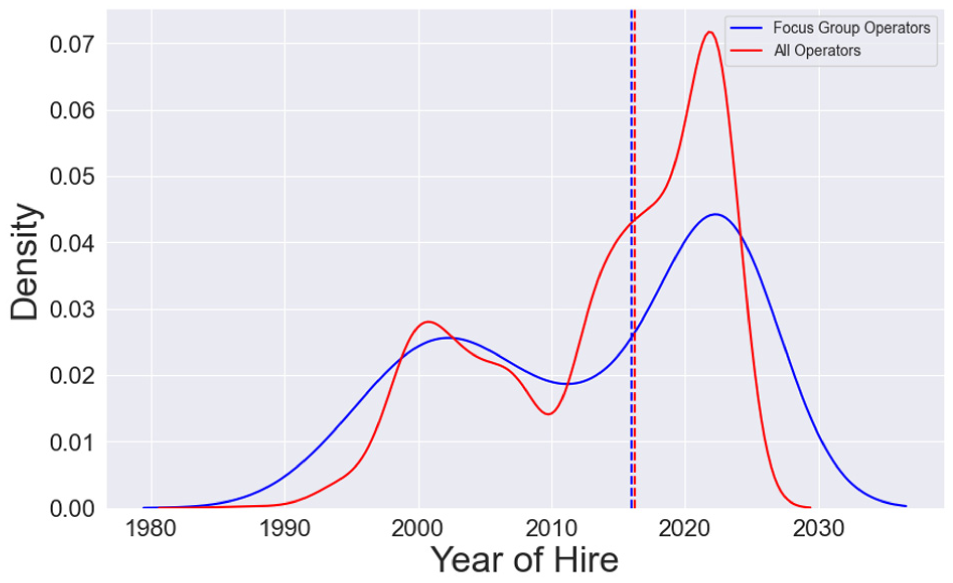
Kernel Density Estimation of the Seniority distribution of focus group operators compared with all operators.
The following standardized questions guided the conversations with operators. Not all operators were willing or able to answer all questions; follow-up questions were asked if operators had much to say on a particular topic.
Focus Group Questions
Operator Background
How long have you been a bus driver at CTA? At other transit agencies?
Days Off
2. If you had three days off (Saturday, Sunday, and one other day), would you prefer that the third day is a Monday or Friday or a Tuesday, Wednesday, or Thursday? Could you explain your preference?
3. How well do your current weekly days off align with your ideal schedule?
Duty Characteristics
4. Can you describe today’s duty, including start and end times, the number of workpieces, and the assigned duties? Is this a daily occurrence, or is there variety in your schedule?
5. Do you have a favorite or least favorite route to drive? Could you share the reasons for your preferences?
6. Does your current duty involve driving more than one route in a single shift (interlining)? Would you prefer an interlined assignment or rather stay on the same route? Do the specific routes affect the difficulty of interlining?
7. Describe your experience of picking work during the last pick (Fall 2023)? How does this differ from your experience of picking work during this pick (Winter 2023–2024)?
Work Selection Process
8. Can you describe how you selected your current work based on the choices available to you during the pick?
9. Are there specific types of duty you wish you had been offered but were not?
10. Describe your experience picking work during the last pick (Fall 2023)? How does this differ from your experience picking work during this pick (Winter 2023–2024)?
Work Satisfaction
11. What would your most desirable work package be like? Least desirable? How does your current work fit in that spectrum (and why)?
12. On a scale of 1 to 10 (with 10 being very satisfied and 1 completely unsatisfied), how satisfied are you with your current work?
Preference Ranking Activity
At each garage, operators were presented with a poster displaying 12 work characteristics and asked to indicate their top three most important characteristics using color-coded dot stickers. Their responses were visible to others, and they could see the responses of operators who had already voted. This activity was selected because the interactive and public nature of the results encouraged interest and participation among the operators. Researchers administering the preference ranking activity verbally encouraged respondents to vote according to their own personal priorities, to reduce potential groupthink bias. Operators were also asked to indicate the number of years that they had worked at CTA next to their votes. These 12 characteristics were established through analysis of operators’ revealed preferences through historical duty selection data and consultation with CTA management staff who formerly worked as bus operators. Some characteristics, such as unpaid “swing” time, school trips, and downtown trips, were anecdotally noted as important to operators, while other characteristics, such as time of day, pay hours, and day of the week, exhibited significant differences in the seniority of the operators who historically picked them. Responses of each value for each characteristic were tallied to develop an importance ranking for these characteristics across garages. A weighted sum of votes was calculated to evaluate overall preferences, with first-priority votes worth three points, second-priority votes worth two, and third-priority votes worth one. The highest weighted sum indicated the most important work characteristic.
Work Characteristic Options
Total weekly pay hours
Routes with enough recovery time
Avoiding split duties
Consistent shift times throughout the week
Avoiding late or evening street reliefs
Ending work before the afternoon peak hour
Getting Saturdays and Sundays off
Avoiding school trips
Getting three days off per week
Avoiding interlining
Routes with fewer incidents
Avoiding downtown routes
Creation of Duty Selection Order Dataset
Data on duty characteristics, including duty timings, routes, relief details, and pay hours, were obtained from HASTUS, scheduling optimization software used by CTA to construct vehicle and crew schedules ( 12 ). The data from HASTUS include a duty identifier (runid) corresponding to a unique work assignment. Data on operator assignments to duties come from Trapeze Operational Software (TOPS). All performed work is recorded in TOPS, along with the duty identifier (runid), the employee ID of the operator initially assigned the work, and the employee ID of the operator who did the work. By default, the operator who picked the duty takes it on, but in the case of absences or separations from CTA during the pick, these can be different. Scheduled duty characteristics from HASTUS were merged with the TOPS operational data on the unique duty identifier and the day of the week, yielding a dataset containing the order of work characteristic selection. Data for the Winter 2024 and Spring 2024 picks were analyzed for all seven garages in the CTA system. The “pick” refers to the process by which transit operators select their work assignments, in order of seniority. For CTA bus operators, this process usually occurs four times per year. The CTA bus operator workforce consists predominantly of full-time operators (over 95%). Part-time operators are subject to specific scheduling protocols according to the CTA’s collective bargaining agreement (CBA). For these reasons, the analysis of historical work selection in this paper is focused exclusively on full-time operators.
Analysis
Preference Ranking Activity: Overall Results
A weighted total was computed by multiplying the number of responses to each option by their priority (1, 2, or 3). Options with higher weighted totals were prioritized more by operators. Getting weekends off and consistent shift times throughout the week also ranked highly. Figure 2 shows the weighted total of each of the 12 characteristics for all seven garages. Overall, total pay hours, avoiding split duties, having enough recovery time, and avoiding street reliefs were the highest priorities for operators.
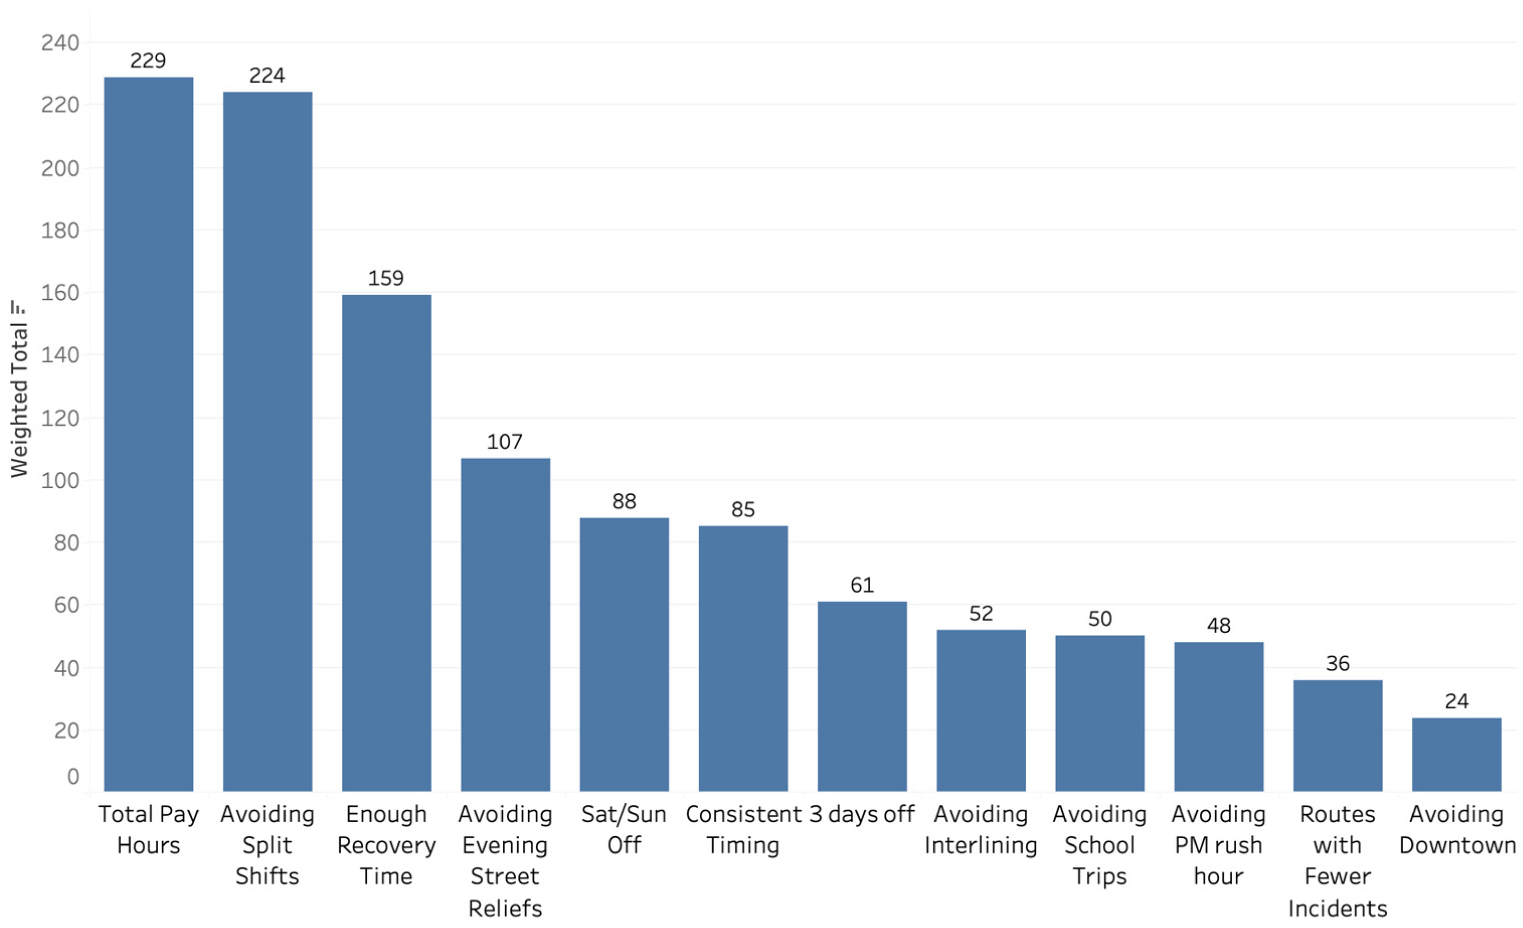
Work characteristics in order of priority (Winter 2023–24, systemwide).
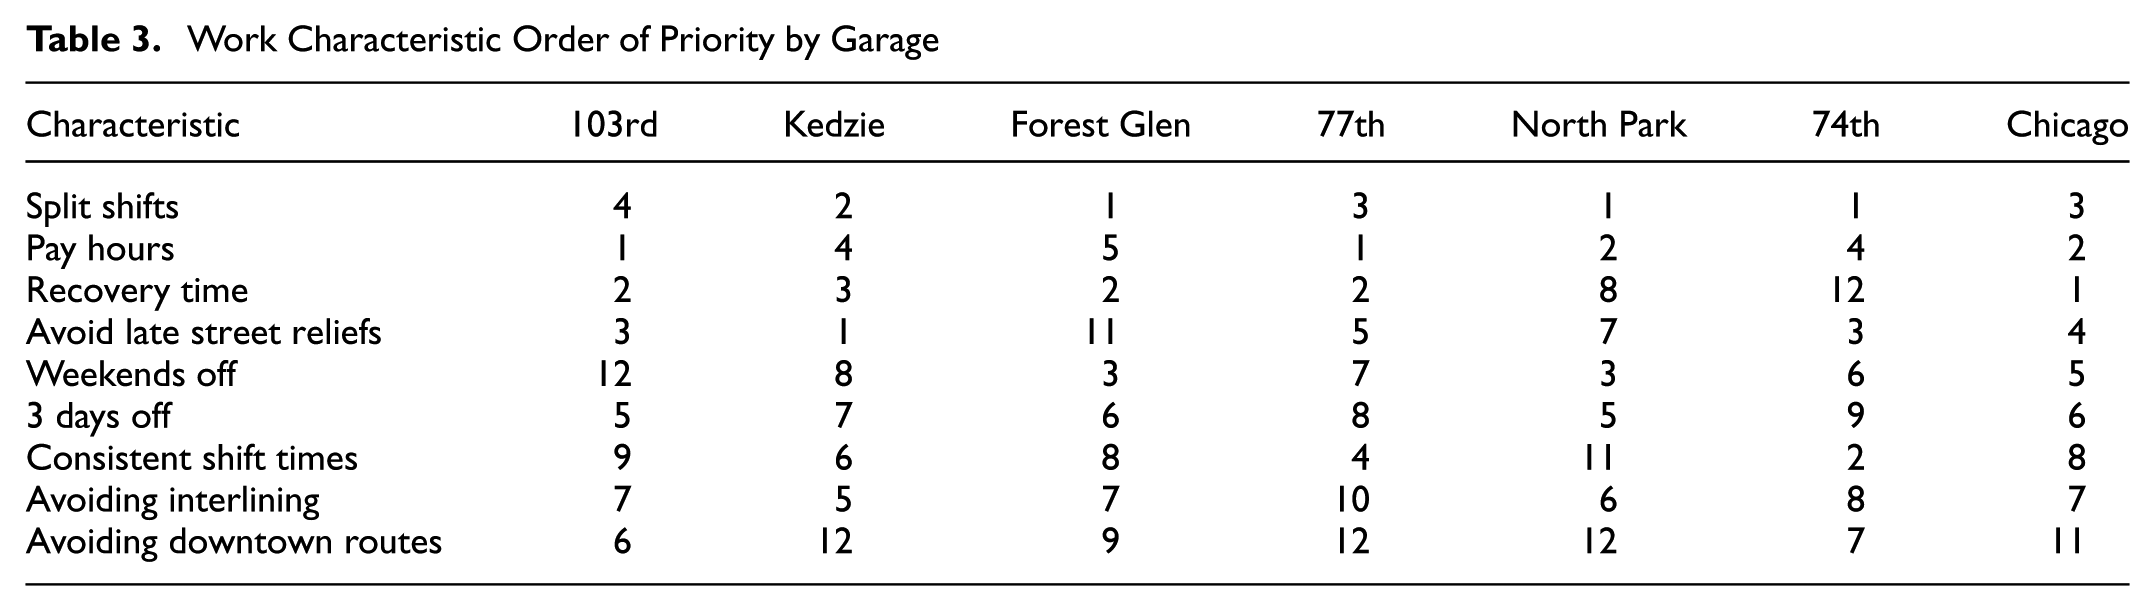
Some options had consistent prioritization across all garages, while others had a more heterogeneous ranking. Table 3 details the order of priority of each characteristic by garage. Avoiding street reliefs was a high priority for operators at Kedzie, 103rd, and 74th street garages, whose service areas include neighborhoods with higher crime rates. Driving routes with enough recovery time was a top priority for operators at all garages except 74th, where avoiding split duties, late street reliefs, and getting consistent shift times dominated. One operator from 103rd Street Garage with 26 years of experience commented that running times are so unrealistic across the board that “if you are on time you are doing something wrong.”
Work Characteristic Order of Priority by Garage
Pay
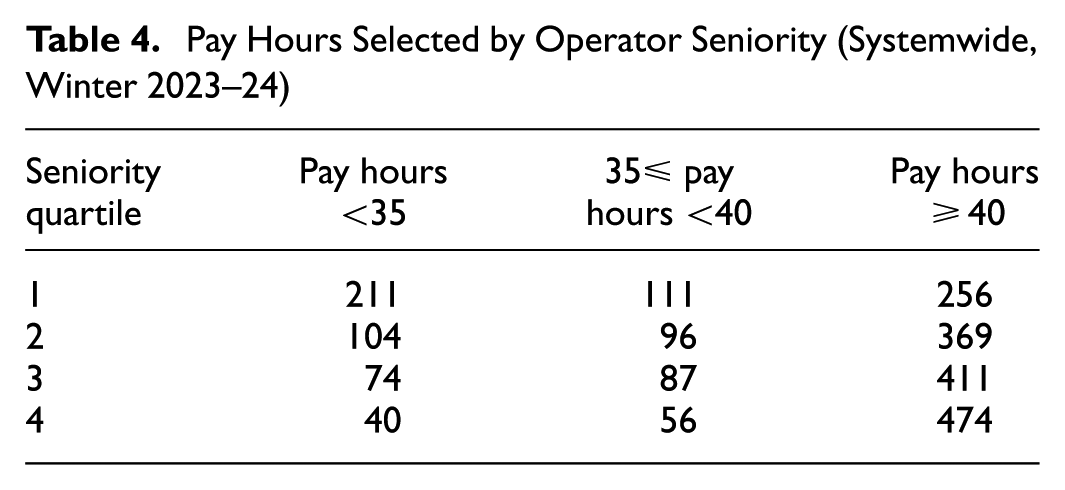
Picking duties with sufficient paid time is a critical priority for nearly all operators. CTA operators benefit from a “weekly minimum guarantee” of 40 paid hours per week as long as they pick 35 h of work per week. ( 6 ) Following the CBA with Amalgamated Transit Union (ATU) (Local 241), 38.5 h are required, but CTA has given operators who select at least 35.0 h per week the weekly minimum guarantee as a policy since January 1, 2023. Most operators interviewed desired to work between 40 and 45 h per week. A smaller but significant group of operators prefer to work at least 50 h per week. At the CTA, overtime is paid at 1.5 times the rate for hours exceeding 40 weekly. Overtime is not incurred for hours over 8 per day unless the weekly hours exceed 40. Regular operators can earn overtime by selecting over 40 h as “guaranteed overtime” in their regular weekly assignment if there are longer duties available. They can also volunteer for extra shifts up to 7 days in advance for specific days, times, or routes, without limits enforced by the CTA and without being scheduled outside their preferences without approval. Figure 3 shows the distribution of weekly pay time incurred by full-time picking operators in Winter 2023–24. The distribution is somewhat bimodal, with many operators picking a little above 40 h per week but a smaller concentration picking 30–35 h per week, which is below the weekly minimum guarantee. Some operators might pick shorter weekly hours because of personal preferences but many junior operators report having trouble meeting the weekly minimum guarantee requirement or selecting as much work as they want, owing to the characteristics of the duties left to select at their pick time. When confronted with this challenge, operators might be forced to select undesirable duties, or they might be unable to meet the weekly minimum guarantee. This is further demonstrated by Table 4, which shows the number of operators who pick less than and more than the 35 weekly minimum guarantee hours and a full 40 h, separated by seniority quartile. Seniority quartile 1 refers to the most senior operators at each garage, while quartile 4 refers to the least senior operators at each garage. Although the trends are heterogeneous, most operators do select 40 or more hours per week, confirming the stated preferences from the focus groups. Almost half of the operators who selected less than the weekly minimum guarantee are in the most senior quartile, suggesting that the choice to work part-time is intentional rather than driven by the available duties. Newer operators appear to pick schedules that maximize their work hours, even at the expense of other work characteristics.
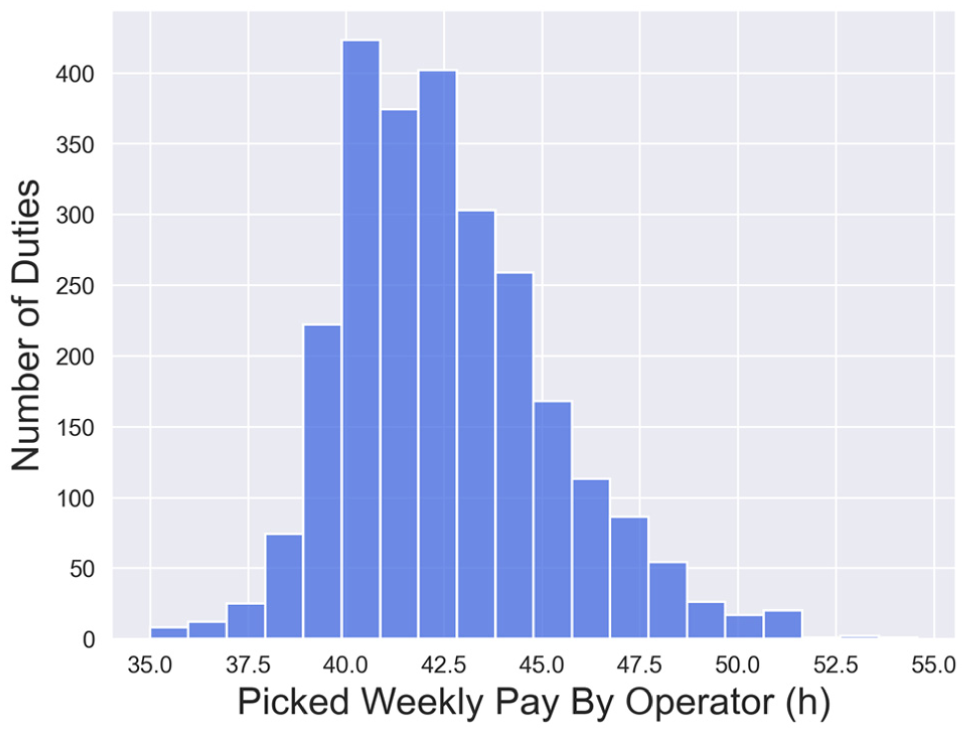
Hours picked at pick time by operator (Winter 2023–24).
Pay Hours Selected by Operator Seniority (Systemwide, Winter 2023–24)
Duty Type
Operators overwhelmingly prefer morning duties without significant breaks between workpieces. Afternoon and evening duties are avoided because of congestion and safety concerns. However, a few operators prefer afternoon and evening duties for personal reasons. These trends were noted in conversations with operators and are reflected in the duty selection order. Figure 4 shows the order of duty type selection, with increasing operator seniority rank along the x-axis. Each vertical line represents an operator seniority rank, which is assigned to one operator per garage, with the first line on the left representing the most senior operators and the vertical line on the far right representing the least senior operators. Morning duties are overrepresented among senior operators, with afternoon and evening duties, particularly those ending late at night, being the least popular.
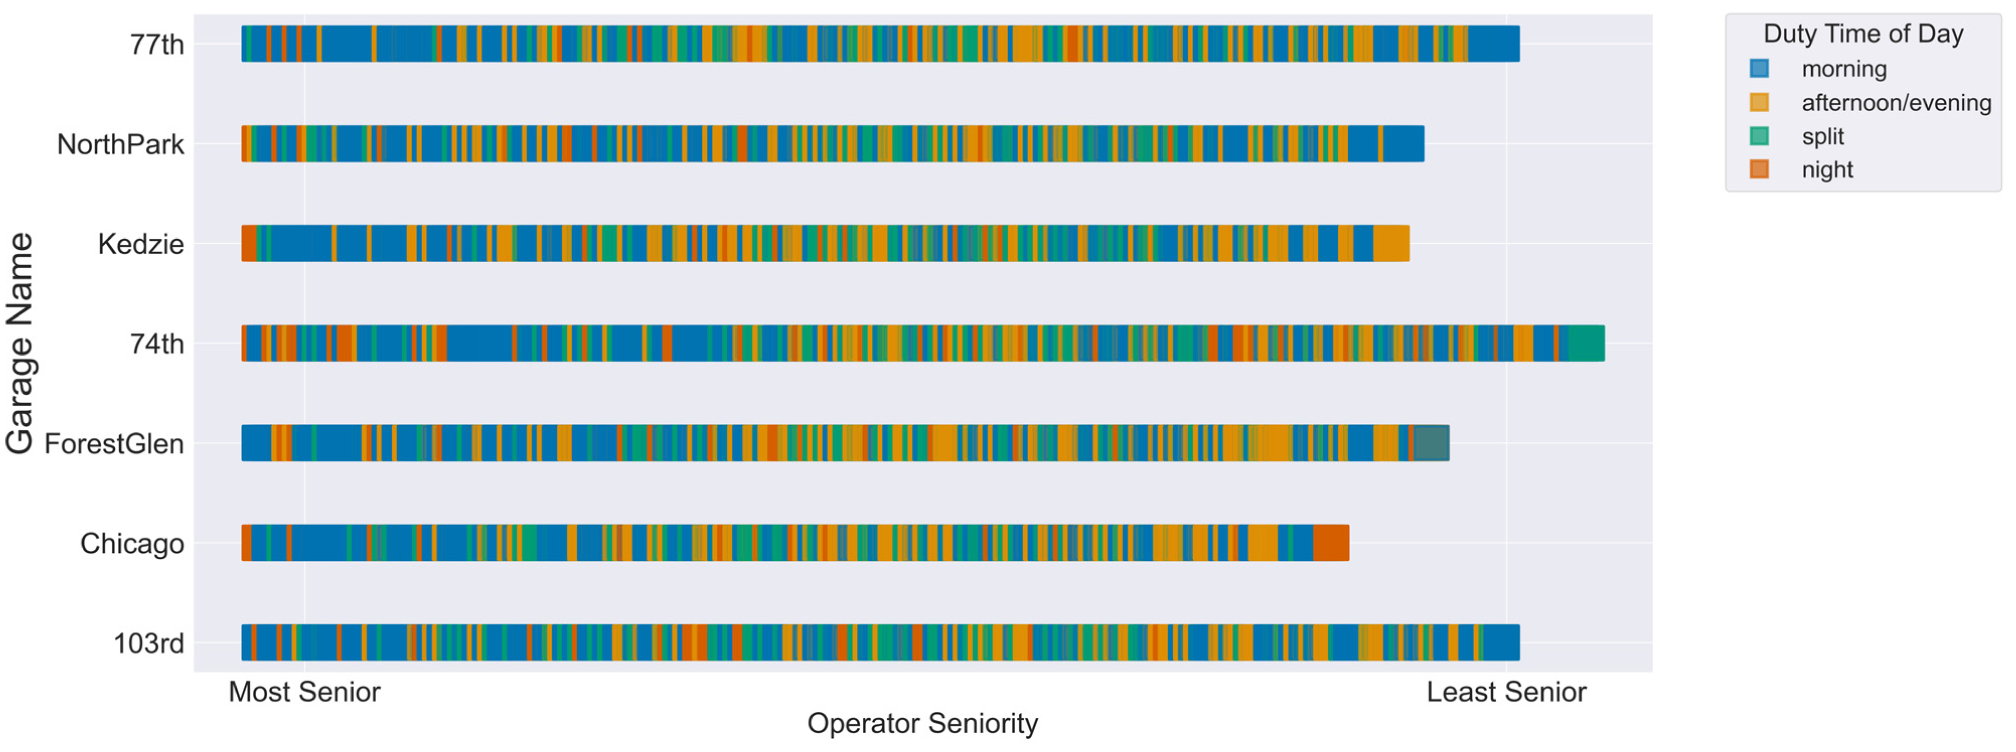
Duty time of day by seniority.
Figure 5 provides a further look at duty type availability for operators with differing seniority. During the Winter 2023–24 pick, 50% of morning duties were selected by the 25% most senior operators. In contrast, 50% of split duties and night duties were selected by the top 50% of operators, while 50% of afternoon or evening duties were not selected until 70% of operators had picked.
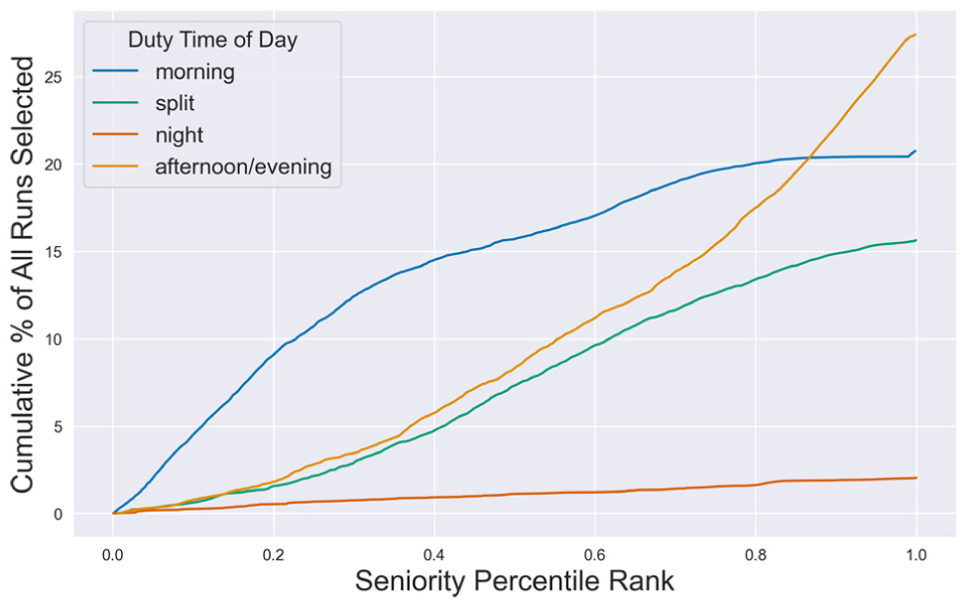
Seniority percentile against cumulative percentage of duties selected.
Despite strong trends, there is heterogeneity in these operators’ preferences and ability to select their work. Avoiding split duties, which span both the morning and afternoon peaks and involve significant unpaid time between work pieces, was a top priority for operators in the ranked preference exercise. However, analysis of the duty selection order in Figure 5 shows that split duties tend to be preferred over afternoon and evening duties. This inconsistency may be partially explained by operators preferring split duties for personal reasons but also because of interactions with route characteristics and duty timing. Further, Figure 6 shows that split break times vary significantly, with some as short as 100 min and some over 5 h (300 minutes). Further, split duties with a spread longer than 10.5 h incur a pay time premium equivalent to half the time in excess of 10.5 h, which is attractive to some operators seeking to maximize their pay. In the focus groups, operators noted that they dislike split duties with a short first piece and a long second piece, owing to the fatigue incurred by arriving at the garage early in the morning and waiting for up to 5–6 h between their first and second work pieces.
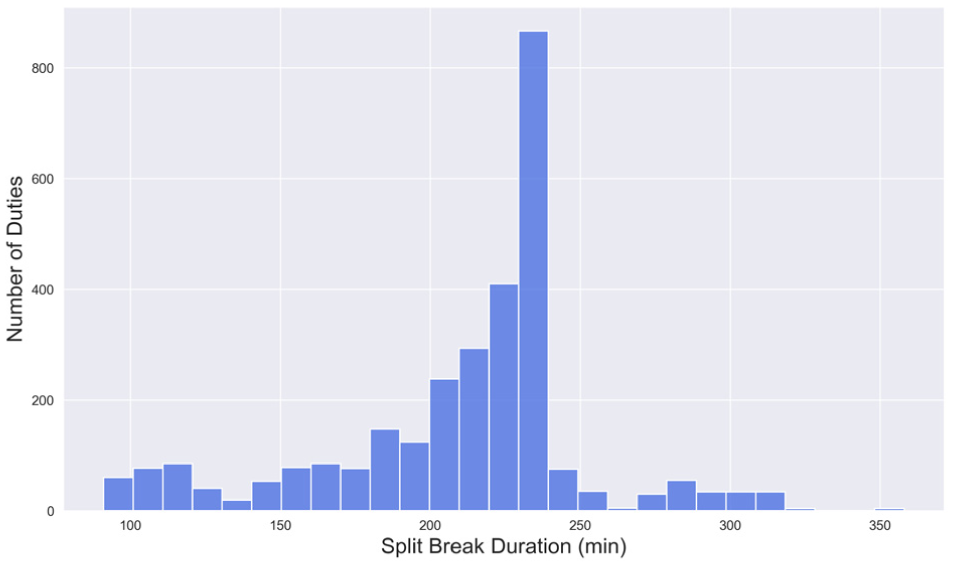
Split break durations for split runs—Winter 2023–24.
Days Off
Most operators prize weekend days off and see them as a seniority privilege. Figure 7 shows the percentage of nonblock, nonextraboard operators of each hire year that picked a schedule with at least one weekend off systemwide. These two types of operators are excluded from the analysis because they are already guaranteed some weekend days off. As discussed in the subsequent section, this is a significant reason for operators to select block duties. Figure 7 shows that getting even one weekday off is significantly less common among non-block, non-extraboard operators hired after 2015. In the focus groups, operators mentioned that when they cannot pick a schedule with weekends off, they may choose to be on the extraboard list instead. Extraboard operators receive their work assignments by 6 p.m. the night before and can be assigned to work any route at any time of day. Each garage has two extraboard lists. The most senior extraboard operators go on the “weekends off” list, depending on garage needs, and the remaining go on the “rotating days off” list. Operators on the “weekends off” list are only called for work Monday to Friday, while operators on the rotating days off list have a different set of 2 days off every week. Figure 8 shows the seniority distribution of operators who selected the extraboard during the Winter 2023–24 pick. Operators who are hired or return from leave after the picking process has concluded are assigned to the rotating extraboard by default. These operators are not included in the visualization but would skew the seniority distribution further rightward. The weekends off extraboard, however, consists of mid-senior operators who have selected the extraboard work assignment to get weekends off or because the duties available to them are undesirable. During the Winter 2023–24 pick at the CTA, 12%–26% of operators at each garage opted for an extraboard work assignment instead of a regular duty. This practice reduces overall efficiency by increasing the number of same-day work assignments that need to be handled by garage operations.
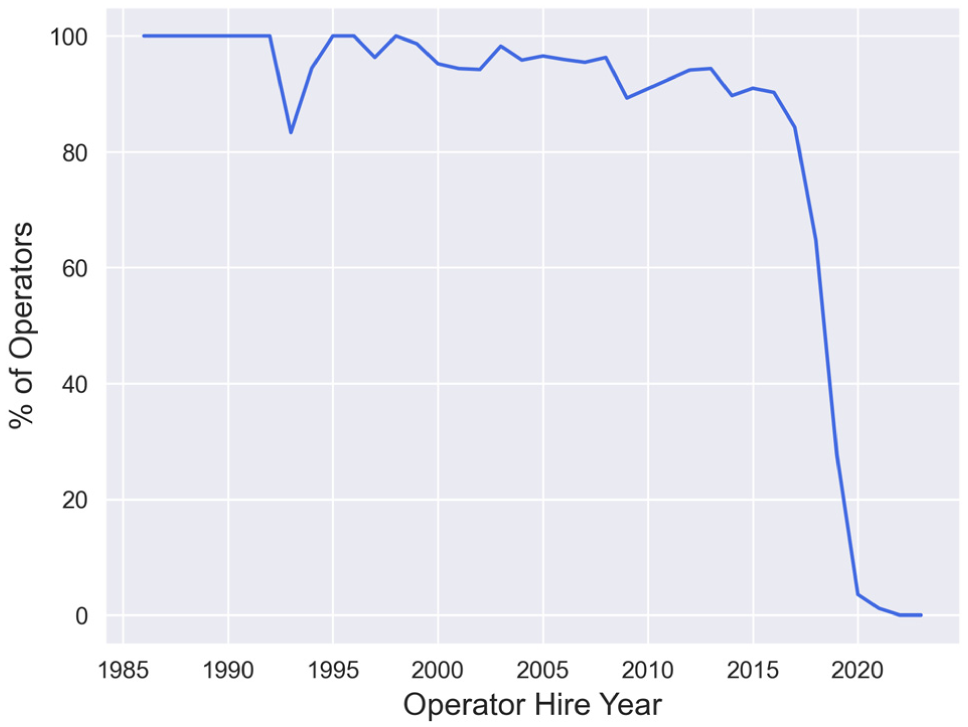
Percentage of operators with at least one weekend day off by hire year.
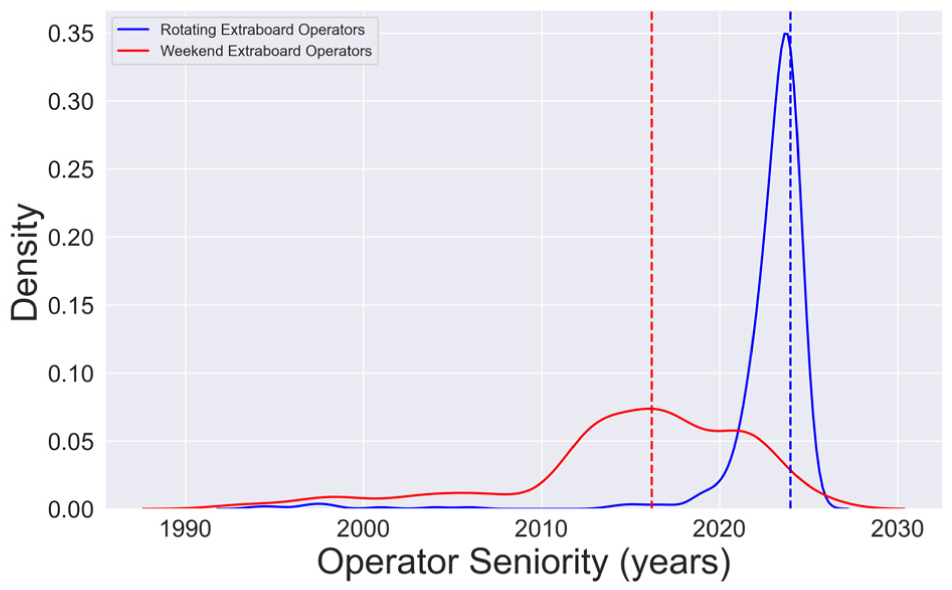
Kernel density estimation of the seniority distribution of extraboard operators.
Block Duties
A minority of operators have recently been able to choose a 4-day work package with 10-h duties (“block” duties); during Winter 2023–24 and Spring 2024, about 13% of operators selected block schedules. The current CBA between CTA and ATU allows up to 20% of duties to be block duties, and that they be offered only on weekdays ( 6 ) Therefore, selecting a block schedule yields a schedule with Saturday, Sunday, and a third day off, which can be used to accrue overtime hours. Block duties are rostered, meaning they are packaged into 4-duty weekly schedules that operators pick wholesale instead of selecting individual duties for each day of the week. According to the CBA, only block duties may be rostered. Figure 9 shows that block operators have a much narrower seniority distribution than nonblock operators, and tend to represent the middle of the seniority spectrum. Figure 10 shows the proportion of block run operators in each of the four seniority quartiles for the entire operator distribution: quartile 1 represents the 25% most senior operators and quartile 4 represents the 25% least senior operators. The figure further demonstrates the trend shown in Figure 9, that block schedules are most popular among operators in the second quartile (marked 2.0 on the x-axis), representing the 50th–75th percentile in operator seniority. Since morning 8-h duties tend to be more popular than block duties overall, many operators in the most senior quartile (represented by 1.0 on the x-axis) select those in lieu of block schedules. In contrast, operators in the second quartile of seniority do not have as many 8-h straight duties still available to them but find block schedules to be an attractive option. During the Winter 2023–2024 pick, none of the operators in the least senior quartile selected a block duty because few, if any, were still available. While some block duties, especially morning ones, are popular, they are not universally preferred. Afternoon or evening block duties, as well as split block duties, are less popular because they can end late at night, involve too much driving time per day, and have insufficient break time. More generally, some operators pointed out that having a condensed schedule with four longer duties per week makes the pay effect of an unexpected absence more significant. Despite these drawbacks, many operators reported wanting to select the block duties, but that there was an insufficient number of block duties available for them to select at pick time. All of the block rosters were selected by operators during the pick; there were no block rosters left over.
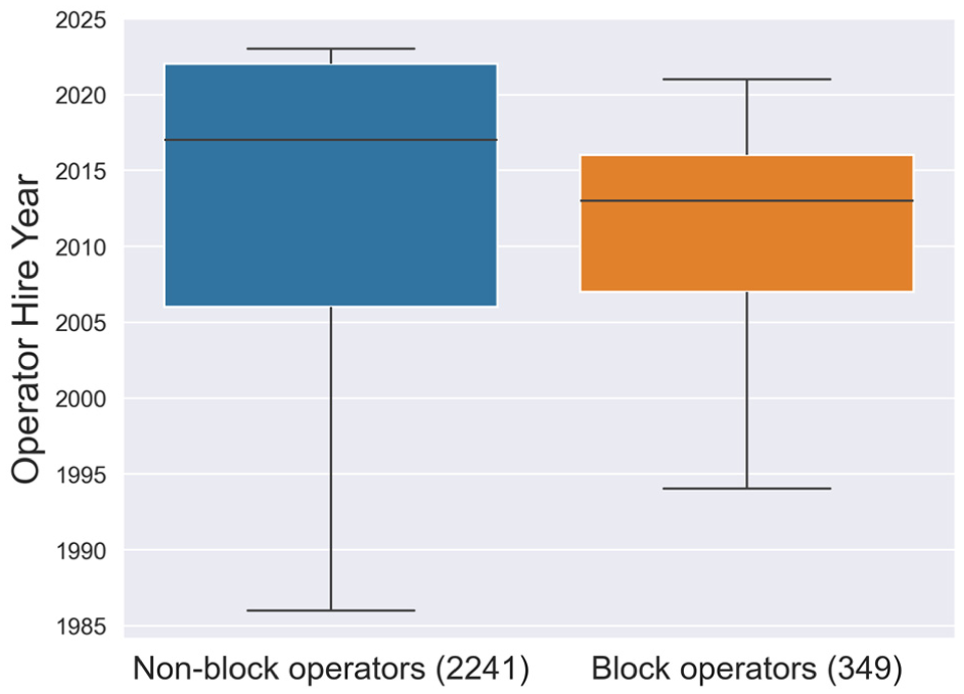
Seniority distribution of block and nonblock operators.
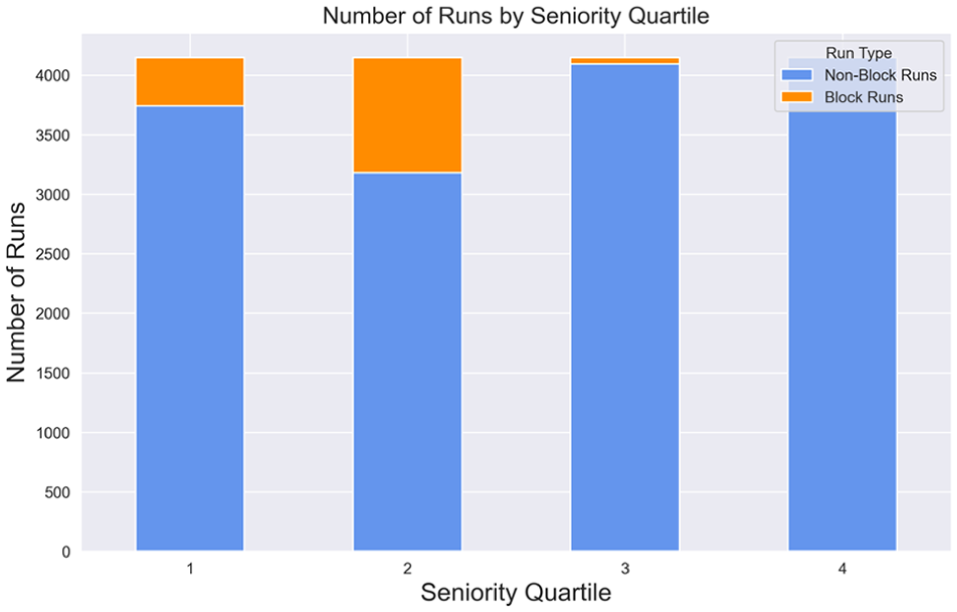
Block runs across seniority quartiles.
Route Characteristics
Operators view unrealistic running times and fare evasion as widespread, unavoidable, issues. Some routes are considered more dangerous, owing to expected negative public interactions, with preferences varying by garage. For example, in Kedzie, downtown routes are considered more desirable than west-side neighborhood routes, as the latter are perceived as more dangerous. Routes with inadequate service frequencies resulting in excessive crowding and negative passenger feedback are avoided. The location and timing of street reliefs are contentious, with most operators claiming that street safety has deteriorated in recent years. Many operators strongly desire more “pull-in” reliefs, where they end their work at a garage instead of an on-street location, particularly at night. Operators provided specific locations where they felt unsafe doing street reliefs, which tended to be those that were not well-lit, far from bathrooms and other services, or near sites of known gang or drug activity.
Discussion and Recommendations
This study provides a better understanding of bus operators’ work preferences, incorporating both quantitative and qualitative data on the importance of various work characteristics of operator-selected duties, and their relative desirability. The goal is to offer insights into aspects of scheduling bus operations that could enhance retention and job satisfaction among operators. The findings yield recommendations for changes to crew and vehicle scheduling processes, rooted in the CTA paradigm but applicable to most transit agencies in the U.S. These recommendations fall into two categories: “crew scheduling” and “vehicle scheduling,” which scheduling departments typically undertake sequentially. Implementation details may vary, based on institutional factors at the agency and the details of the CBA. Further, some of these recommendations, such as reducing street reliefs and split break durations, can potentially increase labor costs. Agencies must weigh these potentially increased costs with the advantages of higher retention and a more reliable workforce. However, several of these suggestions may significantly improve operator satisfaction with only low to moderate effort, potentially by expanding the use of schedule optimization software. Agencies can consider many of these recommendations individually, though some may interact.
Crew Scheduling Practices
Reduce the number of duties with split break time above 3 h.
Increase the number of block duty rosters (four 10-h days) available, especially those that start in the morning, and ensure that they have sufficient break time.
Where possible, make straight duties longer and reduce or eliminate the number of duties with less than 8 pay hours.
Introduce block duty rosters that cover weekends.
Implement a rotating day-off schedule for some nonblock duties.
Increase rostered work packages to offer greater day-to-day consistency and reduce heterogeneity in desirability between duties.
Vehicle Scheduling Practices
Alter the location of specific street relief points or increase the practice of having vehicles return to the garage between duties instead of scheduling street reliefs.
Reduce undesirable interlining (where an operator’s duty includes driving different bus routes in a single shift) combinations, especially those involving more than two routes.
Update run times to create more accurate schedules that give operators sufficient recovery time.
Limitations
This observational study provides a unique look into the candid work preferences of rank-and-file bus operators at CTA, but the study design has some limitations. First, because operators were engaged in public areas of the garages, this might have limited the candidness of their responses. Although management was not within earshot of the conversations, they were onsite and there was no expectation of privacy with these casual conversations. Although the decision to not record interviews was intentional and remains reasonable in the authors’ opinions, it did restrict the ability to closely analyze all the responses from the focus group. In future studies aimed to replicate these methods, recording of focus group sessions, if possible, might be considered, to provide a more detailed analysis of the focus groups’ responses. Similarly, in future studies, administration of a more formal survey to operators might be considered, asking operators to rank their preferences, to ensure that responses are confidential and free from groupthink bias, and to collect seniority information universally and ensure a balanced sample. Researchers should consider the social and institutional dynamics of the agency in determining the most appropriate method of engagement of rank-and-file bus operators.
Conclusion
In this study, we have identified CTA bus operators’ key priorities and analyzed trends in work characteristics relative to the seniority of the operators selecting them. Since the seniority-based work selection process is widely used at many North American transit agencies, the qualitative and quantitative findings of this study are highly replicable. Agencies can organize similar focus groups and preference ranking exercises with their operators, to elicit unstructured feedback about work preferences. Further, agencies can build similar data pipelines, linking work characteristic attributes from their scheduling platform with employee ID records with hire date, to derive similar analyses using the order of work selection as an indicator of work desirability. The findings of this study are likely to be applicable to many transit agencies in North America, particularly those in large cities with seniority-based work selection and complex transit service plans. Many of the recommendations of this study, including innovative scheduling practices and the improvement of relief conditions, are possible at other agencies with a similar makeup of service delivery to the CTA.
Further work on the topic of bus operator work preferences should be conducted to examine the specific tradeoffs that operators make when selecting their work duties. A discrete choice modeling approach to quantifying these relative preferences may be appropriate. Though complex, quantifying the importance of specific schedule characteristics is a critical step in distilling multidimensional work preference into an interpretable metric that can be used to guide future schedule development to increase operator quality of life and retention. This research was primarily designed to look at trends in work selection related to seniority, but other factors, such as sex, age, and race, might have significant policy implications, depending on the composition of an agency’s workforce. In this specific case, this information was not available to researchers for publication, because of privacy concerns, but in other research environments, with appropriate data privacy protocols, this information would be invaluable in generating a more nuanced understanding of operator work preferences, for a given agency’s specific operator population.
In addition, future research should be focused on developing a range of new crew scheduling scenarios and potential CBA modifications that implement these recommendations. The aim of these potential scenarios would be to improve the work quality for all operators without making new hires worse off. Specifically, in this research, we identify the expansion of block rosters as a critical priority for schedule changes, with the aim of improving operator quality of life. Expanding block schedules addresses several operator priorities, identified through focus groups and interviews, including increasing the number of operators with a weekend day off, reducing long split breaks, and facilitating the selection of higher weekly pay hours. Schedules implemented with these policy changes should balance the need to improve work quality for the least senior operators to increase retention while maintaining an appropriate advantage for the senior operators. Future research should explore both the attitudes toward and the feasibility of adopting block duties at agencies across the North America to provide a comprehensive overview of their current implementation status.
Footnotes
Acknowledgements
The authors thank members of the CTA Planning and Operations Departments for their assistance with and input to this work, specifically Jackie Johnston (Director of Scheduling), Elsa Gutierrez (Vice President of Scheduling and Service Planning), Brendan Dodge (Lead Bus Scheduler), Tom McKone (Chief Administrative Officer), Laura De Castro (Senior Project Manager- Implementation), and the 213 bus operators who participated in this study. In addition, we acknowledge research direction input and overall feedback from members of the MIT Urban Mobility Lab.
Author Contributions
The authors confirm contribution to the paper as follows: study conception and design: Amelia Baum, John Attanucci, Haris N. Koutsopoulos; data collection: Amelia Baum, Jackie Johnston; analysis and interpretation of results: Amelia Baum, John Attanucci, Haris N. Koutsopoulos; draft manuscript preparation: Amelia Baum, John Attanucci, Haris N. Koutsopoulos. All authors reviewed the results and approved the final version of the manuscript.
Declaration of Conflicting Interests
The authors declared no potential conflicts of interest with respect to the research, authorship, and/or publication of this article.
Funding
The authors disclosed receipt of the following financial support for the research, authorship, and/or publication of this article: Support from the CTA Data Analytics and Professional Development Research program is acknowledged.