
Abstract
In this study, the data-driven simulation framework CDRpy is presented, validated, and applied using the example of the city of Munich to support decision makers in the rollout of public charging infrastructure in urban areas. The innovation of the study lies in how CDRpy can be used to evaluate different concepts for public charging infrastructure at a detailed level. Demand was mapped based on real charging events for different types of electric vehicles and pricing models, and the evaluations were broken down to the level of individual charging stations. The developed framework was validated using charge detail records from Munich’s largest public charging infrastructure operator for the years 2020, 2021, and 2022. The validation compared CDRpy simulation results with real usage data for time utilization, energy transferred per month, and energy transferred per subdistrict. In a further case study, the additional demand for public charging infrastructure in the city was estimated for the year 2030. The results indicate that mixed and time-based pricing models could reduce the required number of public charging points by around 10% compared with energy-based pricing models. Determining the expansion requirements for each subdistrict showed that the additional demand for public charging infrastructure varied greatly across the city. Since both technological and economic perspectives were considered, the study is relevant for all decision makers involved in the planning, operation, and scaling of public charging infrastructure.
Keywords
Introduction
In recent years, the number of plug-in electric vehicles (PEVs) has increased steadily. In 2023, 14.2 million PEVs were registered worldwide, which corresponds to an increase of around 35% compared with the previous year with 10.5 million PEVs ( 1 , 2 ). In addition to the continued development of PEVs, the rollout of public charging infrastructure remains an important lever for the acceptance of electromobility. This study presents a methodology for evaluating the rollout of different concepts for public charging infrastructure. Concepts are understood here as interactions between the technological characteristics of the charging infrastructure such as charging technology and nominal charging power, the economic characteristics such as investment and operating expenses, and the pricing policy for charging events. The simulation framework developed was calibrated for the city of Munich based on real usage data from the largest operator of public charging infrastructure from 2020 to 2022, and was applied in a case study to determine the demand for public charging infrastructure in the city for the year 2030. The remainder of this paper is structured as follows: First, the relevant literature is reviewed and the research gap is identified. Next, the applied methodology is described. Subsequently, the results of the validation and the Munich case study are presented. Finally, the findings are discussed and conclusions are drawn.
Related Work
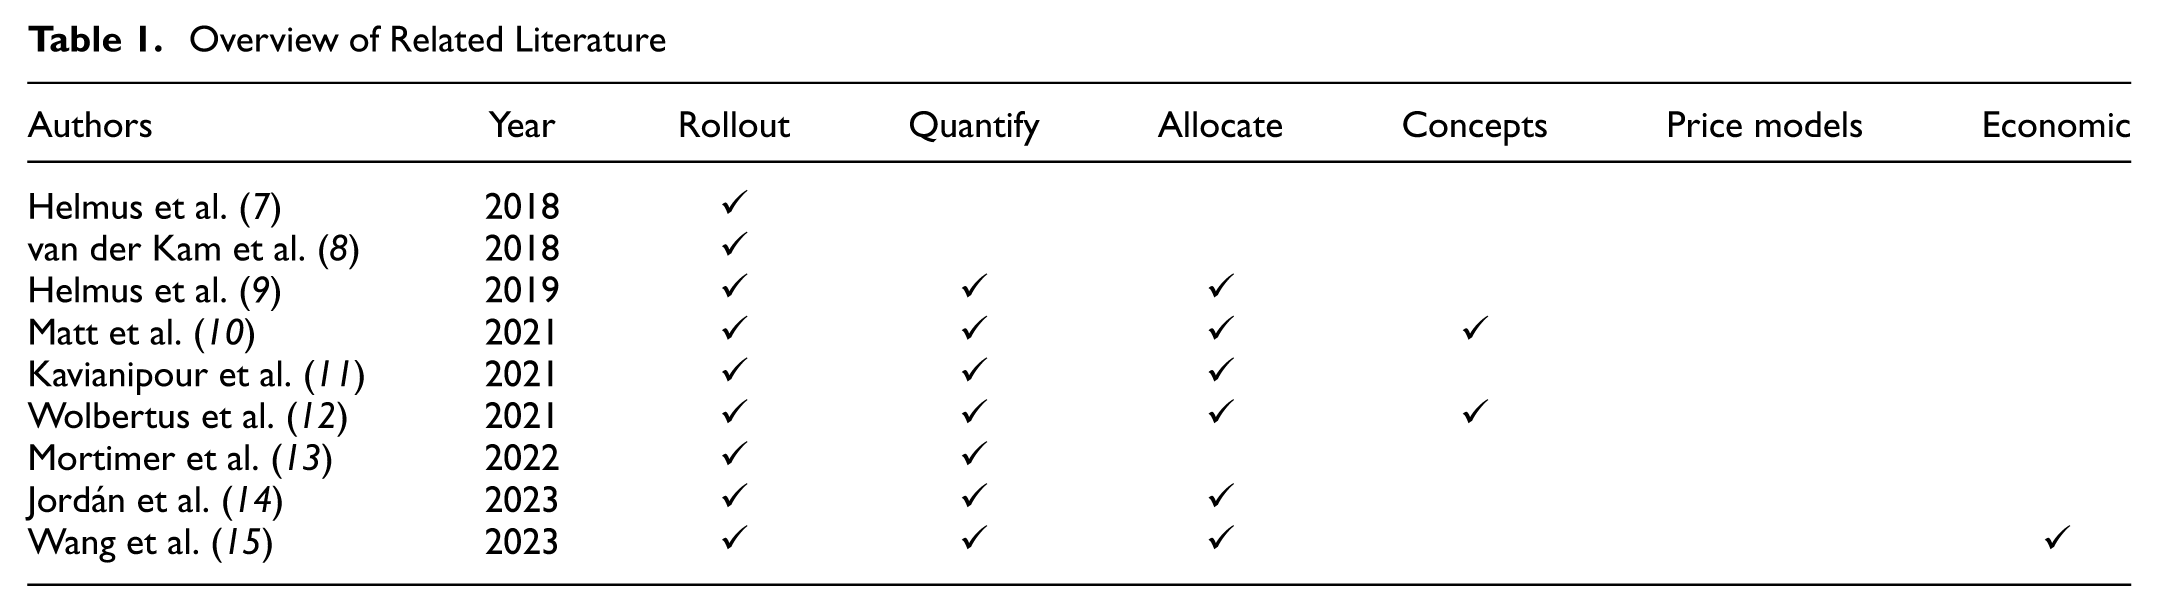
The usage behavior of public charging infrastructure has already been investigated using different key performance indicators such as time utilization, the amount of energy transferred per charging event, or the share of charging and idle time ( 3 – 6 ). Based on the charge detail records (CDRs) of the existing public charging infrastructure, conclusions can be drawn for the further scaling of the charging infrastructure. Table 1 provides an overview of studies that deal with the scaling of public charging infrastructure. In addition to indicating the authors and the year of publication, the table characterizes six research areas that are covered by the developed simulation framework CDRpy and thus enables a comparison of the previous studies and the identification of research gaps. The “Rollout” column indicates whether concepts for the further scaling of public charging infrastructure have been addressed in the study. The columns “Quantify” and “Allocate” indicate whether the number of public charging points required in the future has been quantified or spatially allocated to individual areas or charging locations. The columns “Concepts” and “Price models” indicate whether different technological concepts and pricing policies of public charging infrastructure have been considered during the rollout. The last column, “Economic,” indicates whether other economic parameters such as investment and operating costs and thus economic analyses have been carried out in addition to the pricing policy. The individual analyses and the existing research gaps are described below.
Overview of Related Literature
The studies by Helmus et al. ( 7 ) and van der Kam et al. ( 8 ) analyze historical usage data from real charging events to evaluate different rollout strategies for public charging infrastructure. In Helmus et al., demand-driven (pull) and strategic (push) rollout strategies are analyzed based on over 1 million charging events at about 1,700 charging stations in the Netherlands from 2012 to 2016 ( 7 ). The results indicate that demand-driven charging stations had fewer unique users but a higher connection time and amount of energy transferred, whereas strategically installed charging stations had a higher share of effective charging time. The study concludes that neither strategy consistently delivers better results, and rollout strategies should therefore be combined. In addition, the mentioned values showed considerable changes over the course of the study period and were strongly influenced by the PEV share in the study area. In van der Kam et al.’s research, possible rollout strategies are identified using a decision tree based on around 850,000 charging events from 2017 and 2018 ( 8 ). Key parameters for the development of the rollout strategies are the connection duration, the amount of energy transferred, and the share of charging and idle time.
The current most relevant model for the simulation of public charging infrastructure in urban areas is the validated agent-based model, simulation of electric vehicles activity (SEVA), which was first presented in the study by Helmus et al. ( 9 ) and applied in subsequent publications ( 16 , 17 ). The behavior of the agents is determined by the charging history of individual users. Each agent has one or more clusters of charging locations that are frequently used, with each cluster having a distribution of arrival and connection times. Demand behavior is defined based on the charging history of real users. A major limitation of SEVA is thus accessing extensive user-related public charging infrastructure data for the considered study area. With regard to the simulation of public charging infrastructure, SEVA focuses on alternating current (AC) charging infrastructure, as this charging technology is characterized by longer connection durations and a stronger habitualization (i.e., the tendency of users to integrate charging into fixed daily routines at specific, frequently used locations). The derivation of relevant activity patterns is, therefore, easier as compared to the use of direct current (DC) or high power charging (HPC) charging infrastructure, which usually only has short connection durations and a less predictable charging behavior. Since the activity patterns of the agents represent charging habits at specific locations, it is not possible to transfer the usage patterns to other cities. The model was validated by comparing the simulated and actual activity patterns of the public charging infrastructure in the four largest cities in the Netherlands.
Another relevant model is the Electric Vehicle Infrastructure Projection Tool (EVI-Pro). The model was developed to determine the demand for charging at home (residential), at work (workplace), and at public charging stations (public charging) and therefore for different types of charging infrastructure locations. The modeling and evaluation of the charging infrastructure is carried out at the political or strategic level for states or countries. The demand behavior on the charging infrastructure is modeled based on PEV market forecasts and real mobility data. The tool can also take into account different charging technologies with AC and DC charging infrastructure, determining the optimal combination to meet the needs of drivers ( 18 – 20 ). A study by Wood et al. describes the validation approach for EVI-Pro, comparing the charging events per day per charging point and the energy delivered with real data from charging stations in Columbus, OH, Austin, TX, and Seattle, WA ( 21 ). The results of this comparison showed that the energy per session simulated by EVI-Pro at public AC charging stations was well informed by the empirical data but that the model overestimated the simulated energy per charging event at DC charging stations. In the case of charging events per day per charging station, EVI-Pro overestimated the frequency of use for both AC and DC charging stations. As a result, EVI-Pro was further developed to calibrate the model using real-world utilization data from the charging infrastructure ( 10 , 22 ).
The studies by Kavianipour et al. ( 11 ) and Jordán et al. ( 14 ) deal specifically with the planning of locations for fast charging infrastructure. In Kavianipour et al. ( 11 ), a framework is presented and applied using the example of Michigan, which deals with the planning of locations for fast charging infrastructure in urban areas, considering daily travel and charging behavior. The charging behavior was generated using a simulation tool based on driving trajectories, and only DC charging infrastructure with a charging power of 50 to 150 kW was considered. In Jordán et al.’s study, an evolutionary approach for the optimization of a network of charging stations for PEVs in interurban areas is presented ( 14 ). An evolutionary algorithm is used to optimize the placement and power of charging stations to ensure efficient coverage and usage.
In studies by Wolbertus et al. ( 12 ) and Wang et al. ( 15 ), rollout strategies for public charging infrastructure are evaluated using agent-based models. The objective of the model developed in Wolbertus et al. is to analyze how different rollout strategies influence the availability and use of charging infrastructure, and to derive recommendations for action for policy makers ( 12 ). The developed model simulates the behavior of PEV users based on real charging data and considers three types of charging concept: single AC charging stations, clustered AC charging stations, and fast charging stations. The model was used as an example for the city of Amsterdam and quantifies, among other things, the number of possible and impossible connections as well as the number of installed charging stations per charging concept. The agent-based model developed in Wang et al.’s research considers different actors such as vehicle manufacturers, consumers, public sector investors, and social investors ( 15 ). The aim is to simulate the development of the share of PEVs and the expansion of public charging infrastructure in the period from 2010 to 2040. The investment and operating expenses as well as the annual revenue were estimated based on the number of PEV owners within a certain service radius. However, a differentiated evaluation of the rollout strategies and the economic results based on the amount of energy transferred or simulated usage behavior was not carried out.
In Mortimer et al.’s study, a planning approach for the rollout of public charging infrastructure is presented, considering the attractiveness of potential charging locations through nearby points of interest (POIs) ( 13 ). Two concepts are compared: the market-based approach, in which private companies install charging stations at attractive locations, and the policy-driven approach, in which charging stations are installed at locations with a low charging station density. The model is applied to Cologne and the whole of Germany. The data basis for the study is the same data set as used in Hecht et al.’s research ( 23 ). Since this data set only contains information on the temporal occupancy of the charging points, factors such as the transferable energy quantities cannot be considered in the evaluation of the construction strategies. Furthermore, the study does not explicitly differentiate between different types of AC and DC or HPC charging infrastructure.
In summary, previous studies have generally modeled and evaluated the introduction of public charging infrastructure at a macroscopic level. Specific characteristics of the public charging infrastructure and the PEV fleet, such as the number of charging points per charging station, the nominal charging power of the vehicles or charging points, the charging technology, the available grid connection power, the occupancy behavior and the investment and operating expenses for different concepts to public charging infrastructure were not or could not be considered to a sufficient extent. Considering the current state of research, this study presents a methodology for evaluating different concepts for public charging infrastructure in urban areas from an economic and technological perspective. The resulting agent-based simulation framework, CDRpy, covers all the research areas listed in Table 1. CDRpy is based on the principles of the agent-based simulation environment developed in Fischer et al. ( 24 ), which focused on the evaluation of charging infrastructure in semipublic spaces. Charging infrastructure in semipublic spaces refers to private spaces such as park-and-ride facilities that are accessible to certain customer groups, whereas private charging infrastructure is defined as being on private property such as garages, and public charging infrastructure on public spaces such as public roadsides ( 25 ). This means that rollout strategies for different public charging infrastructure concepts can be evaluated by CDRpy using defined parameters such as the amount of energy that can be transferred, utilization behavior over time, and profitability. As in the studies by Helmus et al. ( 9 ) and Wolbertus et al. ( 12 ), demand behavior is formed based on real charging events. In contrast to this studies of Helmus et al. (9) and Wolbertus et al. (12), CDRpy uses anonymized demand data, which enables better data availability and applicability of the model to other cities. Among other things, different occupancy logics, the number of charging points per charging station, and the nominal charging and grid connection power can be evaluated. In economic terms, the simulation environment also allows different pricing models such as energy-based or time-based charging tariffs for the use of public charging infrastructure to be considered. The functionality of CDRpy is intended to support decision makers in the planning, operation, and scaling of public charging infrastructure in urban areas. The aforementioned SEVA and EVI-Pro models serve as a reference for categorizing the CDRpy thematically.
Methodology and Data Description
The methodology of the simulation framework, CDRpy, is described below, using the city of Munich as an example. Figure 1 shows the model architecture of CDRpy, divided into system design and system behavior. In System Design, the agents and system boundaries are determined, including the temporal and geographical definitions of the study area, the PEV fleet, and the charging concepts to be evaluated. System Behavior defines the behavior of the agents, including mobility behavior, annual energy demand, and the usage behavior of the charging concepts. The individual parts of the model architecture are explained in detail below.
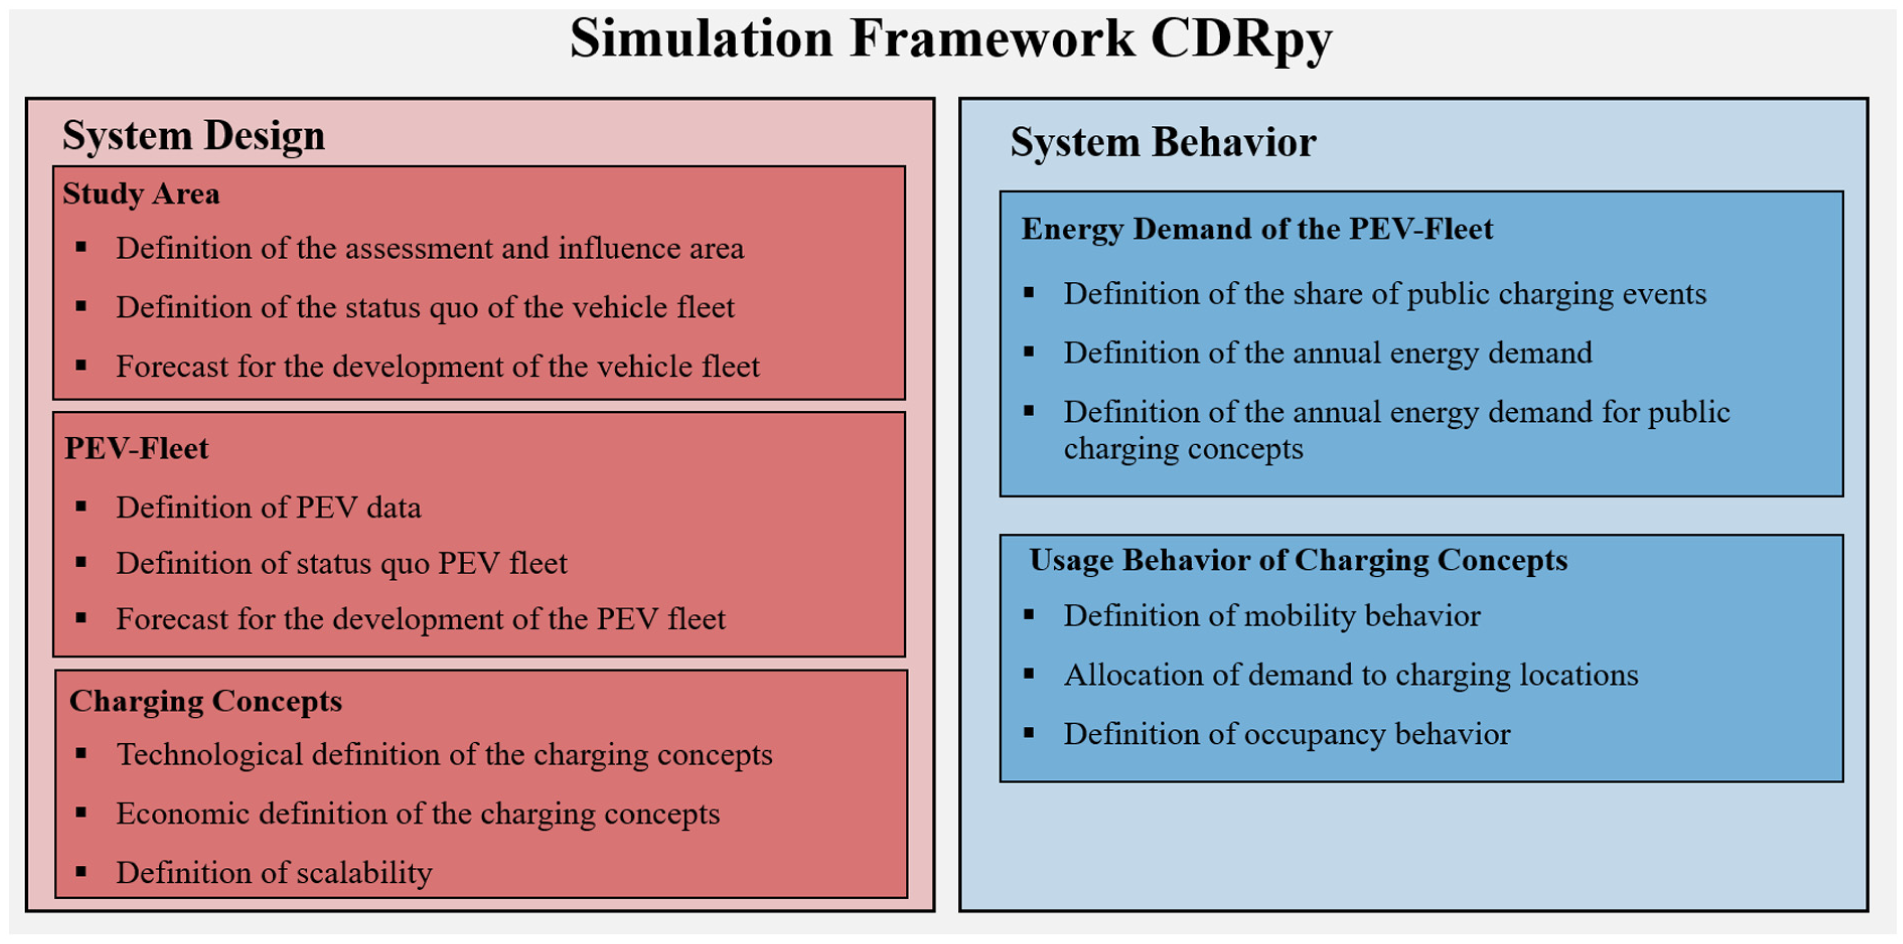
Model architecture of CDRpy.
In Study Area (Figure 1, left-hand panel), the geographical area of application is defined, consisting of the study area: assessment area and influence area. The study area covers the entire geographical area of the simulation. Concepts for public charging infrastructure are placed and evaluated in the assessment area. The influence area borders on the assessment area and can generate demand through commuter traffic. Figure 2 shows the study area: the urban area of Munich is the assessment area (Figure 2a), and the surrounding counties the influence area (Figure 2b). These areas consist of smaller geographical areas that define the spatial resolution of the simulation.
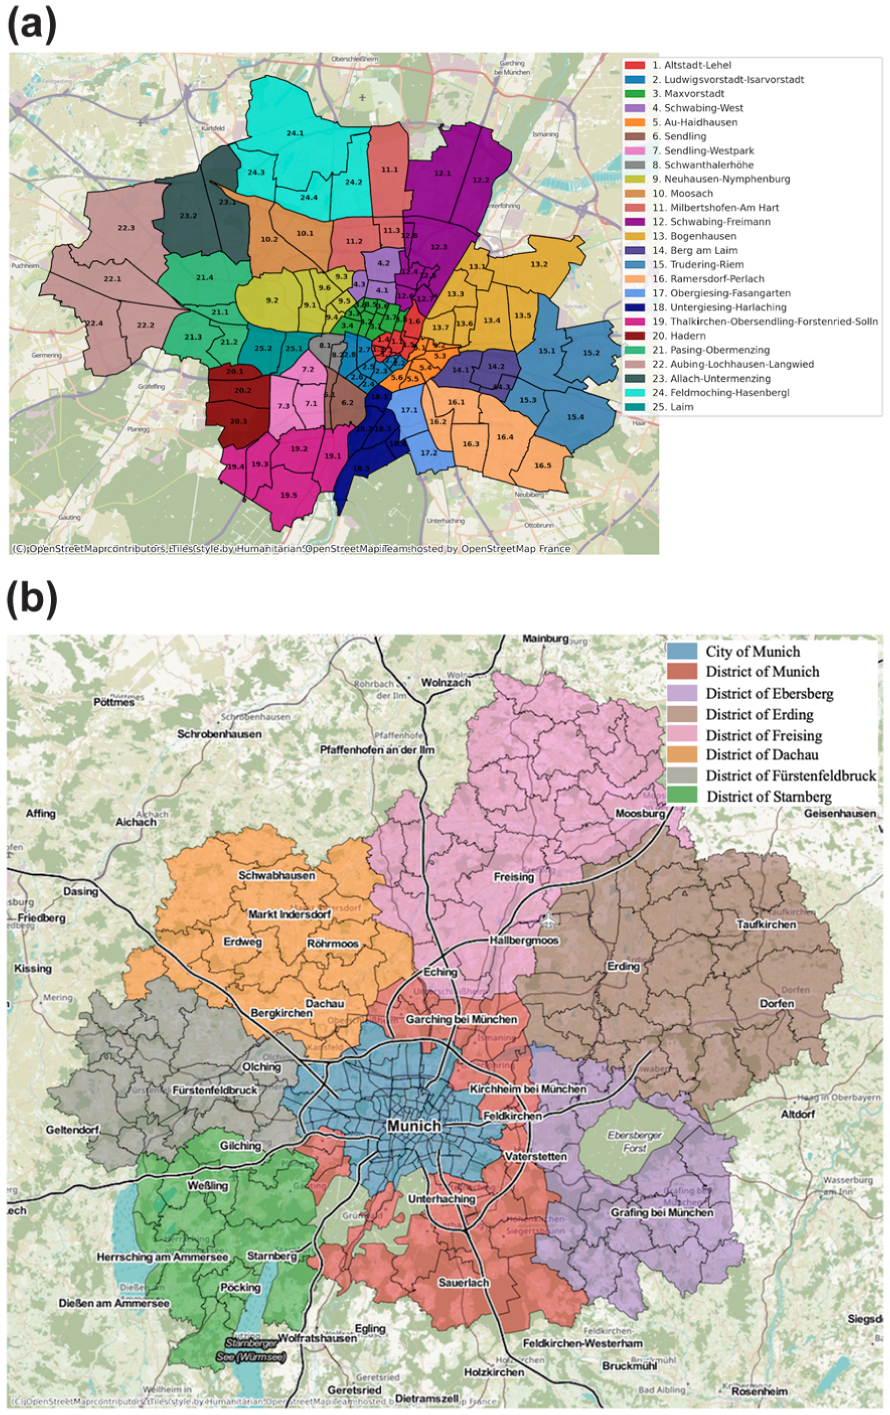
Study area: (a) assessment area—city of Munich, and (b) influence area—Munich Metropolitan Region.
The assessment area in Figure 2a comprises the urban area of Munich, divided into 25 city districts and 108 subdistricts. The city districts in the center are historic old-town districts with dense development, whereas the outlying districts have a lower building density ( 26 , 27 ). For the assessment of the charging infrastructure, the 108 subdistricts were used as the smallest geographical unit. In 2023, about 750,000 passenger cars were registered in Munich, 71% of which were private and 29% commercial ( 28 ).
The influence area comprises the seven districts surrounding the city of Munich, as shown in Figure 2b. The 154 municipalities in these districts served as the smallest geographical units. Additional demand in the assessment area was generated from these areas, but without the placement and assessment of charging infrastructure there. In 2023, around 850,000 passenger cars were registered in the 154 municipalities, of which 84% were private and 16% commercial ( 29 ).
In the part PEV-Fleet (Figure 1), the vehicle parameters of the PEV fleet were defined using a database consisting of 280 battery electric vehicle (BEV) and 30 plug-in hybrid electric vehicle (PHEV) models from different segments. Figure 3 shows the parameters of the PEV fleet for AC and DC/HPC charging events, with the usable battery capacity in kilowatt-hours (kW-h) on the y-axis and the maximum usable charging power on the x-axis. An HPC charging point is considered to be a DC charging point with a charging power of
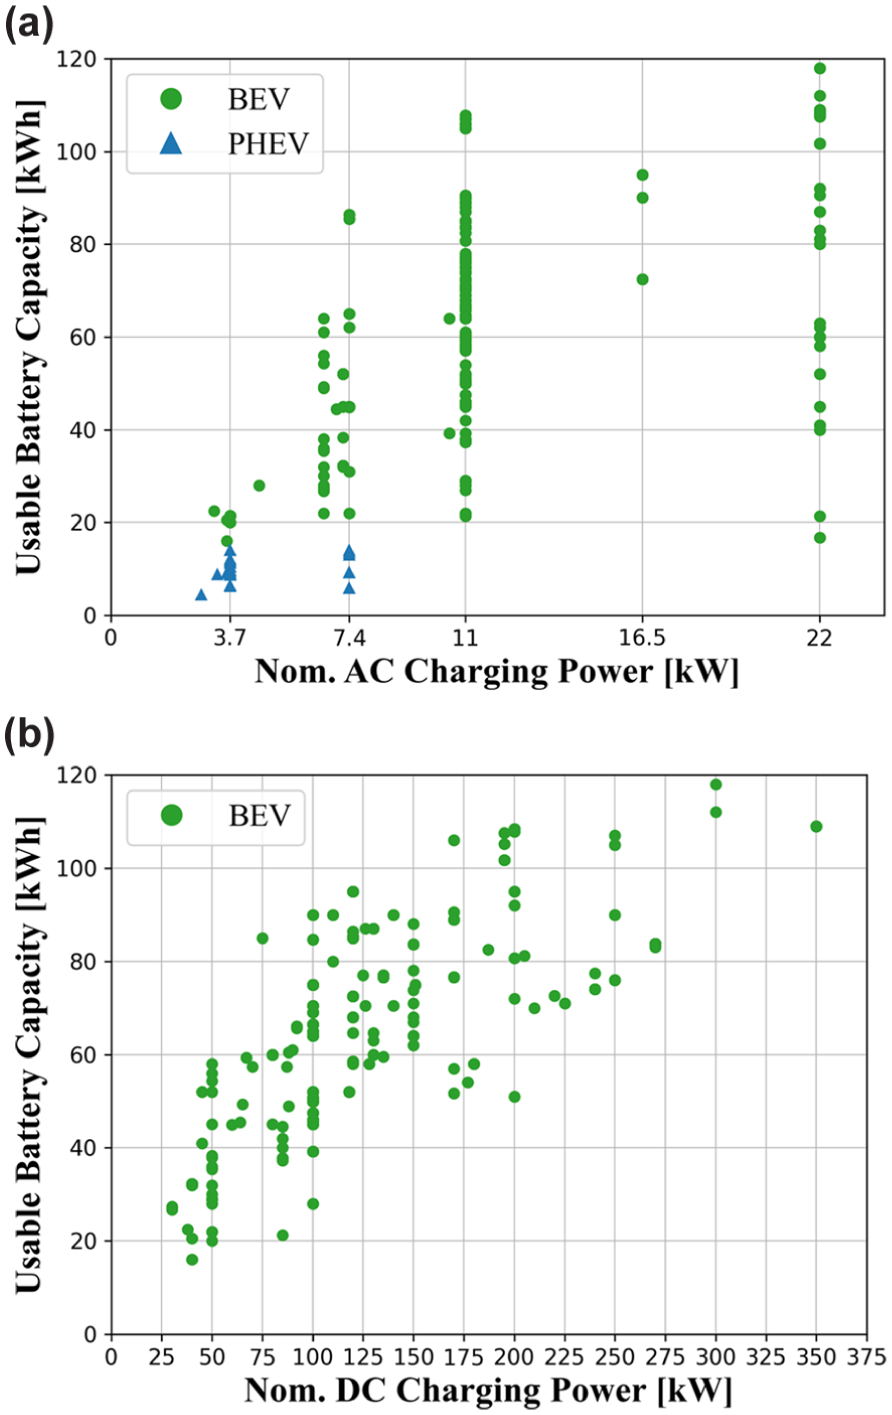
Charging parameters of the PEV fleet: (a) AC charging events, and (b) DC/HPC charging events.
Figure 3a shows the parameters of the fleet for AC charging events, differentiated by BEV and PHEV. All 310 PEV models recorded could use AC charging infrastructure, whereas DC and HPC charging infrastructure could be used by an exclusive subset. The nominal charging power represents the maximum possible charging power with which the individual PEV models can be charged. The nominal charging power is defined by the onboard charger and the battery management system of the PEV. The nominal AC charging power was divided into five power classes, with 180 of the 280 BEV models having an AC charging power of 11 kW, whereas the power values for PHEV models were typically between 3 and 7 kW. BEV models therefore had a higher rated charging power and battery capacity than PHEV models, which was reflected in the demand behavior by a higher energy demand per charging event and power. Figure 3b shows the vehicle-specific parameters for DC and HPC charging events. The nominal DC and HPC charging power was 136 kW on average and had a median value of 120 kW. Around 40% (104 out of 271) of the models reached at least 150 kW and could therefore utilize the high power of the HPC charging infrastructure. The demand behavior was affected by the PEV models and the composition of the PEV fleet. The share of the respective PEV models in the simulation was determined by the share of the vehicle segments in the vehicle population and the share of BEVs and PHEVs, whereby the share of the vehicle segments was defined using the average value from 2020 to 2022 in Germany ( 31 ).
Figure 4 shows the predicted PEV share of the total vehicle population in the study area from 2020 to 2030, broken down into BEVs and PHEVs as well as private and commercial vehicles. In the selected scenario for the case study, the PEV share in 2030 was around 14%.
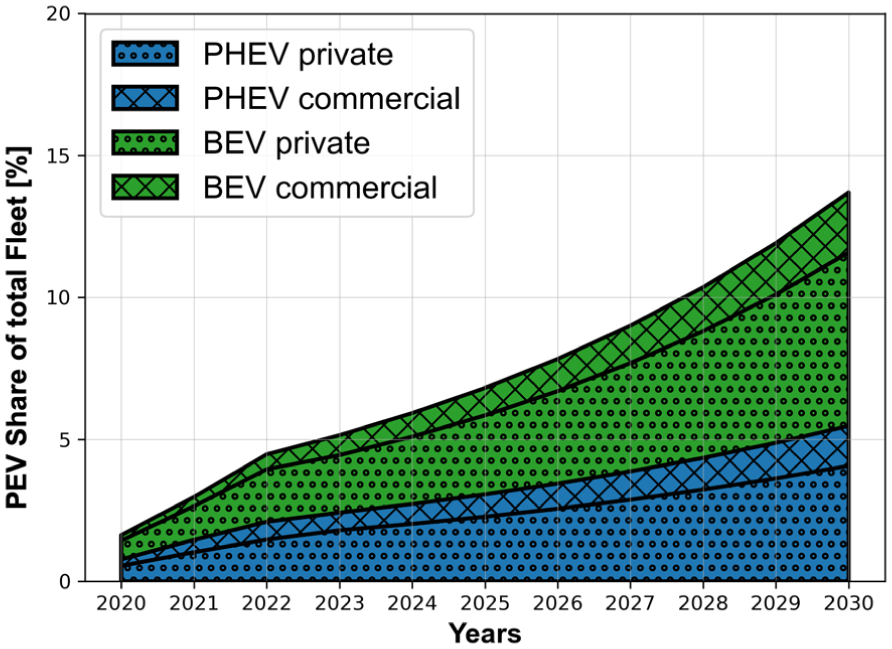
Scenario in the study area.
The scenario was defined in consultation with the city of Munich and is based on the German government’s climate protection program, with the aim of achieving a stock of 7 to 10 million PEVs by 2030 ( 32 ). The current share of BEVs and PHEVs in the PEV fleet in Germany is 50% each ( 29 ). As part of the definition of the future scenario in collaboration with the city of Munich, the assumption was made that the BEV share will increase from 50% to 60% by 2030. The ratio of private and commercial vehicles corresponds to the existing vehicle population in the study area. The differentiation between BEV and PHEV as well as private and commercial vehicles is necessary because the usage behavior can thus be defined separately for these user groups in the system behavior of CDRpy. Therefore, the annual energy demand was calculated separately for private and commercial PHEVs. For this purpose, the electric driving share for PHEVs was determined by calculating the utility factor according to Eder et al. ( 33 ) and SAE International ( 34 ). As studies ( 35 , 36 ) have shown that the electric driving share differs for private and commercial PHEVs, the utility factor was calculated separately for private and commercial PHEVs.
The parameters of the public charging infrastructure are defined in “Charging Concepts” (see Figure 1, left-hand panel). Table 2 contains the parameters for six different types of charging station. The choice of charging station was made to evaluate different types and to illustrate the functionalities of CDRpy. Two types of station were defined for each charging technology. For easier categorization, each charging station was given a short name based on charging technology, number of charging points, and nominal charging power. Parameterization, including charger cost assumptions, was based on studies ( 37 – 40 ) and on consultations with manufacturers and operators of public charging infrastructure.
Parameters of Charging Station Concepts
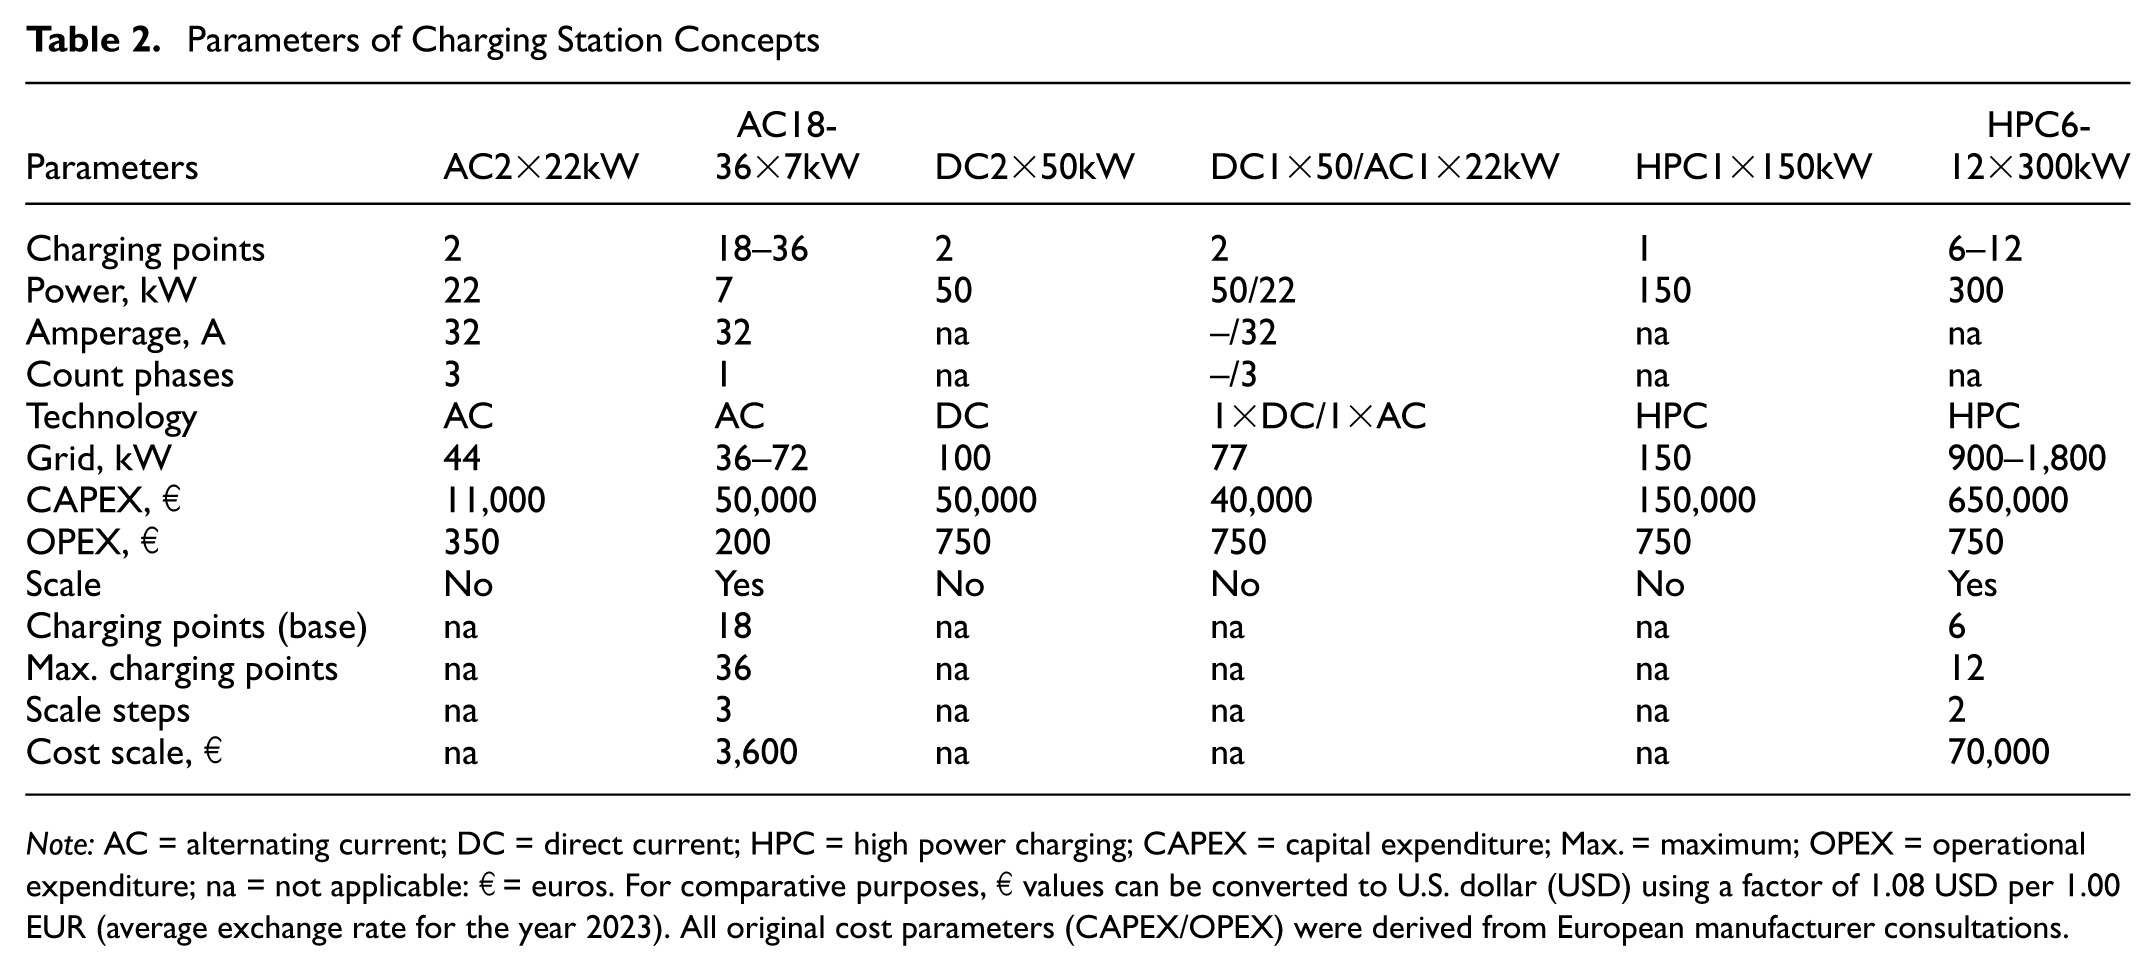
Note: AC = alternating current; DC = direct current; HPC = high power charging; CAPEX = capital expenditure; Max. = maximum; OPEX = operational expenditure; na = not applicable: € = euros. For comparative purposes, € values can be converted to U.S. dollar (USD) using a factor of 1.08 USD per 1.00 EUR (average exchange rate for the year 2023). All original cost parameters (CAPEX/OPEX) were derived from European manufacturer consultations.
AC2×22kW is an AC charging station with two charging points and a nominal power of 22 kW. This charging station is the current standard approach in Munich. The grid connection power enables both charging points to be supplied with 22 kW. In contrast, AC18-36×7kW is designed with a grid connection power of 2 kW per charging point at full occupancy, resulting in a reduction of the charging power from the nominal 7 to 2 kW when all charging points are in use. The nominal 7 kW represents the maximum charging power that a single charging point can deliver when the station is not fully occupied; at partial utilization, the available grid capacity is distributed across fewer vehicles, enabling higher per-point charging power. At full occupancy, the charging power is limited to the minimum of 2 kW per point, which ensures continuous charging operation. A key characteristic of this configuration is its ability to scale the number of charging points from 18 up to 36 without the need to install an additional charging station. Because each charging point uses a single phase, expansions are made in steps of three charging points to maintain balanced loading across the three-phase AC network. The grid connection power is dimensioned at 2 kW per charging point, corresponding to 36 kW for 18 charging points and 72 kW for 36 charging points. The allocation of 2 kW represents the minimum required charging power for AC charging (6 A per phase) to ensure that PEVs enter a charging state and to prevent unintended interruptions in the charging process ( 41 ). The capital expenditure (CAPEX) investment costs include the costs for the charging station, installation and grid connection, whereas the OPEX (operating expenses) cover the backend connection, maintenance, and servicing. For AC18-36×7kW, the CAPEX includes the basic version with 18 charging points, and the costs per scaling step include the expansion of three charging points.
In contrast to the AC charging infrastructure, DC and HPC charging infrastructure enables higher charging power, but is limited by vehicle-specific charging parameters (see Figure 3b). Depending on the share of BEVs in the PEV fleet, only part of the demand can be met at DC and HPC charging points. Two different concepts of DC charging infrastructure were considered in the study: DC2×50kW and DC1×50kW/AC1×22kW. Here, the DC charging power of 50 kW was in the lower range of the charging power possible on the vehicle side. With DC1×50kW/AC1×22kW, an approach was also defined that had one DC and one AC charging point each and could therefore be used by both BEVs and PHEVs.
With 150 and 300 kW, the HPC charging infrastructure is in the middle to upper range of the possible power of the BEV fleet. HPC1×150kW offers one charging point with 150 kW, whereas HPC6-12×300kW offers two charging points with 300 kW per station. The grid connection power of HPC6-12×300kW is 150 kW per charging point and can be scaled cost-efficiently. At the full expansion stage with 12 charging points, the investment costs for HPC6-12×300kW were around €72,000 per charging point, compared with €150,000 for HPC1×150kW. HPC6-12×300kW thus appeared more cost-efficient for scenarios with high BEV penetration, whereas HPC1×150kW offered advantages for low BEV penetration by enabling the construction of individual HPC charging points in different geographical areas.
In the part titled Energy Demand of the PEV-Fleet (see Figure 1, right-hand panel), the energy demand of the PEV fleet for public charging infrastructure is determined for the study area. The annual energy demand is based on the annual mileage, the consumption values, and the electric driving share of PHEVs (33–36, 42 ). For Munich, the share of energy demand for public charging infrastructure was estimated using a structural data set that covered the urban area and the surrounding districts. The geographical resolution of the structural data set was adapted to the study area.
The share of the annual energy demand that was covered by public charging infrastructure was estimated based on the building characteristics. It was assumed that there was insufficient access to private parking spaces and private charging infrastructure, especially in areas with high-density housing, so that the energy demand there must be covered by public charging. Figure 5 shows the distribution of charging events in the assessment area. On average, the share of public charging events was around 45%, with central districts having up to 90% and peripheral districts a minimum of around 6%.
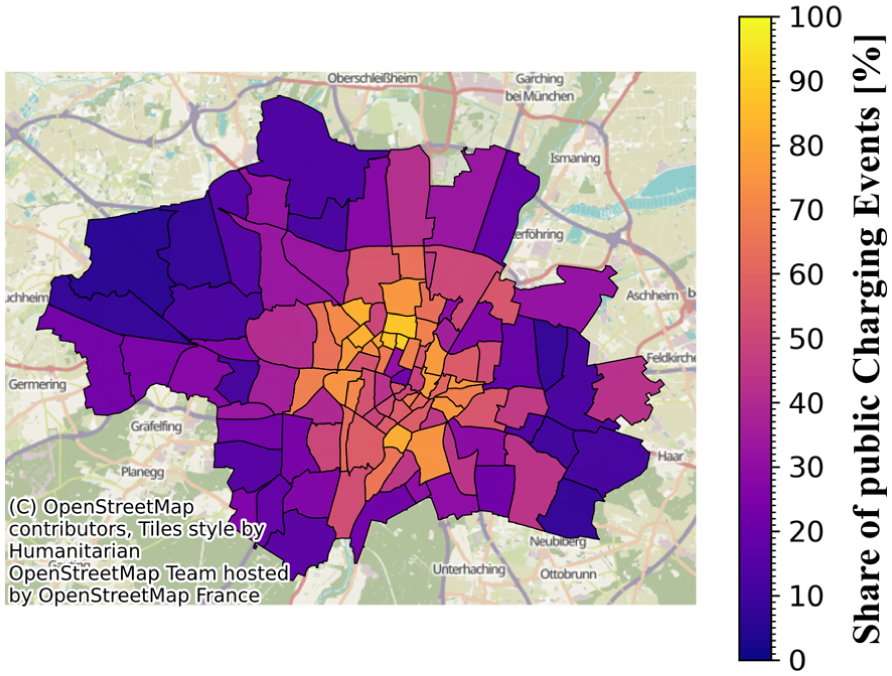
Share of public charging events in the assessment area.
In the part Usage Behavior of Charging Concepts, the defined energy demand is distributed spatially and temporally to the public charging infrastructure in the assessment area. Demand behavior includes the connection duration, the amount of energy demanded, and the temporal and spatial distribution of charging events in the assessment area. Occupancy behavior describes how PEVs search for and occupy a free charging point. As previous studies have indicated that usage behavior depends on various aspects, it is possible for usage behavior to be defined in CDRpy for different charging technologies, PEV types, location types, and price models ( 43 , 44 ).
Whether the PEV model under consideration could transfer the required amount of energy in the available connection time was confirmed for each charging event, it is checked. The CDR data sets of the companies Wirelane and Stadtwerke München (SWM) were used in this study to define demand behavior. Figure 6 shows the locations of the charging stations in the data sets. The SWM data set included around 1.8 million charging events from 2020 to 2022 in Munich. With around 1,200 AC and 50 DC charging points, SWM is the largest operator of public charging infrastructure in Munich.
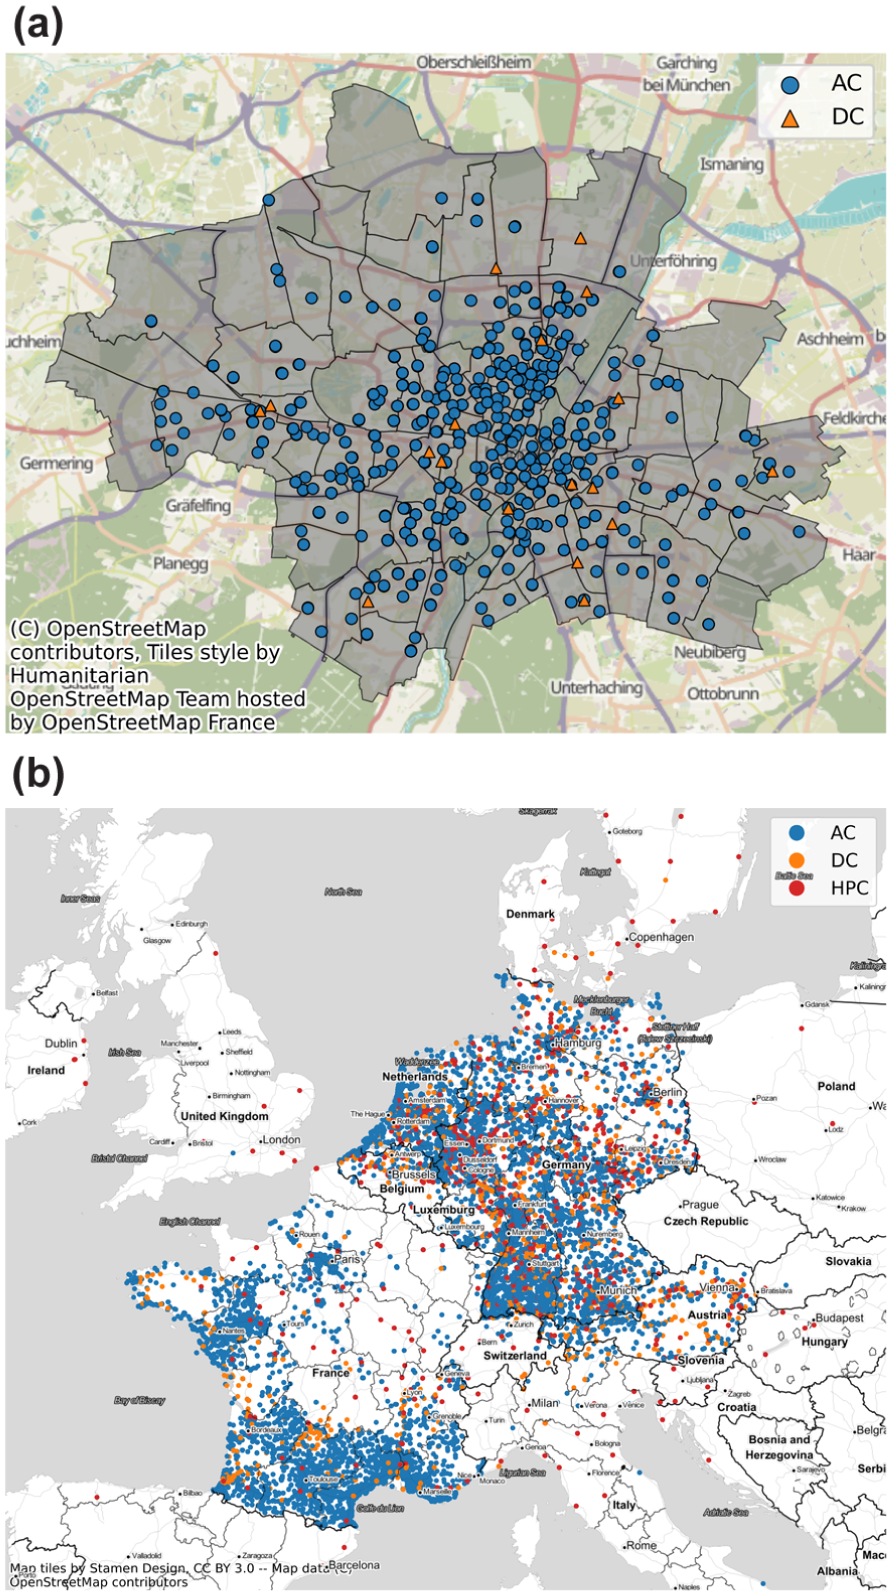
Charging location CDR data sets: (a) CPO data set from SWM, and (b) EMSP data set from Wirelane.
The Wirelane data set included 3.1 million charging events from European countries at around 30,000 AC, 3,600 DC, and 5,300 HPC charging points from 2020 to 2022. In contrast to the SWM data set, this data set contained information on the charging tariff, which allowed charging events to be classified into different pricing models. The data sets differed in scope, the geographical distribution of locations of the charging stations, and in the type of information. As SWM is the largest operator of public charging infrastructure in Munich, this data set was used to validate CDRpy for Munich and thus to calibrate the simulation framework for future scenarios in the case study. The Wirelane data set, on the other hand, was suitable for evaluating future scenarios owing to its variety of charging technologies and pricing models. A more detailed analysis of the CDR data sets can be found in Fischer et al.’s research ( 43 , 44 ).
Where PEV models could use several charging technologies with AC and DC or HPC charging infrastructure, demand behavior was defined separately for the individual charging technologies. To ensure that the same energy demand was not covered more than once (e.g., double coverage) by the individual charging technologies, CDRpy maintained an energy balance for each PEV model, which was adjusted during runtime. The future demand behavior of the individual PEVs was thus continuously adjusted based on the selected charging station type in past charging events.
Figure 7 illustrates the logic of the energy balance. In the example, the DC charging point of charging station DC1×50/AC1×22kW is occupied by a BEV, whereby information such as demand ID, PEV ID, and the requested energy from the database is linked to the charging event. In the example, PEV A covers 20 kW-h of the energy demand at the DC charging point. As PEV A can also use AC charging infrastructure, the demand behavior for AC and DC charging events was defined in parallel. To avoid double coverage, the AC demand behavior is adjusted. For this purpose, future AC charging events are reduced by the 20 kW-h demanded at the DC charging point. AC Charging Events 1 and 4 are completely removed, whereas AC Charging Event 6 is reduced to 15 kW-h, and AC Charging Event 8 remains unchanged. This balancing is applied for each new occupancy if the PEV in consideration can use more than one charging technology. This logic leads to a continuous adjustment of future demand behavior, with the individual charging technologies competing for the demand of PEVs.
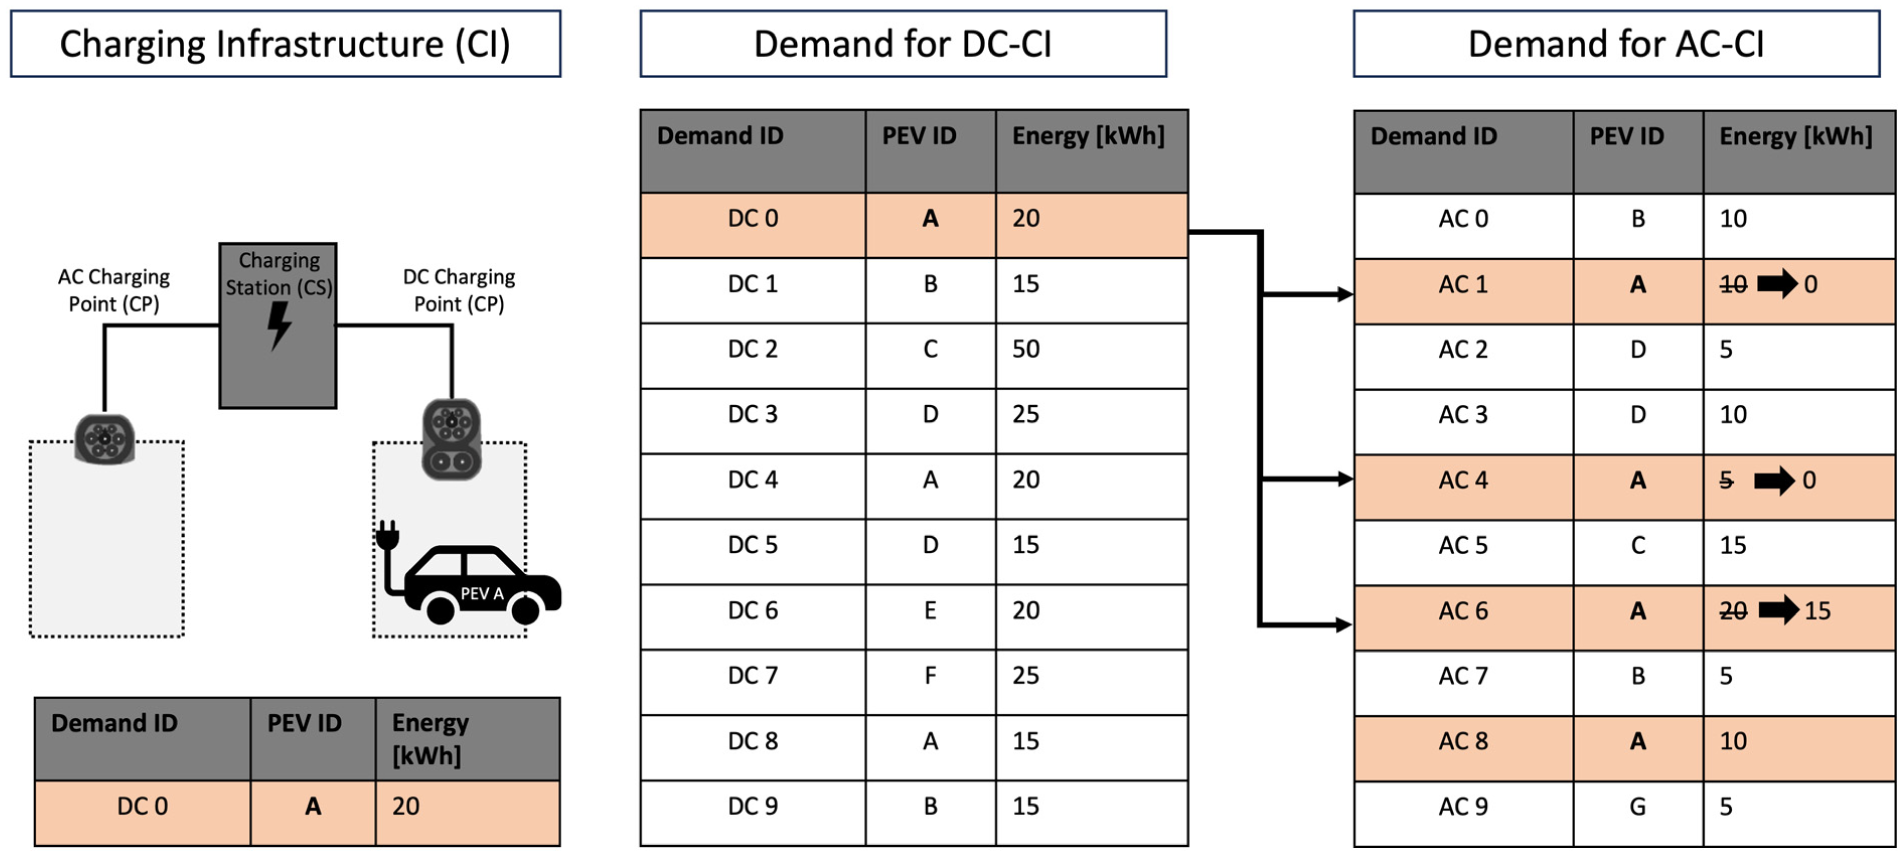
Energy balance.
After creating the charging events for each PEV model, the mobility behavior is used to define the locations at which the charging events take place. The mobility behavior was defined separately for the study area using origin–destination matrices for the weekday types Monday, Tuesday to Thursday, Saturday, and Sunday. In addition to the location-specific definition of the individual charging events to cover the energy demand, the usage behavior in CDRpy also results from the location-unspecific occupancy behavior of the public charging infrastructure. The occupancy behavior determines the logic according to which the PEVs search for and occupy free public charging points. Figure 8 shows the occupancy logics in CDRpy. At each time interval,
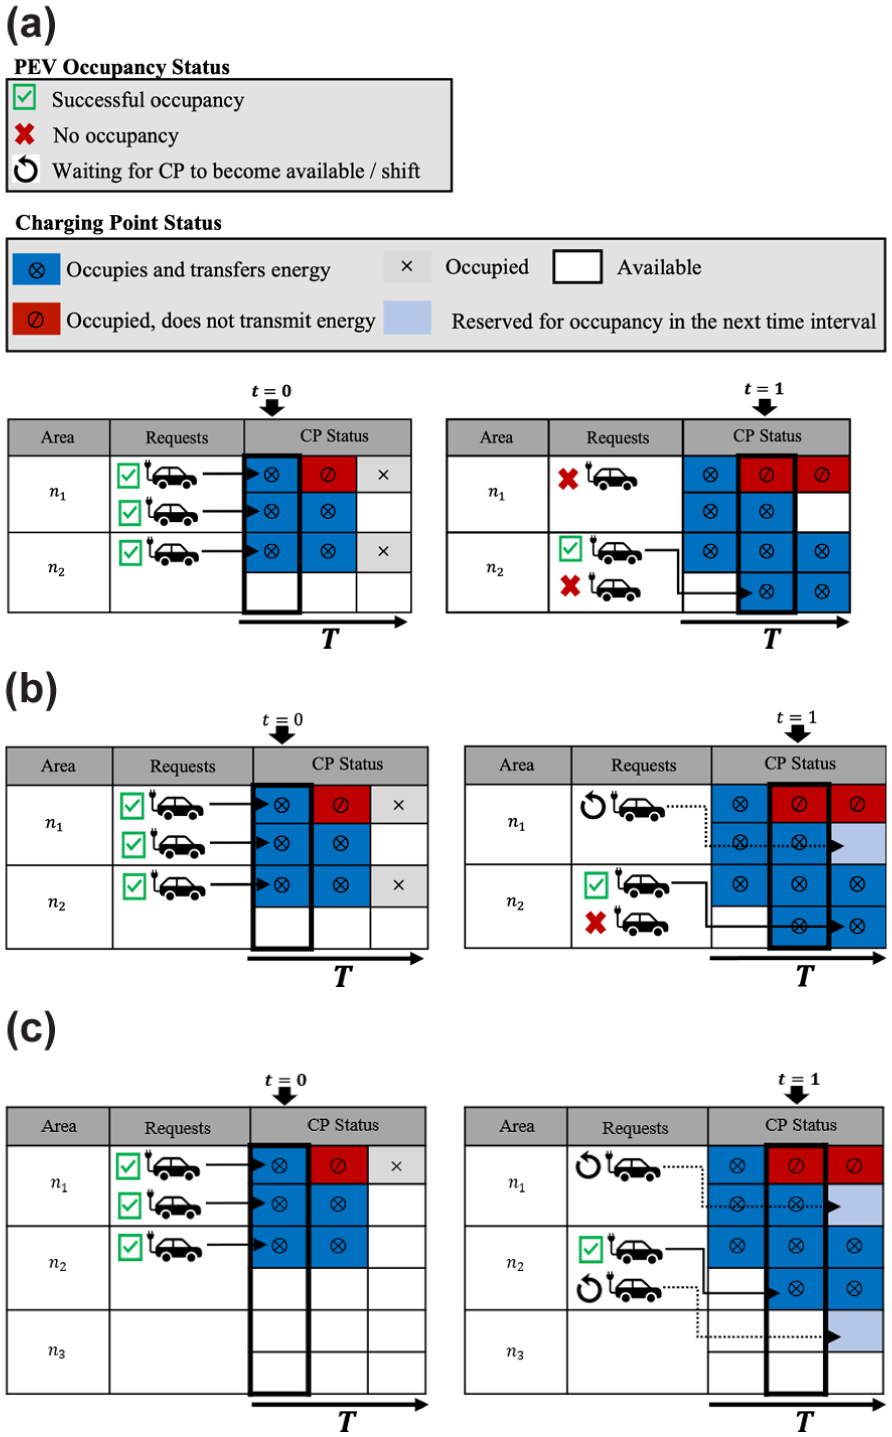
Occupation logic in CDRpy: (a) Occupation Logic 1: first-come-first-serve; (b) Occupation Logic 2: waiting for free charging points; and (c) Occupation Logic 3: switching to neighboring areas.
In the case of AC charging, the charging point remains occupied by the PEV even after the actual charging event has been completed. This corresponds to the logic that the charging event is usually associated with a longer parking process, and the occupancy time of the charging point is therefore often longer than necessary to complete the actual charging event. In the case of DC and HPC charging events, the charging point is released after the actual charging event has been completed. The logic thus corresponds to the behavior that the charging event is carried out during a short stop, and the occupancy time corresponds approximately to the required charging time ( 44 ).
In the first occupancy logic,
The second occupancy logic,
The third occupancy logic,
Figure 9 shows the logical workflow of CDRpy during the simulation runtime. After initializing the defined input parameters of the different parts of the simulation framework (see Figure 1), the simulation period,
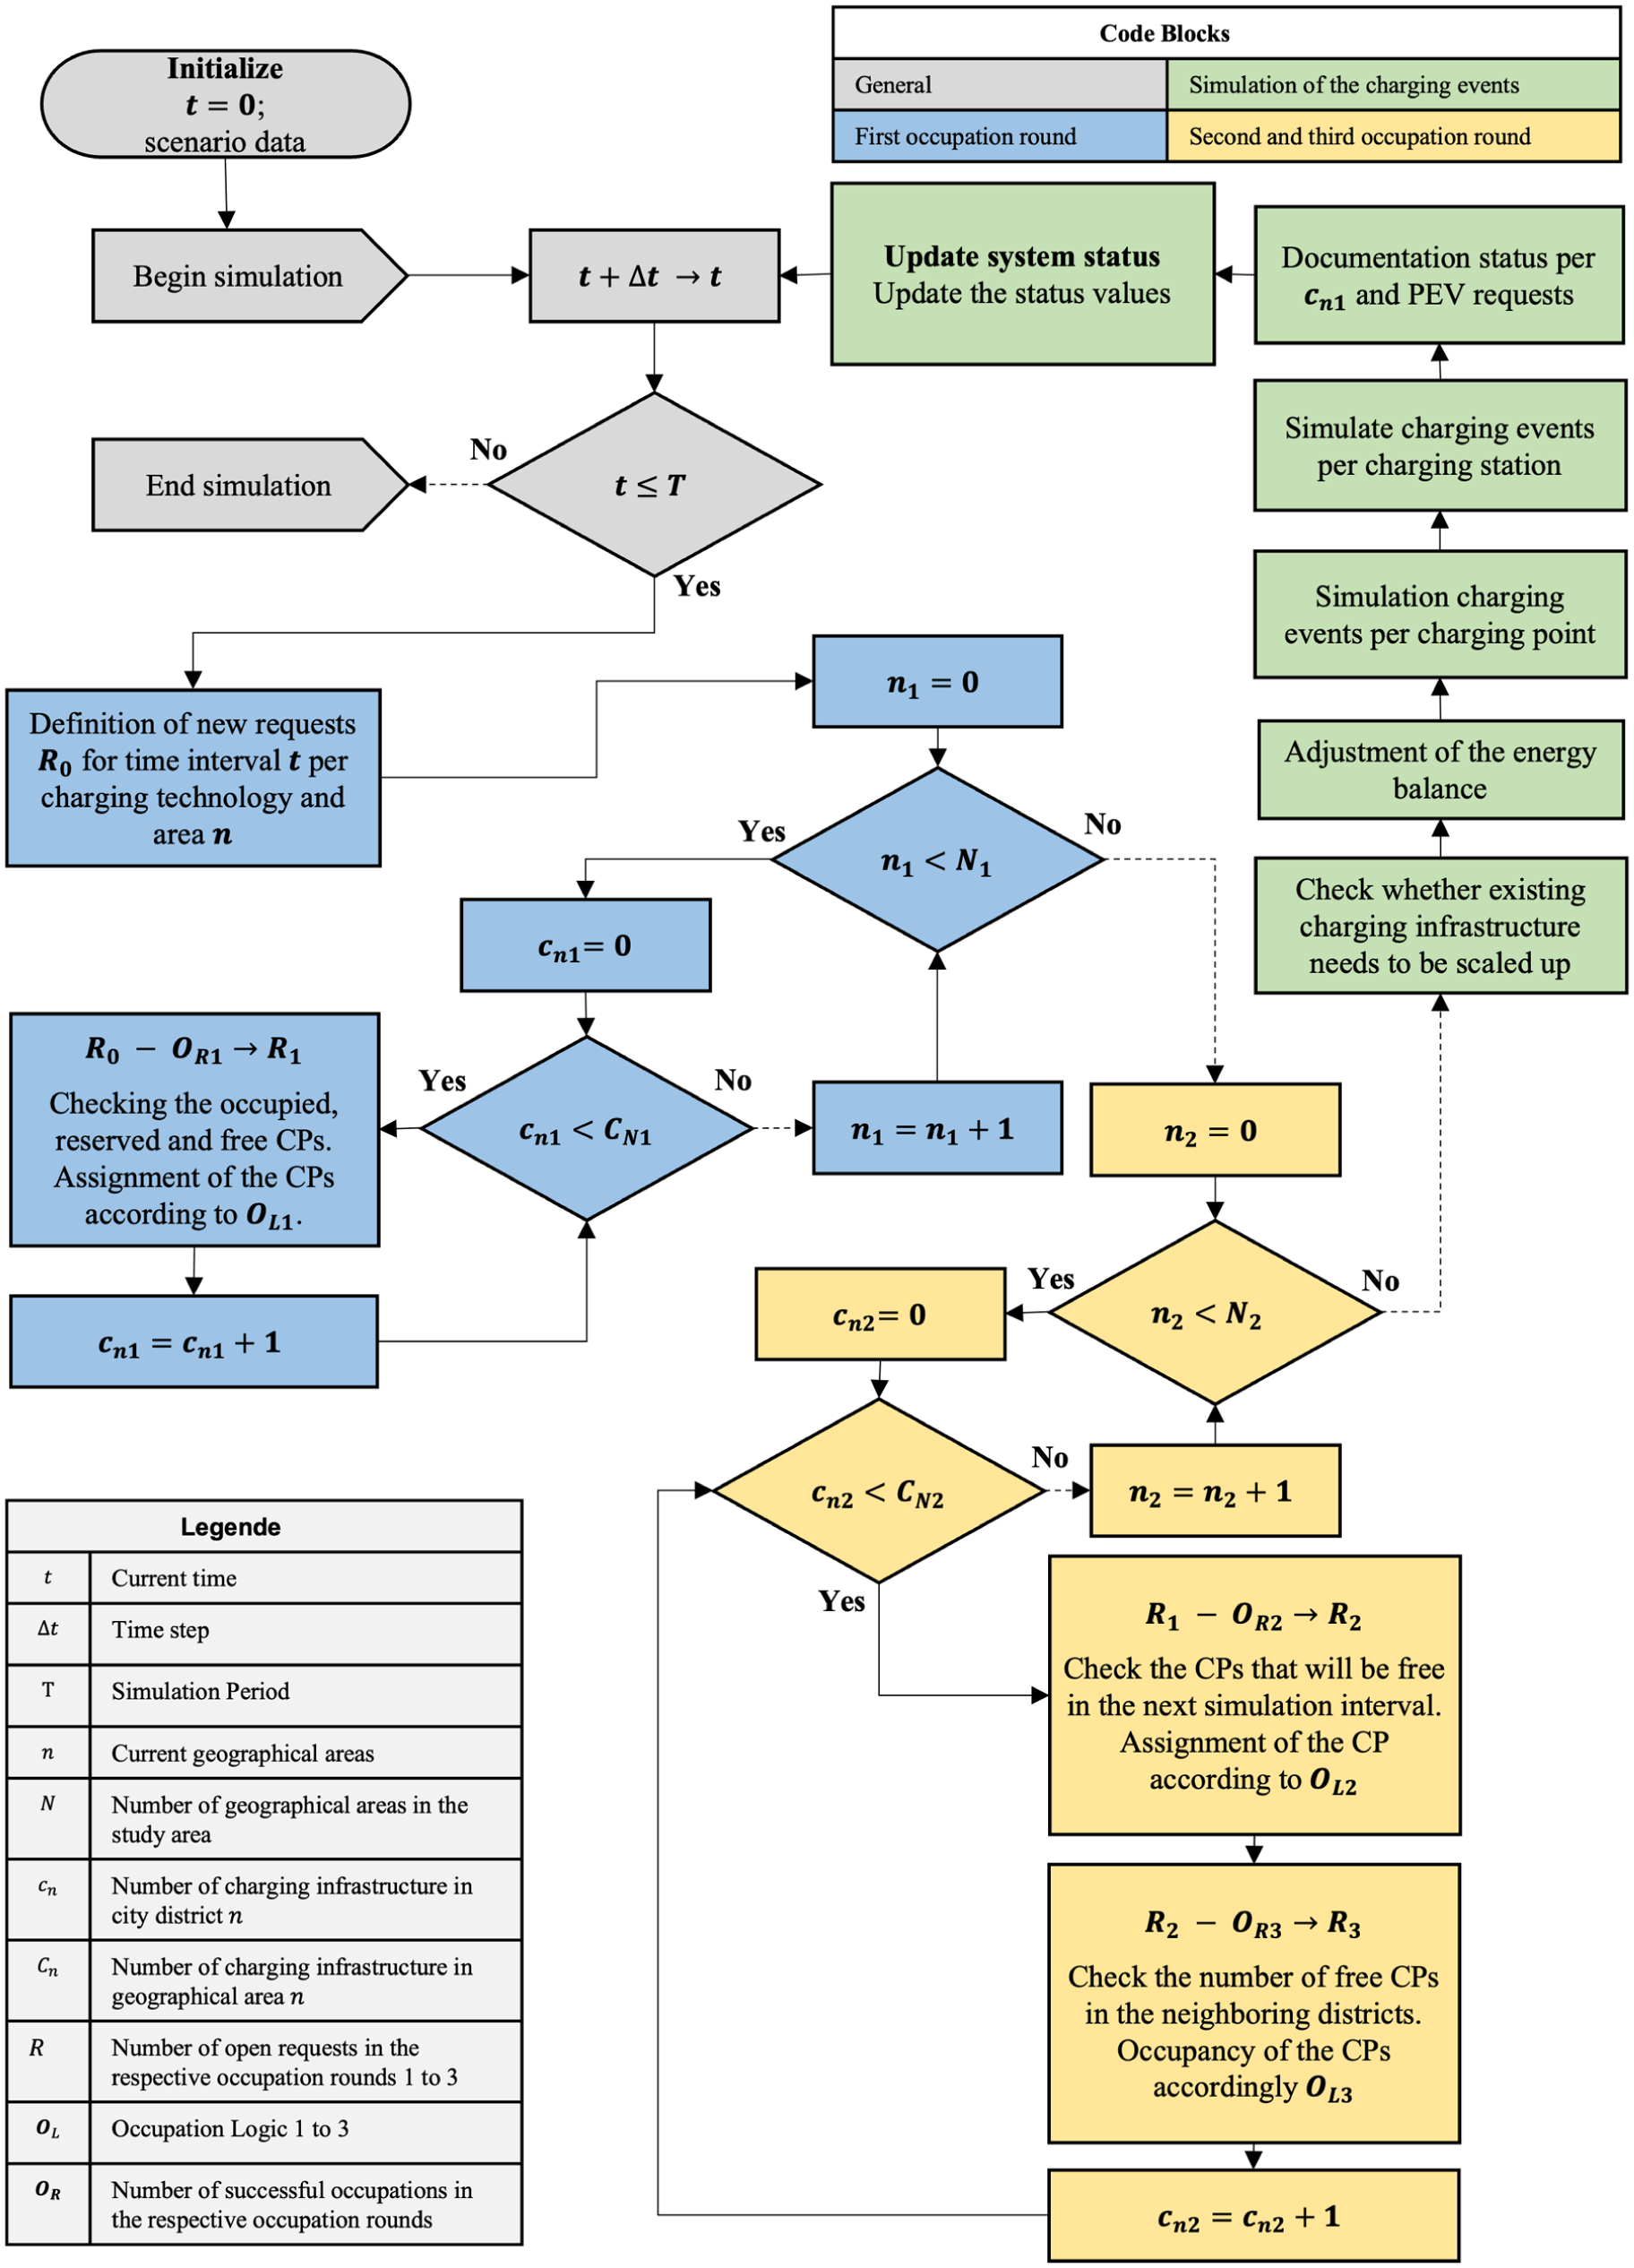
Flowchart: CDRpy.
At the beginning of the first occupancy round, the new demand,
If there is still open demand after all occupancy rounds, the existing charging infrastructure is scaled. The scaling function makes it possible to evaluate the expansion of public charging infrastructure in line with demand. If several types of charging infrastructure are available, the economic result of all concepts is determined and the most profitable approach to date is scaled. The profit comparison method is used to assess profitability, considering depreciation and capital costs. CAPEX and OPEX according to Table 2 were used to determine the operating, depreciation, and calculated interest costs of the defined charging station types. The useful life of the charging station was set at 10 years and the imputed interest rate at 3% ( 45 , 46 ). The profit margin for charging events can either be defined as a static value for the different charging technologies or defined dynamically depending on the current energy price or based on the CDRs. After consultation with SWM and considering the current energy prices and charging tariffs in the study area, a profit margin of 20 cents/kW-h for public AC charging events and a profit margin of 30 cents/kW-h for DC and HPC charging events were considered in the study. All costs and revenues cited were calculated depending on the installation time of the simulated charging station, whereby both the costs considered and the revenues increased with the installation time.
As some PEV models can choose between different charging technologies, an energy balance (see Figure 7) was kept for these models, which was continuously adjusted depending on the selected charging infrastructure during the runtime. After checking the scaling of the charging infrastructure and adjusting the energy balance of the PEVs, the charging event was simulated. First, the charging event was simulated at the charging point level. The charging power was determined by the nominal charging power of the PEV model, the charging point, and the possible charging power based on the constant current constant voltage (CCCV) method with decreasing charging power at high state of charge (SoC) ( 47 ). The charge switching point of the CCCV method can be defined individually for each PEV model in CDRpy. In this study, 75% was defined as the charging switching point for each PEV model. Since the SoC range of the charging events has an impact on the charging power, probability distributions were defined based on previous studies ( 48 – 51 ), which determined the SoC range separately for the charging technology and PEV types.
After simulating the charging events at charging point level, whether the charging power needed adjusting at charging station level was checked. This may be necessary if, as with the AC18-36×7kW concept, the nominal connected load of the charging station is less than the sum of the nominal charging power of the charging points. In this case, the charging power of the charging points is adjusted evenly according to the logic of a dynamic load management system. Once the charging events had been simulated, the results for each charging point were documented for the simulation interval,
Results
CDRpy was validated for Munich by simulating the public charging infrastructure of SWM, the biggest provider of public charging infrastructure in the city for 2020 to 2022, and then comparing the results with the real data. The comparison between the simulated infrastructure in CDRpy and real usage behavior was made on the basis of the time utilization, the amount of energy transferred per month, and the amount of energy transferred per subdistrict. For the validation, only public charging stations with at least 100 charging events per year and 10 charging events per month were considered, to ensure their continuous availability and to avoid influencing the comparison with the simulation in CDRpy. For 2020, 2021, and 2022, 338, 503, and 484 AC2×22kW and 1, 0, and 10 C1×50/AC1×22kW charging stations, respectively, met these criteria. The comparison was carried out with the aim of modeling the ideal-typical use of the public charging infrastructure in the city to calibrate CDRpy for the simulation of future scenarios in the case study. Outliers in usage behavior in individual periods that were not considered to be ideal-typical were not considered relevant in this context.
Figure 10 compares the temporal utilization of the simulation results with the actual utilization of the charging stations for the years 2020 to 2022. The diagrams also show periods that encompassed COVID-19 lockdowns, vacation periods, and the delta between the simulation results and actual utilization. The comparison shows that the utilization over time largely matched and the delta fluctuated around the value of 0. Short-term deviations in the real data set could be attributed to backend failures or mobility restrictions, especially during the first COVID-19 lockdown in 2020. In addition, the evaluation shows that the time utilization decreased during the summer vacation period between August and mid-September. The delta over all the years averaged −0.56% with an average charging station time utilization of 34.97% in the CPO data set and 35.53% in the simulation.
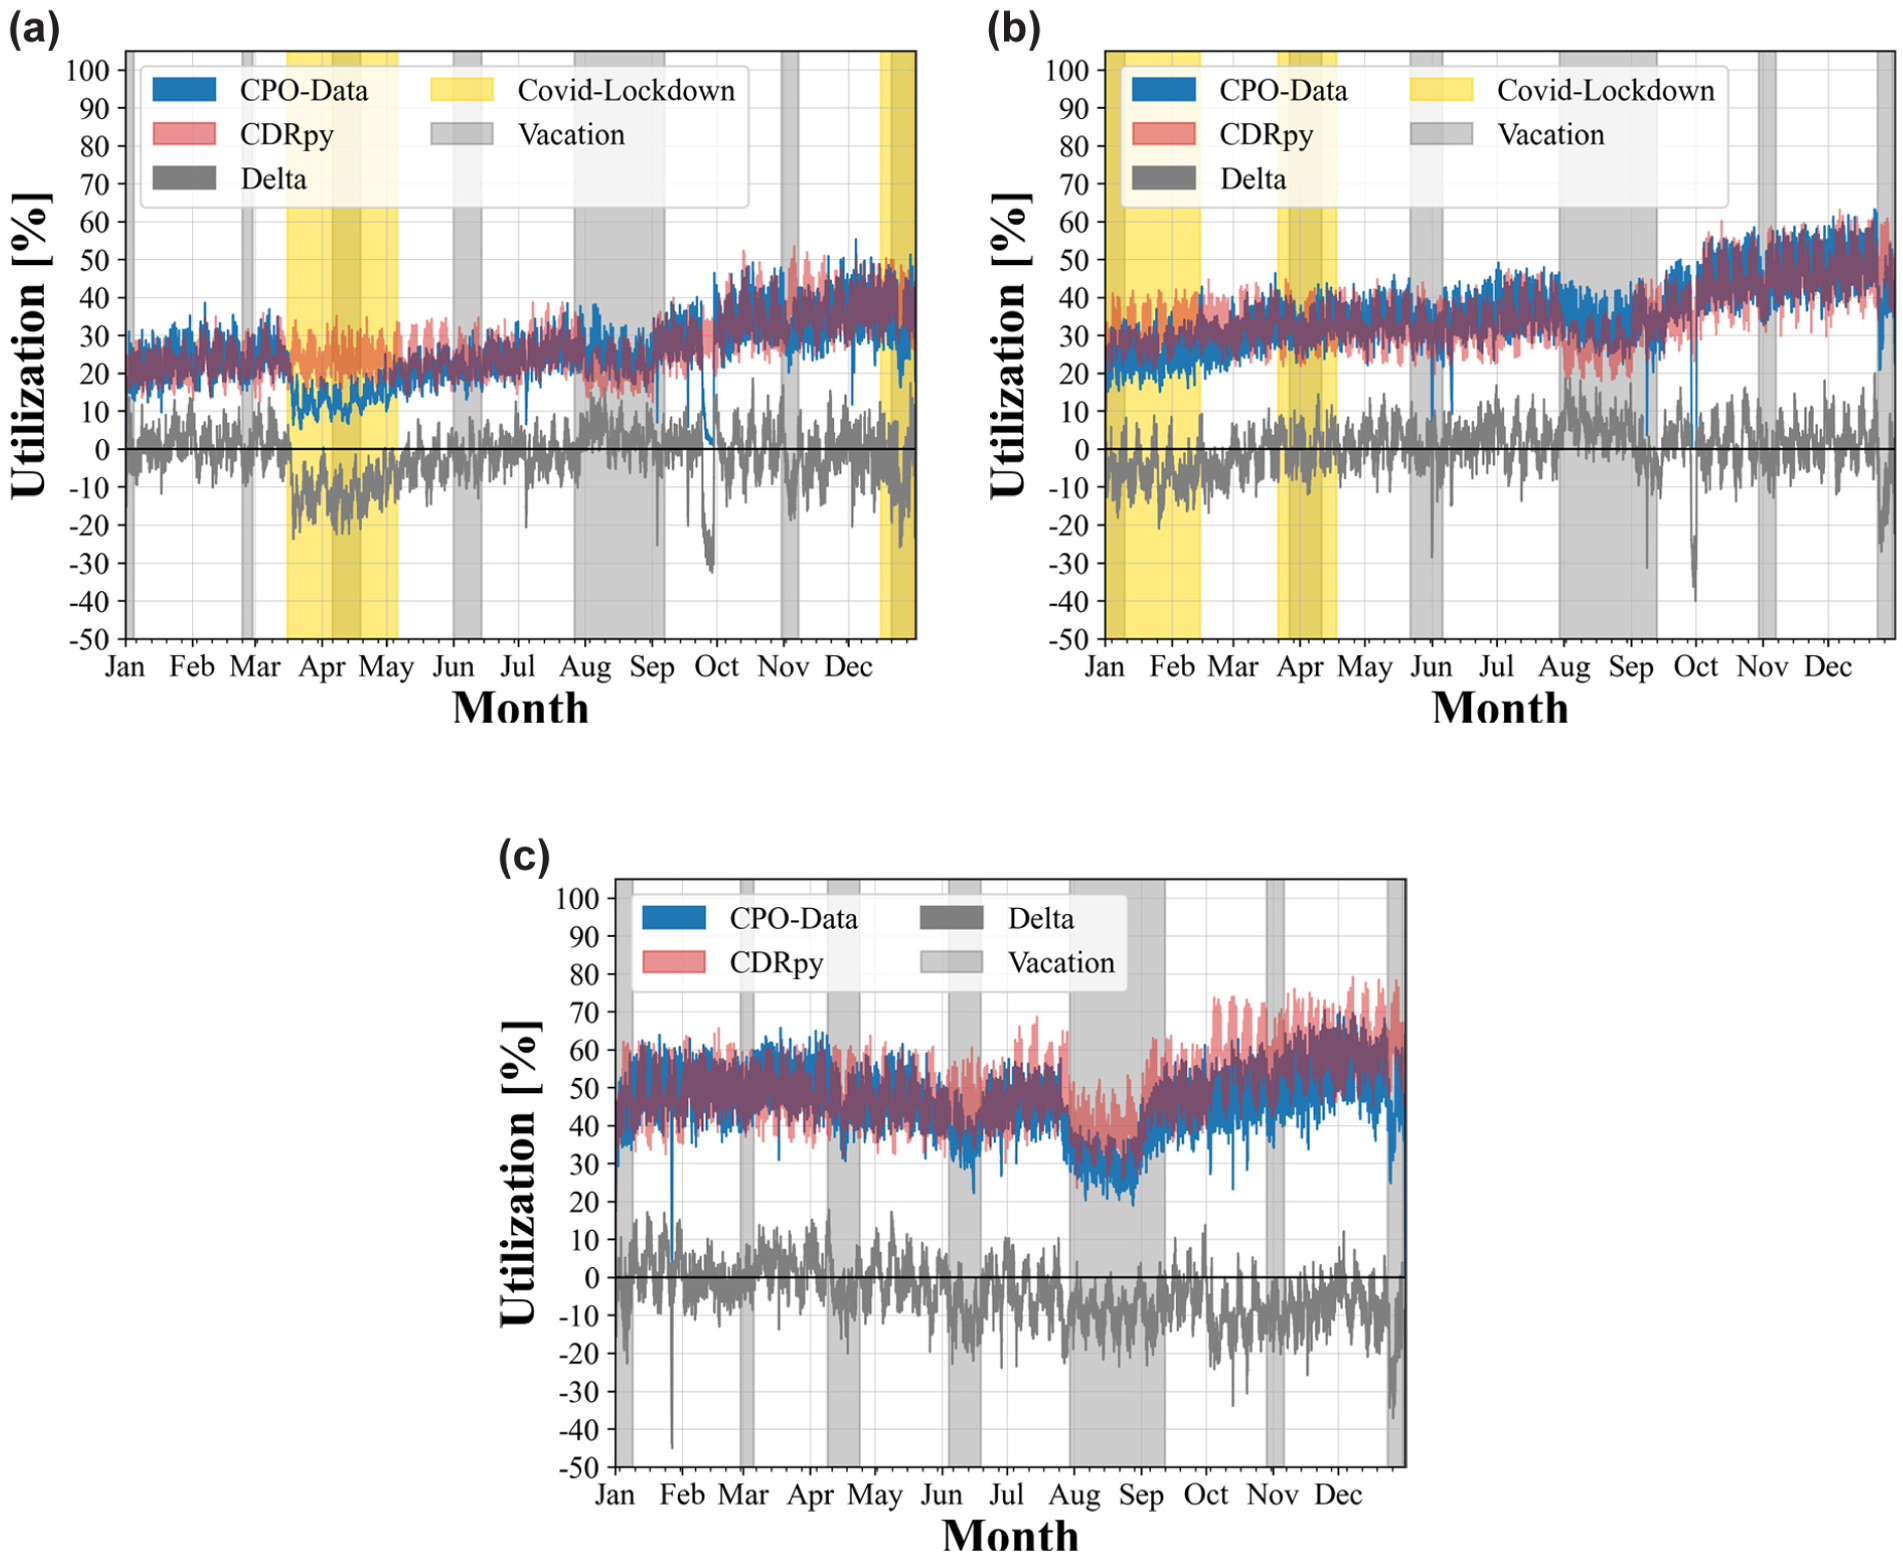
Comparison of temporal utilization of real CPO data and CDRpy simulation: (a) 2020, (b) 2021, and (c) 2022.
Figure 11 compares the amount of energy transmitted in the simulation with the amount of energy actually transmitted by the public charging stations per month for 2020, 2021, and 2022. Overall, there was an increase in the amount of energy transferred over the 3 years. Within the respective years, an increased amount of energy was called up at the beginning and end of the years. This can be attributed to the increased consumption of PEVs in the winter months and increased registration numbers of PEVs at the turn of the year. Here, too, there was a decrease in energy demand in the summer vacation period between August and September and a decrease in energy demand, especially during the first COVID-19 lockdown in March and April 2020. The delta across all years was 1.56% or 338 MWh for the amount of energy transferred, which roughly corresponds to the annual energy demand of around 135 BEVs with an annual mileage of 12,500 km, and a consumption of 20 kW-h/100 km. For comparison, around 70,000 PEVs were considered in the simulation in 2022, consisting of 13,500 BEVs and 12,700 PHEVs in the assessment area and 23,700 BEVs and 20,100 PHEVs in the influence area.
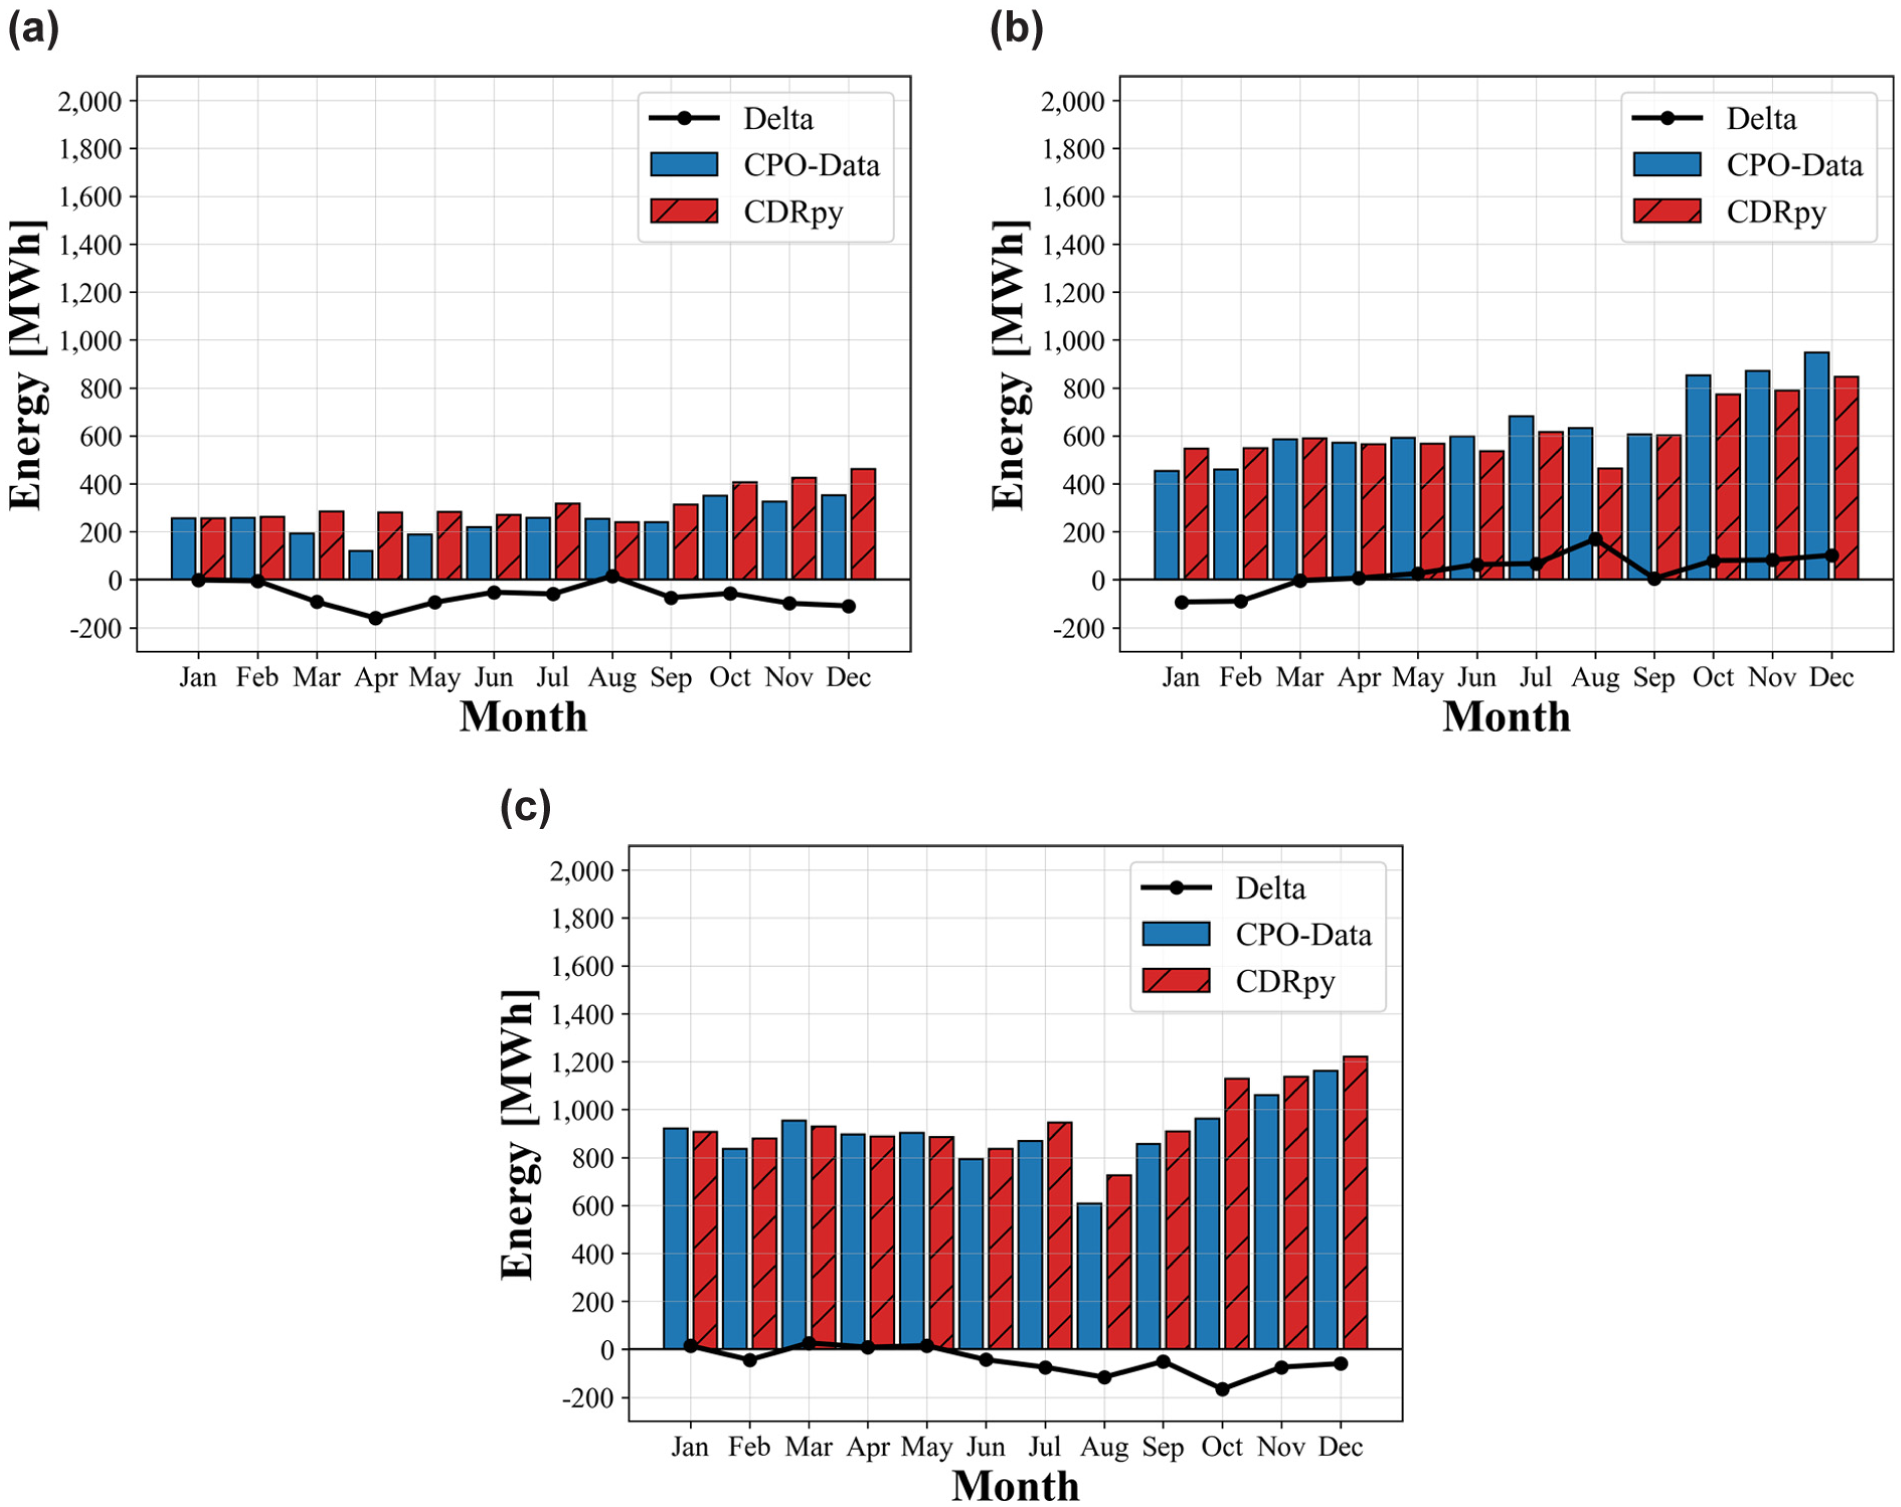
Comparison of transmitted energy per month of real CPO data and the CDRpy simulation: (a) 2020, (b) 2021, and (c) 2022.
A final aspect of the validation is the spatial allocation of the amount of energy transmitted to individual locations in Figures 12 and 13. The maps compare the amount of energy transmitted in the simulation with the actual amount of energy transmitted per subdistrict for the years 2020, 2021, and 2022. The evaluation showed individual subdistricts had a higher amount of transferred energy. These subdistricts were characterized by a high number of PEVs and a rather dense development, as well as a comparatively high number of public charging points. Figure 12, c, f, and
i
, and Figure 13, c, f, and
i
, show the difference between the simulated and the actual transmitted energy quantities. The locations of the respective charging stations are shown as additional information. The absolute deviation in the annual amount of energy per subdistrict in Figure 12c was a maximum of
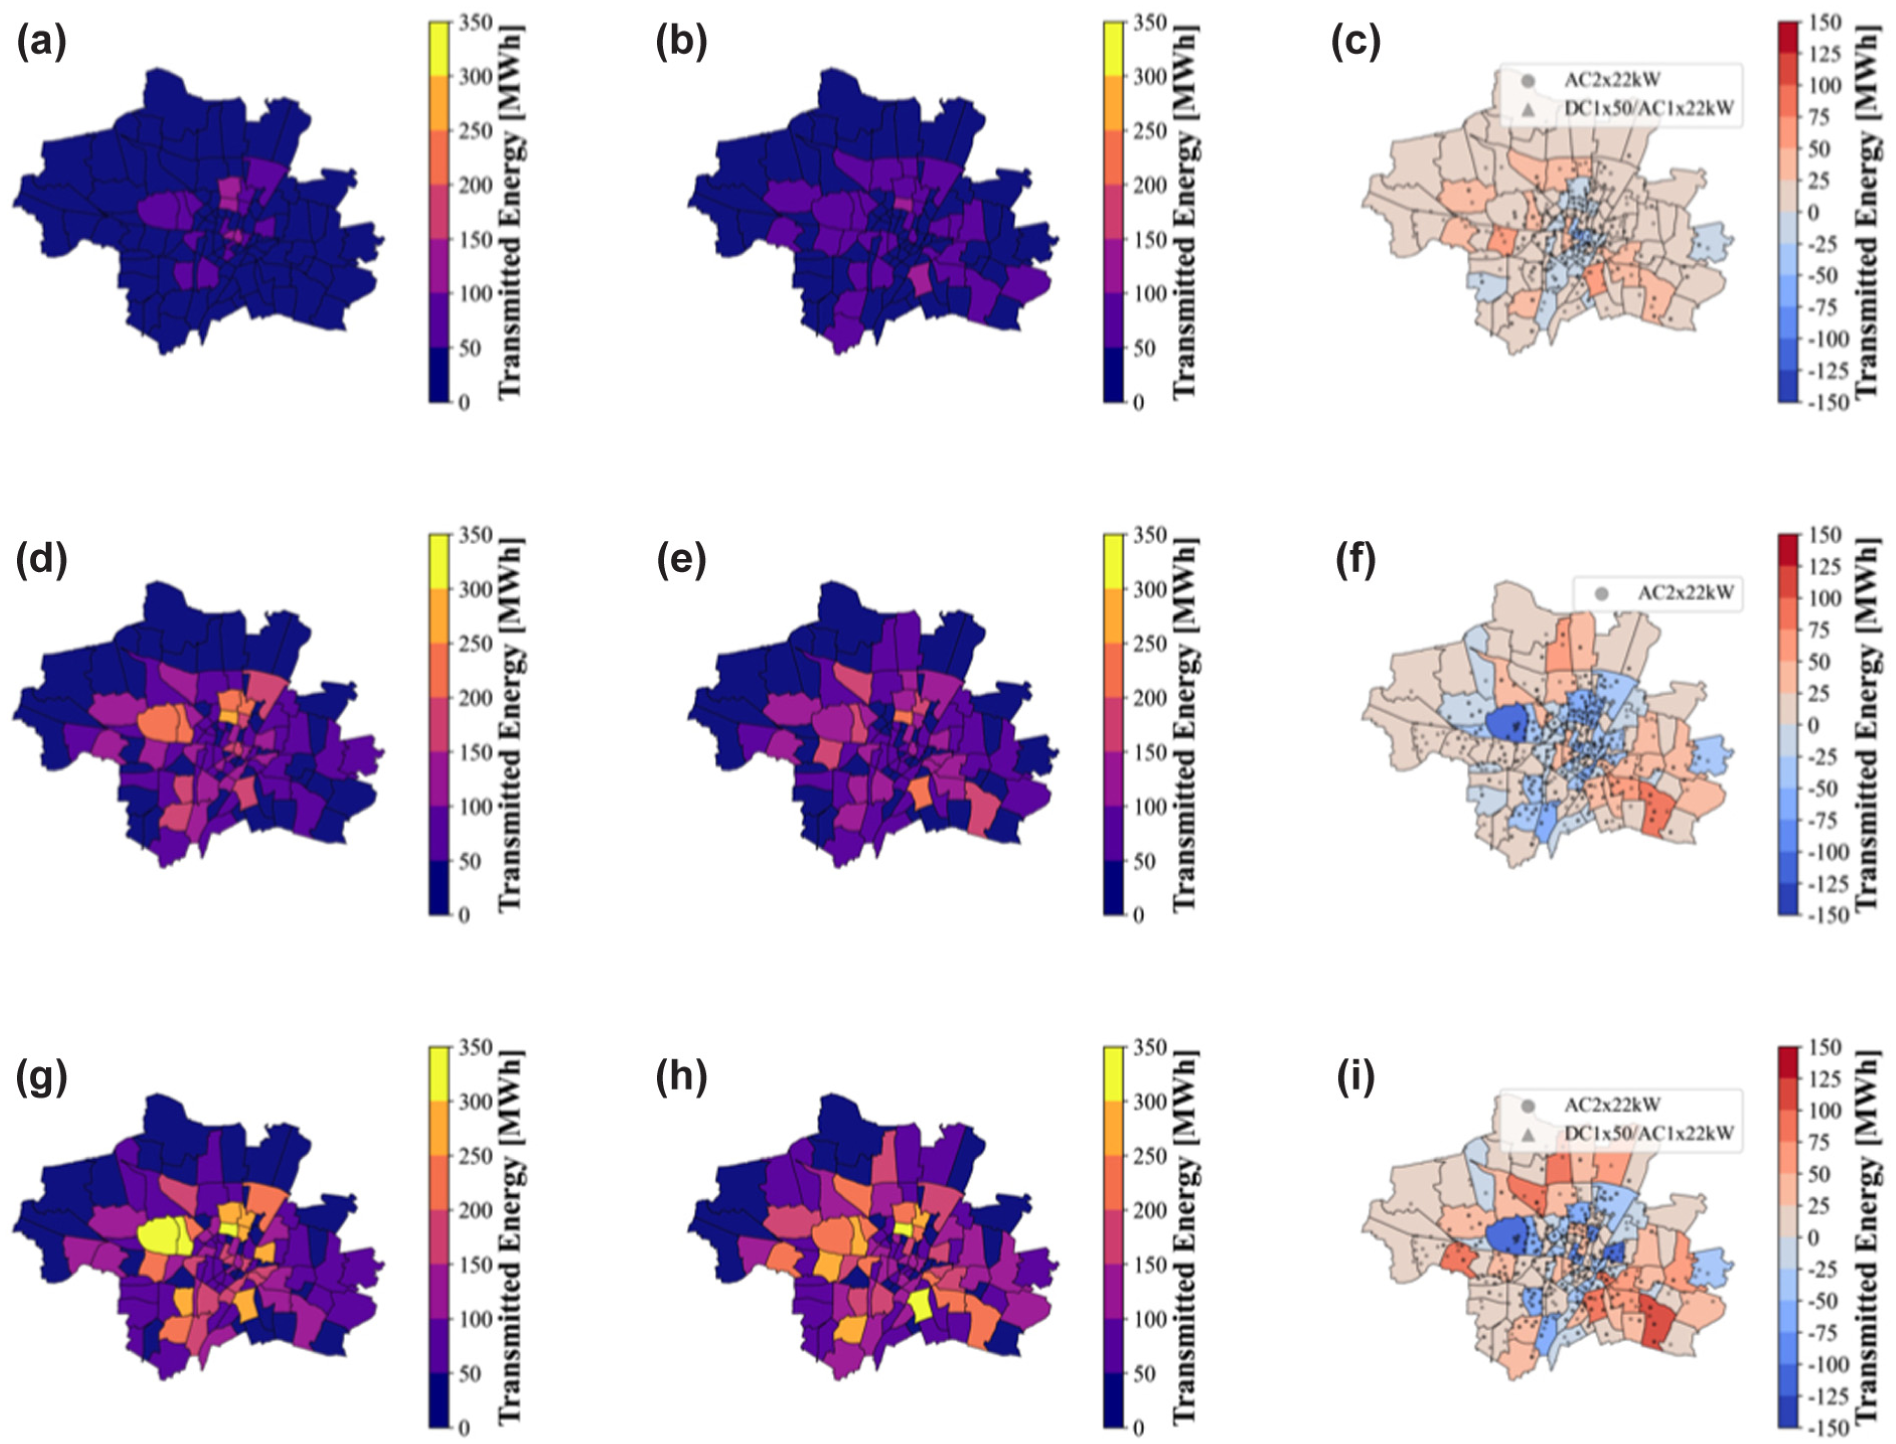
Comparison of transmitted energy per subdistrict of real CPO data and simulation in CDRpy: (a) 2020 CPO data, (b) 2020 CDRpy, (c) 2020 delta, (d) 2021 CPO data, (e) 2021 CDRpy, (f) 2021 delta, (g) 2022 CPO data, (h) 2022 CDRpy, and (i) 2022 delta.
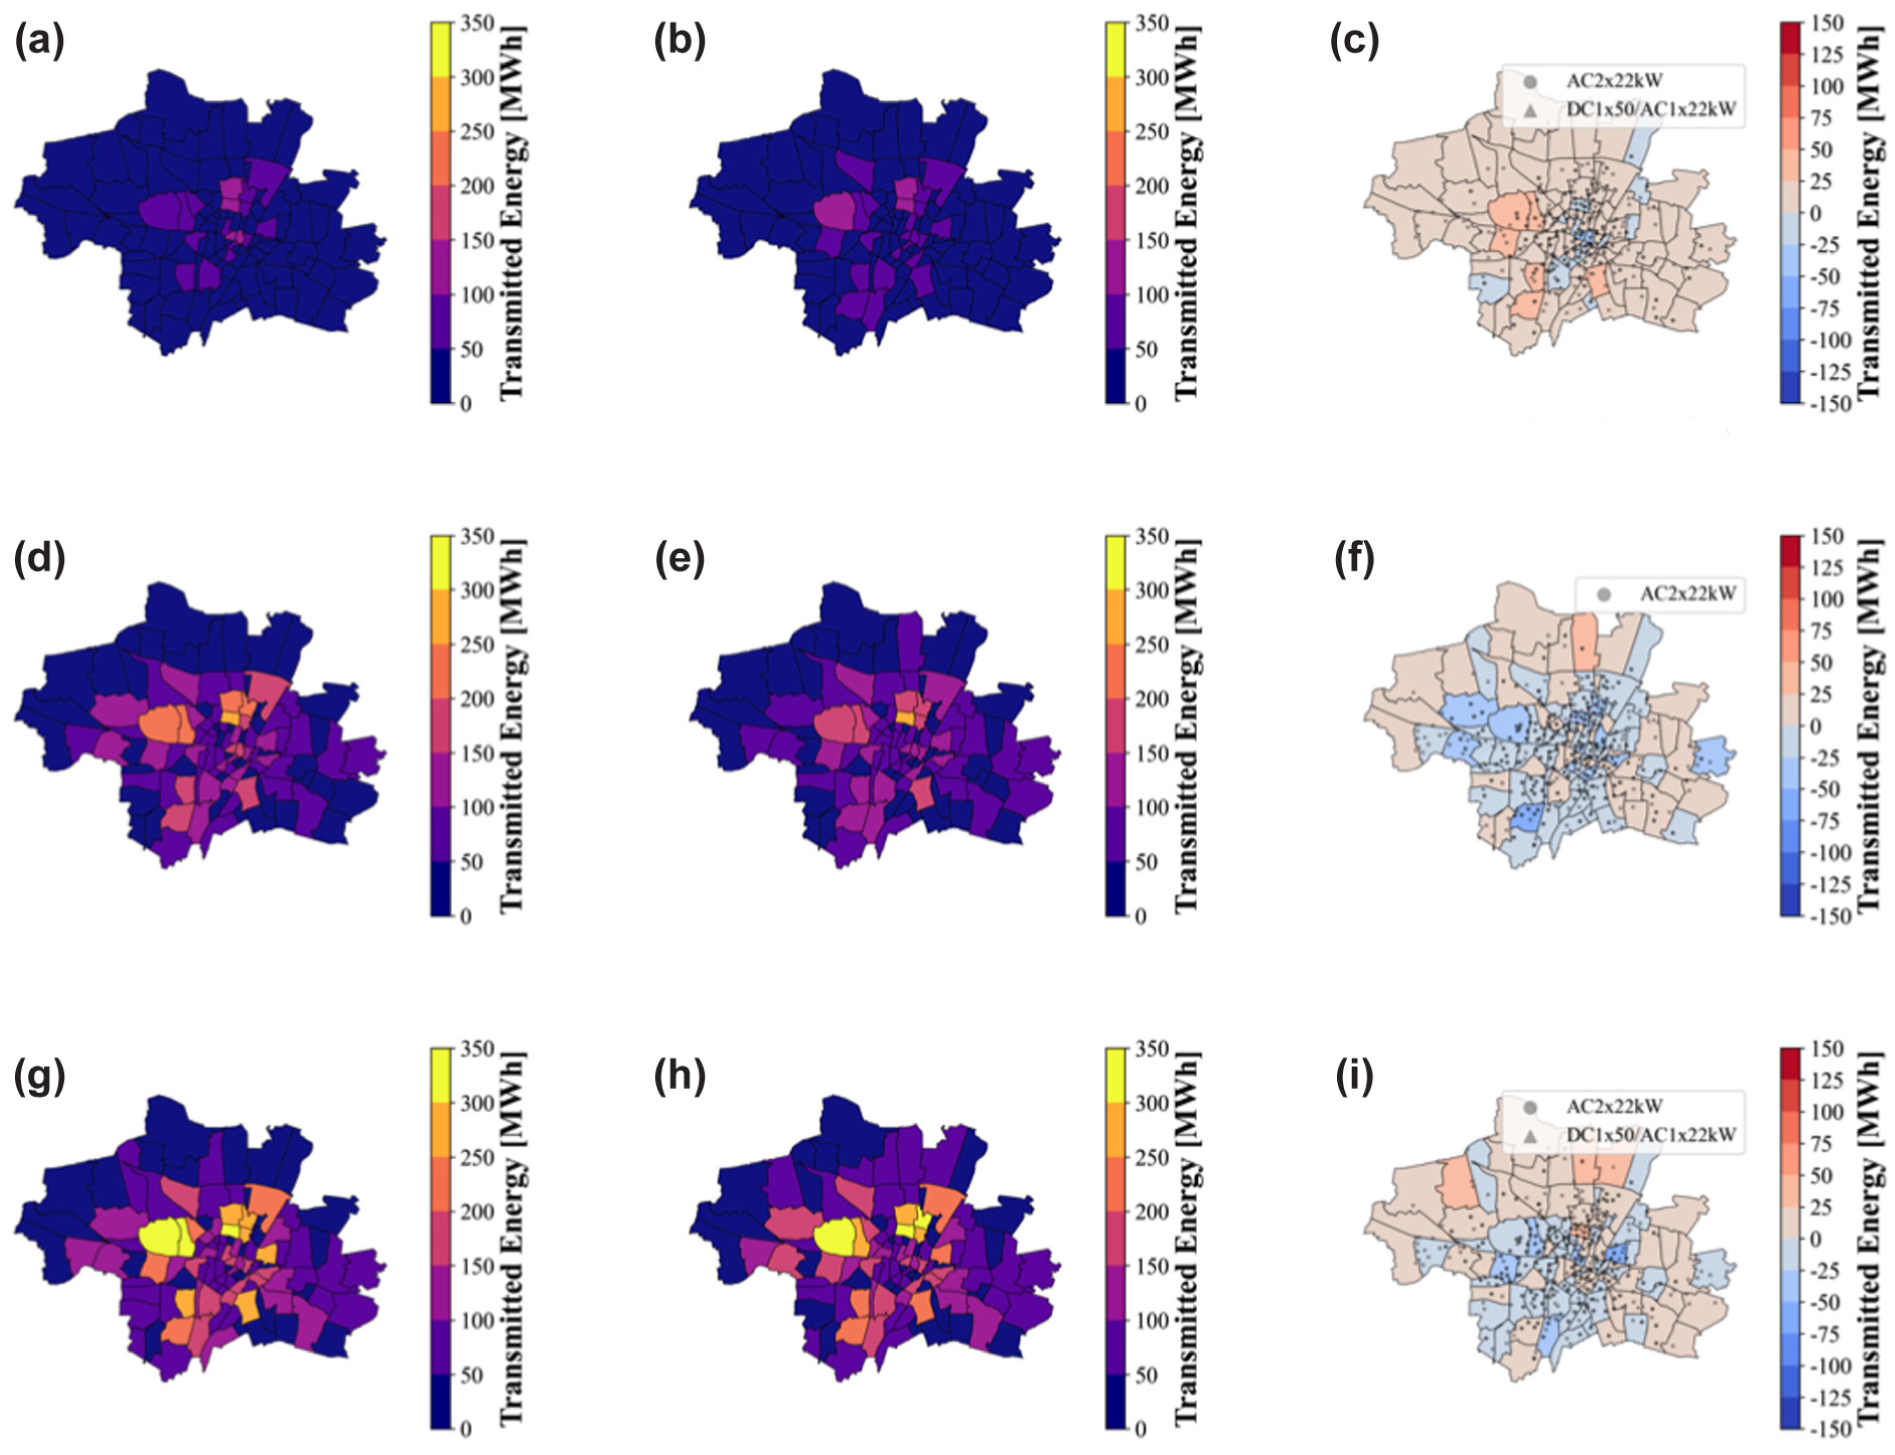
Comparison of transmitted energy per subdistrict of real CPO data and simulation in CDRpy with adjustments: (a) 2020 CPO data, (b) 2020 CDRpy, (c) 2020 delta, (d) 2021 CPO data, (e) 2021 CDRpy, (f) 2021 delta, (g) 2022 CPO data, (h) 2022 CDRpy, and (i) 2022 delta.
In an additional step, the difference per subdistrict was analyzed for the years 2020 to 2022 and the relative deviation between the simulated and the actual amount of energy per subdistrict was determined as an average for all years. To further optimize the spatial allocation of the transferred energy volume, the demand was adjusted based on the correction factors determined in the individual subdistricts, which reduced the maximum absolute deviation to
The data distributions of simulation and real usage data were tested for differences in the central tendencies. As the years 2020 and 2021 were affected by the COVID pandemic, only the year 2022 was considered for this evaluation. In 2022, the temporal utilization, the transferred energy quantity per month, and the spatial distribution per subdistrict showed a root mean square error (RMSE) of 8.24%, 52.13 MWh, and 19.34 MWh, respectively. As the data for the temporal utilization, the monthly transferred energy quantity, and the spatial distribution across subdistricts were not normally distributed, a Mann–Whitney U test was applied to assess whether the central tendencies of the simulation results differed significantly from those of the real usage data. Here, the Mann–Whitney U test evaluated whether two independent samples originated from the same underlying distribution by comparing the ranked values of both data sets. The analysis showed no statistically significant differences (p-values = 0.26, 0.73, and 0.69, u-values = 1,305, 71, and 6016) between the simulation and real-world data for any of the three examined dimensions (temporal utilization, monthly transferred energy, and spatial distribution). However, it should be noted that the test did show significant differences in temporal utilization if the periods under consideration included vacation periods and backend failures. In the conclusion section, the comparatively low value for the time utilization and possible reasons for the deviation between simulation and real behavior or concepts for further optimization are discussed. This also includes a comparison of the validation results of CDRpy with SEVA. In the previous validation, the public charging infrastructure of the operator, SWM, was simulated in CDRpy and compared with real usage data for 2020, 2021, and 2022. To this end, demand was defined based on SWM’s usage data. To examine the robustness of the results, an additional validation was performed using an independent data set. This allowed assessment of whether the simulation framework could be applied to study areas for which no local demand data are available. For this second validation, the demand was modeled based on the E-Mobility Service Provider (EMSP) data set provided by Wirelane (see Figure 6b). To ensure independence between calibration and validation, only charging events that were not conducted at SWM charging stations were used. The resulting EMSP data set contained approximately 1.5 million AC charging events and about 110,000 DC charging events after removing SWM-related entries. The results were consistent with the results based on the SWM data set, and thus showed that local usage data of the study area did not necessarily have to be available for the application of CDRpy.
To quantify the effects of changing individual parameters on the simulation results, a one-at-a-time (OAT) sensitivity analysis was carried out. The simulation interval and the share of public charging events in the study area were varied as parameters. In this case, the year 2022 was considered as the reference scenario, as this was the period with the lowest impact from the COVID pandemic.
Table 3 shows the results of the OAT sensitivity analysis for varying the simulation interval,
Sensitivity Analysis: Variation of Simulation Interval
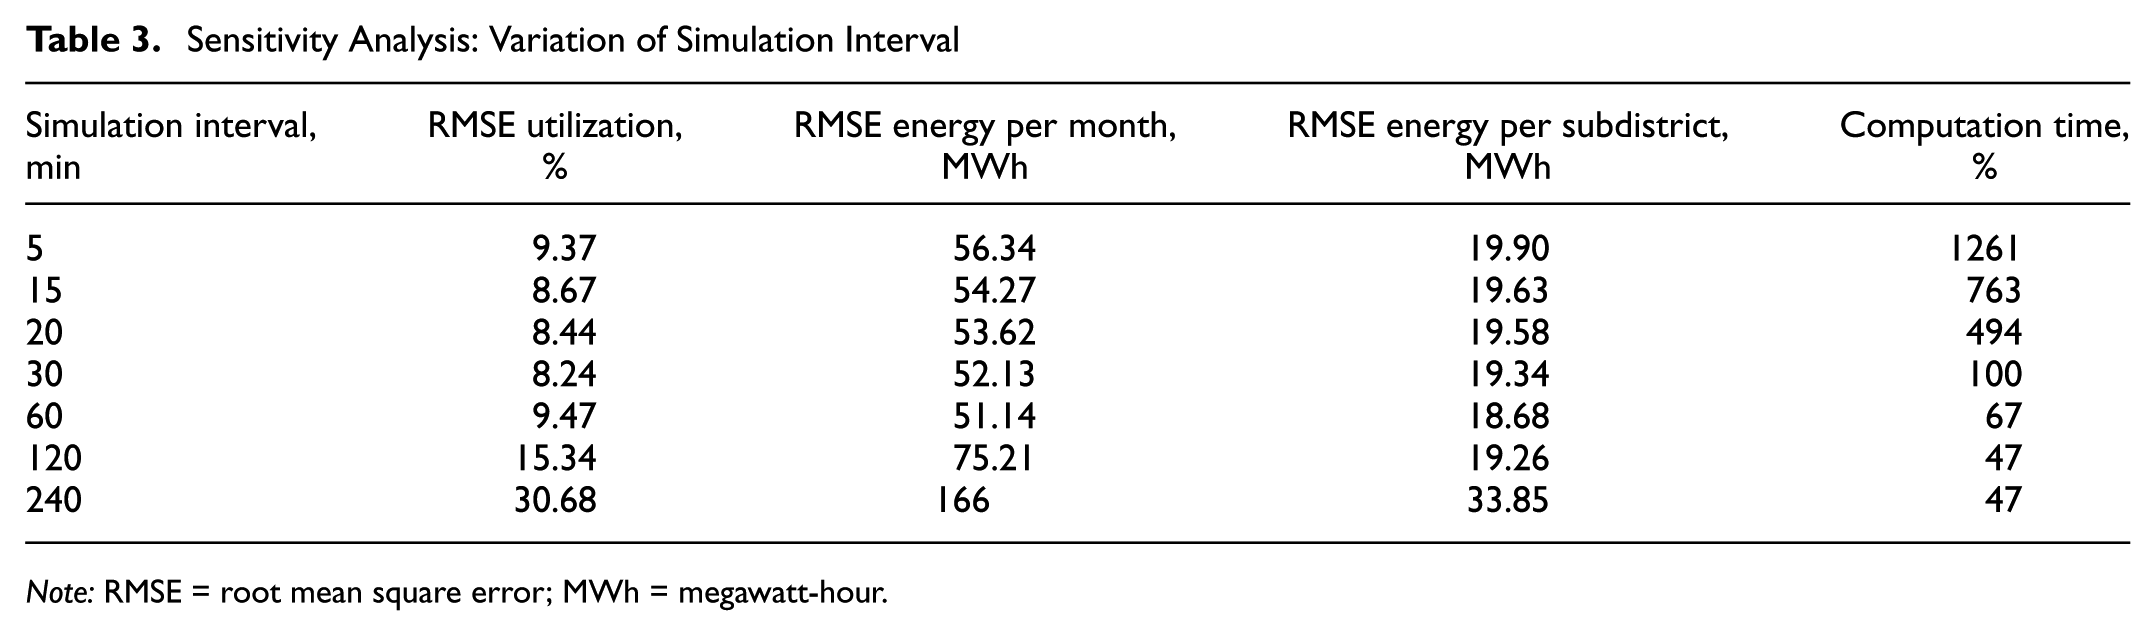
Note: RMSE = root mean square error; MWh = megawatt-hour.
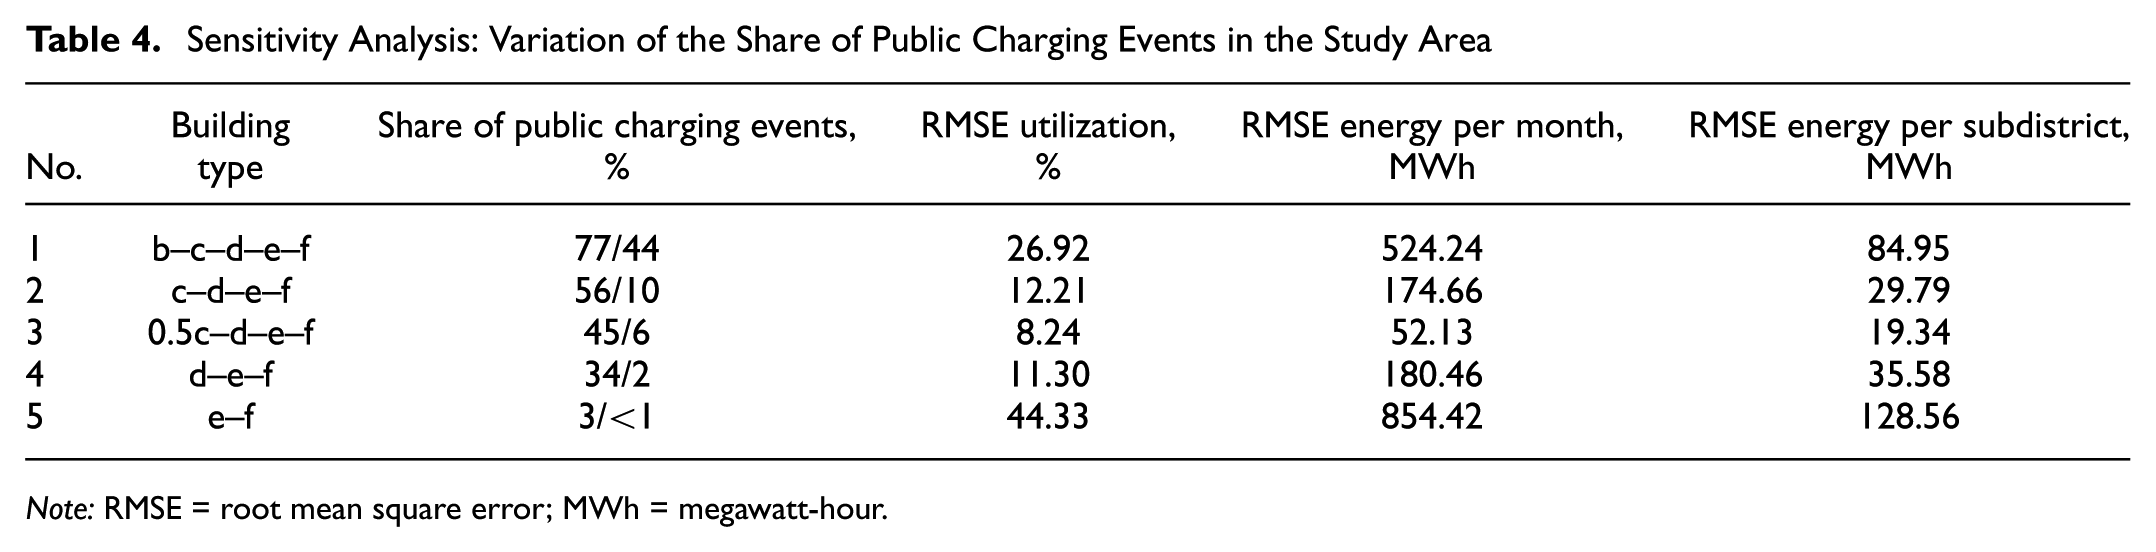
Table 4 shows the results of the OAT sensitivity analysis for varying the share of annual energy demand covered by public charging infrastructure. This share was determined based on the building characteristics in the study area (see Figure 5). The structural data set used comprised six building types with ascending housing density: (a) single-family houses, (b) terraced or semidetached houses, (c) multifamily houses, (d) apartment blocks, (e) high-rise residential buildings, and (f) high-rise terraced houses. It was assumed that private charging infrastructure would be less available in areas with a high residential density, so the energy demand there must be covered by public charging infrastructure. Building types can be weighted as a percentage (0% to 100%) to determine the share of public charging events. Figure 5 shows the distribution according to Variant 3, in which apartment buildings are considered at 50% and apartment blocks, high-rise buildings, and terraced houses at 100%. Alternative combinations were tested in other variants. Table 4 shows the resulting share of public charging events in the assessment area and the area of influence, as well as the deviation as RMSE between the simulation results of CDRpy and the real charging infrastructure in 2022. The analysis showed a high sensitivity for this parameter, with Variant 3 showing the lowest deviation, which was therefore used for validation and the use case. The evaluation thus showed that the estimation of public energy demand is a key factor in the parameterization of CDRpy, which is discussed further in the conclusion section.
Sensitivity Analysis: Variation of the Share of Public Charging Events in the Study Area
Note: RMSE = root mean square error; MWh = megawatt-hour.
The results of the case study based on the scenario defined in Figure 4 are presented below. The case study aimed to estimate the required number of public charging infrastructure for the year 2030 in Munich. All charging stations defined in Table 2 were considered as charging infrastructure. Since different concepts for public charging infrastructure are considered with AC, DC, and HPC charging stations, the demand behavior was modeled based on the CPO and EMSP data sets. As an additional aspect, the demand was modeled using different pricing models to estimate the impact of pricing on the required public charging infrastructure. On the one hand, energy-based pricing models were considered, as these are currently the predominant pricing models in the study area. On the other hand, demand behavior was modeled based on time-based and mixed pricing models, as Fischer et al.’s study indicates that this type of pricing can improve the temporal availability of public charging infrastructure ( 43 ). In this context, the hypothesis was formulated that time-based and mixed pricing models could reduce the required number of charging infrastructure to meet a defined demand. This thesis was tested as part of the case study.
Figure 14 defines the number of public charging points required to cover a defined share of the demanded amount of energy. In the defined scenario, approximately 53,000 MWh of energy was demanded during about 4 million charging events at public charging infrastructure in 2030. The evaluation showed how many charging points would be necessary to cover 10% to 100% of the demanded amount of energy per subdistrict in the city. For a better understanding, the current number of public charging points in the assessment area is also listed. AC charging points represent the majority of the current public charging infrastructure with around 2,400 charging points compared with 150 DC and 40 HPC charging points ( 52 ). The evaluation of the current number of public charging points showed that the focus in the development of public charging infrastructure in the city of Munich has been on AC charging infrastructure in the past. An additional scenario in which only AC charging infrastructure was considered showed that the existing number of public AC charging points could cover around 70% to 80% of demand in 2030. However, it should be noted that the evaluations showed that the number of charging points required increased exponentially with demand. For example, increasing the coverage level from 90% to 100% of the total energy demand would require more than doubling the number of charging points. Comparison of the pricing models showed that the required number of charging points could be reduced by around 10% overall through use of mixed and time-based pricing models. When considering charging station types, the evaluation showed that charging stations AC18-36×7kW, DC2×50kW, and HPC6-12×300kW accounted for the majority of the energy quantity and charging events at around two-thirds.
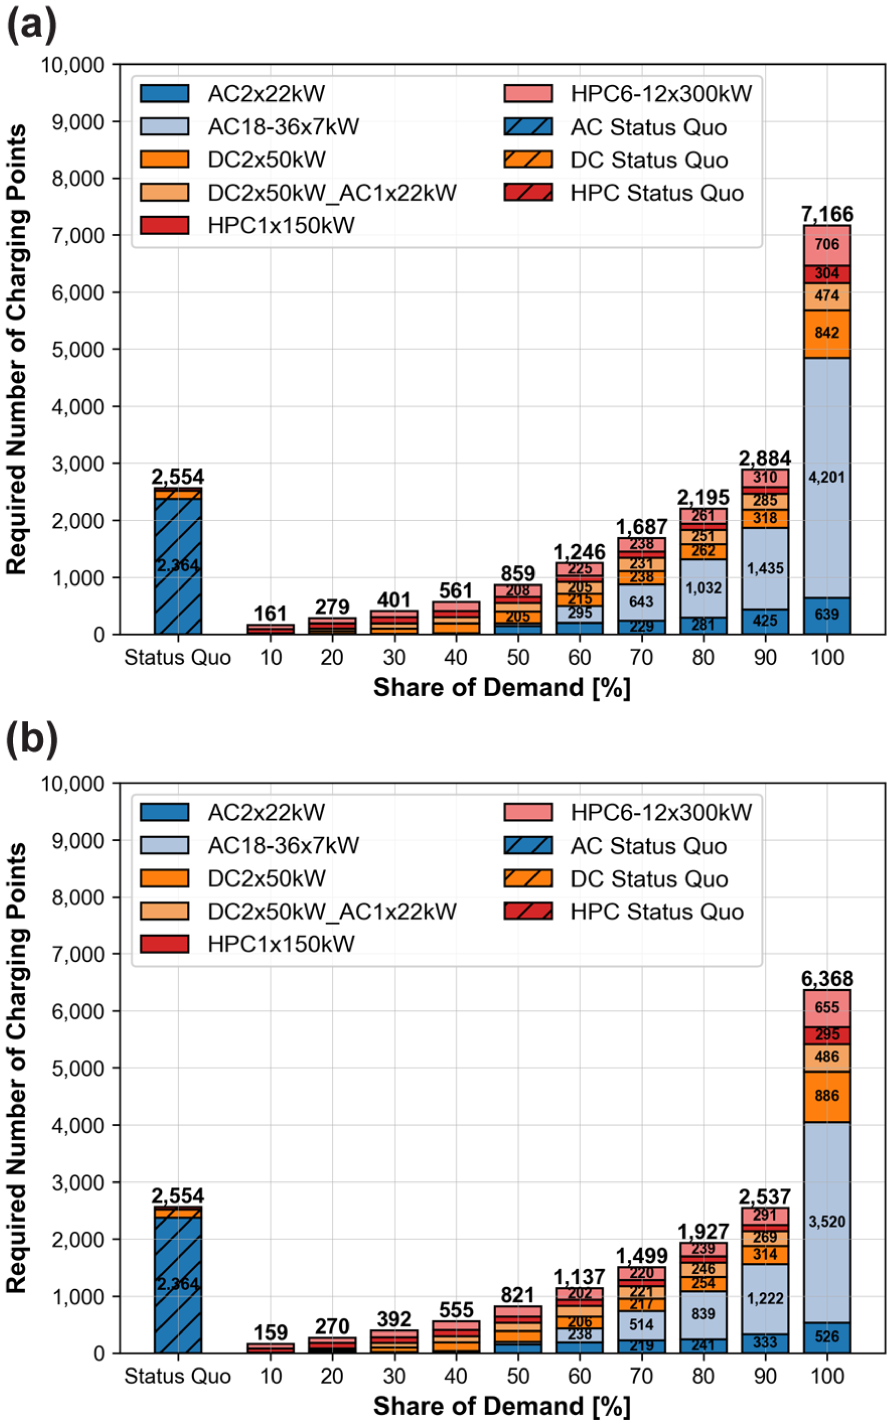
Required number of public charging points in 2030 depending on the level of demand covered: (a) energy-related price models, and (b) mixed- and time-related price models.
Figure 15 shows the additional number of public charging points required for each subdistrict. The maps show that the required number of additional charging points varied greatly between individual subdistricts. A concrete example is the high demand for over 100 additional charging points in Subdistrict 9.2 (see Figure 2a), owing to dense development and a high expected share of public charging events (40%), a high vehicle population (around 13,000 vehicles), and a comparatively low number of existing charging points ( 34 ).
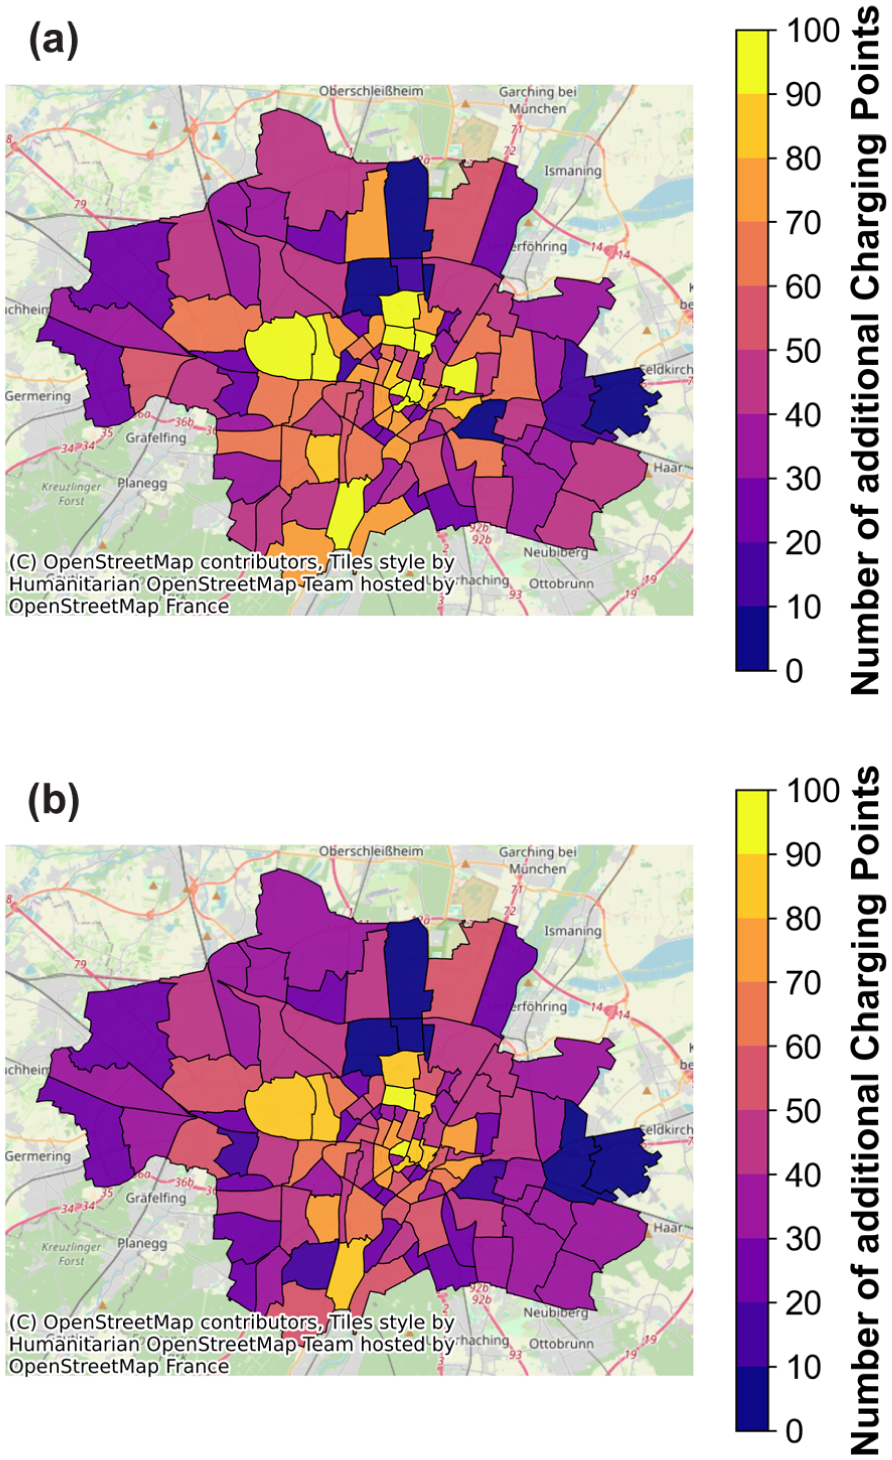
Geographical allocation of the additional required public charging points for 2030 in the assessment area: (a) energy-related price models, and (b) mixed- and time-related price models.
Conclusion
This study presents a methodology to evaluate different concepts for public charging infrastructure in urban areas. The CDRpy simulation framework based on this was developed, validated with usage data from SWM, the city’s largest CPO, for the years 2020 to 2022, and the required amount of public charging infrastructure for the year 2030 was estimated.
The results of the case study have shown that the required amount of public charging points for 2030 varies greatly between the individual city subdistricts. The comparison of the pricing models indicates that mixed and time-based pricing models could operate the public charging infrastructure more efficiently and reduce the number of charging points required by around 10% compared with energy-based pricing models. At the same time, the results of the case study showed that there is a particular need for additional DC and HPC charging points in the city of Munich. However, since expansion of DC and HPC charging points is associated with additional challenges compared with the existing dominant AC charging infrastructure in the city, further aspects, such as integration into the local energy grid, must be considered. Furthermore, demand behavior can be influenced by various factors such as increasing the electric ranges or higher nominal charging powers of the PEVs. Demand behavior should, therefore, be modeled based on suitable CDRs, whereby the records should be continuously monitored.
In the validation of CDRpy, the differences between the simulation results and real usage data were quantified. Since the data considered in the present study were anonymized usage data, one approach to improving the modeling of demand behavior would be to consider further information about the user and the PEV. In particular, demand behavior could be better modeled if it was clear which PEV types (BEV or PHEV) used the public charging infrastructure, in which SoC areas the charging takes place, and which charging stations users access. Further optimizations could be achieved by linking user surveys with individual charging events to better understand the selection behavior for certain locations of charging stations, concepts of charging stations, or price models, and to improve the modeling.
A comparison of CDRpy with the EVI-Pro and SEVA models introduced in the related work section revealed several differences.EVI-Pro primarily aims to quantify the strategic, aggregated charging infrastructure demand at various location types (e.g., residential areas, workplaces, public charging points) at a macro level, such as for states or entire countries, as part of technical reports for federal political decision makers. The demand behavior associated with the charging infrastructure is derived from mobility data. CDRpy, on the other hand, was developed with the objective of analyzing and evaluating in greater detail the use of public charging infrastructure in urban areas at an operational level for smaller geographical areas, such as city districts or municipalities. The focus here is on evaluating different concepts for public charging infrastructure, for example, by considering different types of charging station (e.g., different AC charging stations) or pricing models (e.g., energy- or time-based pricing models). Compared with EVI-Pro, demand behavior is modeled in CDRpy directly from real usage data from the public charging infrastructure, which enables an empirically sound and realistic representation of demand behavior.
When SEVA is compared with CDRpy, it becomes apparent that SEVA models usage behavior on user-related charging data and that the model focuses on AC charging infrastructure. CDRpy, in contrast, uses anonymized charging data and explicitly focuses on evaluating different types of public charging infrastructure. For the validation of SEVA, the normalized absolute error (NEA) was calculated, which represents the maximum deviation between simulated and real activity patterns relative to the deviations per time interval. A NEA for SEVA of around 10% is considered a good match. In comparison, the NEA of CDRpy for temporal utilization, which is most comparable to activity patterns, was 13.79%. This indicates that user-related data tend to enable more precise results in modeling temporal utilization behavior. Further comparisons between the models, for example, with statistical tests such as the Mann–Whitney U test or a comparison of other criteria such as the amount of energy transferred, are currently impossible, as the corresponding evaluations of SEVA have not been published.
In addition to the presented study, further concepts for future research are conceivable. For example, the application and validation of CDRpy in other cities. Thus, the validation for Munich was based on a comprehensive data set from the largest CPO in the city, but included almost exclusively AC charging infrastructure. A validation of the framework for other cities and based on different concepts for public charging infrastructure would be a logical next step. In addition, investigation of usage and selection behavior according to different charging concepts is crucial. Previous studies have mostly focused on the general usage behavior of public charging infrastructure, without differentiating between concepts according to technological features, pricing, or user choice. An analysis of such characteristics could provide a more profound understanding of usage behavior and enable better decision-making aids for scaling the infrastructure.
In summary, the combination of different technological concepts for charging infrastructure, pricing models, and regulatory requirements creates numerous possible variations for the rollout of public charging infrastructure. The methodology presented and the developed simulation framework, CDRpy, offer the possibility of supporting decision makers by evaluating different scenarios using defined key indicators and thus optimizing the rollout of public charging infrastructure.
Footnotes
Acknowledgements
The authors would like to thank Stadtwerke München and Wirelane for providing the data.
Author Contributions
The authors confirm contribution to the paper as follows: study conception and design: M. Fischer, W. Michalk; data collection: M. Fischer; analysis and interpretation of results: M. Fischer, W. Michalk, K. Bogenberger; draft manuscript preparation: M. Fischer, W. Michalk, K. Bogenberger. All authors reviewed the results and approved the final version of the manuscript.
Declaration of Conflicting Interests
The authors declared no potential conflicts of interest with respect to the research, authorship, and/or publication of this article.
Funding
The authors received no financial support for the research, authorship, and/or publication of this article.