
Abstract
The New Zealand (NZ) government has promoted road diet programs to improve the quality and quantity of bicycle infrastructure. Numerous cycleways have been retrofitted onto existing roadways as the public good generally outweighs the cost. This paper examines vehicle positioning changes when retrofitting separated cycleways onto existing roads in Christchurch, NZ. Two reconstructed roads were selected for this study. An Internet of Things (IoT) prototype was used to collect vehicle lateral positioning before and after the reconstruction projects. Although retrofitting cycleways onto existing roads brings several well-researched benefits for cyclists and society, the results from this study showed that as vehicle lanes became narrower to accommodate the new facilities, it presents new challenges for motorists to navigate, with very high centerline encroachment rates. Whereas the separated cycleway effectively prevented vehicle encroachment on cycleways and increased cyclist safety, the results showed that a road diet can significantly narrow the vehicle wheel paths. This effect has traditionally not been accounted for when implementing cycleways on existing roads in NZ and its impact on aspects of pavement maintenance needs to be further investigated. The results also showed that chip-seal contractors should recalibrate the variable bitumen sprayer to accommodate the new location and narrower wheel paths after a road diet to improve maintenance practices. These findings provide valuable insights for planning. Future research in this area could be aided by IoT-based approaches, as demonstrated by this case study.
Increasing cycling in New Zealand (NZ) helps to create more accessible and inclusive cities that are prosperous, safe, healthy, and sustainable, which has a crucial significance in enhancing the well-being of New Zealanders ( 1 ). As per the Ministry of Transport Household Travel Survey, roughly 31% of New Zealanders participate in cycling ( 2 ). Promoting cycling in NZ is a significant step toward reducing transportation emissions, aligning with the goal of achieving net-zero long-lived emissions by 2025 ( 3 ). The NZ government has promoted the Urban Cycleways Program to improve the quality and quantity of bicycle infrastructure since late 2014 ( 4 ). From 2018 to 2021, $390 million was allocated to walking and cycling initiatives, making a $96 million increase compared with the preceding 3 years ( 5 ).
To improve cyclist safety and decrease the interaction between motorists and cyclists, the Christchurch City Council is gradually advancing its efforts to promote and construct separated cycleways within Christchurch, NZ ( 6 ). In light of pavement maintenance, it is necessary to investigate the long-term impacts of these road diet activities. A road diet is a street design approach that reduces the number of vehicle lanes or lane widths, redistributing this space for other purposes like cycleways, wider sidewalks, pedestrian crossings, or green areas ( 7 ). In Christchurch, the road diet program has resulted in two kinds of separated cycleways: one-way cycleways allocated on either side of the road, and two-way cycleways along one side of the road, as Figure 1 shows.
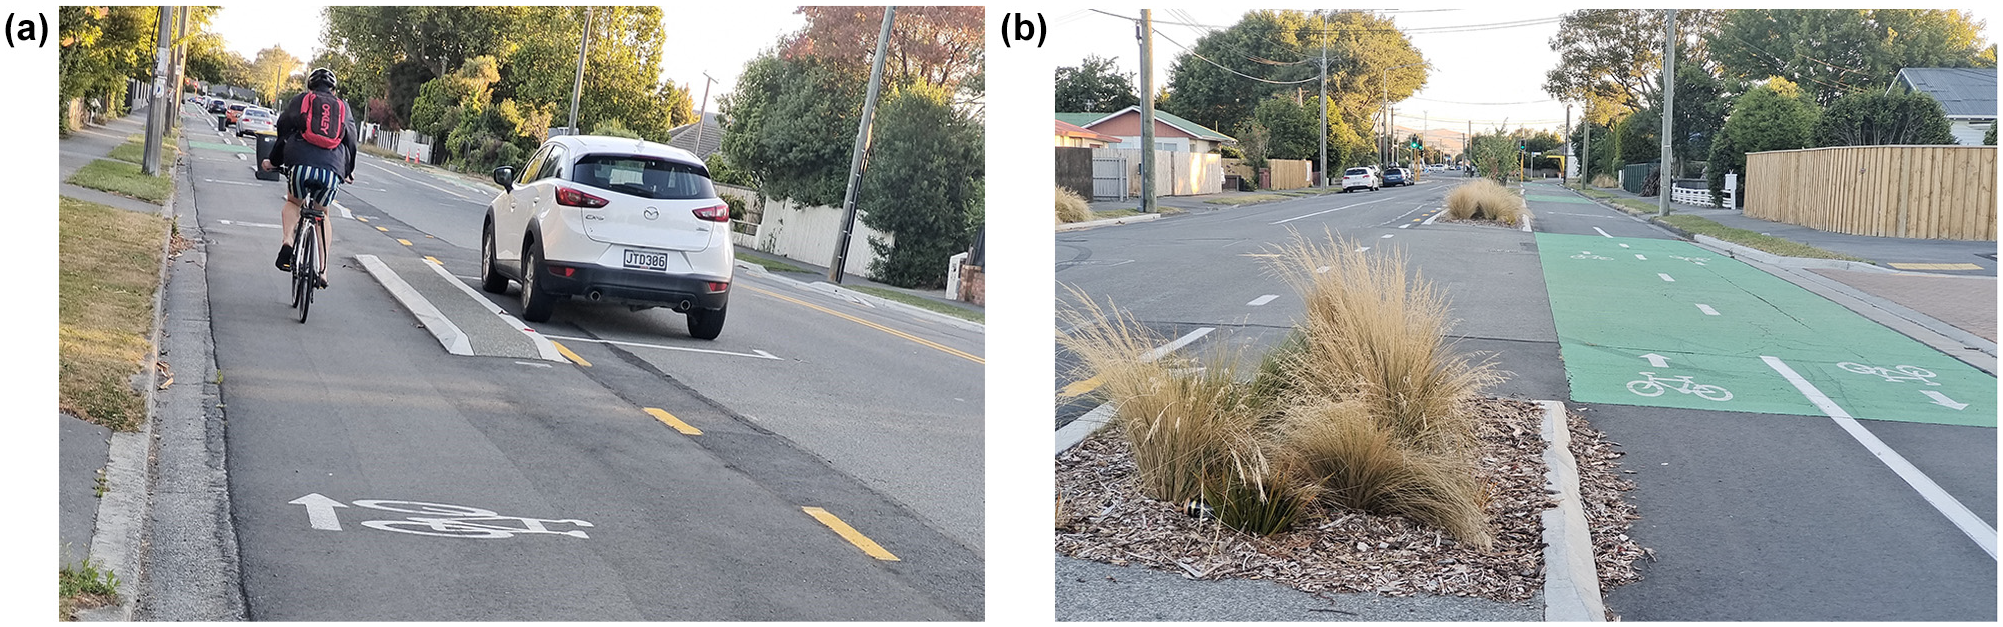
Separated cycleways after road diet in Christchurch, NZ: (a) one-way cycleway on each side of the road, and (b) two-way cycleway along one side of the road.
In NZ, most state highways and residential roads are constituted with a chip-seal surface over a granular base. Flushing and raveling are often early distress signs of chip-sealed roads in NZ ( 8 ). The Transverse Variable Application Sprayer (TVAS) is currently employed to address issues of raveling and flushing. This innovative system adjusts the bitumen application rate across the road’s width, applying a reduced amount in the wheel paths to prevent flushing, and increasing the application rate in nonwheel path areas to minimize raveling ( 9 , 10 ).
Often, separated cycleways have been retrofitted onto roadways that were initially constructed without considering the inclusion of these dedicated facilities. This means the roadway is width-constrained between private property boundaries, which extend beyond the paved surface and may include the area between the curb line and the property line. Implementing separate cycleways on these roads therefore narrows the width of the existing vehicle lanes. This can change vehicle behavior—an aspect that is poorly understood.
Prior Study
Cycleway-Related Research
One of the main barriers to cycling is perceived safety ( 11 ). Cycling is regarded as one of the least safe modes of transportation for the user ( 12 ). Cyclists experience a higher frequency of accidents per kilometer traveled than nearly all other road users ( 13 ). However, roads with striped cycleways exhibit substantially lower crash rates than those without striped cycleways (14–16).
The interaction between motorists and cyclists plays a crucial role in ensuring cycle safety ( 17 ). To enhance safety on the roads, the Cycling Safety Panel in NZ has proposed trials to assess the effectiveness of enforcing mandatory minimum lateral clearance for motorists overtaking cyclists. This proposal suggests a clearance of 1 m for speeds up to 60 km/h and 1.5 m for speeds exceeding 60 km/h ( 18 ).
Adding striped cycleways in new locations can reduce the encroachment rate of vehicles into the adjacent lane on multilane roads ( 19 ). Furthermore, separated cycleways can improve cyclists’ perceptions of comfort and safety (20–22).
Research on Narrowing Vehicle Lanes and Pavement Loading
Cycleway retrofitting involves reshaping road hierarchies and reallocating public space through changes in road layouts, often resulting in reduced vehicle lane space to accommodate cycleways ( 23 , 24 ). Narrowing vehicle lanes has the potential to reduce vehicle speeds, therefore potentially improving safety, but decreasing traffic capacity. However, if the reduction of lane widths allows for an additional lane to be added it could add capacity, particularly for freeways ( 25 , 26 ). However, it also reduces pavement life owing to more compact lateral wheel path space ( 27 ).
The lateral positioning of vehicles is a significant consideration when conducting pavement distress surveys, particularly in relation to load-related rutting and distress ( 28 ). The lateral positioning of vehicles is contingent on both the specific vehicle type and the width of the designated vehicle lane ( 29 ). Most research indicates that the distribution of the lateral wheel path is approximately normally distributed about the lane centerline (30–32), and narrow roads have a more concentrated lateral wheel path distribution compared with wide roads ( 33 , 34 ). Taking the lateral distribution to a minimum, in the case of automatic vehicles, Georgouli et al. ( 35 ) stated that these zero variances in the lateral distribution have a negative structural effect on flexible pavement as the load is more concentrated.
Lateral Wheel Path Data Collection Research
Researchers have employed various methods to gather data on lateral vehicle positioning. For instance, when using a TVAS bar to apply different bitumen rates, technical personnel visually distinguish between the wheel path and nonwheel path areas during road resurfacing ( 33 ). Hunter et al. combined videotaping with the placement of cycleway striping to collect data on cyclist lateral spacing ( 19 ). Dey et al. utilized tapes affixed to the pavement to divide the carriageway width into equal segments when collecting videography data ( 36 ) . Rosey and Auberlet examined the impact of various road markers and guardrails on vehicle trajectory using driving simulators ( 37 ). Van der Walt et al. utilized The Infrared Traffic Logger (TIRTL) to categorize and record the lateral wheel paths of passing vehicles ( 38 ). However, this commercial equipment, priced at approximately NZ$30,000 (NZ$1 ≈ US$0.69 in November 2017), requires active monitoring owing to its cost and susceptibility to theft.
Whereas established methods for analyzing lateral positioning can be time-consuming and financially inefficient, recent technological advancements have made it possible to construct “data collectors” using affordable components. Ben et al. measured lateral position on the road using the Internet of Things (IoT) in research examining passing distance to cyclists ( 39 ). Reliable and inexpensive sensors from the IoT paradigm can contribute to achieving this objective.
Research Gap and Objectives
Despite the preference for implementing separated cycleways in NZ, there is a lack of studies examining the impact of retrofitting separated cycleways in NZ’s unique road environment: over 90% of roads are chip-sealed (an issue for cyclists because of the rough surface even in most urban areas), where lane widths are often quite narrow, usually around 2.7 m on two-lane, two-way urban roads, and many areas have minimal or no nature strips (i.e., verges) or sidewalks ( 40 ). This paper seeks to bridge this gap by introducing a novel IoT method to collect vehicle positioning data postroad diet (also known as retrofitting in some regions), with a focus on evaluating separated cycleway retrofitting in Christchurch. The retrofitting also involved the conversion of a wider vehicle lane to different widths of vehicle lanes with various configurations of cycleways. In this study, an IoT prototype was used to collect vehicle positioning data. This approach was validated, and before-and-after road diet data were presented. This information will be useful for contractors when using the variable bitumen sprayer for pavement maintenance activities after road diets to extend pavement life.
Variable bitumen sprayers are employed for NZ pavement resurfacing to adjust the bitumen application rate across the road’s width, reducing flushing in wheel paths with lower rates of traffic and preventing raveling outside these areas with higher rates ( 41 ). Current methods used to estimate lateral wheel paths to calibrate variable bitumen spray bars rely on visual inspection. IoT could be used to help calibrate the bitumen sprayers automatically. Additionally, the advocacy for segregated cycleways and the reduction in vehicle lane width necessitates a corresponding adjustment in the distribution of bitumen for spray bars.
To fill the research gap, this study aims to
Examine how the lateral positioning of vehicles will change before and after the road diet of separated cycleways; and
Discuss the potential negative and positive impacts of vehicle and cyclist position for separated cycleways in Christchurch, NZ.
Methodology
This methodology outlines the setup of the IoT prototype, detailing the configuration process. Subsequently, it delves into the validation of the prototype sensors for data collection, addressing their accuracy. Lastly, the selection of case study collection sites is described.
Configuration and Development of IoT Prototype
In this study, the Arduino IoT platform was employed to establish an IoT prototype for gathering lateral wheel path data. The prototype consists of a US-026 sensor, an OpenLog SD card data logger, an Arduino board, and a battery pack. The hardware components for developing the prototype amounted to approximately NZ$45. It is noteworthy that the IoT prototype offers a significantly more economical alternative compared with the technologies utilized in prior research endeavors. A study by van der Walt et al. used expensive commercial-grade equipment, TIRTL, which costs tens of thousands of dollars to buy and deploy commercially ( 38 ) . However, drawbacks of the IoT prototype include challenges relating to weatherproofing and identifying suitable locations for mounting the prototype, such as roadside poles.
How Does the Code on the IoT Prototype Work?
The C/C++ code was uploaded onto the Arduino board. It functioned by computing the distance to the side panel of a vehicle through the conversion of the time taken for ultrasonic waves to travel and return. This involved multiplying the time by the speed of sound and dividing by two. Subsequently, the code initiated a “loop” to track passing vehicles, with a predefined threshold of five wave detections required to register a reading, within a designated margin of error. These parameters were established through experimentation. To detect vehicles within a 50 km/h speed limit road environment, at least five readings within +/−3 cm proximity to each other were necessary per vehicle. The average of these readings was then recorded and stored as data representing the distribution of the left wheel path as detected by the sensor. Since the collected data only represented the left-hand wheel path, the right-hand wheel path was extrapolated by incorporating an appropriate axle width (151 cm), as determined in our previous research ( 33 ).
Calibration of IoT Prototype
Examination of collecting precise distances to the outside wheel path using the US-026 sensor was necessary. Previous studies affirmed the sensor’s reliability in accurately detecting fast-moving vehicles. However, to validate the sensor’s accuracy for this specific application, chalk lines were positioned at 100-mm intervals on the street. These lines began from the road curb. A video camera captured the point where the left-hand front wheel of a vehicle intersected the chalk scale. Subsequently, still frames extracted from the footage were analyzed using photo-editing software to ascertain the distance between the outer edge of the wheel and the curb. By comparing multiple data points obtained from the video with those recorded by the prototype, the equipment’s margin of error at various distances could be calculated. The outcomes of this assessment are presented in Figure 2.
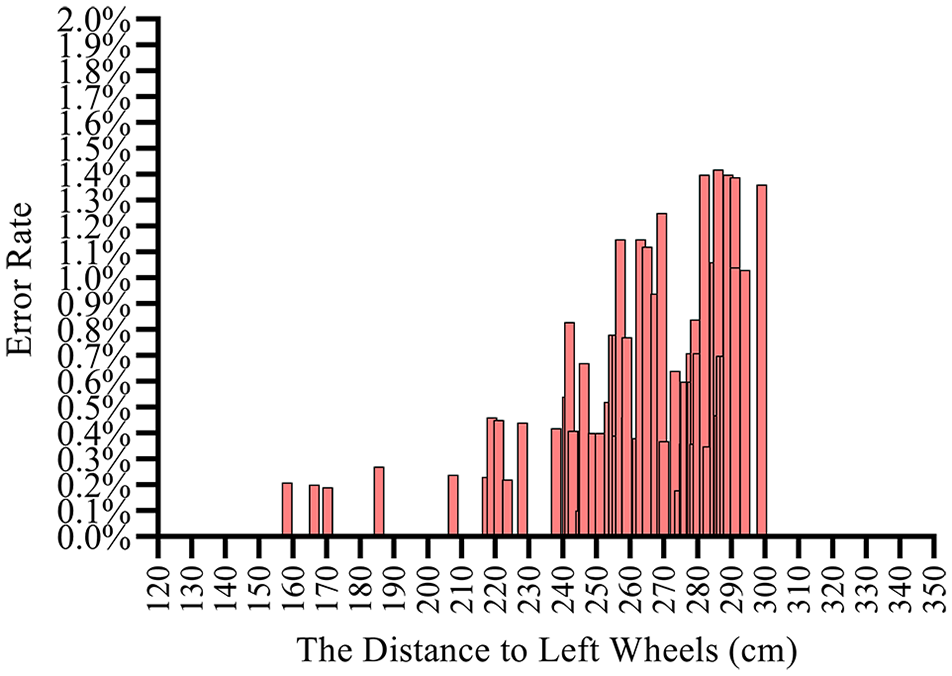
Schematic diagram of error rate for detecting distance changes on Creyke Road.
Figure 2 illustrates a trend where accuracy tends to diminish with increasing distance. As the distance extends, the error rate rises accordingly. In each trial, the percentage difference between recorded and measured values was computed, as depicted in Figure 2. The percentage difference remained below 1.72%, corresponding to a deviation of 4 cm. Therefore, the sensors and prototype were deemed conservatively reliable up to approximately 3 m, which was far enough for the purposes of data collection in this study. However, with a more expensive version of this sensor, the manufacturer has an extended range of 5 to 8 m.
Site Descriptions and Data Collection
A typical roadway configuration in Christchurch is a two-way, two-lane road. Although explicit parking road markings are absent, the customary understanding permits vehicles to park along the roadside, and cyclists are allowed to ride along the roadside. The changes before and after cycleway retrofitting are displayed in Figures 3 and 4. The details of typical roads are shown in Figure 3, a and c , and in Figure 4, a and c . Concurrent with the initiative to promote cycling in Christchurch, two common types of separated cycleways were retrofitted in 2023. These encompassed one-way cycleways designated on each side of the road (see Figures 3b and 4b). The second example shows two-way cycleways positioned unilaterally alongside roadways, as illustrated in Figures 3d and 4d. Ilam Road and Middleton Road were chosen for the case study investigation in Christchurch because these roads were, at the time, in the planning phase to be retrofitted.
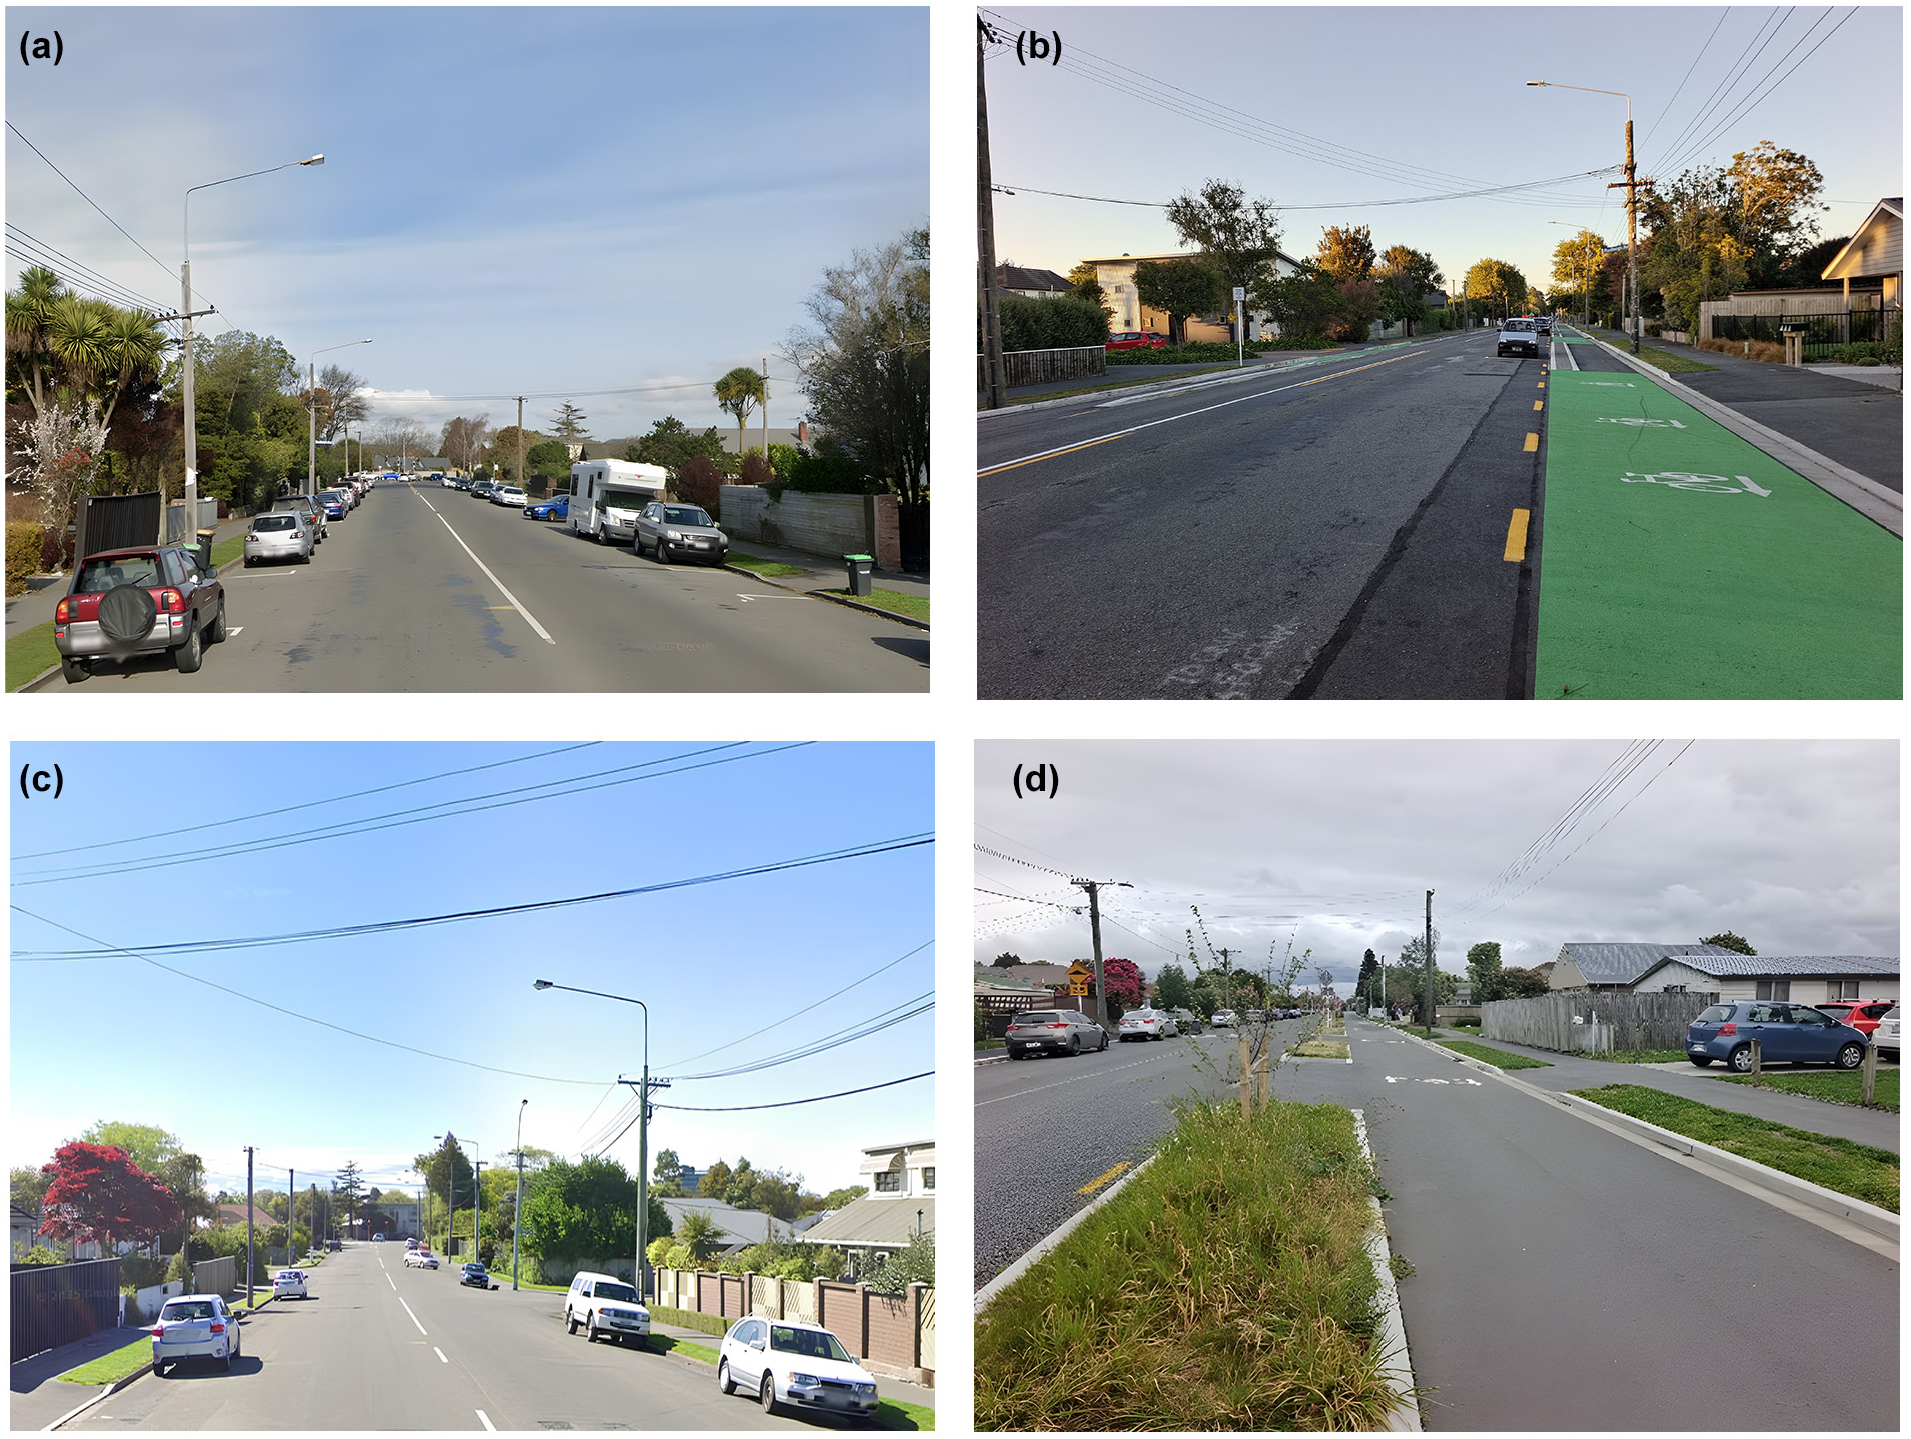
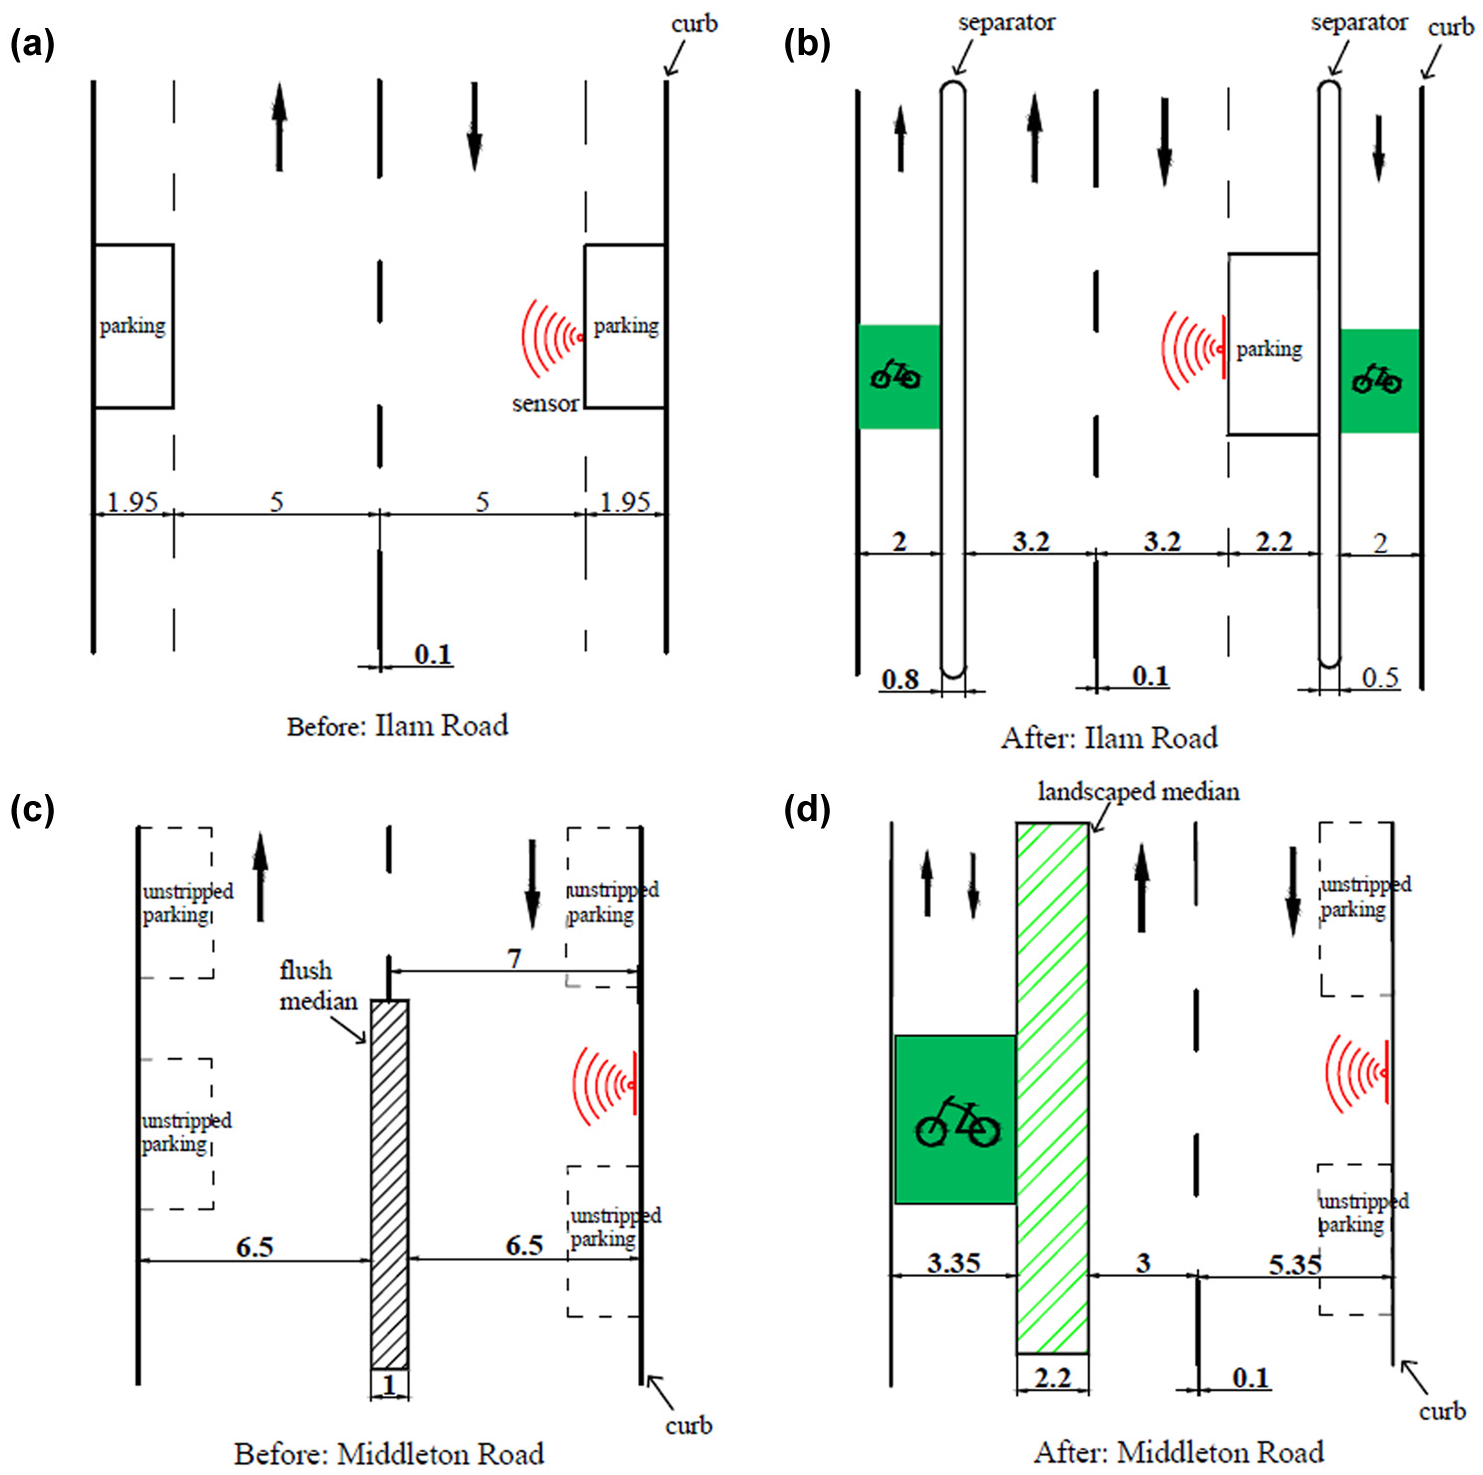
Before and after road diet of Ilam Road and Middleton Road in Christchurch: (a) before: Ilam Road, (b) after: Ilam Road, (c) before: Middleton Road, and (d) after: Middleton Road.
Before and after road diet in Christchurch: (a) before: Ilam Road, (b) after: Ilam Road, (c) before: Middleton Road, and (d) after: Middleton Road.
Ilam Road is situated in a residential urban area, with a primary school and a university nearby. The average daily traffic volume is roughly 7,250. The average daily bicycle volume is 235, and heavy vehicles make up ∼6% of the total traffic ( 42 , 43 ).
Middleton Road is also located in a residential urban area, with an average daily traffic volume of 1,832 vehicles (one direction). The average daily bicycle volume is around 85, and heavy vehicles account for ∼2% of the total traffic ( 42 , 43 ).
Based on data reviewed from the New Zealand Transport Agency Crash Analysis System, between 2016 and the first quarter of 2025, a total of 62 crash events were recorded across Ilam Road and Middleton Road. Of these, 48 occurred on Ilam Road and 14 on Middleton Road. On Ilam Road, two crashes were classified as serious and 16 as minor. On Middleton Road, five crashes were classified as minor. No fatalities were recorded. Six of the 62 crash events involved a cyclist. Six crash records were postretrofit, one including a cyclist, and all six crashes occurred on Ilam Road in a span of roughly one and a half years postretrofit. Based on the available crash data (minor crash events are traditionally underreported), no clear trends could be identified before or after the retrofitting with crash data for either road.
Data collection relating to vehicle positioning for this study was conducted during off-peak periods to capture typical traffic patterns, with vehicles operating in free-flow conditions and minimal platooning observed. Measurements took place in a real traffic environment, which included oncoming vehicles, parked cars, and cyclists; although these elements were not directly recorded, they were noted for context. The primary focus of this study was to analyze changes in vehicle positioning under typical driving conditions. Data collection at each site spanned approximately 90 to 120 min. Typically, data recording continued until a well-founded wheel path distribution was established, indicated by the stabilization of the mean and standard deviation, which aligned with visual observations. This was generally achieved with a sample size of 100 to 300 vehicles. See Table 1 for details.
Comparison of Recorded Results Obtained from Before and After Road Diet
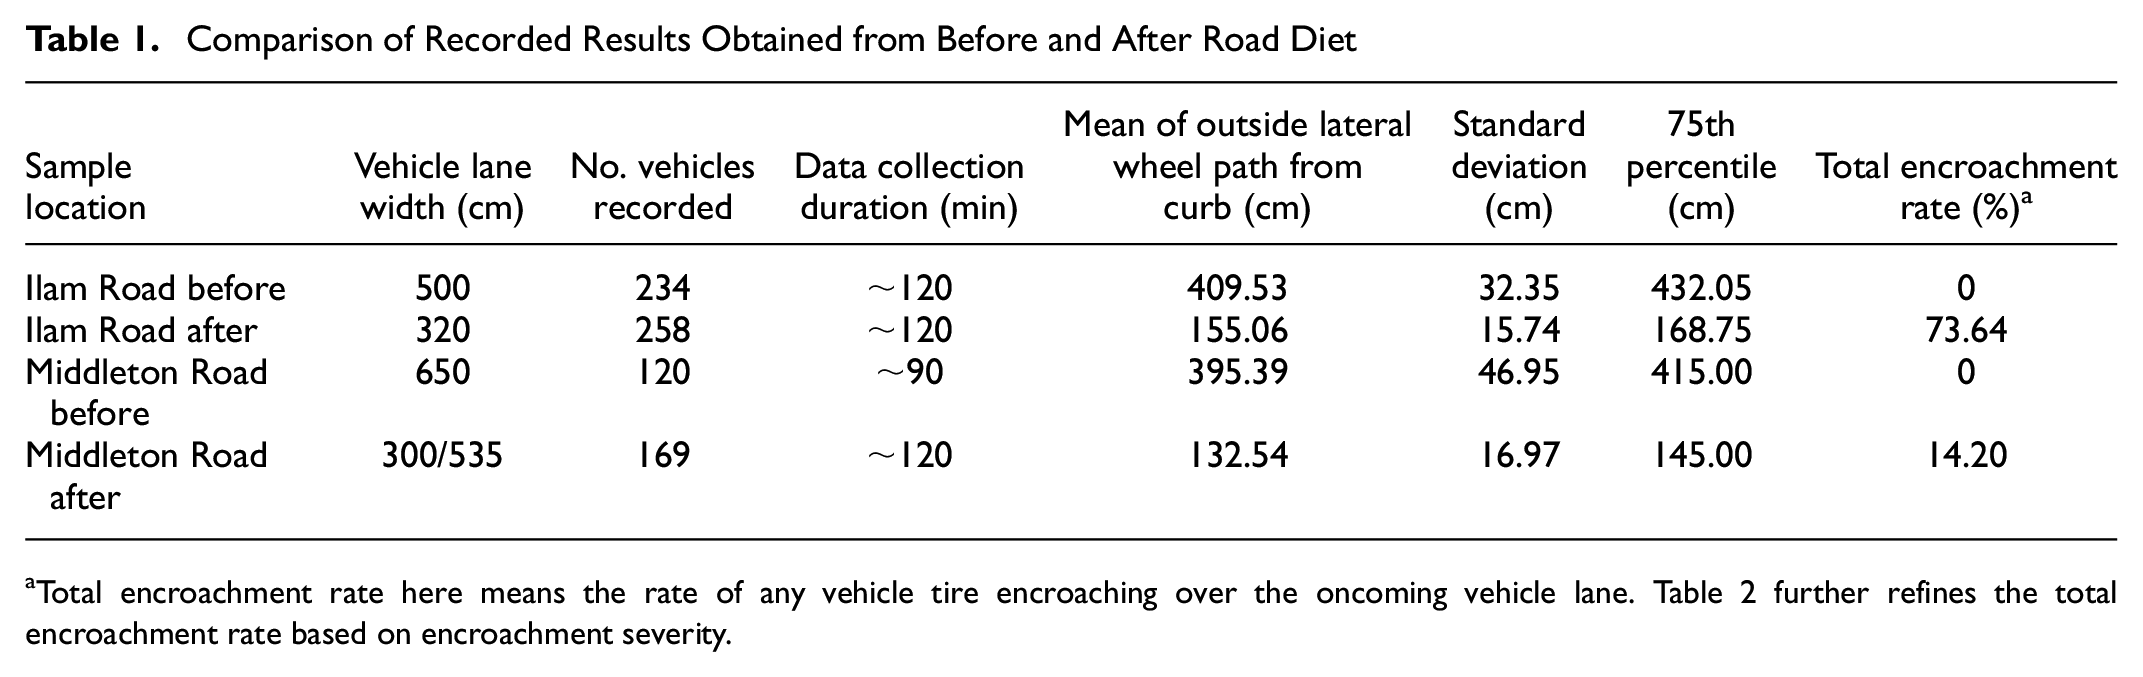
Total encroachment rate here means the rate of any vehicle tire encroaching over the oncoming vehicle lane. Table 2 further refines the total encroachment rate based on encroachment severity.
As depicted in Figure 4, a and c , before the road diet, roads lacked dedicated cycleways. Although Ilam Road and Middleton Road appear wide for a 50 -km/h speed limit before the road diet, their proximity to residential areas resulted in high parking occupancy. This, in turn, narrows the effective vehicle lane width. As stated, although there are no explicit road markings for parking on typical NZ urban roads, it is commonly understood that vehicles are permitted to park along the roadside.
Ilam Road is a long, busy road situated in a residential area with a university nearby. This results in consistently high parking occupancy, both before and after the road retrofitting—basically, there are always parked cars. Middleton Road similarly experiences full parking occupancy because of local policies that limit parking availability for nearby apartments.
Figure 4b illustrates Ilam Road having been retrofitted into a fully marked roadway featuring designated parking bays and separated one-way cycleways. Notably, the vehicle lane width was reduced from 5.0 to 3.2 m. In Figure 4d, the newly retrofitted Middleton Road exhibits extensive new markings, including a separated 3.35-m wide two-way cycleway on one side. Simultaneously, the widths of the vehicle lanes either side of the road underwent modifications, from 6.5 to 3 m and to 5.35 m, respectively. Note, road parking is permissible within the 5.35-m wide vehicle lane. Overtaking was possible on both roads before and after retrofit, however, no overtaking was recorded at any of the data collection locations. However, on the rare occasions when drivers became frustrated, dangerous overtaking was witnessed by researchers.
The data collection was done on the following schedule. The “before” data collection was completed in the fall of 2022. The after-retrofitting data collection was completed in the spring of 2023. There were some challenges to collecting pre- and postretrofit lateral wheel path data. Firstly, the anticipation of which roads would undergo retrofitting was challenging, as relevant road planning information was not readily available on government websites. Technically, ensuring methodological consistency across data collection phases is essential to facilitate accurate comparisons and minimize confounding variables. Maintaining data integrity through rigorous quality assurance measures, including instrument calibration and error checks, is crucial. Additionally, obtaining sufficient sample sizes of vehicle positioning for both pre- and postretrofit assessments can be hindered by logistical constraints and administrative hurdles. Addressing these challenges required careful planning and team collaboration to ensure reliable findings over the long-term study.
Results and Discussion
Vehicle Lateral Positioning Data for Before and After Road Diet
A summary of the before-and-after results obtained from Ilam Road and Middleton Road is given in Table 1. The mean position distance of the left-hand wheel path from the left-hand road curb was calculated for each sample. Standard deviation is the spread of lateral wheel path data. The 75th percentile, also known as the third quartile, represents the 75th percentile of all collected lateral wheel path values and is useful for bitumen spray bar calibration. Data were recorded until the researchers felt they had a well-founded wheel path distribution (i.e., a mean and standard deviation that did not significantly change with additional samples). This was also checked to ensure that it matched our visual observations. Note that the speed limit was not changed on these roads and remained at 50 km/h (about 31 mph) before and after the diet.
As shown in Table 1, there was no recorded encroachment on the opposite vehicle lane before the road diet. However, it is notable that the encroachment rate increased significantly after the road diet, especially on Ilam Road. After the road diet, the encroachment rate on Ilam Road reached 73.64%, much higher than Middleton Road at 14.2%. Because of the separated cycleway, this situation was linked to the narrower vehicle lane width. A detailed analysis of this aspect is provided in the subsection covering the classification of encroachment severity after road diet.
Comparing vehicle positioning before and after the road diets on Ilam Road and Middleton Road, it was evident that the mean, standard deviation, and 75th percentile of lateral wheel path distribution had decreased, which means that the lateral wheel path had narrowed significantly after the road diets. Thus, variable bitumen sprayers would need to be recalibrated.
Probability Density Functions of Vehicle Positioning
Figure 5 illustrates the change in probability density functions for Ilam Road and Middleton Road. The dashed lines indicate “before data,” solid lines depict data after cycleway retrofitting, and the vertical lines in Figure 5 are the centerline.
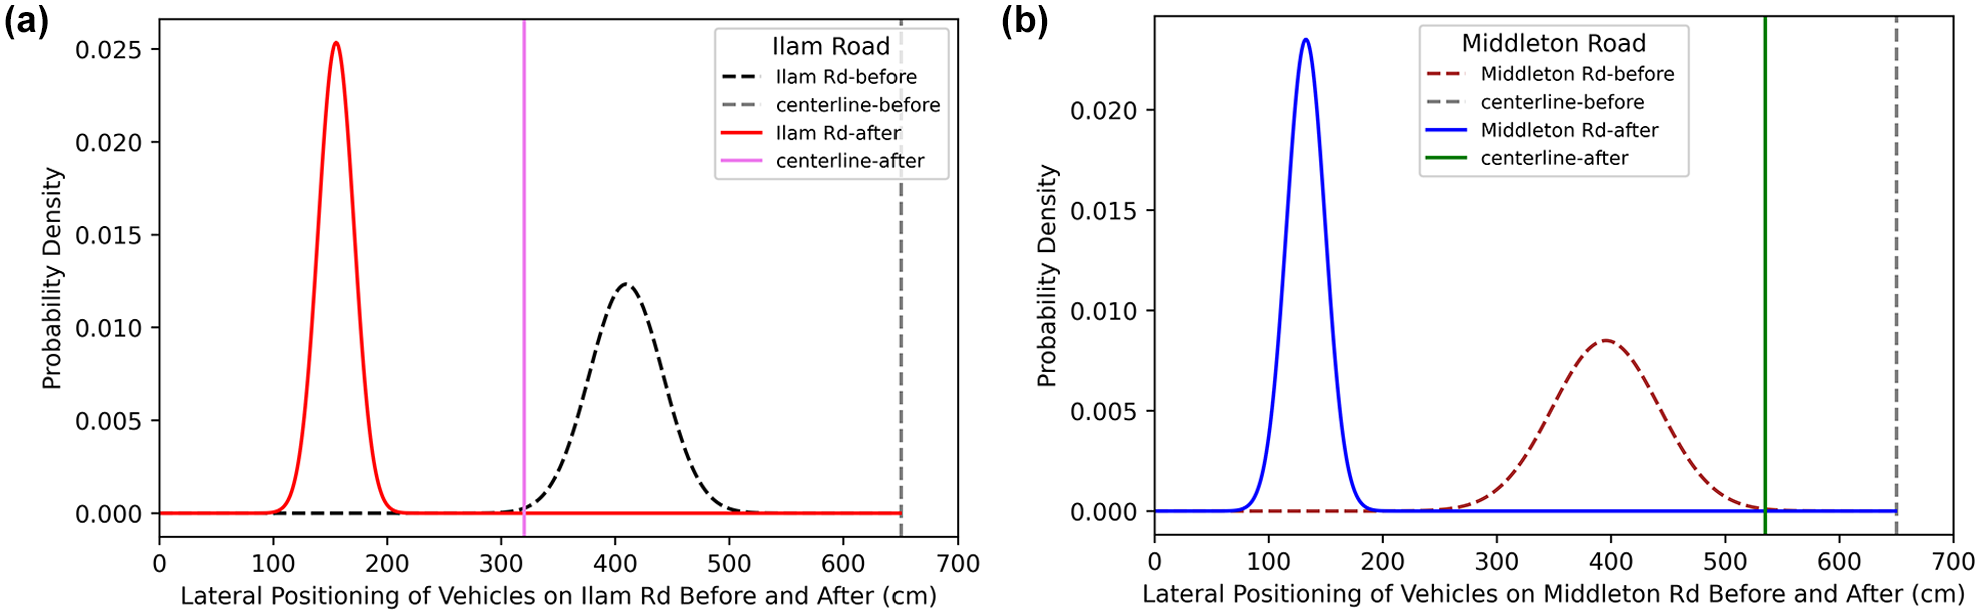
Probability density functions of vehicle positioning data before and after retrofitting: (a) Ilam Road and (b) Middleton Road.
Ilam Road experienced a reduction in usable vehicle lane width from 500 to 320 cm. Concurrently, the standard deviation witnessed a notable decrease from 32.35 to 15.74 cm, as illustrated in Figure 5 and detailed in Table 1. The standard deviation, representing the spread of wheel path distribution, now stands at 15.74 cm, a dimension not exceeding the width of a typical tire. A member of the public mentioned that, “the vehicles are almost all on rails.”
The retrofit of Ilam Road, depicted in Figure 4, includes the integration of a one-way separated cycleway on each side, resulting in 3.2-m wide vehicle lanes on both sides. This narrowing of vehicle lanes serves to constrict the space for wheel wander. Consequently, the traffic becomes channelized, leading to an excessive concentration of wheel paths, also known as the “zero wander effect” ( 44 ), a term denoting that vehicles tend to follow nearly identical wheel paths on the road. This constrained driving pattern contributes to an elevated risk of pavement rutting and cracking ( 45 ). Furthermore, considering that typical buses in NZ have a width of ∼2.85 m ( 46 ), the big reduction in road width results in a challenging narrowed driving experience for bus drivers when they drive on ∼3 m-wide lanes. From observations during the study period, buses were forced to severely slow down and almost curb their tires against the concrete barrier to allow other large oncoming vehicles through.
Although one side of the vehicle lane on Middleton Road has only decreased from 6.50 to 5.35 m, Figure 5 reveals a significant decrease in the standard deviation from 46.95 to 16.97 cm, accompanied by a shift in the mean wheel path distribution from 395.39 to 132.54 cm.
This alteration is attributed to road parking on this side. On the opposite side, there is a two-way cycleway without parking. Middleton Road, situated in residential areas, faces the challenge of limited parking, leading to the consistent occupation of the 5.35-m wide road by parked vehicles. Motorists must additionally account for lateral clearance between actively moving vehicles and those parked along the roadside.
Classification of Encroachment Severity After Road Diet
Encroachment is described as a vehicle moving across the centerline and entering the opposing traffic lane. The severity of encroachment is coded as follows ( 47 ):
Minor encroachment to oncoming lane: vehicle just over the centerline;
Moderate encroachment: 1/4 to 1/2 of vehicle over centerline; and
Severe encroachment: more than 1/2 of a vehicle over the centerline.
Table 2 illustrates different levels of severity of encroachment after the road diet. To clarify, the encroachment measurements were taken at a single point, not over a distance: specifically, at the location of the sensor at an arc of roughly 20° (ultrasonic sound waves were produced and received by the sensor). No cyclist or vehicle were present at the same time exactly where the sensor was located: this was not surprising, given the relatively low cyclist count. It was noted that the encroachment rates underwent a significant shift, ranging from no recorded data before, to 73.64% on Ilam Road and 14.20% on Middleton Road after road diet, respectively.
Frequency and Severity of Encroachment after Road Diet
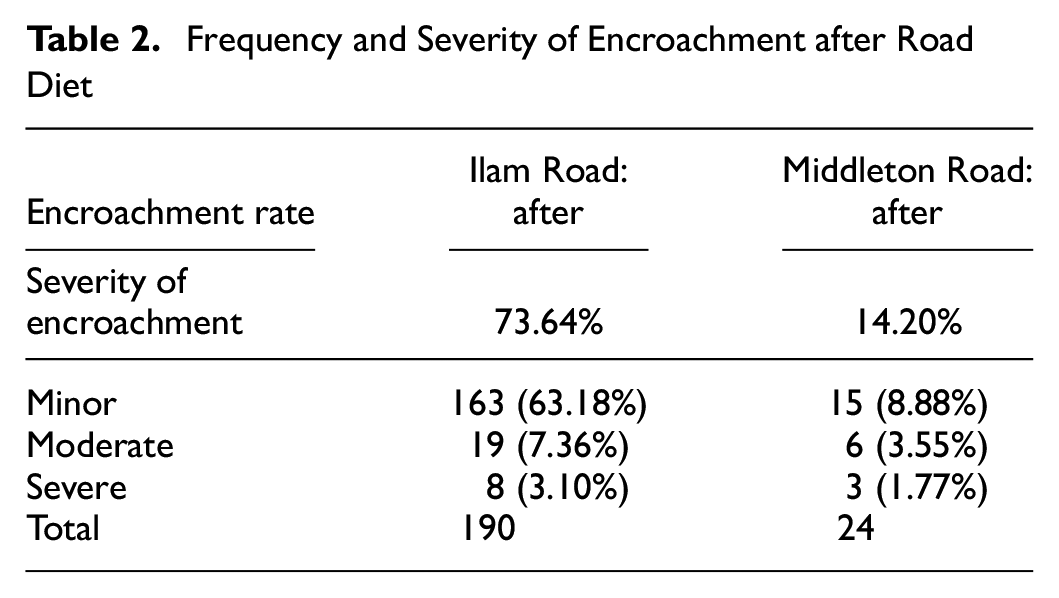
Minor encroachment rates were substantial, reaching 63.18%. Additionally, moderate and severe encroachment rates on Ilam Road were recorded at 7.36% and 3.10%, respectively. Being a two-way road with a high traffic volume, Ilam Road poses potential dangers to vehicles. Encroachment on its own is not dangerous, however, it potentially heightens driver discomfort in relation to oncoming vehicles and increases the frequency of overlapping oncoming vehicle scenarios postretrofit.
With regard to Middleton Road, which had a 5.35-m wide vehicle lane, given the usual vehicle widths ranging from 1.8 to 2.0 m, the effective vehicle lane width fluctuated between 3.35 and 3.55 m. This expanded space for lane wandering contributed to a significantly lower encroachment rate (14.20%) compared with Ilam Road (73.64%) after the road diet. Nevertheless, the minor-, moderate-, and severe encroachment rates still reached 8.88%, 3.55%, and 1.77%, respectively.
On Ilam Road, the introduction of a one-way separated cycleway has been effective in preventing vehicle encroachment onto the cycleway. However, in the area where postretrofitting data were collected, a striped parking bay exists adjacent to the 3 m vehicle lane. The parking bay is frequently occupied, leading to a high likelihood of drivers maneuvering further away from the parked vehicles when passing through. Furthermore, the separated cycleway can create a physical and visual sense of narrowing road space. Motorists tend to drive further away from the “hard barrier” (i.e., physically separated cycleway). This increases the likelihood of encroachment into the opposing lane, which may be perceived as a “softer barrier” because the lane may be unoccupied or drivers believe they have time to correct their position.
Conclusions
The implementation of retrofitted cycleways has significantly altered the roads in NZ, which were initially built without considering this additional cycling facility. This study aimed to compare the changes in vehicle positioning before and after the cycleway road diet (retrofitting) in Christchurch, NZ. It introduced a methodology that can collect lateral positioning data using a cost-effective IoT prototype, serving as a foundational reference for future research and broader deployment in this research area.
In conclusion, retrofitting cycleways onto existing roads offers several well-researched benefits for both cyclists and society. However, the results from this case study show that narrowing vehicle lanes to accommodate new facilities in constrained environments presented new challenges for motorists, including high rates of centerline encroachment. The road diet also affected the position and distribution of vehicle wheel paths—an effect that has traditionally not been considered when implementing cycleways on existing roads.
Moreover, the findings suggest that in NZ maintenance contractors should recalibrate variable bitumen spray bars to account for the shifted and narrowed wheel paths following a road diet. These insights are valuable for planning and highlight the importance of a balanced, systems-based approach when retrofitting new facilities onto existing roadways. Future research could build on this work using IoT-based monitoring, as demonstrated in this study.
Future Work
This study highlights the need for further investigation into the complex relationships between lane width, carriageway width, traffic composition, road diets, safety, and pavement performance, particularly for thin chip-sealed pavements over granular bases as used in NZ. Future research should focus on the following:
Pavement deterioration and load concentration: Conduct targeted investigations. Findings from this case study indicated reduced lane widths from retrofitting can have an impact on vehicle wheel paths, increasing load intensity, often referred to as the zero wander effect.
Use of longitudinal data: Incorporate long-term pavement performance data, transport safety datasets, and council maintenance records to support more robust economic and multicriteria evaluations.
Scaling IoT-based monitoring: Extend the IoT-based vehicle tracking approach to multiple sites across the network to better understand spatial patterns in lane use and support system-level analysis.
Predictive modeling: Develop models to forecast lateral wheel path distribution across different traffic and geometric conditions to inform future infrastructure design.
Safety and economic trade-offs: Evaluate the benefit–cost relationships among lane width, traffic volume and composition, lateral vehicle positioning, and the associated impacts on safety, zero wander effects, pavement design, and maintenance.
In the longer term, studies such as this may inform updates to planning approaches, including crash modification factors, in both national and international contexts. However, given the complexity of crash prediction and the limitations of case study data, caution must be taken to avoid overfitting conclusions. Broader datasets and continued research are essential.
Footnotes
Author Contribution
The authors confirm contribution to the paper as follows: study conception and design: Y. Li, J. D. van der Walt; data collection: Y. Li, J. D. van der Walt; analysis and interpretation of results: Y. Li, J. D. van der Walt; draft manuscript preparation: Y. Li, J. D. van der Walt, E. Scheepbouwer, B. Guo, T. Patel. All authors reviewed the results and approved the final version of the manuscript.
Declaration of Conflicting Interests
The authors declared no potential conflicts of interest with respect to the research, authorship, and/or publication of this article.
Funding
The authors received no financial support for the research, authorship, and/or publication of this article.