
Abstract
Flooding significantly compromises coastal transportation infrastructure by increasing the risk of slope failures and causing substantial damage. Rapid escalation in the severity and occurrence of flooding highlights the need to develop techniques for effective water drainage within slopes to ensure their safety and durability. Over the past decade, the multifunctional wicking geotextile has gained popularity in geotechnical infrastructure design. Its enhanced moisture redistribution capabilities, facilitated by wicking action, enable it to effectively drain accumulated water within geomaterials. Although wicking geotextiles have demonstrated promising results in pavement applications, their performance in highway embankment slopes remains largely unexplored. This project aims to evaluate the effectiveness of wicking geotextiles as a solution for coastal infrastructure susceptible to flooding. The research focuses on understanding the effect of flooding and drainage on the interface strength of wicking geotextile, a crucial parameter in the design of reinforced slopes. A large-scale direct shear box was used to conduct interface tests with wicking geotextile. Tests were performed immediately after flooding and after 7 days to capture the effects of wicking-induced drainage on interface strength properties. The drainage capability of wicking geotextile was also evaluated at different normal stress levels. Additionally, a finite element model was developed, and numerical analyses were conducted to examine effect of interface strength properties of wicking geotextile on safety factors of the slope subjected to flooding. Results from experimental and numerical studies indicate that wicking geotextile has potential to improve the stability of slopes vulnerable to flooding.
Keywords
There has been a substantial rise in flooding events in coastal areas resulting from tropical and non-tropical storms as a result of climate change ( 1 ). Flooding caused by storm surges significantly increases the vulnerability and reduces the functionality of coastal transportation infrastructure ( 2 , 3 ). Hurricanes have resulted in billions of dollars in damage to coastal roadways, along with substantial losses stemming from transportation delays during and after these storms ( 4 ). Approximately 60,000 mi of coastal roadways in the United States are at risk from storms and flooding ( 2 ). As climate change intensifies, implementing mitigation strategies will become ever more essential in the operation and maintenance of coastal transportation infrastructure ( 5 ). Coastal highway slope failures are regarded as a significant geoenvironmental hazard because of their serious adverse impacts on the economy and community life ( 6 ). Geosynthetic reinforcement is a recognized and economical method for constructing slopes and can be utilized in coastal transportation infrastructure, provided it offers both structural reinforcement and lateral drainage capabilities ( 7 , 8 ).
Although geotextiles are widely used in highway embankments and pavement structures to enhance stiffness, most of them do not address drainage effectively. In the majority of cases, geotextiles drain water from geomaterials under the effect of gravity ( 9 ). Conventional geotextiles effectively drain water from saturated soils but are ineffective at draining unsaturated soils solely under gravitational influence ( 10 ). Also, the in-plane permeability of geotextiles in unsaturated conditions is affected by clogging resulting from the fines present in the soil ( 11 , 12 ). The drainage behavior of geotextiles differs between saturated and unsaturated conditions, and geotextiles can shift from permeable to impermeable with a slight change in suction ( 13 ). After a flooding event, the soil mass in slopes undergoes a transition from a saturated to a partially saturated state during the drainage process ( 14 , 15 ). Given the limited drainage capabilities of conventional geotextiles in unsaturated conditions, there is a pressing need for innovative materials that can enhance drainage performance in geotechnical applications, especially in areas susceptible to flooding or experiencing rapid fluctuations in moisture content.
A novel geotextile, incorporating wicking fibers, has the potential to serve as a unified drainage and reinforcing element in embankment slopes and is gaining attention because of its multifunctional capabilities ( 16 ). Azevedo and Zornberg conducted a filtration test to examine the properties of the wicking geotextile and their findings indicated that the wicking geotextile is more effective in facilitating lateral drainage compared with non-wicking geotextiles ( 17 ). Several field and numerical studies have been carried out to evaluate the performance of wicking geotextile under pavements ( 18 , 19 ). Zhang et al. conducted a field study in Alaska utilizing wicking geotextile to address freeze–thaw issues linked to unpaved roads, finding that the wicking fibers significantly alleviated frost boil problems ( 20 ). Biswas et al. assessed the performance of wicking geotextile in facilitating drainage for flexible pavements constructed on expansive soils ( 21 ). Although wicking geotextile shows promising results in pavements, its effectiveness in embankment slopes, especially those subject to flooding, still requires further investigation.
In addition to drainage, the interaction between geotextiles and soil is a critical factor in the design and performance of embankment slopes. Both the stability of the slope and the integrity of the geotextile rely on the shear strength at the interface between the different geotextiles and geomaterials ( 22 ). The interface properties of geogrids, geotextiles, and geomembranes have been thoroughly investigated by numerous researchers ( 23 – 25 ). A lot of research has been done to understand the effect of soil moisture and matric suction on the interface strength of geotextiles ( 26 – 28 ). Zornberg and Mitchell demonstrated that the shear strength at the soil–geotextile interface decreases with increasing moisture content in sandy soils ( 8 ). Hamid and Miller, through their experimental work on unsaturated interfaces, emphasized that matric suction enhances the peak shear strength of unsaturated interfaces but has little impact on their post-peak shear strength ( 29 ). Guzman et al. performed pull-out tests on geotextiles in saturated soils and reported the high interface strength of wicking geotextile compared with non-wicking geotextile ( 30 ). Although the influence of soil moisture on the interface strength of geotextiles has been thoroughly investigated, there remains a significant gap in research concerning the effects of drainage on this interface strength. Most studies on wicking geotextiles concentrate on assessing their drainage capabilities, yet the combined influence of drainage and interface strength properties remains underexplored. Understanding how these two factors interact is crucial for optimizing the performance of geotextiles in geotechnical applications, particularly for embankment slopes that rely on both drainage and interface strength for stability and durability.
The primary objective of this research study is to evaluate the performance of wicking geotextiles as drainage and reinforcement elements in highway embankment slopes subjected to extreme flooding events. The assessment is based on interface test results obtained from an extensive laboratory program and outcomes from numerical slope stability analyses. A large-scale direct shear box, integrated with moisture sensors, was utilized to perform drainage and interface tests on wicking geotextiles under varying normal stresses. This apparatus has been effectively employed in prior studies to determine the interface shear strength characteristics of geomaterials and geosynthetics ( 22 , 31 , 32 ). A series of tests under diverse hydraulic conditions were conducted on both soil–soil and soil–wicking geotextile interfaces. The experimental data were subsequently incorporated into a 2-D finite element model for slope stability assessment. Flood data from the Galveston district during the recent Hurricane Beryl were utilized in the numerical analysis. The results of this study highlight the influence of wicking-induced drainage on the interface strength of geotextiles and its overall effect on the stability of slopes exposed to flooding.
Materials
Soil Characterization
Locally available soil, similar to coastal soils, was selected and procured for the experimental work. Basic soil classification tests, including sieve analysis, hydrometer test, and Atterberg limits tests were performed, according to American Society for Testing and Materials (ASTM) standards. The results indicated that the soil consists predominantly of sand with approximately 35% fines. Based on the grain size distribution curve, as shown in Figure 1a, soil was classified as silty, clayey sand (SC-SM), as defined in the Unified Soil Classification System (USCS) method. A standard Proctor test was conducted to obtain the compaction curve of the soil. Results showed a maximum dry unit weight of 20.2 kN/m3 (128.5 pounds per cubic foot) at an optimum moisture content (OMC) of 13.4% (Figure 1b). Additionally, an unconfined compressive strength test was performed to assess soil strength. The relationship between soil moisture and suction was determined through soil water characteristic curve tests (SWCC) using a Tempe pressure cell and a potentiometer. Figure 2 shows the measured SWCC test results were best fitted using the model developed by Fredlund and Xing ( 33 ). The results from the characterization and basic soil tests are summarized in Table 1.
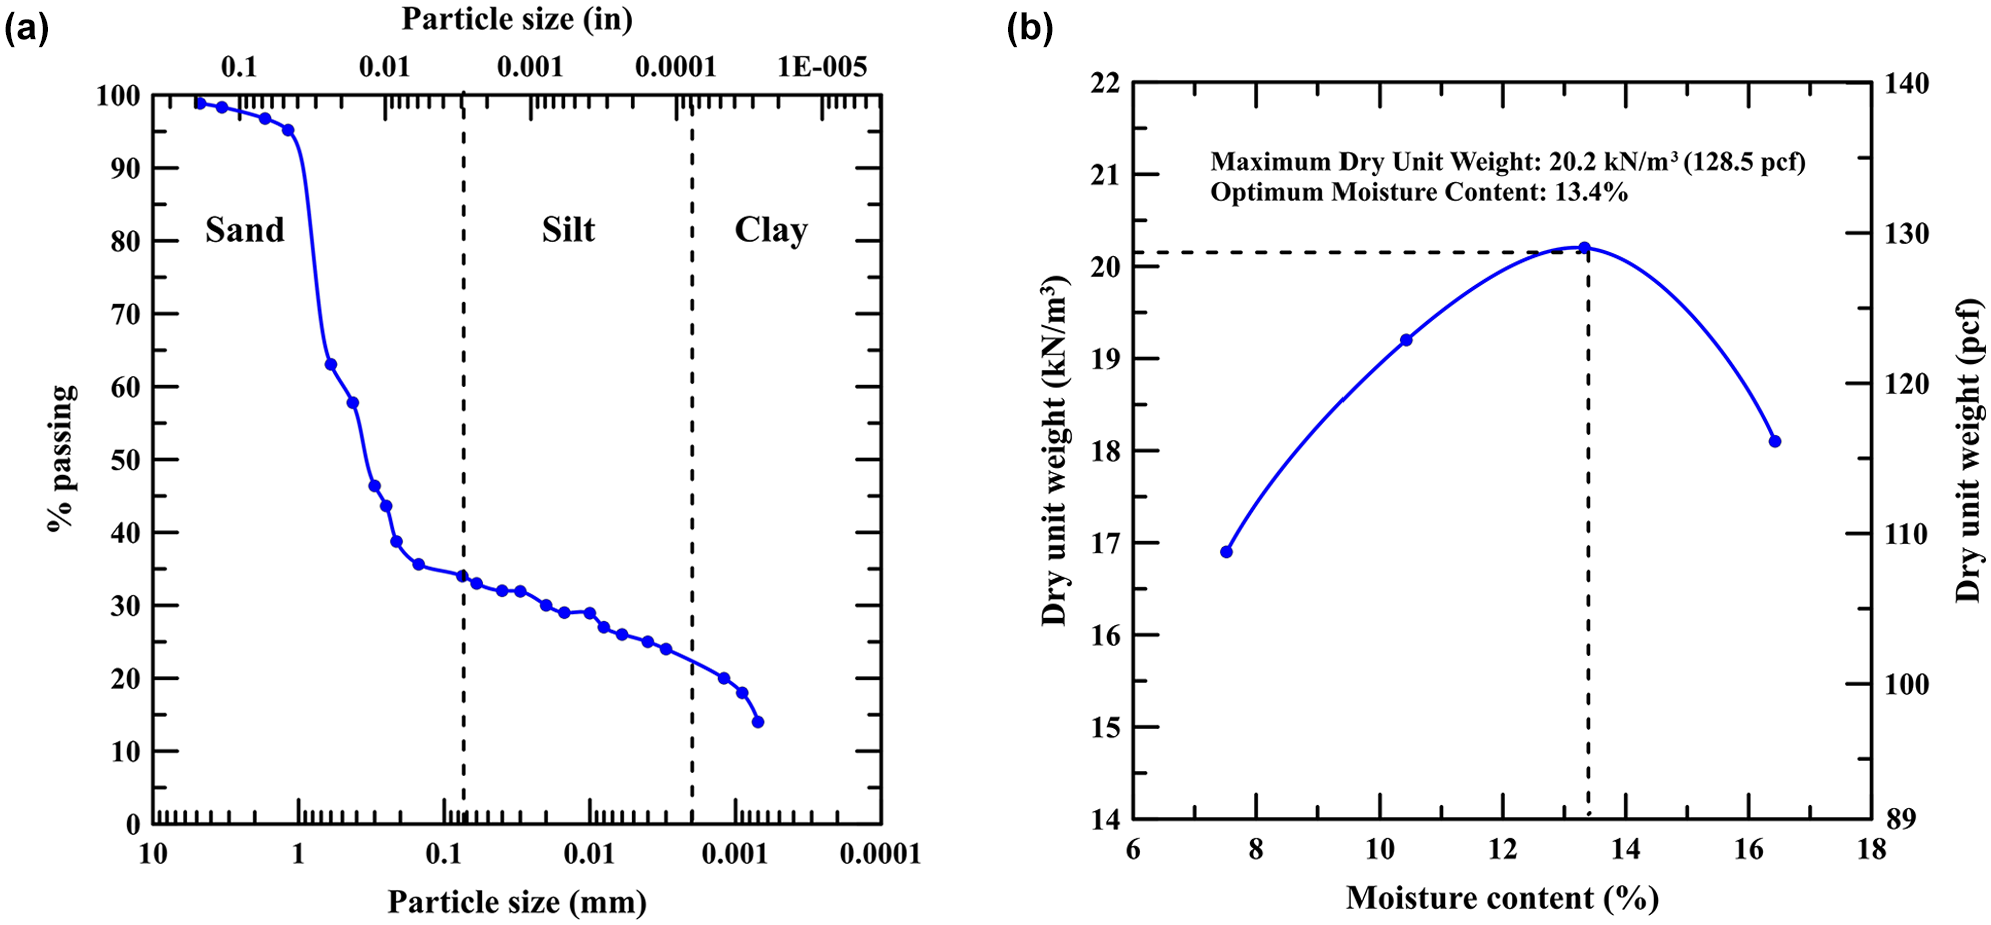
Soil characterization: (a) Grain size distribution of soil and (b) compaction curve of soil.
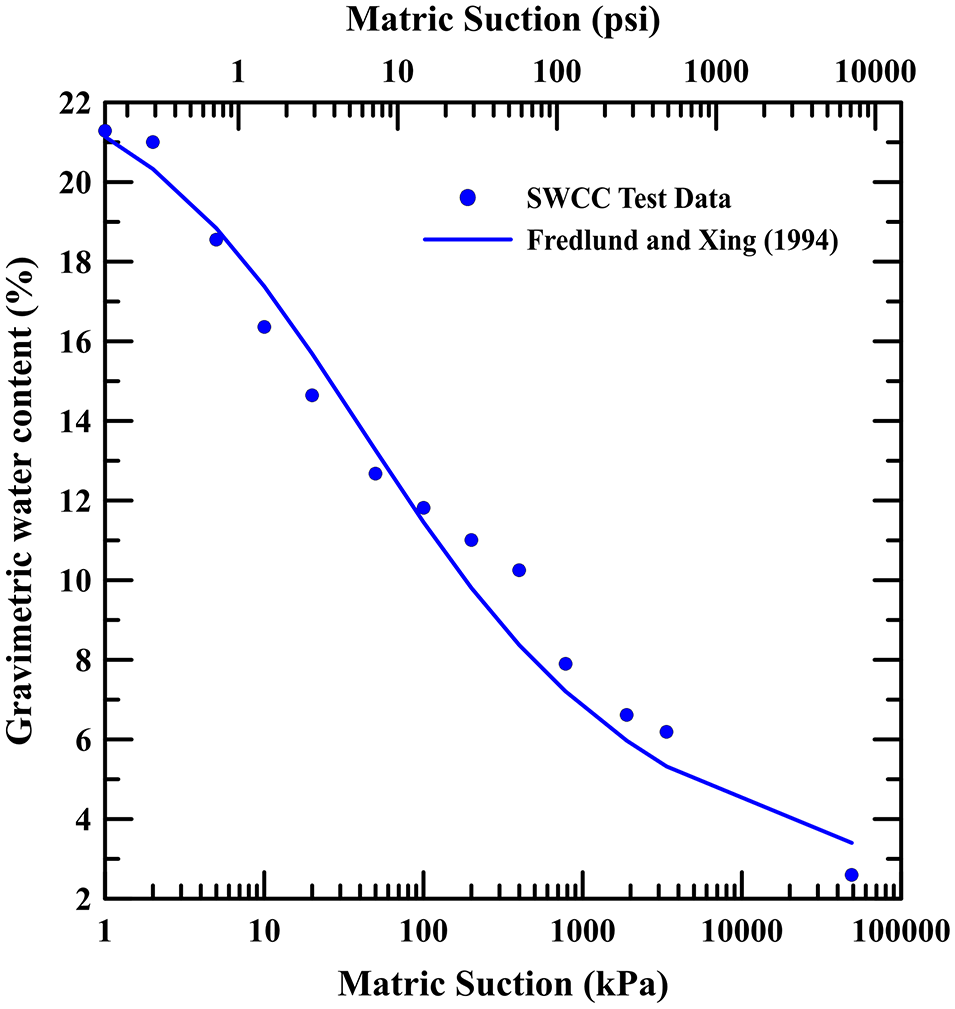
Experimental and modeled SWCC results.
Summary of Results of Soil Characterization Tests
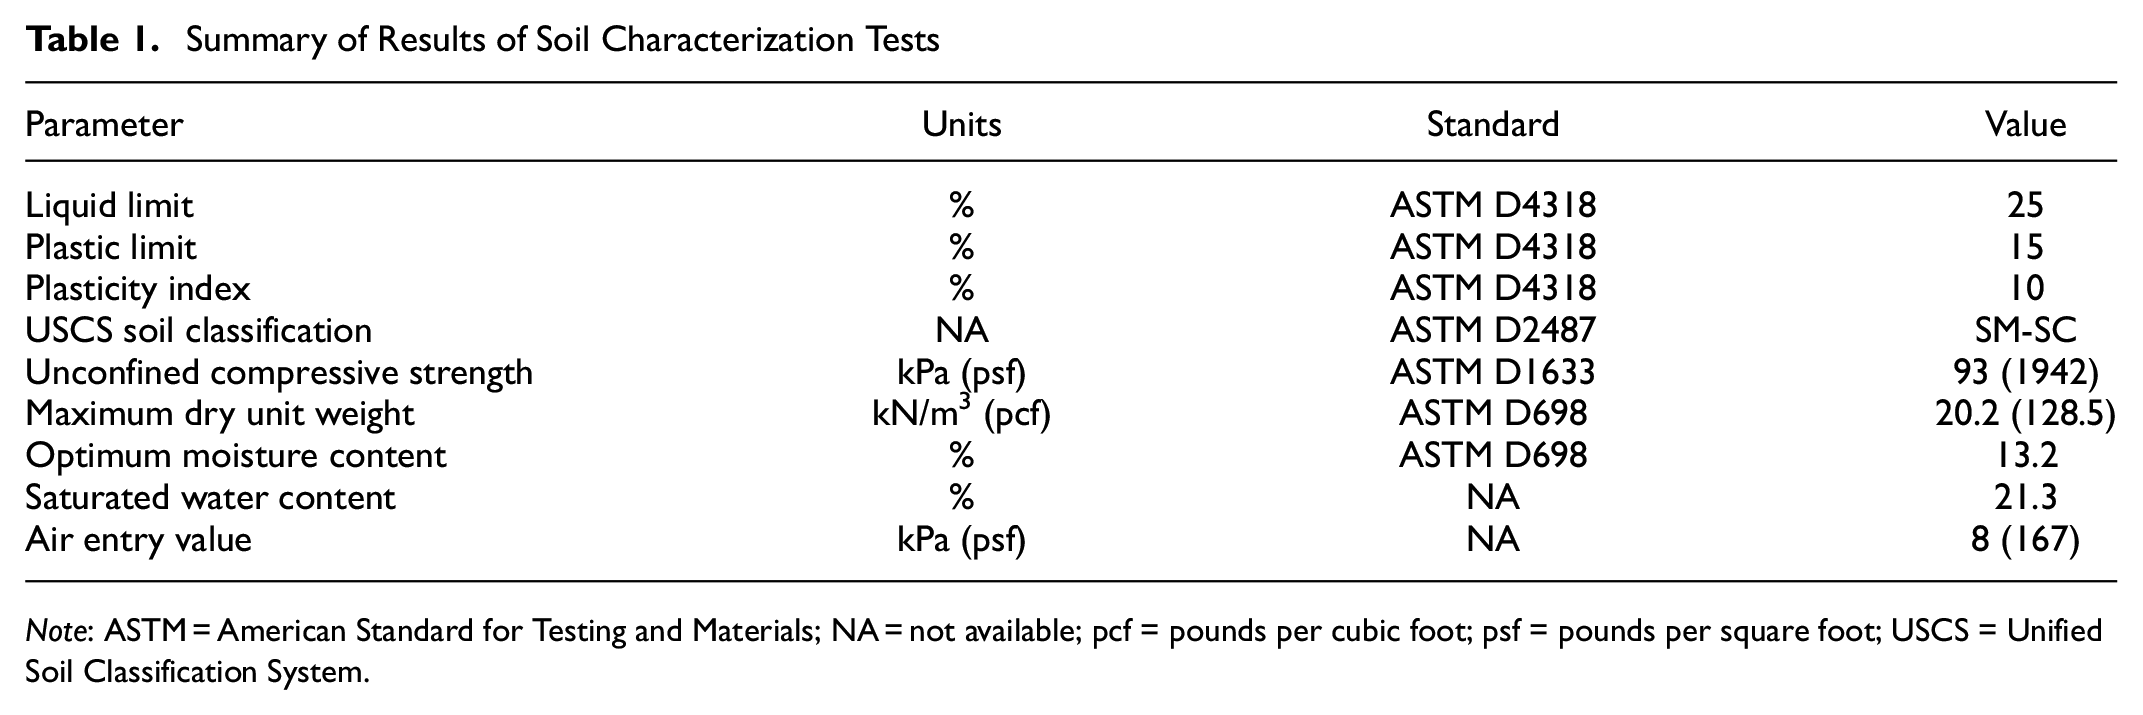
Note: ASTM = American Standard for Testing and Materials; NA = not available; pcf = pounds per cubic foot; psf = pounds per square foot; USCS = Unified Soil Classification System.
Geotextile
The wicking geotextile used in the laboratory tests, Mirafi H2Ri, was obtained from a local supplier. It is composed of a combination of polypropylene filaments and nylon wicking fibers which provide lateral drainage capability. This wicking geotextile is composed of specialized hydrophilic and hygroscopic fibers featuring multichannel cross-sections, with diameters ranging from 5.7 microns to 47.8 microns The specifications of this geotextile, as reported by the manufacturer, include an initial tensile strength of 77 kN/m (5200 lb/ft) in the machine and cross-machine directions, an apparent opening size of 0.425 mm (0.0016 in), a permittivity of 0.4 s−1, and a maximum flow rate of 30 L/min/m2.
Experimental Program
Interface Strength Test
In the present research study, the performance assessment of the wicking geotextile was based on the results from interface shear strength tests. A series of interface tests were conducted on soil–soil and soil–geotextile interfaces using a large-scale direct shear box. To comprehensively evaluate the response of wicking geotextile under different environmental conditions, tests were conducted with varying inundation and drainage conditions. The details of different scenarios adopted in this study are discussed below.
No flooding—In this case, direct shear tests were performed on samples compacted on the wet side of OMC. Unlike standard direct shear tests where samples are typically saturated, in this scenario, the samples were sheared without undergoing saturation or inundation.
Just after flooding—The primary reason for conducting direct shear just after flooding was to examine the behavior of the wicking geotextile in the submerged condition. Test samples were inundated immediately after consolidation and were kept submerged in water for 24 h. During the shearing process, the water was not allowed to drain, ensuring the samples remained in a submerged state.
7 days after flooding—This scenario was considered to assess the long-term impact of the wicking behavior of the geotextile on its interface strength parameters. In this case, test samples were also inundated immediately after consolidation and remained submerged. However, after 24 h, the ponded water was drained, and capillary drainage was facilitated through the wicking geotextile. The samples were then sheared after 7 days of drainage.
Large-Scale Direct Shear Box
A picture of the large-scale direct shear test box, used in the present research study, is shown in Figure 3. It is a fully automated device capable of performing both static and cyclic direct shear and simple shear tests. The equipment comprises a shear box, a support structure, horizontal and vertical load cells, an electrical cabinet, linear variable differential transformer (LVDT), and a computer. The shear box, with upper and lower box, is a 305 mm (12 in.) square with a total height of 203 mm (8 in.). During the shearing phase, the lower box is pushed horizontally while restraining vertical and horizontal movements of the upper box. The soil sample in the bottom box can be inundated by creating a sealed chamber around it. Moreover, the design of this equipment allows installation of moisture sensors in the soil sample during the test. All the recorded test data from load cell and LVDTs are collected by the data acquisition system of this equipment.
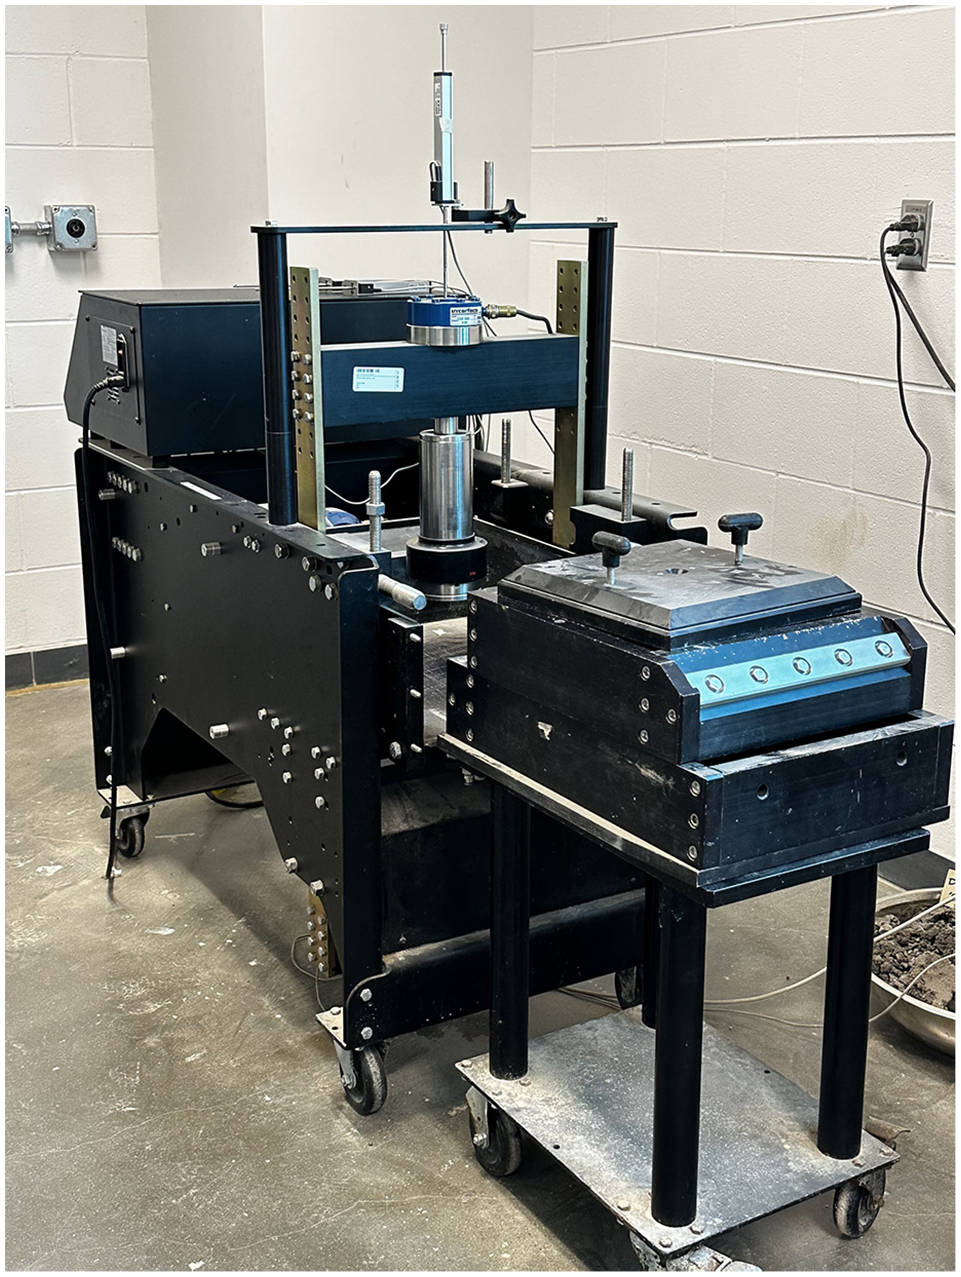
Large-scale direct shear box with its components.
Test Methodology
The interface strength tests were conducted according to ASTM D5321 standard. Depending on the substrate material, there are various test setups for performing interface testing for geosynthetics and soils in a large-scale direct shear box. Typically, soil is compacted in the top box and the bottom box is filled with either soil or a solid block. The configuration of the direct shear testing device is not strictly defined by the testing standard, and it only specifies the minimum size of the shear box. Unlike geogrids, which require soil on both sides for optimal interlocking, geotextiles can be tested with either a solid block or soil in the lower box ( 34 ). In the current study, as shown in schematic in Figure 4, soil was placed in both top and bottom boxes with a wicking geotextile sandwiched between them. This setup was also chosen because of equipment limitation, as inundation was not possible in the upper box, necessitating that soil be in the bottom box.
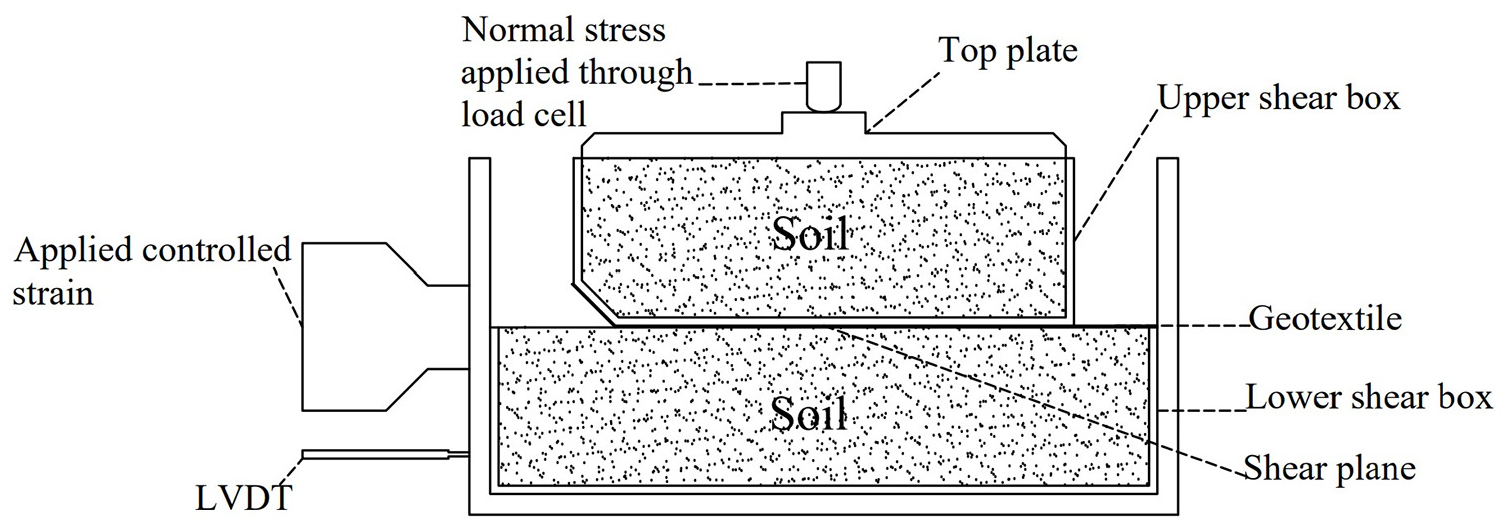
Schematic of test set up used in this study.
For soil sample preparation, water corresponding to the optimum water content was added to dry soil. Moist soil was then compacted in the bottom box in three layers using a Proctor hammer to achieve the desired density (Figure 5a). As shown in Figure 5b, three moisture sensors were placed evenly in the bottom box 1 in. below the interface. A 400 mm length of wicking geotextile was cut from the roll, and holes were punched in it for clamping. The geotextile was placed on the bottom of the top shear box and secured at the front edge with bolts and a steel clamping plate. Finally, the top box was kept on the bottom box and soil was compacted in it in three layers. As shown in Figure 5c, around 50 mm (2 in.) of geotextile was extended outside the shear box on both sides to facilitate removal of moisture from the soil. In the case of tests with flooding, the soil sample in the bottom box was inundated by filling the chamber with water, as shown in Figure 5d.
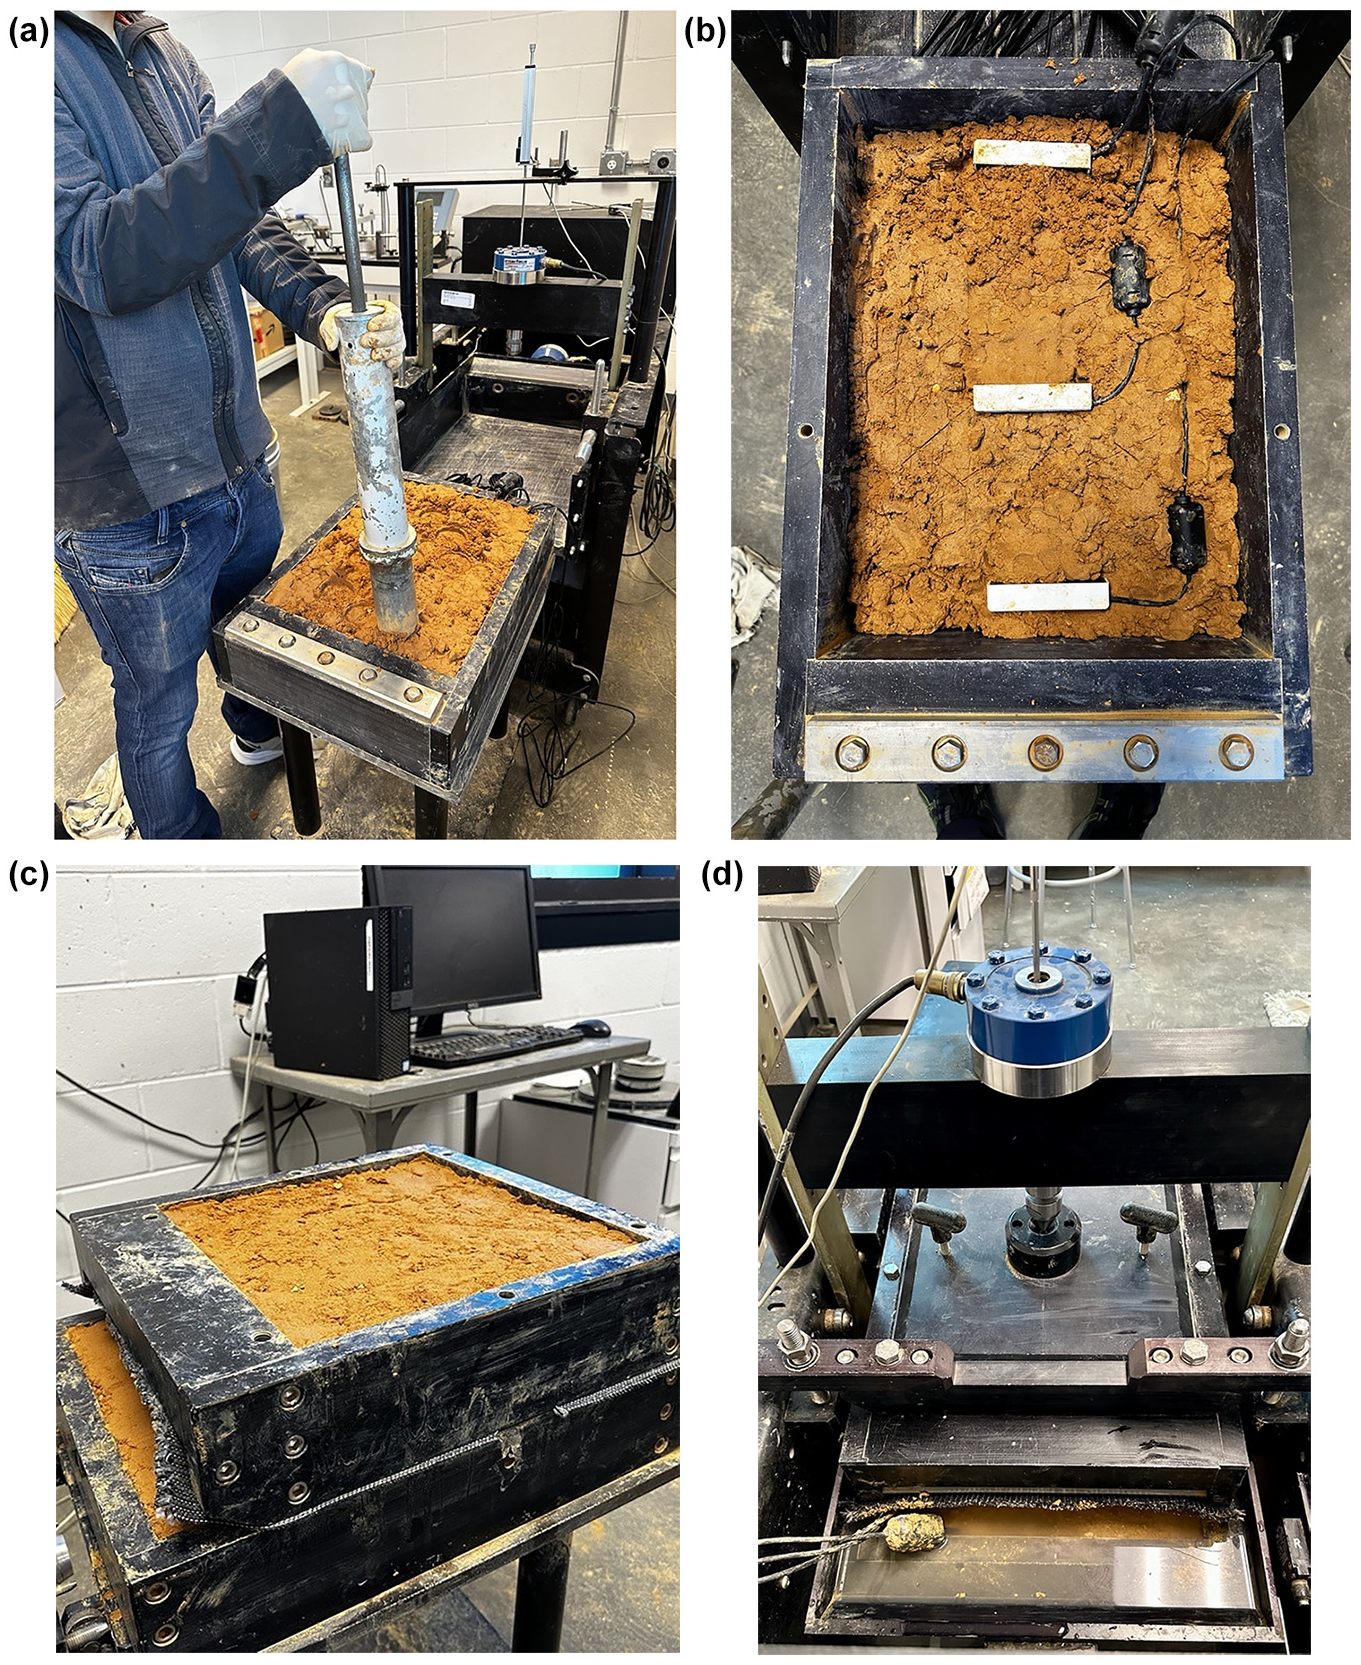
Interface test methodology: (a) Compaction of soil in bottom box; (b) placement of moisture sensors; (c) compaction of soil in top box; and (d) inundation of soil sample.
For comparison purposes, interface shear tests for both soil–soil and soil–geotextile interfaces were performed under the similar normal loading conditions and using identical testing procedures for all scenarios mentioned earlier. In this experimental program, interface tests were performed at normal stress of 50 kPa, 100 kPa, and 200 kPa (7.25 pounds per square inch [psi], 14.5 psi, and 29 psi). Soil samples were consolidated for 24 h or until vertical deformation reached its equilibrium. In the tests where soil was subjected to inundation, water was filled in the chamber and soil in bottom box was submerged. Samples were then sheared at a rate of 0.003 cm/min (0.00125 in./min) to a final horizontal strain value of 15%.
Numerical Studies
One of the potential reasons for slope failure in the coastal region is the drawdown after flooding. The effectiveness of wicking geotextile in a highway embankment slope after a flooding event was evaluated by conducting seepage and slope stability analyses. The performance of the geotextile was assessed for reduction of pore water pressure and the resulting increase in the slope’s factor of safety (FS) resulting from reinforcement. A two-dimensional plane strain model of the embankment slope was created using a commercially available finite element program. Figure 6 presents the cross-section of the slope with the initial water level on the slope side. In the numerical study, a 2H:1V slope of height 4 m (13 ft) was modeled with geotextile reinforcement. The slope was reinforced with four layers of wicking geotextile, each 8 m (26 ft) long, at a spacing of 1 m (3.3 ft). It may be noted that no separate slope reinforcement design was performed. Both spacing and length of geotextile were selected based on design studies with similar slope geometries and soil properties. The model was meshed using unstructured quad and triangular elements.
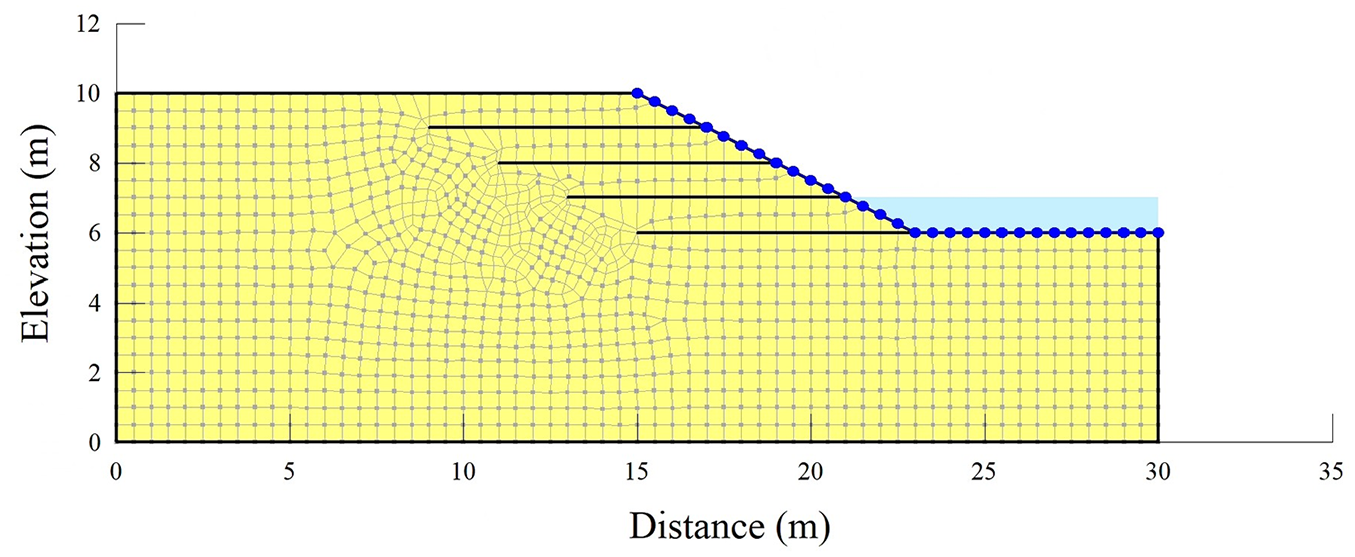
Cross-section of reinforced slope for numerical studies.
The lower section of the slope model was restrained in both horizontal and vertical directions, whereas the lateral boundaries were constrained only in the horizontal direction. For seepage analysis, a no-flow hydraulic boundary condition was applied to the base of the model. A constant head boundary condition was applied on the face of slope during steady-state seepage analysis. For transient seepage after flooding, this boundary was converted to a linearly varying head boundary condition. The hydraulic conductivity function of soil was derived from saturated permeability and SWCC tests, conducted in the laboratory. Soil was modeled using the Mohr–Coulomb model and strength parameters were obtained from interface shear tests. Wicking geotextile was modeled as a reinforcement element and mechanical properties including interface shear parameters were obtained from laboratory interface shear tests. For the wicking geotextile, both saturated permeability and geotextile water characteristic curve were taken from reported data ( 35 ). The capillary-driven water flow in soil was simplified and approximated using anisotropic hydraulic conductivity rather than explicitly modeling the behavior of wicking fibers. The pull-out resistance of the geotextile was calculated from interface strength properties using Equation 1. In this study, a surface area factor of 2 was used to account for the mobilized pull-out resistance on both the top and bottom of the geosynthetic.

where PR is pull-out resistance in kPa or psi, α is interface adhesion in kPa or psi, σ’ v is effective overburden stress in kPa or psi, and S is surface area factor.
A steady-state seepage analysis, based on Darcy’s law formulation, was performed to calculate the initial pore water pressure within the slope resulting from an initial water level of 1 m (3.3 ft) on the slope side. In the numerical model, initial soil suction was considered to vary hydrostatically above the zero-pressure line. Flooding was simulated by rapidly increasing the water level by 3 m (10 ft). The flooding data of Houston during Hurricane Beryl (Figure 7) from July 5th to July 13th, obtained from the United States Geological Survey water data inventory, were used in this research study. After the flooding event, the water level was then lowered down to the original level as per the flooding data. The drop of water level back to initial level after flooding was assumed to be linear. The pore water pressure values obtained from the steady-state seepage analysis during flooding were then considered as initial conditions for the transient seepage analysis after the flooding. Variations in pore water pressure in the slope were computed using transient seepage analysis for next 7 days.
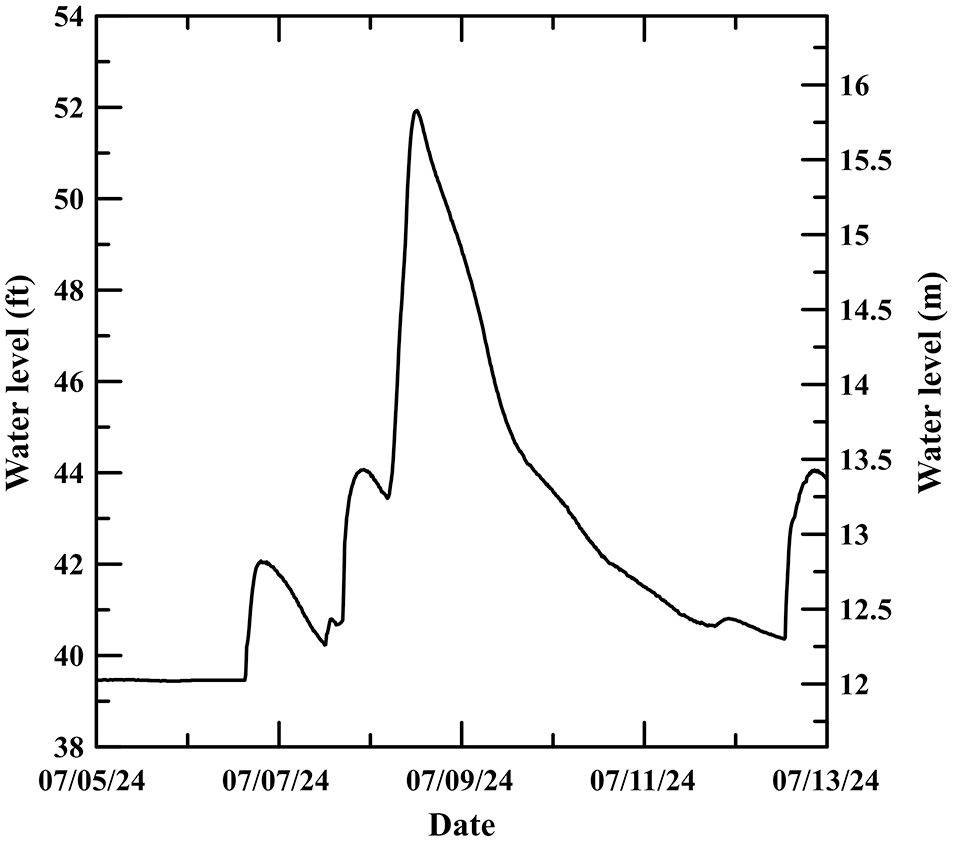
Houston flood data during Hurricane Beryl.
Following the transient seepage analysis, the resulting pore water pressure distributions were used in conducting the slope stability analysis using the limit equilibrium method. The stability analyses were performed under three distinct scenarios: without flooding, during flooding, and after flooding. The primary differences between these scenarios were the hydraulic boundary conditions and the interface strength properties. The interface strength parameters for each case were derived from respective experimental test results. For each scenario, the FS of the slope with and without wicking geotextile were computed and compared.
Results and Discussion
Interface Shear Strength
This section presents and discusses the results obtained from interface tests conducted on wicking geotextiles using a large-scale direct shear box. The interface shear strength parameters were computed and compared for all different scenarios discussed in the test methodology section. Figure 8a presents shear stress and displacement plots for soil and the soil–geotextile interface under different normal stress values under the no-flooding condition. The plots show that neither the soil–soil nor the soil–geotextile interfaces exhibited a clearly defined peak shear stress. Instead, there was a steep initial rise in shear strength followed by a gradual increase throughout the shearing process. Both the soil and soil–geotextile interface exhibited strain hardening behavior during shearing.
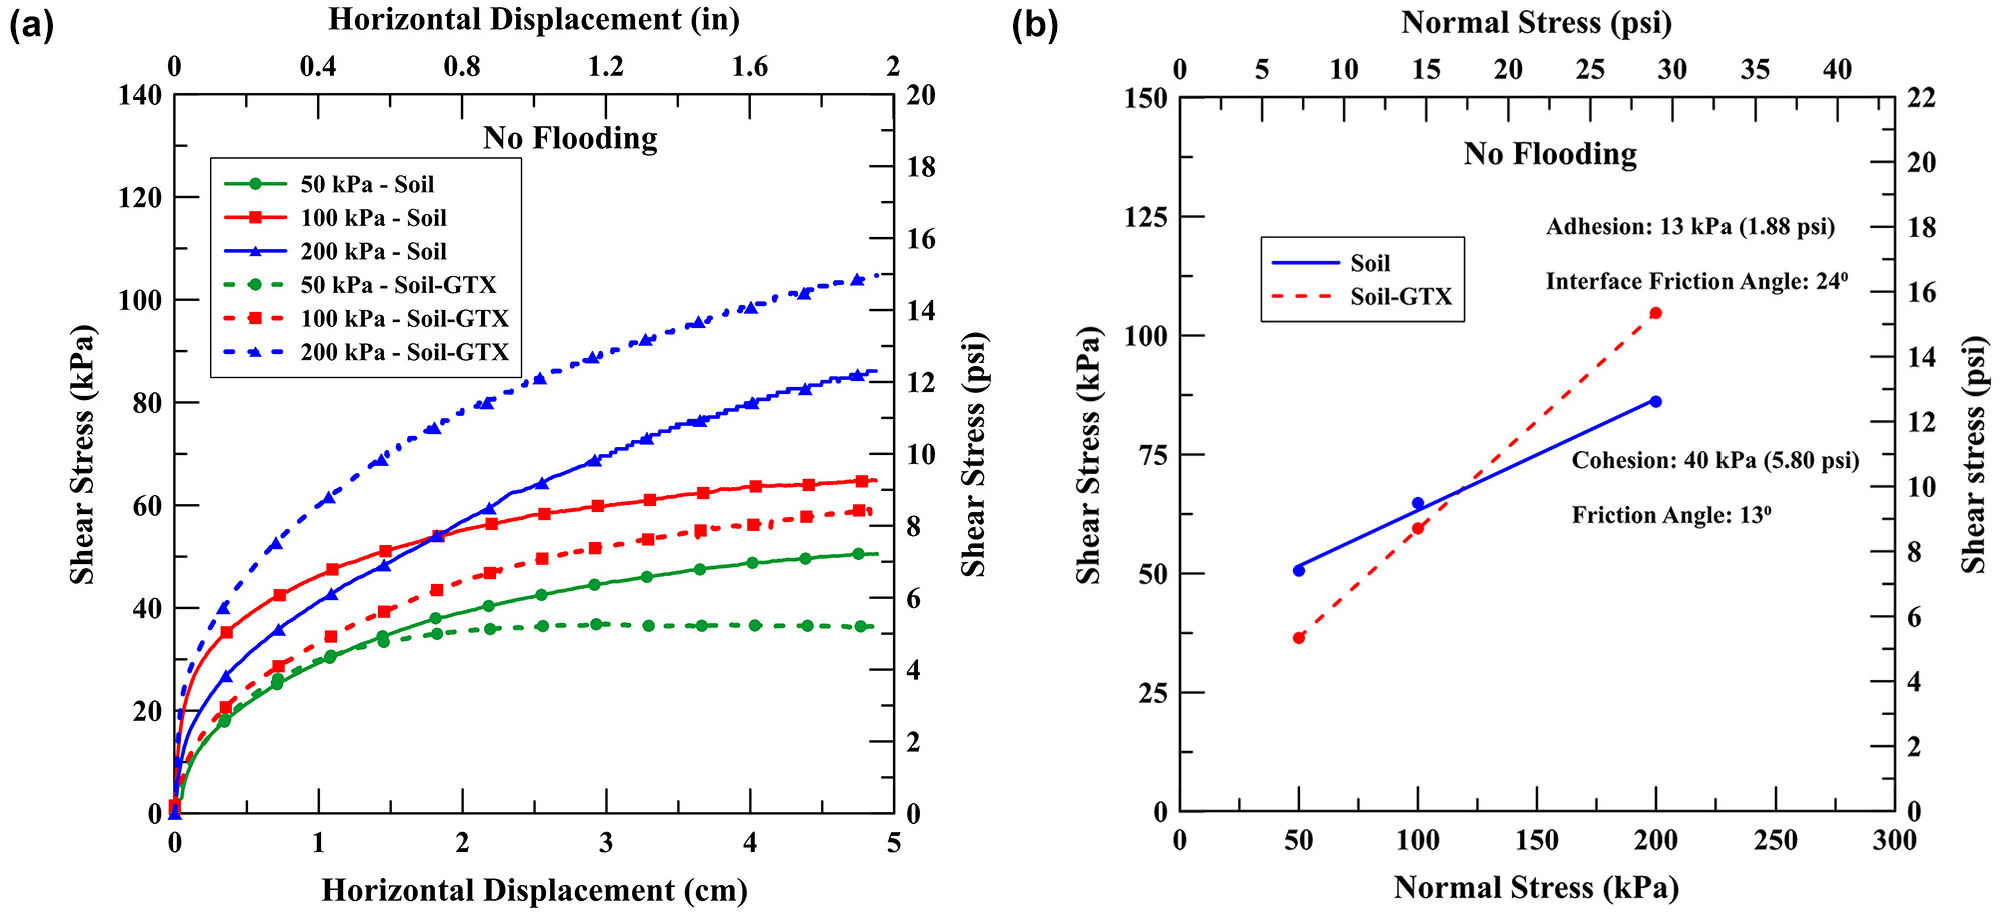
No-flooding condition: (a) Stress–displacement curves; and (b) interface shear strength parameters.
The interface shear strength of wicking geotextile was significantly higher than the internal shear strength of the soil, particularly at high normal stress values. This is attributed to the high interface friction angle of the wicking geotextile. The obtained shear stress values were plotted against corresponding normal stress values to determine cohesion/adhesion and friction angle of soil and soil–geotextile interface. A key observation from the plots in Figure 8b is the high interface friction and low adhesion of the soil–geotextile interface compared with the friction angle and cohesion of soil, respectively. The higher interface friction angle of the wicking geotextile is likely attributable interlocking caused by the presence of nylon wicking fibers with deep grooves. The visible indentation of the geotextile grooves on the soil after the test, as shown in Figure 9, a and b , suggests good interaction between the geotextile and soil during shearing.
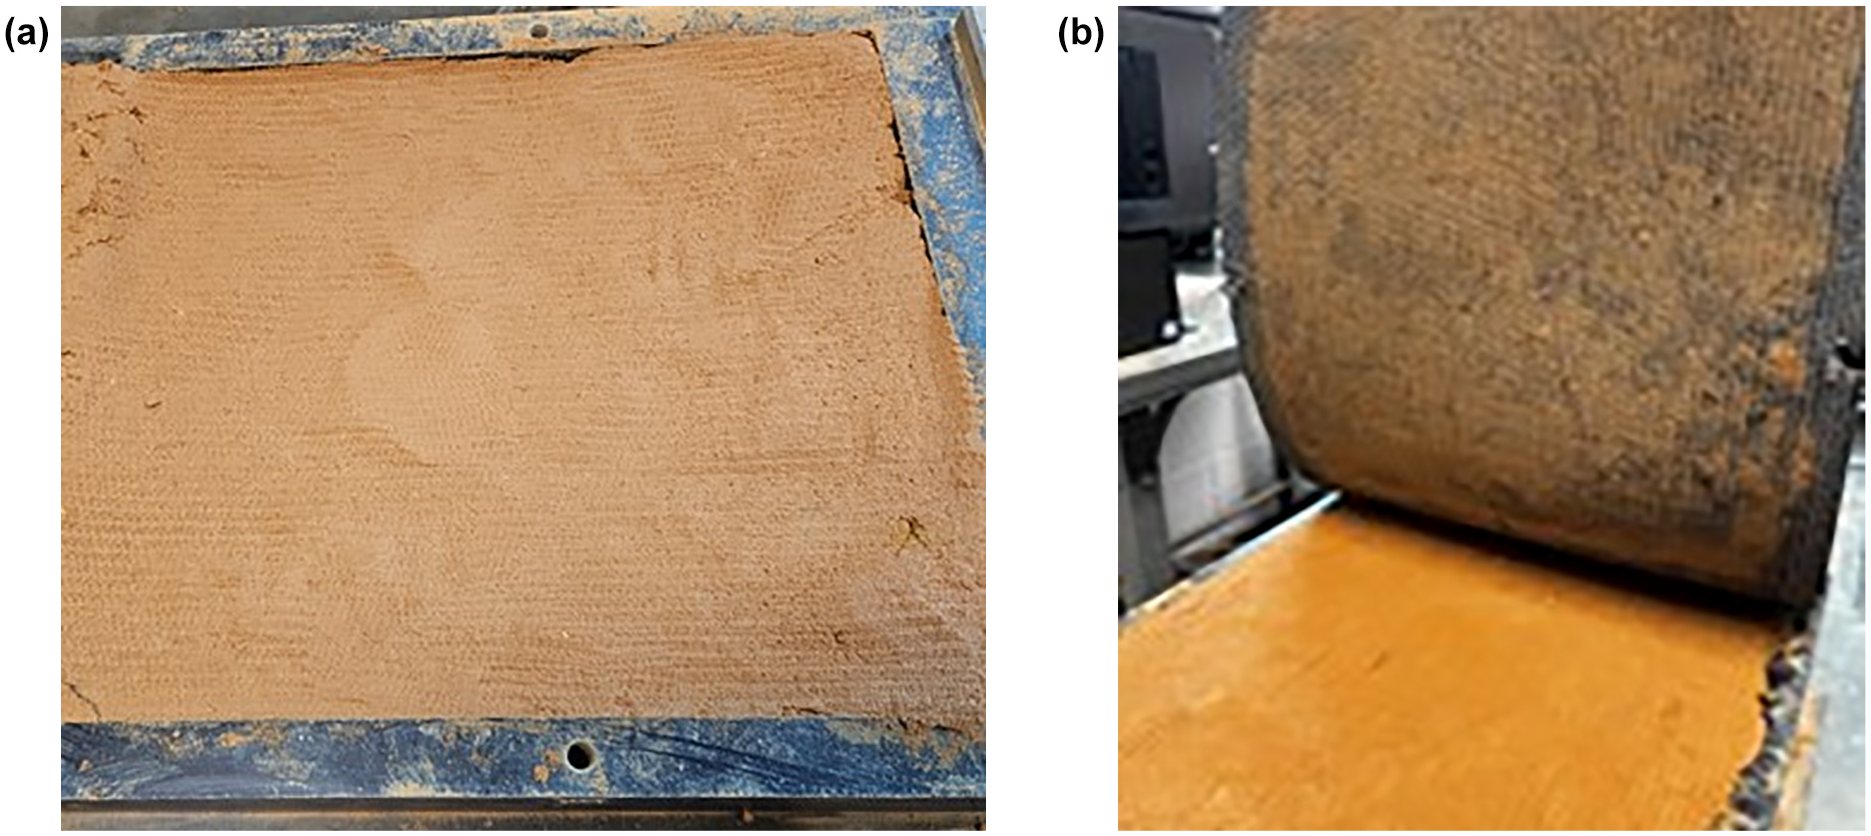
Soil and geotextile specimen after test: (a) Indentation of wicking channels on soil; and (b) soil trapped in the grooves of wicking geotextile.
The graph in Figure 10a illustrates the variation of shear strength for soil and soil–geotextile interface under the flooding condition at different normal stress values. The results showed a significant drop in the strength for both soil and soil–geotextile interface after flooding. Similar to the no-flooding condition, both the soil and soil–geotextile interfaces exhibited strain hardening without a well-defined peak shear stress. The initial rate of change of shear stress was lower under flooding conditions compared with the no-flooding condition. This suggests that the presence of water influences the initial stiffness of the soil and soil–geotextile interface. The interface strength parameters were determined from the plots shown in Figure 10b. It is quite clear that there was no noticeable change in the interface friction angle after flooding. However, both cohesion and adhesion have significantly decreased as a result of soil saturation. The loss of matric suction in the soil caused by flooding led to a reduction in cohesion/adhesion, and consequently, the shear strength of both the soil and the soil–geotextile interface decreased.
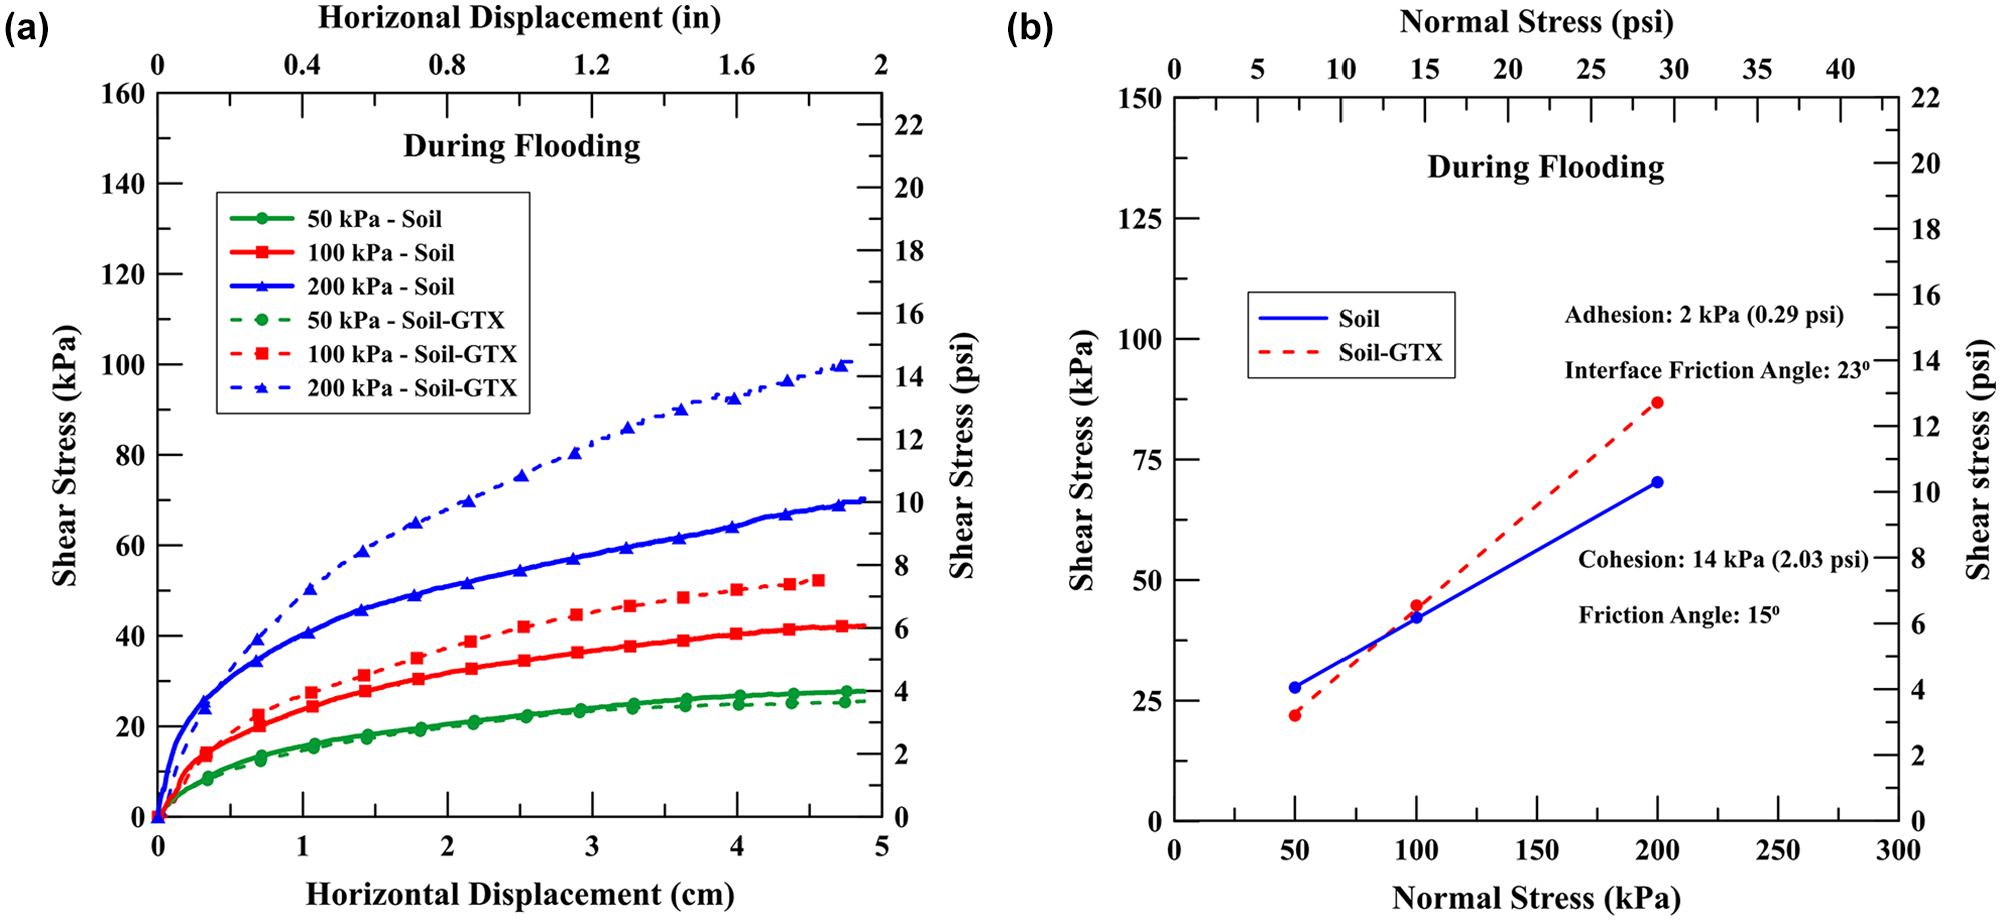
Flooding condition: (a) Stress–displacement curves; and (b) interface shear strength parameters.
In the after-flooding scenario, water was drained from saturated soil specimen through wicking geotextile for 7 days. The volumetric water content of soil with and without geotextile was measured using moisture probes. Figure 11, a and b, shows measured water content of soil with and without wicking geotextile over a period of 7 days under different normal stresses. The results demonstrated the effectiveness of the wicking geotextile in reducing the volumetric water content of soil over a period of time. Under all normal stress values, there was a noticeable reduction in volumetric water content for soil with the wicking geotextile. On the contrary, the soil specimen without wicking geotextile exhibited minimal change in water content over the period of 7 days. Furthermore, the drainage of water was found to be faster at low values of normal stress. This is because the in-plane permeability of the wicking geotextile decreases as normal stress increases.
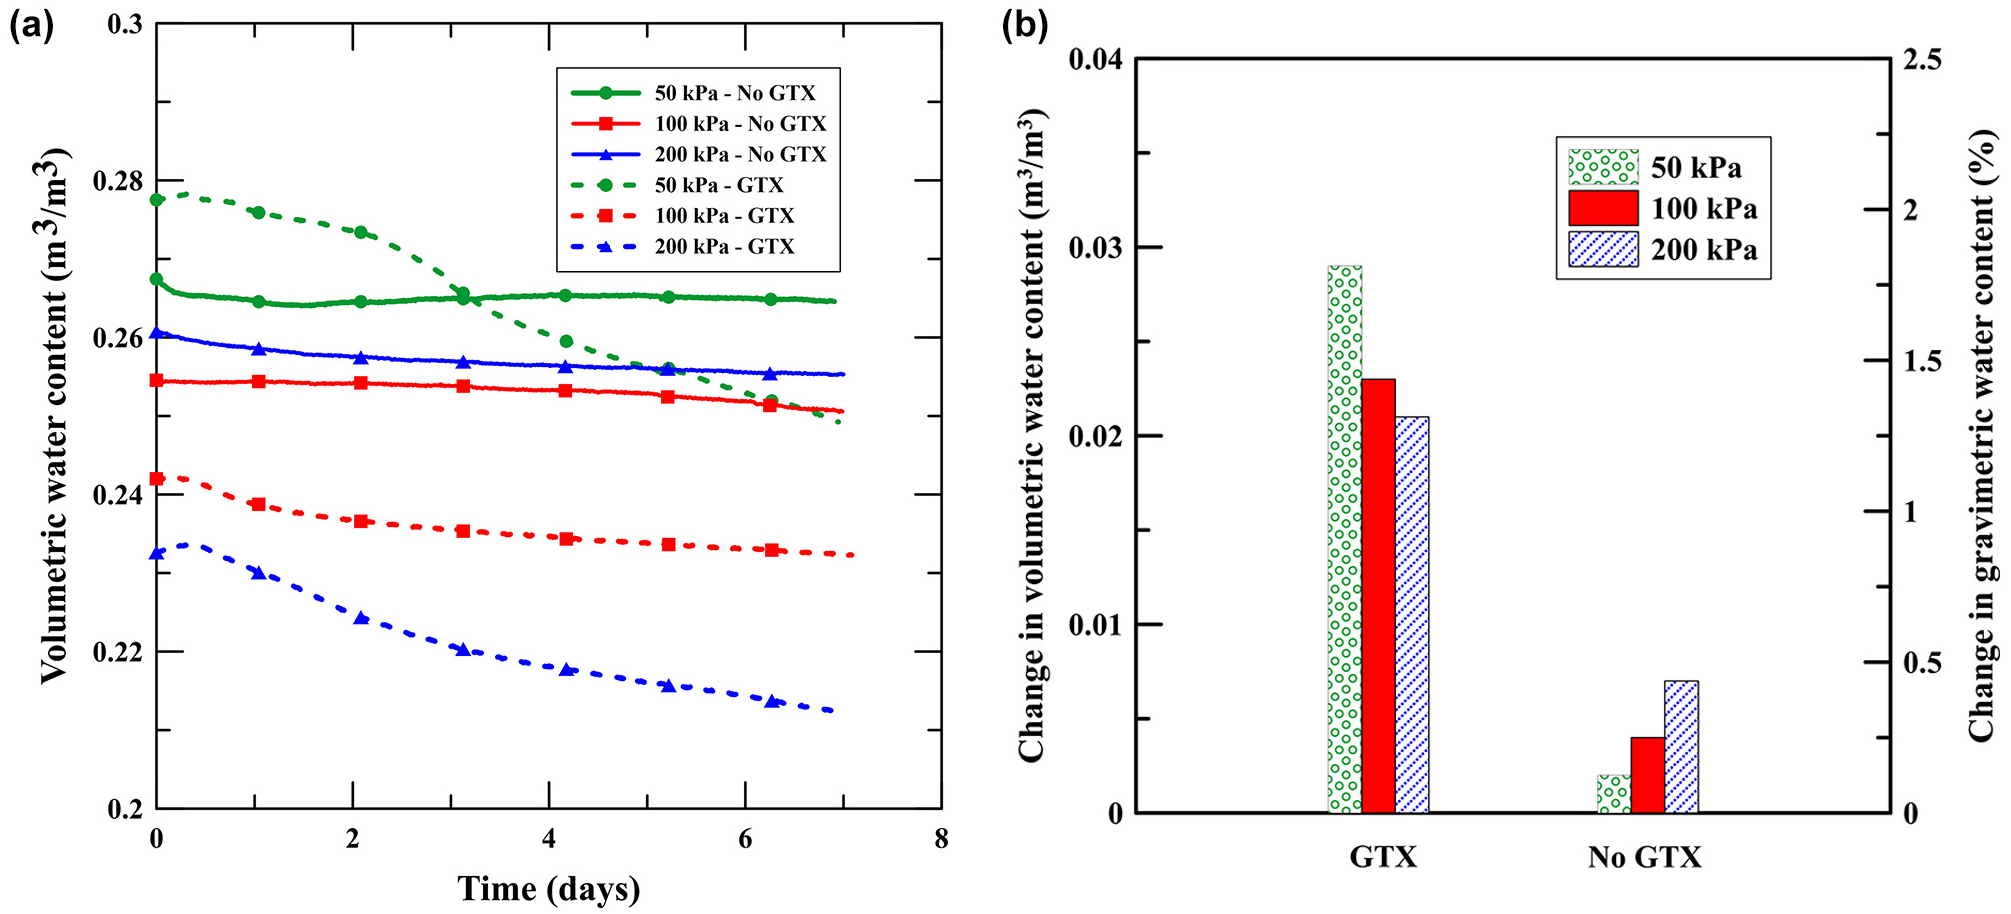
Effect of wicking geotextile on drainage: (a) Measured volumetric water content of soil; and (b) change in water content in soil over 7 days with and without wicking geotextile.
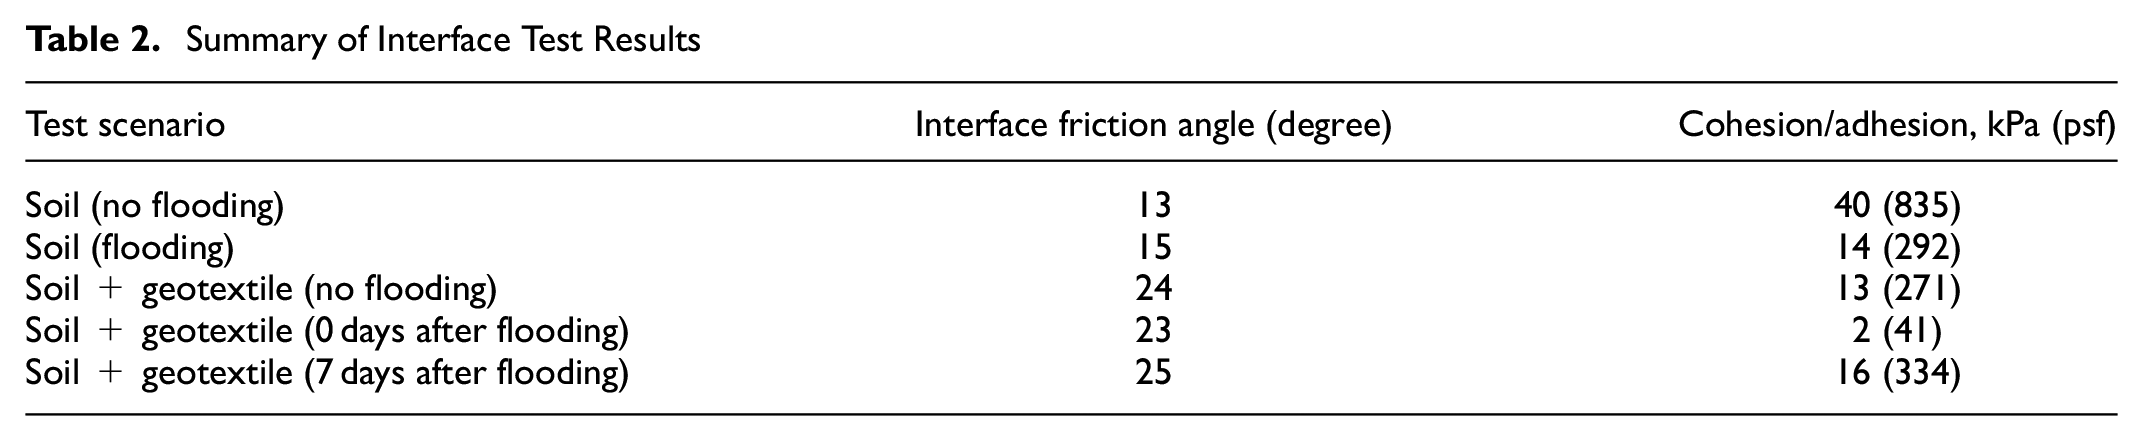
After 7 days of drainage, the specimens were subjected to shearing, and the resulting stress–displacement curves are presented in Figure 12a. The results of tests conducted under the flooding condition were also plotted in the same graph to understand the effect of wicking-induced drainage on stress–strain curves. The results clearly highlight an increase in shear strength of the soil–geotextile interface following 7 days of drainage. The effect was pronounced in the case test performed at 50 kPa normal stress. This is because the strength increase in this case is attributed to the rise in adhesion rather than to the strength resulting from the interface friction angle, which is dependent on normal stress. The results plotted in Figure 12b suggest that there was little change in interface friction angle as a result of drainage. Based on the results, adhesion increased from 2 kPa (0.3 psi) to 16 kPa (2.3 psi) after 7 days of drainage. As the soil desaturates, the air–water interface within the soil pores changes, resulting in higher matric suction. The increased matric suction enhances the bonding between soil particles, leading to greater adhesion at the soil–geotextile interface. All the test results obtained from interface test are summarized in Table 2.
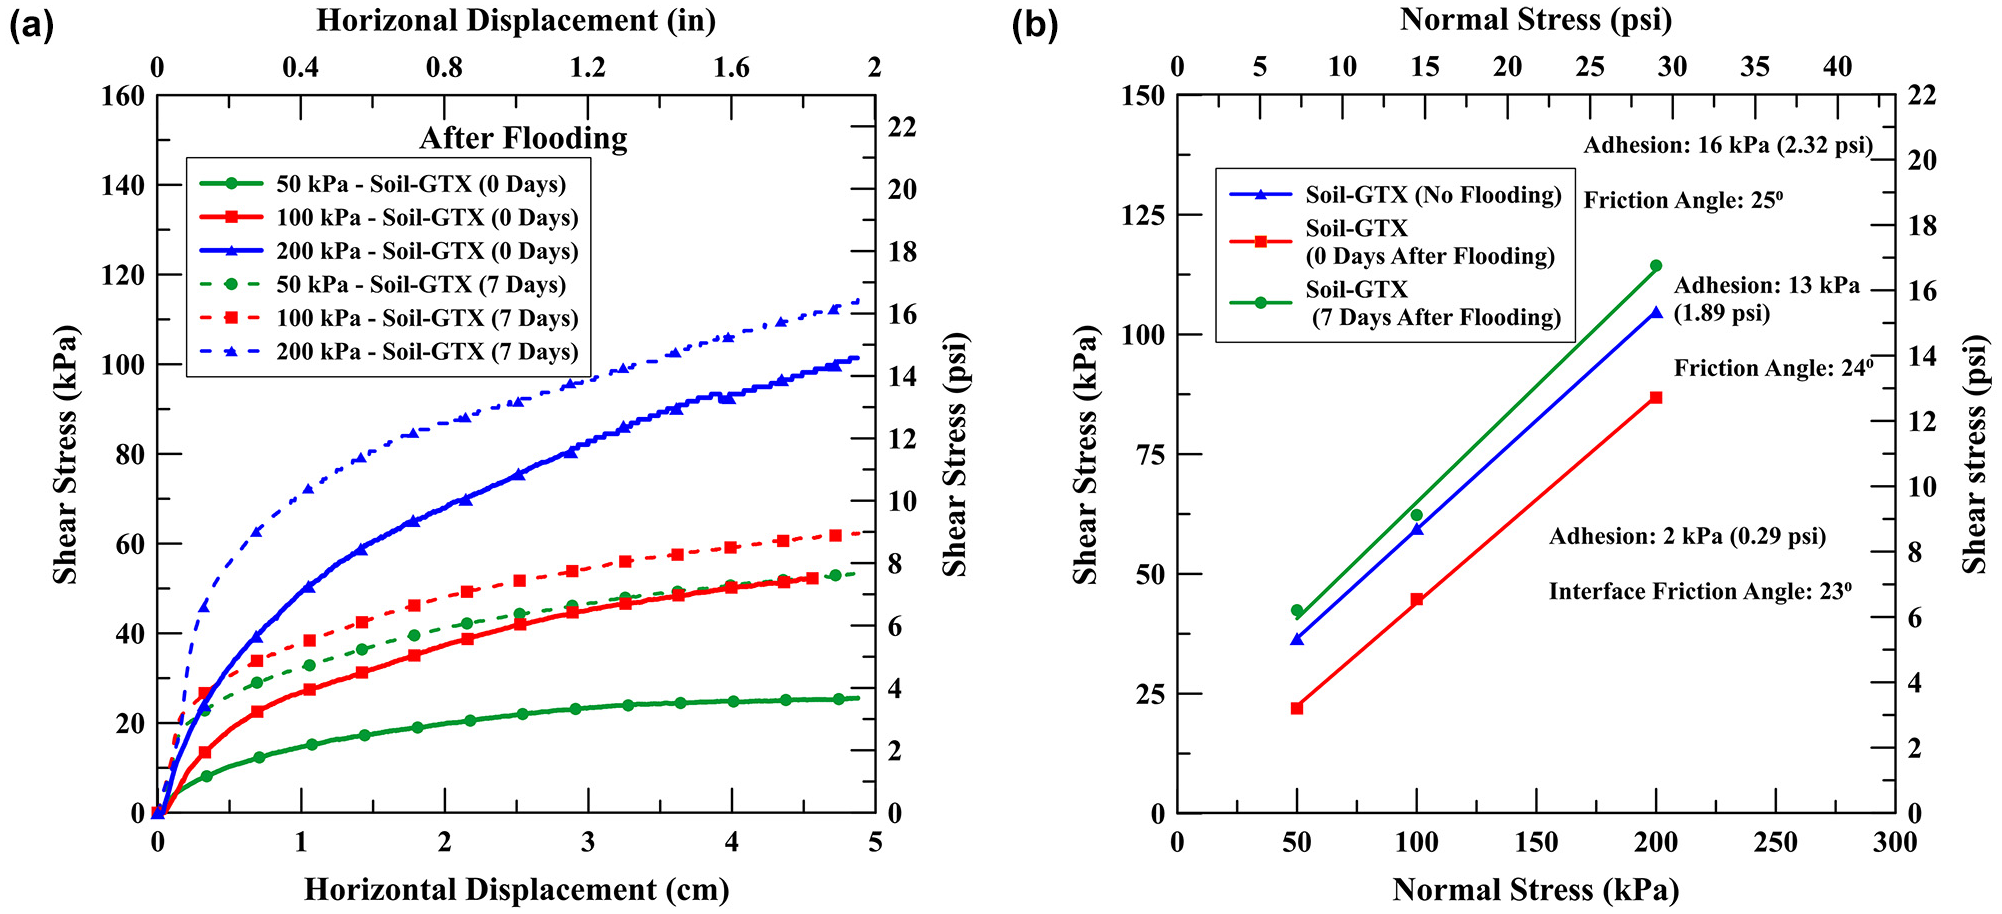
After-flooding condition: (a) Stress–displacement curves; and (b) interface shear strength parameters.
Summary of Interface Test Results
Although wicking-induced drainage may not significantly change the interface friction angle, its impact on adhesion through increased matric suction is notable. In practice, non-woven geotextiles are commonly used for drainage and woven geotextiles for reinforcement. Wicking geotextiles combine these functionalities through their unique structural properties. Conventional woven geotextiles are made up of polypropylene, which is hydrophobic, and the influence of its hydraulic properties on the reinforcing effect is often ignored ( 18 ). In the case of wicking geotextile, the nylon wicking fibers with deep grooves not only facilitate lateral drainage but also enhance soil–geotextile interaction. Unlike existing methods where drainage and reinforcement are achieved using separate materials, wicking geotextiles can potentially serve as a composite and cost-effective solution by integrating drainage and reinforcement in coastal highway embankments.
Slope Stability Analysis
The primary objective of the numerical modeling was to assess the impact of wicking geotextile on the drainage and stability of an embankment slope. Both seepage and slope stability analyses were performed on the slope model before, during, and after flooding conditions. Numerical results showed that the FS for the slope with and without geotextile reinforcement was nearly identical before flooding. The FS increased slightly from 4.4 to 4.6 with geotextile reinforcement, likely because of its high interface friction angle. During flooding, the water level was raised to the top surface of the embankment, allowing the entire soil mass to saturate after achieving steady-state seepage. Figure 13 shows pore water contours of the slope after steady-state analysis. The FS of the slope with geotextile dropped to 3.8, whereas without geotextile, it dropped to 3.5. This decrease was mainly a result of the reduction in cohesion and adhesion within the soil and at the soil–geotextile interface, caused by the loss of matric suction as the soil got saturated.
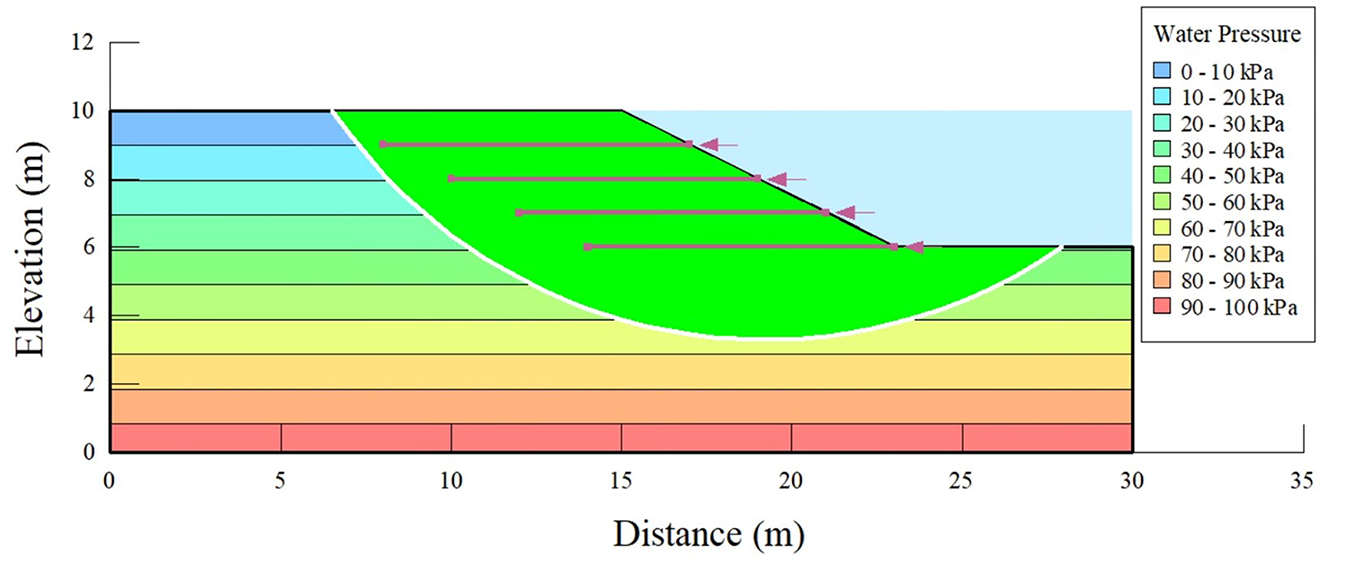
Location of slip surface in slope during flooding condition.
After the flooding, the water level dropped down to its original level in 4 days. During and after drawdown, water began to seep out from the slope body, leading to the desaturation of the soil. Figure 14 shows the contour of volumetric water content in the soil mass 4 days after flooding. The well-defined lateral water drainage channels along the geotextile are evident from water displacement vectors shown in the contours. The volumetric water content near the geotextile is significantly lower compared with the rest of the slope. This indicates that the geotextile effectively channels water laterally, promoting quicker desaturation of the adjacent soil. In the rest of the slope, where the geotextile’s influence is less pronounced, the soil retains a higher volumetric water content, suggesting slower drainage and desaturation processes. Figure 15 shows the temporal change of pore pressure at a point in slope with and without wicking geotextile. The pore water pressure was computed and compared at a point 0.5 m (1.5 ft) deep in the middle of the slope. The comparison clearly shows that the wicking geotextile accelerates the reduction of pore water pressure, leading to lower pressure values over time. This implies more efficient drainage and possibly better stabilization of the slope when the geotextile is used.
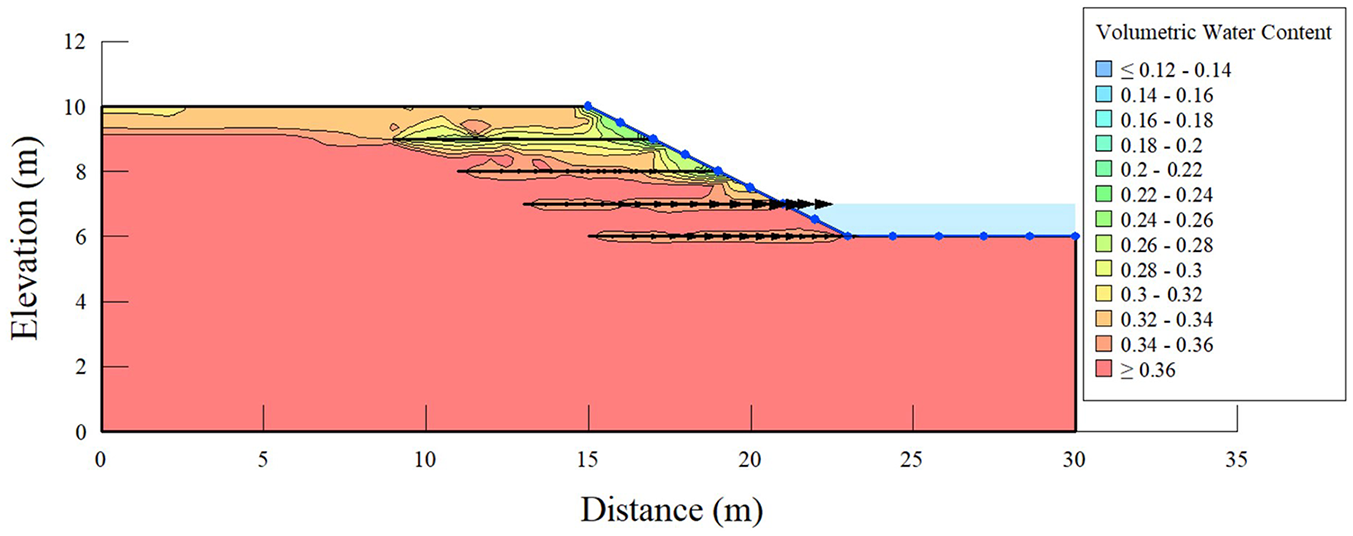
Volumetric water content contours of slope during drainage after flooding.
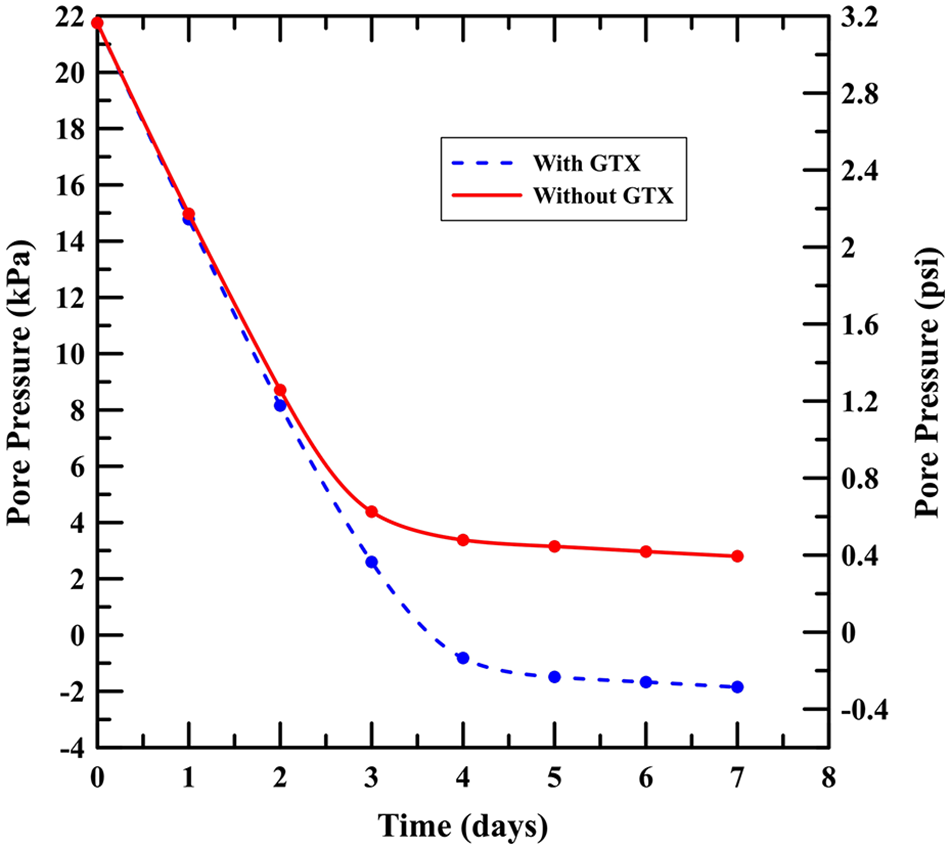
Pore water pressure with and without wicking geotextile.
To understand the drainage pattern of wicking geotextile in the slope, the changes in pore water pressure within the soil along the geotextile were computed. The values of pore water pressure, as shown in Figure 16, were calculated for the second layer of geotextile from the top over a period of time, specifically after 1, 3, and 7 days following flooding. The results indicated that there was no notable drop in pore water pressure of soil after 1 day. This is because the strip of soil mass under consideration was still partially submerged in water. The in-plane drainage attributable to the wicking geotextile depends on the difference in relative humidity. With almost similar relative humidities inside and outside the slope, there was not much drainage occurring after the first day. Over time, as the water level dropped, the relative humidity outside the slope decreased, and rate of drainage went up. After seven days, the pore pressure at the slope's face dropped to −10 kPa (−1.5 psi) from 13 kPa (1.75 psi).
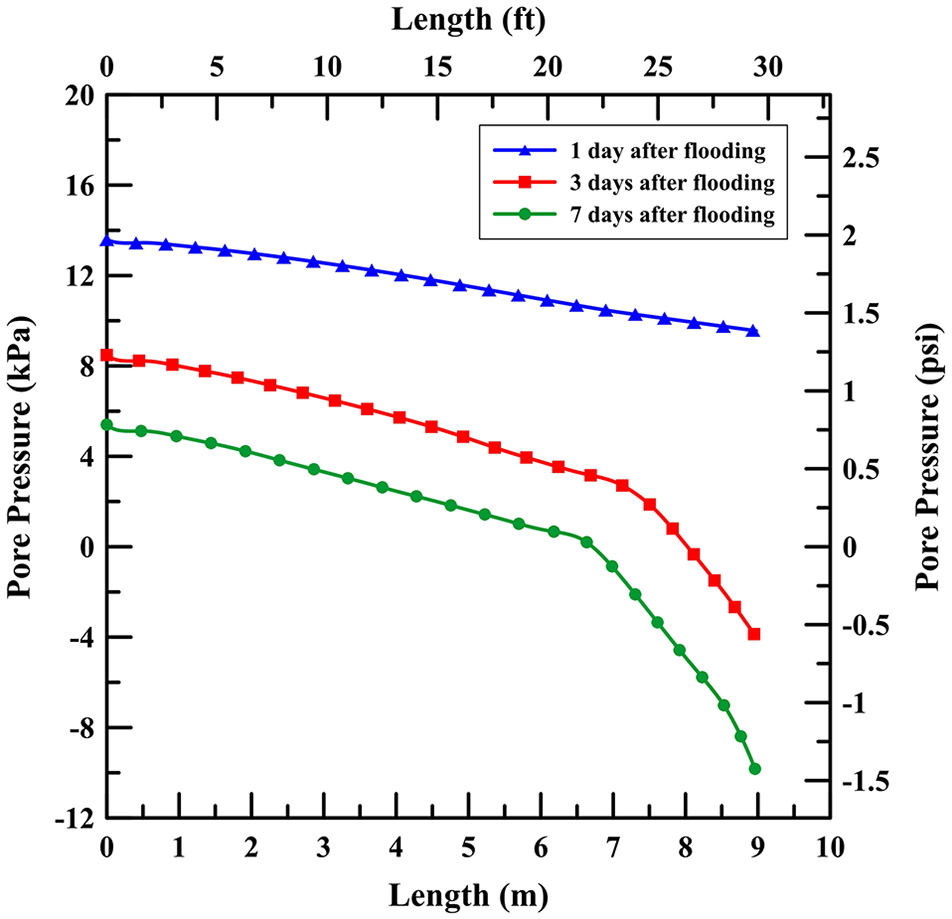
Pore water pressure along wicking geotextile.
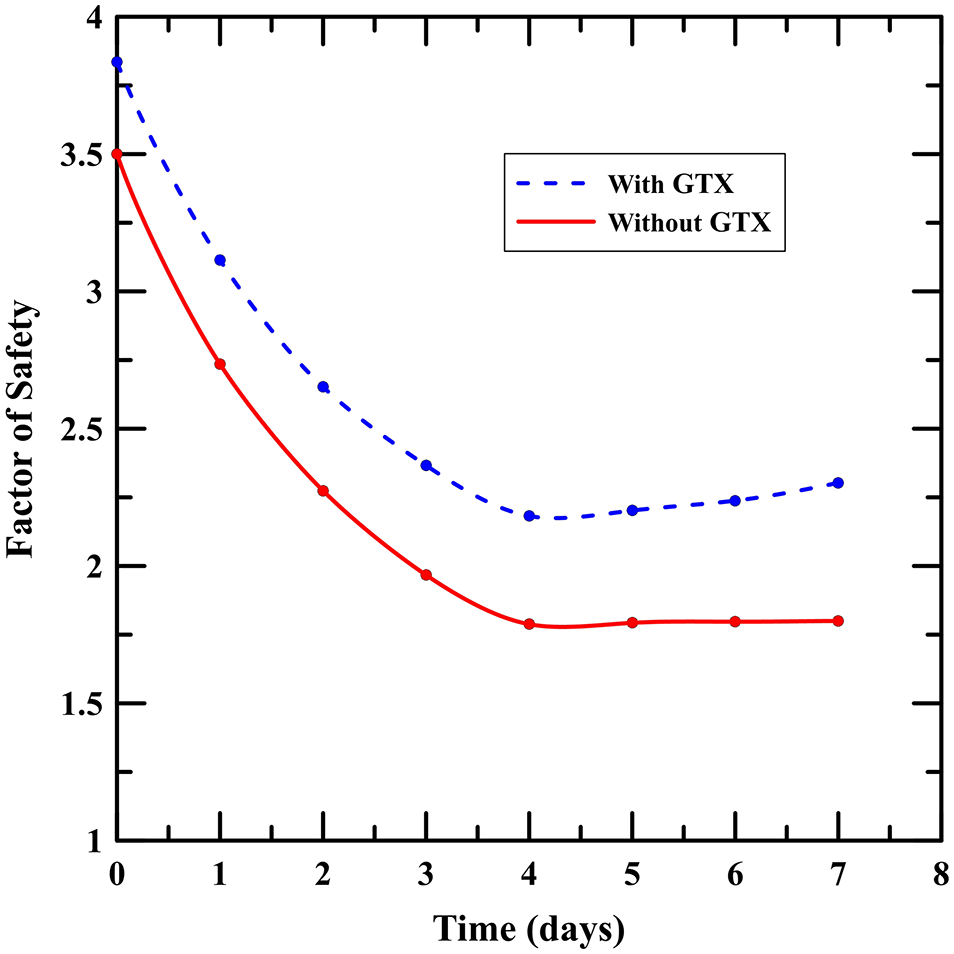
The most critical condition for an embankment slope is the drawdown phase after a flooding event. After the transient seepage analysis during the lowering of the water level, the FS for the slope was computed for the next 7 days. The plots in Figure 17 illustrate the FS of both unreinforced and reinforced slopes over time after a flooding event. As expected, the FS for the reinforced slope was found to be greater than the FS of unreinforced slope immediately after the flood. The high interface friction angle of the wicking geotextile resulted in higher strength and FS of the slope. It is important to note that a steady-state seepage analysis was carried out for the flooding, allowing the entire slope to saturate. This approach was used to assess the performance of the wicking geotextile in both fully and partially saturated soil. Consequently, the FS of the slope during flooding was slightly lower than before the flooding. Although the rise in water level tends to stabilize the slope by exerting additional weight, the reduction in effective stress resulting from soil saturation results in a decline of FS.
Factor of safety with time during drawdown.
Another significant observation from the results of stability analysis was the rate of decrease in the FS during the lowering of the water level after the flood. The plots in Figure 17 indicate that the reduction rate of the FS was lower in the slope with wicking geotextile. During the drawdown phase, the rate at which the FS drops depends on both the drawdown rate and rate of drainage from the slope. The relatively slower decrease in the FS in the reinforced slope is linked to the increase in effective stress resulting from soil’s desaturation. Wicking geotextiles facilitate drainage by inducing desaturation in the surrounding soil, which increases matric suction. This rise in matric suction enhances the soil’s effective cohesion and interface adhesion with the geotextile. As a result, even during drawdown phases following flooding, the increased matric suction helps maintain slope stability by reducing pore water pressures and reinforcing the soil–geotextile interface.
This is further evidenced by the pore water pressure plots in Figure 15, which show lower values in the slope model with wicking geotextile in contrast to the unreinforced slope model. In the present numerical study, water was lowered down over a period of 4 days. The results show a sudden decrease in the FS over the first 4 days, followed by a gradual increase because of dissipation of pore water pressure. The rate of increase in the FS was slightly greater for the slope with wicking geotextile compared with the unreinforced slope, because of the wicking of water from the slope. The gradual increase in the FS in the reinforced slope can also be attributed to an increase in adhesion attributable to the increase in matric suction because of desaturation. The bar chart in Figure 18 summarizes the FS values of both reinforced and unreinforced slopes for all different scenarios. By reducing pore water pressure through improved drainage and consequently increasing interface shear properties, wicking geotextiles contribute to higher safety factors for slopes, thereby mitigating risks associated with flooding.
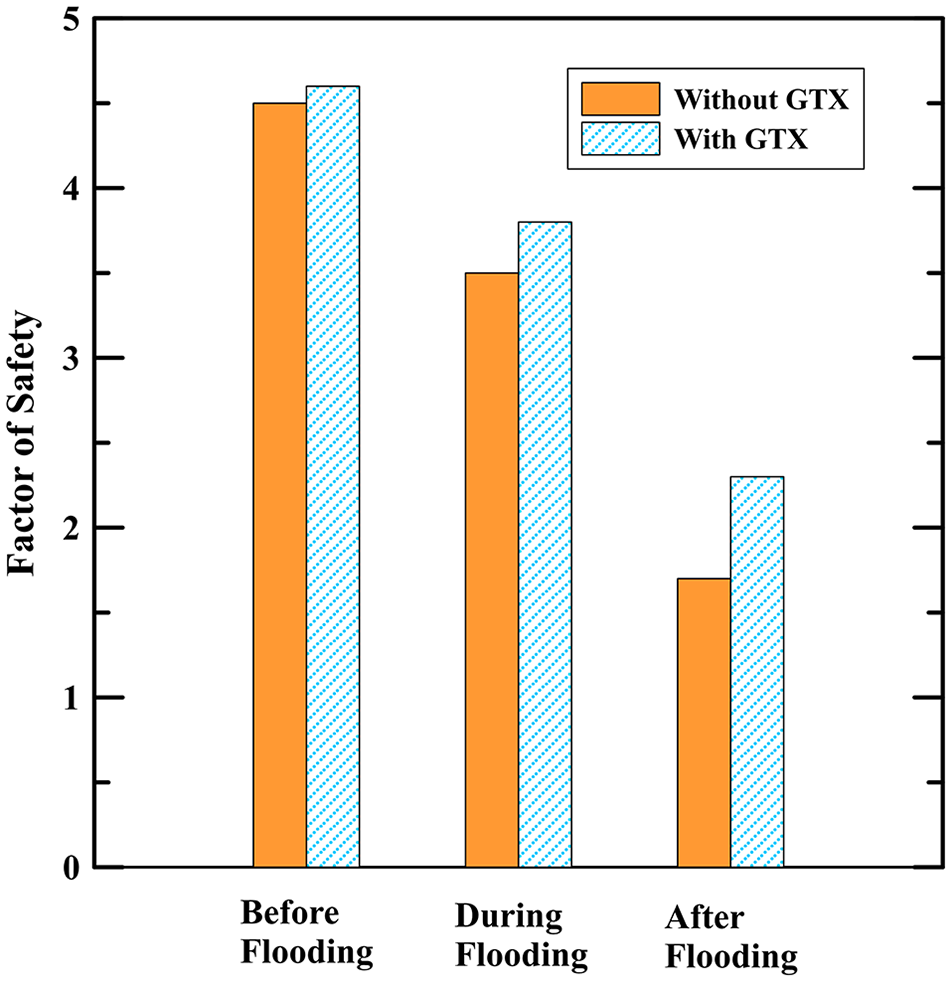
Safety factors of slope in different scenarios.
Summary and Conclusions
Wicking geotextiles have demonstrated their effectiveness in draining water from pavement bases in both fully and partially saturated conditions. Building on this proven capability, this research study evaluates the performance of wicking geotextile as a reinforcement and drainage element in coastal highway embankments. This assessment was carried out through comprehensive laboratory tests and numerical analyses to ensure a thorough understanding of its performance in practical applications. A large-scale direct shear box was utilized to perform interface tests between soil and soil, as well as soil and wicking geotextile, using a locally available silty clayey sand. Results obtained from these tests were then incorporated into a 2-D finite element model for detailed seepage and slope stability analysis. The numerical analysis focused on computing the safety factors for the reinforced slope during and after a flooding scenario. Both experimental and numerical results offered significant insights into the behavior of embankment slopes reinforced with wicking geotextile, particularly their stability and drainage efficiency under extreme weather conditions. The main conclusions of this study are outlined as follows.
Results from the interface tests demonstrated that the wicking geotextile possesses a higher interface friction angle and lower adhesion compared with the soil's friction angle and cohesion, respectively. The increased interface friction angle with the geotextile is attributed to better interaction created by the nylon wicking fibers with deep grooves.
During flooding, although the adhesion significantly decreased, the interface friction angle of the wicking geotextile remained unchanged. This consistency ensures high interface strength of wicking geotextiles even under flooding conditions.
Wicking-induced drainage significantly increases the adhesion of the soil–geotextile interface. This change in adhesion is attributed to an increase in matric suction caused by soil desaturation. Enhanced adhesion can potentially improve the stability of slopes during the drawdown phase after flooding.
The numerical results indicated that water was effectively drained by the wicking geotextile in the slope during drawdown. The higher in-plane hydraulic conductivity of the wicking geotextile created lateral drainage paths. Consequently, the water content of the soil mass surrounding the wicking geotextile layers was significantly lower than that of the rest of the slope.
Results from the stability analysis of the slope suggest that the wicking geotextile could increase the stability of slope during and after a flooding event. The rate of decrease of the FS of the geotextile-reinforced slope during drawdown after a flood event was found to be lower than the unreinforced slope. Typically, the lowering of water after flooding is not rapid and takes some time to reach a stable level. Drainage of water from the slope through a wicking geotextile during that time could significantly improve its stability during drawdown.
The understanding of performance of wicking geotextile in embankment slopes can be further expanded by conducting field-scale testing in varied soils under extreme weather scenarios. The integration of wicking geotextile with other reinforcement systems can also be explored. Furthermore, a comprehensive life-cycle cost analysis comparing wicking geotextiles with traditional drainage and reinforcement solutions will be required before its implementation.
Footnotes
Acknowledgements
The authors express sincere gratitude to Solmax for providing H2Ri wicking geotextile for the research.
Author Contributions
The authors confirm contribution to the paper as follows: study conception and design: Anand J. Puppala, Puneet Bhaskar, and Darlene Goehl; data collection: Jaime Suarez, Puneet Bhaskar, and Darlene Goehl; analysis and interpretation of results: Jaime Suarez, Puneet Bhaskar, and Darlene Goehl; draft manuscript preparation: Puneet Bhaskar, Jaime Suarez, and Anand J. Puppala. All authors reviewed the results and approved the final version of the manuscript.
Declaration of Conflicting Interests
The author(s) declared the following potential conflicts of interest with respect to the research, authorship, and/or publication of this article: Anand J. Puppala is a member of Transportation Research Record’s Editorial Board. All other authors declared no potential conflicts of interest with respect to the research, authorship, and/or publication of this article.
Funding
The author(s) disclosed receipt of the following financial support for the research, authorship, and/or publication of this article: The research presented in this article is from a project (CY1-TTI-02) funded by Southern Plains Transportation Center.