
Abstract
Mobility-on-demand (MoD) services have gathered increasing attention, and with automation reducing operational costs, their expansion is anticipated. The complex operation and user interactions inherent in MoD services present numerous challenges, highlighting the importance of thoroughly investigating their operational aspects. This paper focuses on a largely overlooked facet: the duration of pick-up and drop-off (PUDO) processes. From operator and user perspectives, we investigate how the magnitude of the average PUDO duration, its heterogeneity, and its stochasticity affect the service. Besides, we explore the potential benefits of predicting PUDO duration for each request compared to using an informed constant value, when inserting new requests into the fleet’s schedule. For this purpose, we simulated a fleet of shared autonomous vehicles operating in Munich, Germany, considering different demand levels, underlying PUDO duration distributions, and information levels by the operator. Our results reveal that modest changes in the mean duration significantly affect the performance of the service and that duration stochasticity substantially degrades the level of service (LoS), particularly for higher demand levels. For example, a duration increase from 30 to 60 s reduces served requests by 2.7%, while the presence of stochasticity increases late arrivals by 1.7%. Furthermore, we demonstrate that predicting each request’s PUDO duration or using the average duration from historical data improves the LoS. Our study highlights the need for more realistic approaches to account for the presence of stochasticity, its impact on LoS, and user behavior. We also suggest a more thorough consideration of PUDO duration in future MoD studies.
In recent years, shared mobility solutions, which offer users short-term access to transportation on an as-needed basis, have gained increasing attention in both research and practice. This form of mobility is expected to help reduce car dependency and, thereby, ownership and on-street parking demand, mitigate the environmental impacts of transportation, and complement public transit services. In addition, it aims to enhance transportation accessibility and provide economic benefits to users ( 1 ).
Shared mobility encompasses diverse transport modes and service options, such as car- and bike-sharing, car rental, and ride-sharing. In this study, we focus on a subgroup known, among other names, as mobility-on-demand (MoD) services. In these services, passengers can request a ride between two points (typically via a smartphone app) and are served—at least for part of the trip—by an unscheduled fleet. MoD services can be further classified into ride-hailing, if all requests are served individually, and ride-pooling, if multiple requests can be combined simultaneously in a ride.
Early research on MoD focused primarily on ride-hailing services, investigating both their operational aspects and impacts ( 2 , 3 ). Meanwhile, with the popularization of smartphones in the past decade, numerous ride-hailing platforms have emerged (such as Lyft, Uber, Grab, and Didi) and ride-hailing is nowadays an established solution available in many countries. Conversely, although ride-pooling services are currently limited to fewer countries and platforms and have low market penetration, they are gathering significant attention in research because of their demonstrated advantages in operational efficiency, emissions reduction, and minimizing externalities compared to ride-hailing ( 4 – 6 ). In the remainder of this paper, unless otherwise explicitly stated, we restrict our analysis to ride-pooling services.
It is expected that with the advent of automation and the resulting reduction in operational costs, autonomous MoD (AMoD) services—both hailing and pooling—will experience a significant expansion ( 7 , 8 ). Thus, as AMoD services transition from theoretical or experimental setups to real, widely implemented solutions, there is a growing need to examine various operational aspects more realistically, for example, the selection of pick-up and drop-off (PUDO) locations ( 9 ), the aggregation of multiple requests to the same PUDO process ( 10 ), and the stochasticity of travel times ( 11 ).
PUDO processes are central to the operation of MoD services, marking the transition point for users between modes—typically from walking to a MoD vehicle—and between urban and transport infrastructure—such as the sidewalk or curbside and the vehicle. These processes are inherently complex and present challenges across multiple dimensions. For example, from a driving perspective, the vehicle (whether human-driven or autonomous) must maneuver out of traffic to reach the designated stop, ensuring the safety of passengers and other traffic participants ( 12 ). From the operational perspective of the service, the specific location where the PUDOs take place has recently gathered growing attention in research. In comparison to traditional door-to-door operation, multiple studies have demonstrated that asking passengers to walk short distances to pre-defined boarding/alighting locations (in some cases to serve multiple requests simultaneously) can significantly reduce externalities (vehicle-km traveled, noise, etc.) and increase fleet utilization, with limited inconvenience for the users ( 13 – 16 ).
In this study, we focus on a largely overlooked attribute of PUDO processes: the impact of their duration (and variability) on system performance and level of service (LoS). The vast majority of the publications studying the operation of MoD services have considered a deterministic duration of these processes. The value employed was often arbitrary, typically ranging between 30 s and 2 min, depending on the service type ( 17 – 19 ), and constant for all requests. However, in real life, the duration of PUDO processes is unlikely to be the same across all users and circumstances, and it might be influenced by factors such as the age of the user, her experience with the service, the location of the stop, the need to access the trunk to place luggage, the number of people boarding the vehicle, and whether it is a boarding or alighting process.
Some simulation studies have accounted for different values of PUDO duration, constant across all requests. As expected, they observed that increasing the duration leads to poorer operational performance of the fleet, which is intuitive, as the vehicles remain blocked for a longer period (
19
,
20
). However, to the best of our knowledge, there are no studies considering heterogeneous and/or stochastic PUDO duration, nor investigating in depth the operational and LoS impacts of the mismatching between the real duration of the processes (
We only know of two studies that accounted for the duration variability in the MoD stop processes ( 22 , 23 ), but their focus was on understanding the impacts of late shows (i.e., the late arrival of the passengers at the pick-up location). Both studies considered that the total pick-up time of a request was the sum of a deterministic boarding time (constant for all individuals) and, for a given share of the passengers, an additional stochastic delay. Although there is a certain overlap with the concept of PUDO duration discussed in this paper, we believe the duration variability introduced by late shows is not equivalent to that of the boarding/alighting process. Firstly, late show variability affects only boarding processes, not alighting ones. Secondly, we argue—similar to Hyland and Mahmassani ( 22 ) and Kucharski et al. ( 23 )—that late shows could be avoided or disincentivized (e.g., an operator could decide not to wait and still charge the service fee, as a regular public transport vehicle would do). In contrast, charging users for the boarding/alighting time—unless unreasonably long—could be controversial and even discriminatory (with respect to age, mobility impairment, etc.).
One might still question whether relatively short PUDO processes (typically under a minute) produce a significant effect over the duration of a trip, and whether the effect of the PUDO stochasticity is relevant in comparison to that of travel time stochasticity (emerging from congestion, traffic intersection control, etc.). With respect to the first point, while it is true that MoD services (i) are not line-based, making delay propagation less straightforward, (ii) vehicles often idle between trips, effectively “resetting” accumulated delays, and (iii) dwelling times are typically shorter than those of buses or trams, mismatches between actual and planned stop durations can still lead to operational inefficiencies and negative impacts. We show two possible examples in Figure 1. In Figure 1a, the operator under-estimated the duration of the PUDO processes when assigning requests to a vehicle, leading to the propagation of delays. This would degrade the LoS for the passenger and potentially lead to the cancellation of the request. In the case shown in Figure 1b, the operator over-estimated the duration of the PUDO processes and rejected a request because of the violation of its temporal constraints, although this passenger could have been satisfactorily served in reality. This would lead to the under-utilization of the fleet and unserved demand. With respect to the second point—the potential impacts of travel time stochasticity—we acknowledge that this aspect remains underexplored in the literature ( 11 ). However, (i) our study aimed to isolate the effects of stochastic PUDO processes and (ii) we expect travel time stochasticity to become less relevant in a future with connected and autonomous vehicles, as improved real-time network-state information and advanced intersection control would mitigate its effects ( 24 – 26 ). Conversely, even in such a futuristic scenario, PUDO processes will always involve a human component, meaning their associated duration variability will persist.
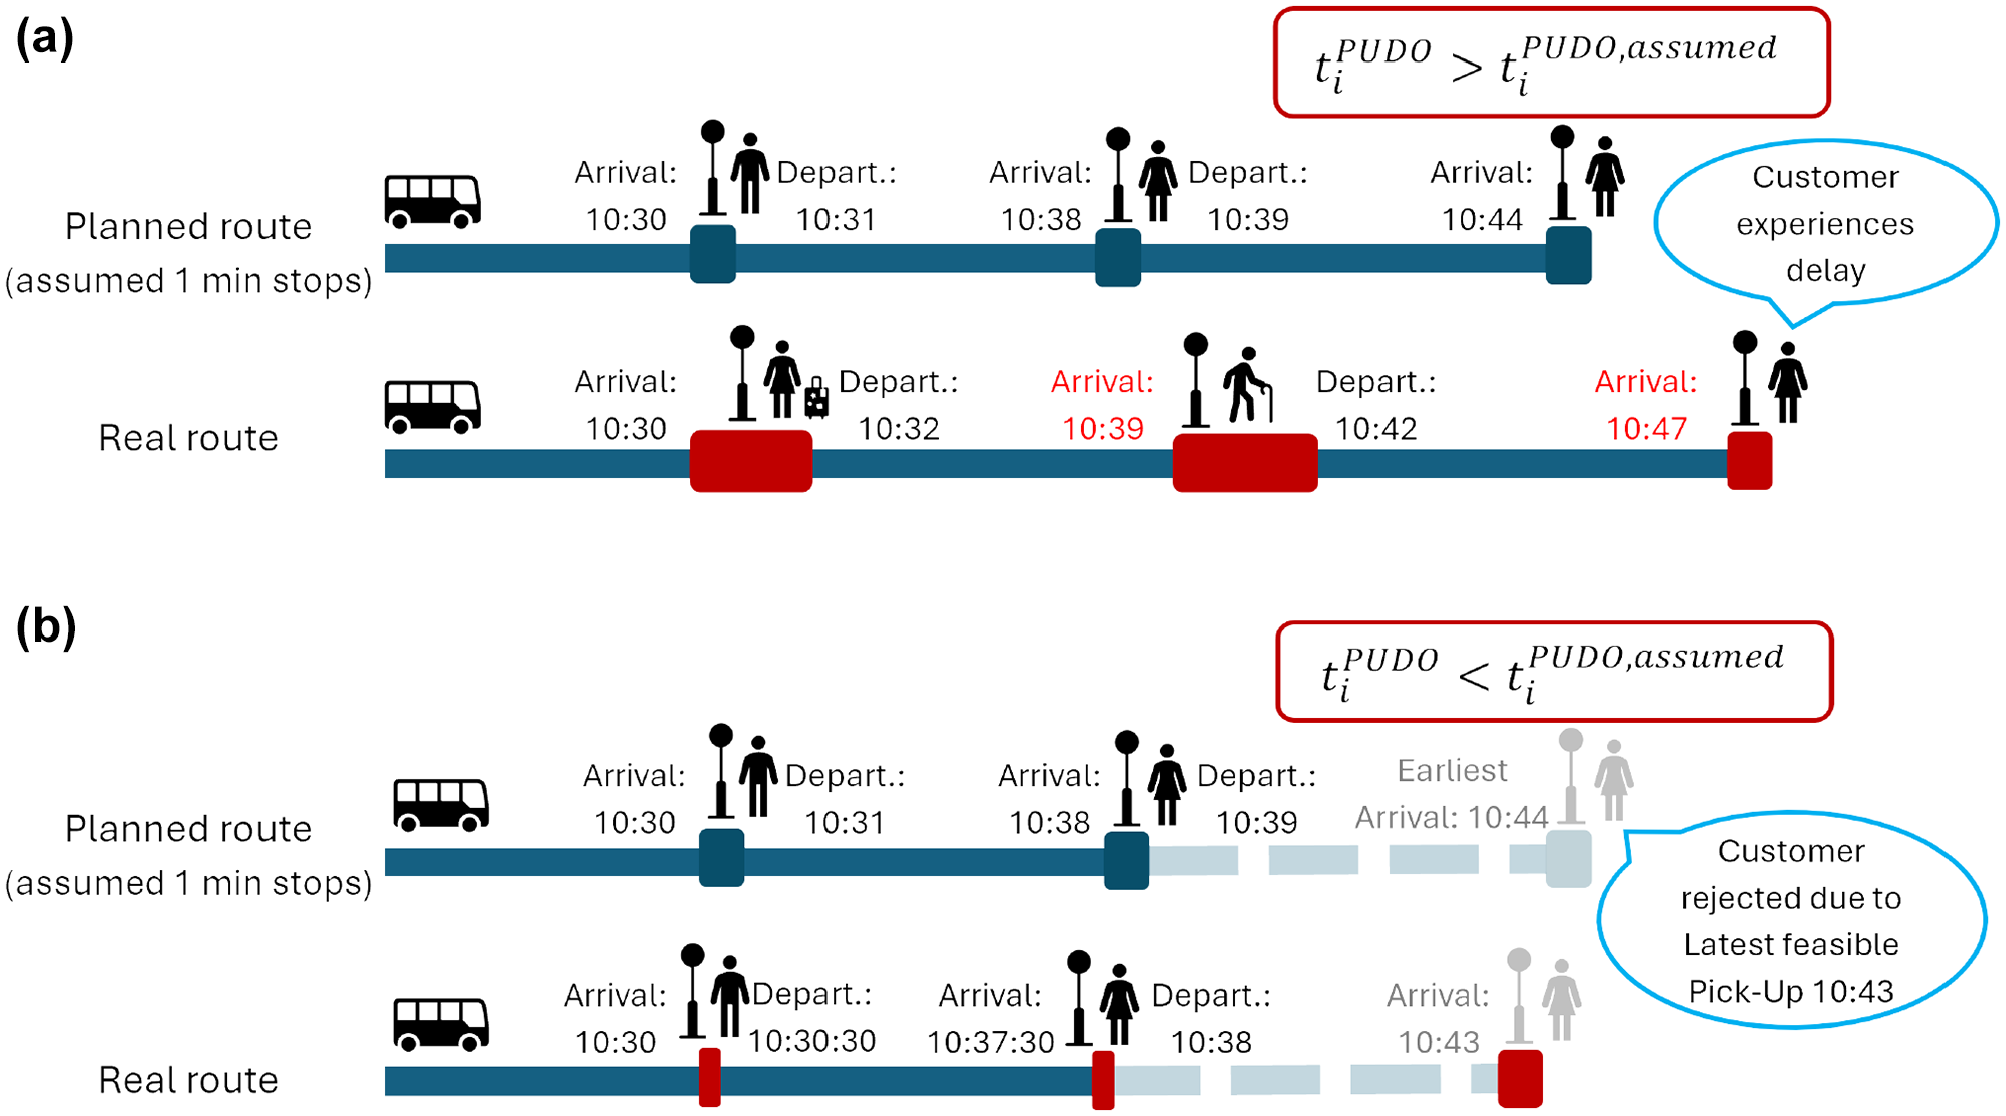
Possible effect of the mismatching between real and assumed pick-up and drop-off (PUDO) durations. (a) Example of a route planned considering insufficient PUDO duration. (b) Example of a route planned considering excessive PUDO duration.
In the remainder of this paper, we present the methodology and results of a simulation study that seeks to isolate and analyze the effects of heterogeneous and stochastic PUDO duration processes in a ride-pooling MoD service. Specifically, we aim to determine whether stop duration stochasticity degrades service performance, whether operators could benefit from predicting the duration of each stop (e.g., using data-driven models that combine information from user characteristics, historical data, etc.), or if simply using a constant value derived from the actual stop duration distribution—rather than an arbitrary value, as is typical in research and practice—would be a more effective approach. To this end, we first present the data, tools, and underlying fleet control mechanisms employed. Then, we introduce the experimental design, followed by the main results and discussion. We conclude with a brief discussion of the limitations and future relevant research directions.
Methodology
PUDO Duration Generation
One of the challenges when considering the impacts of PUDO duration on the operation of MoD services—and perhaps also the reason why this aspect is often overlooked—is the lack of high-quality empirical data in this regard. Even though there are popular trip demand datasets relevant to MoD studies (e.g., the New York City taxicab dataset and the Chicago taxi and ride-sharing datasets) there are, to our knowledge, no publicly accessible datasets that report the duration of individual stops with a fine temporal granularity. Indeed, the most representative source of empirical PUDO duration data we are aware of is Machado-León et al. ( 27 ), which reports PUDO duration descriptive statistics and fit parametric cumulative distribution functions based on several thousand observed PUDO processes in Seattle, U.S.A., but does not disclose the duration of individual stops.
To overcome this apparent lack of available PUDO duration data, we decided to generate synthetic duration data by drawing from one of the parametric distribution functions reported by Machado-León et al. ( 27 ). Specifically, we used a log-normal distribution function, which the authors stated fit the data adequately. The probability density function (pdf) of a log-normal distribution is given by the following:
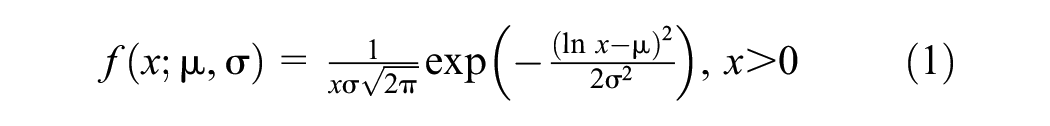
where
Importantly, Machado-León et al. (
27
) fitted a single distribution to both PUDO observations instead of using separate distributions, even though their findings indicated that pick-up processes generally involve longer stop times. The reported log-normal distribution had parameters
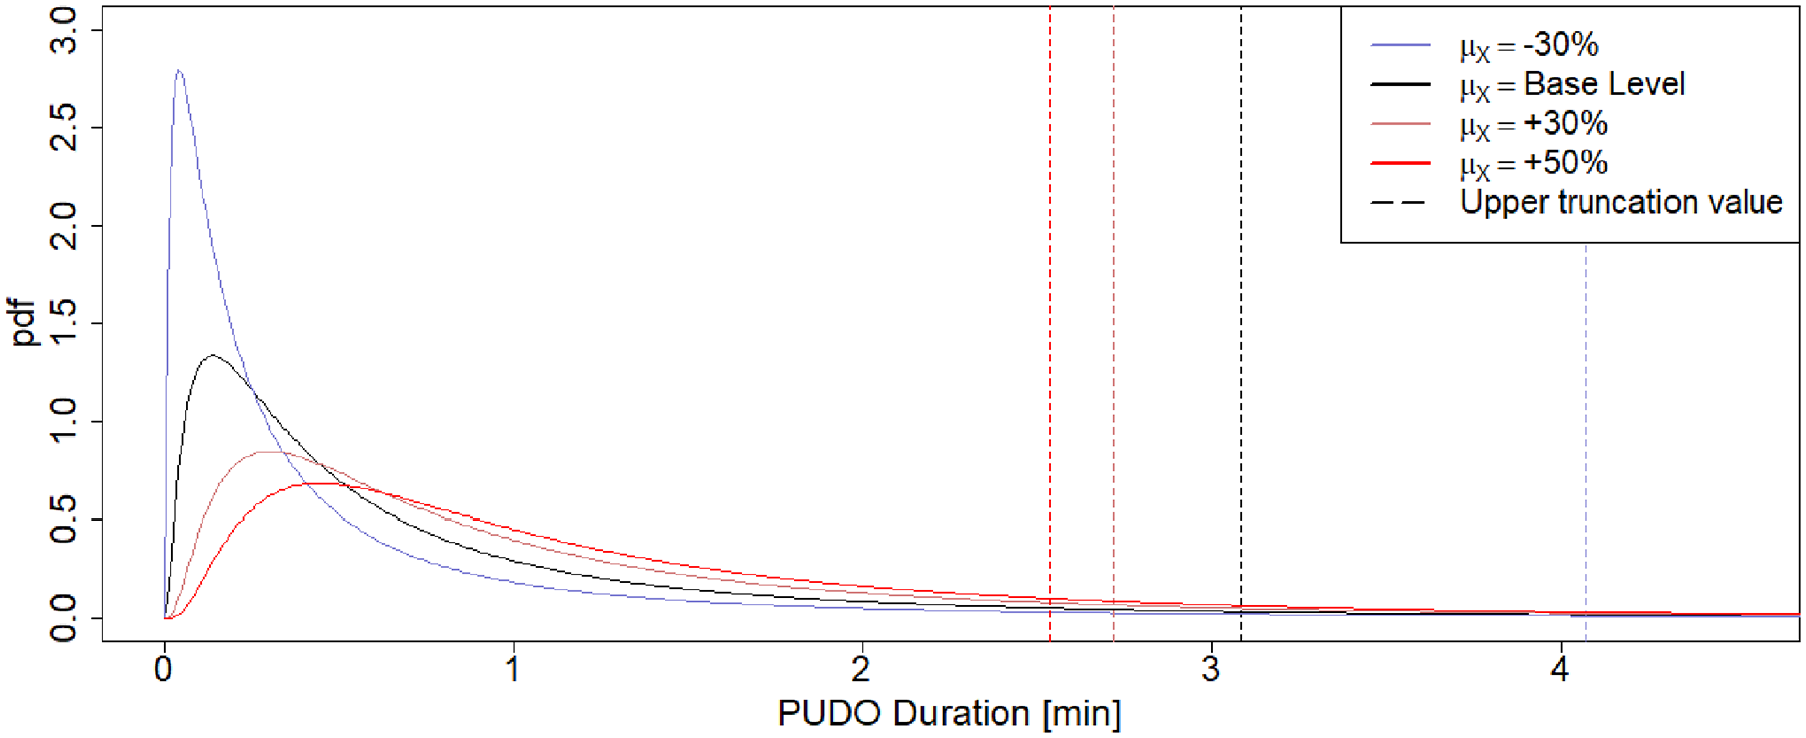
Probability density functions (pdfs) of log-normal distributions with pivoting mean and constant variance.
Black Box Prediction Model
As previously mentioned, one of the questions we aim to answer in this study is whether it would be beneficial for the operators to predict the duration of each specific request using some type of data-driven model—for example, a neural network regression model—that combines information from the user characteristics, historical data of previous trips by the user, type of stop location, and so forth. Thus, this request-specific duration would be used when planning possible vehicle tours (including stops and, thereby, stop duration).
Unfortunately, while some MoD operators likely possess the necessary data to train such a model, it is not publicly available. Therefore, to overcome this issue, in our simulation study we have considered that the operator has a “black box prediction model.” This model—no matter how it may be built and which input data it requires—predicts the duration of a request

Importantly, to make the black box model as realistic as possible, we assumed that the operator would not deploy a model that predicts a value outside of the solution space, which in our case is defined by the upper and lower truncation values in the PUDO duration generation process described in the previous section. Thus, when the predicted value is outside of this range, the truncation value is instead assigned to the prediction.
MoD Simulation Tool—FleetPy
We use the open source simulation framework FleetPy to simulate a MoD provider, more specifically its interactions with customers, its fleet control planning, and the service of the customers. This section will give a brief overview of the most important features for the simulation. We refer the reader to Engelhardt et al. ( 28 ) for further details.
FleetPy has multiple ways of modeling the interaction with customers; in this study, customers make an app request containing their latest pick-up time and their maximum in-vehicle time. The operator can respond to a request with an offer, which in the employed setup is always accepted by the customer if it satisfies her temporal constraints, or a rejection, when her requirements cannot be met. The initial offer provided by the operator to the user contains, among other attributes, the boarding time and location, alighting time and location, and service charge.
The MoD operator batches requests for a specific amount of time before trying to optimize the vehicle–user assignment globally with the primary objective to serve as many customers as possible while minimizing the system time, that is, the amount of time all vehicles have to drive to serve these customers. In this process, previously assigned requests are guaranteed to be assigned again—but possibly to another vehicle—whereas new requests might be rejected because the time constraints cannot be met. These rejected requests leave the system at this time.
The FleetPy simulation framework is structured to separate fleet control and simulation. At the end of a fleet control step, a vehicle plan containing the next stops of a vehicle is handed to the simulation; this vehicle will drive in the simulated street network to the next stop; there, the boarding/alighting of customers is simulated.
Even though in most studies the operator uses the exact same travel time and PUDO information as the simulation to control the fleet, it is possible to use different information. While PUDO duration usually is a single scenario input parameter, this study extended the simulation framework to handle different PUDO duration values for boarding and alighting. Moreover, the framework was modified to deny the operator access to the simulated boarding time: it only has access to a prediction. Both for the simulation and fleet control, in those situations in which multiple requests board or alight simultaneously, the maximum relevant boarding/alighting duration of these requests is considered.
We want to highlight that a solution from a previous time step is guaranteed to remain feasible if the simulation of the system is according to the fleet control plan. However, with stochasticity in the system, delays compared to the original plan may become apparent from one optimization step to the next. It might be possible to salvage infeasible customer constraints by reassigning these customers; however, it is also possible that no feasible solution can be found anymore. This problem was also addressed (for the case of stochastic travel times) by Wolf et al. ( 11 ). In their proposed approach, the vehicle currently containing the request for which no feasible solution can be found “locks” its current plan and does not allow any further reassignments. The idea is to avoid further delays and to serve the respective customers as quickly as is still possible.
Case Study, Demand Data, Experimental Design, and Simulation Setup
Case Study and Demand Data
We simulate the operation of a MoD service within the boundaries of the municipality of Munich, Germany. The network consists of over 19,000 nodes and 40,000 edges in which the travel times for each edge, extracted from a traffic micro-simulation model ( 18 ), are updated every hour. To reduce the running time per simulation, we employ preprocessed travel times tables that were generated and stored beforehand and contain the travel times and shortest routes between some of the network nodes ( 28 ).
For the MoD service demand, we utilized the total private vehicle trip demand in Munich, from Dandl et al. ( 18 ), and sampled various fractions of it (see the next section for more details). We focused exclusively on private vehicle trips rather than the full modal demand in Munich because the private vehicle data was available at a finer spatial and temporal granularity. In practice, the spatial distribution of MoD service demand is likely to differ from that of private transport trips. However, trying to estimate the “actual” spatial demand for Munich without real-world data is challenging. As Tirachini ( 29 ) discusses, there is no clear, generalizable relationship between factors such as income and car ownership and the frequency of ride-hailing use. Indeed, cities worldwide have shown opposite trends in this regard ( 30 , 31 ). Consequently, we deemed testing alternative spatial demand patterns beyond the scope of this study. Nevertheless, in the conclusion section, we provide a brief discussion of the potential effects of such variations on our results. The road network of Munich and the private vehicle trip demand data used in this study are publicly available in an open-access repository ( 32 ).
To reduce computational efforts—and since we are mostly interested in situations in which the MoD service runs at capacity—we restricted the simulations to the 06:00–10:00 a.m. period. However, the first and last hour of this interval were excluded from the calculation of the system performance metrics (i.e., we let the simulations warm up and cool down). As a rough reference, the number of requests for each 1% demand in the simulated period ranged between 100 and 200 requests per 15 min interval.
The MoD provider operates a ride-pooling service in which the offers for incoming requests are created in 60 s batches following the algorithm by Engelhardt et al. ( 5 ). Importantly, as previously mentioned, the operator conducts reassignments every 60 s, which means that feasible schedules are included again in the assignment problem, and the assigned vehicle for each customer might change as long as the PUDO temporal constraints are satisfied ( 11 ).
In all scenarios, one single operator using vehicles with four passenger seats is considered. A maximum 8 min waiting time was set based on our experience from previous studies for Munich. When assigning new requests to an existing vehicle’s schedule, a maximum additional 40% detour compared to a direct trip for each already-assigned request is allowed.
Experimental Design
The experimental design followed in this study seeks to replicate the differences, exemplified in Figure 1, between the real (in our study, simulated) and the assumed (by the operator) PUDO duration (
Experimental Design (555 Scenarios)
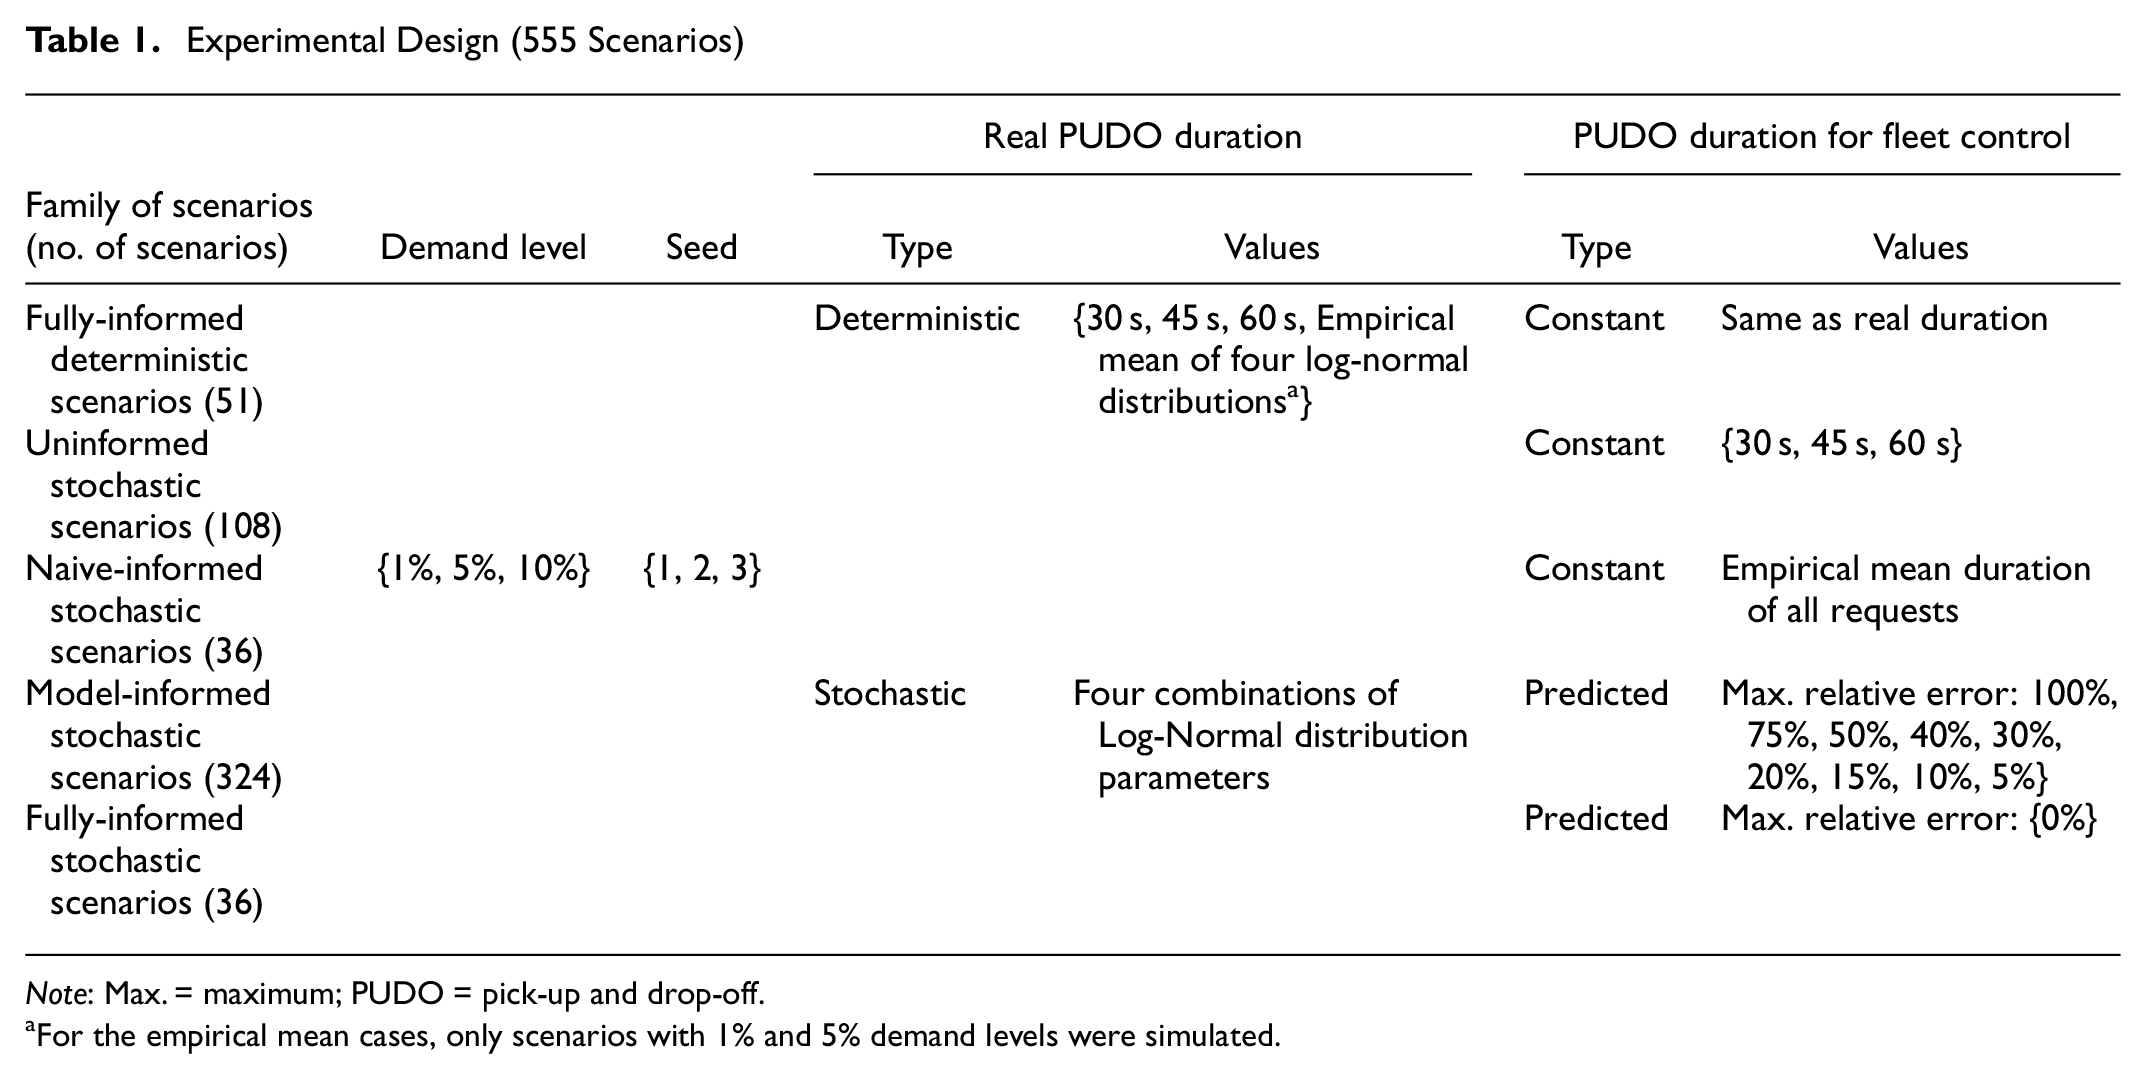
Note: Max. = maximum; PUDO = pick-up and drop-off.
For the empirical mean cases, only scenarios with 1% and 5% demand levels were simulated.
Similar to Engelhardt et al. ( 33 ), the fleet size for each scenario was calibrated in a set of additional simulations (that employed a constant, deterministic 30 s PUDO duration both in the simulation and in the planning by the operator), so that it was sufficient to accept at least 90% of the requests. Thus, we considered fleets of 235, 825, and 1550 vehicles for the 1%, 5%, and 10% demand scenarios, respectively. Because of the relatively large number of scenarios considered (555), we conducted the simulations in the Linux Cluster of the Leibniz Supercomputing Centre.
Results and Discussion
Metrics for Evaluating the Impacts of PUDO Duration on MoD Services
MoD services are complex systems with numerous impacts, both positive and negative, and their performance can be evaluated from different perspectives: that of the operator, the users of the service, and society as a whole. Unfortunately, there are often trade-offs among these three, which means that improving the situation for one of them unavoidably leads to a worse output for the others. The MoD literature suggests diverse metrics (or key performance indicators, KPIs) to quantify the performance of these services. Some popular ones, to name a few, are the operator’s profit, combined operator and user costs, costs per passenger and distance unit, average vehicle occupancy, total and empty distance traveled by the fleet, share of accepted/rejected requests, total emissions, mean waiting time, and average delays ( 4 , 9 , 22 , 23 , 34–36).
In this study, for the sake of brevity, we restrict our analysis to three KPIs. Firstly, the share of accepted requests, which is an operator-related metric, but it can also be seen as a social/user one as it indicates how many travelers could be shifted from private motorized modes to MoD services; secondly, the absolute deviation between the drop-off time provided to the passenger in the operator’s offer (i.e., at the time of the request) and the actual drop-off time, which indicates the reliability and convenience of the service to the user; and thirdly, the share of served requests that are dropped off at their destination later than their latest arrival time constraint (also termed in this paper as the late drop-off share). In the following, the second and third KPIs will be often referred to as LoS metrics. We also analyzed other metrics, such as the total vehicle-km traveled and the average occupancy per vehicle, but they showed similar trends and we therefore chose not to report them.
With respect to the absolute drop-off time deviation metric, it is important to consider that in ride-pooling services, because of the dynamic nature of the fleet management problem ( 37 ), even in scenarios with deterministic travel and PUDO duration times, many of the passengers experience a significant absolute drop-off time deviation. The reason is that, after an offer is created by the operator and the request is assigned to a vehicle, further new requests might be inserted in the schedule of that vehicle as long as the temporal constraints of the already accepted requests are satisfied. Furthermore, one must note that while the travel times in the network are dynamic, the operator bases the fleet control decisions solely on the network conditions at the “current” simulation step. This means that, even in fully deterministic scenarios, trips spanning multiple network-state periods may not align perfectly with the operator’s initial plans. Consequently, some requests may experience delayed arrivals.
In the following figures, the height of the bars represents the average value of a metric grouped by demand size (and, depending on the case, the stochastic distribution and the max. relative error of the black box prediction model). The maximum and minimum values for each metric and group are also indicated with whiskers.
Effect of Increasing PUDO Duration
In this first section, we first seek to understand how the magnitude of the PUDO duration affects the performance and LoS of the system. For this purpose, we analyzed the simulation results from two scenario families: the fully-informed deterministic and the fully-informed stochastic. As in both of them the operator has perfect knowledge of the duration of each individual request, we can isolate the effect of the PUDO duration magnitude. Note that “stochastic” in the name of the scenario refers to the way the PUDO durations are created. Therefore, from the operator perspective, the duration of the processes is not stochastic (i.e., random) but rather only heterogeneous.
Our results indicate that, regardless of whether it is constant (Figure 3a) or heterogeneous (Figure 3b) across requests, increasing the PUDO duration leads to a reduction in the share of served requests. The trend observed in Figure 3a is thus aligned with the results of Zwick and Axhausen ( 19 ) and Bilali et al. ( 20 ), and seems to be also present in the case of heterogeneous PUDO durations shown in Figure 3b (which has, to our knowledge, not yet been studied in the literature). The observed larger drop for larger demand size scenarios (−1.6% for a 30 s longer stop in 1% demand scenarios, −2.7% in 10% demand scenarios) is expected, as vehicles idle less, have higher utilization, and tend to pool more requests together in the same ride ( 5 ).
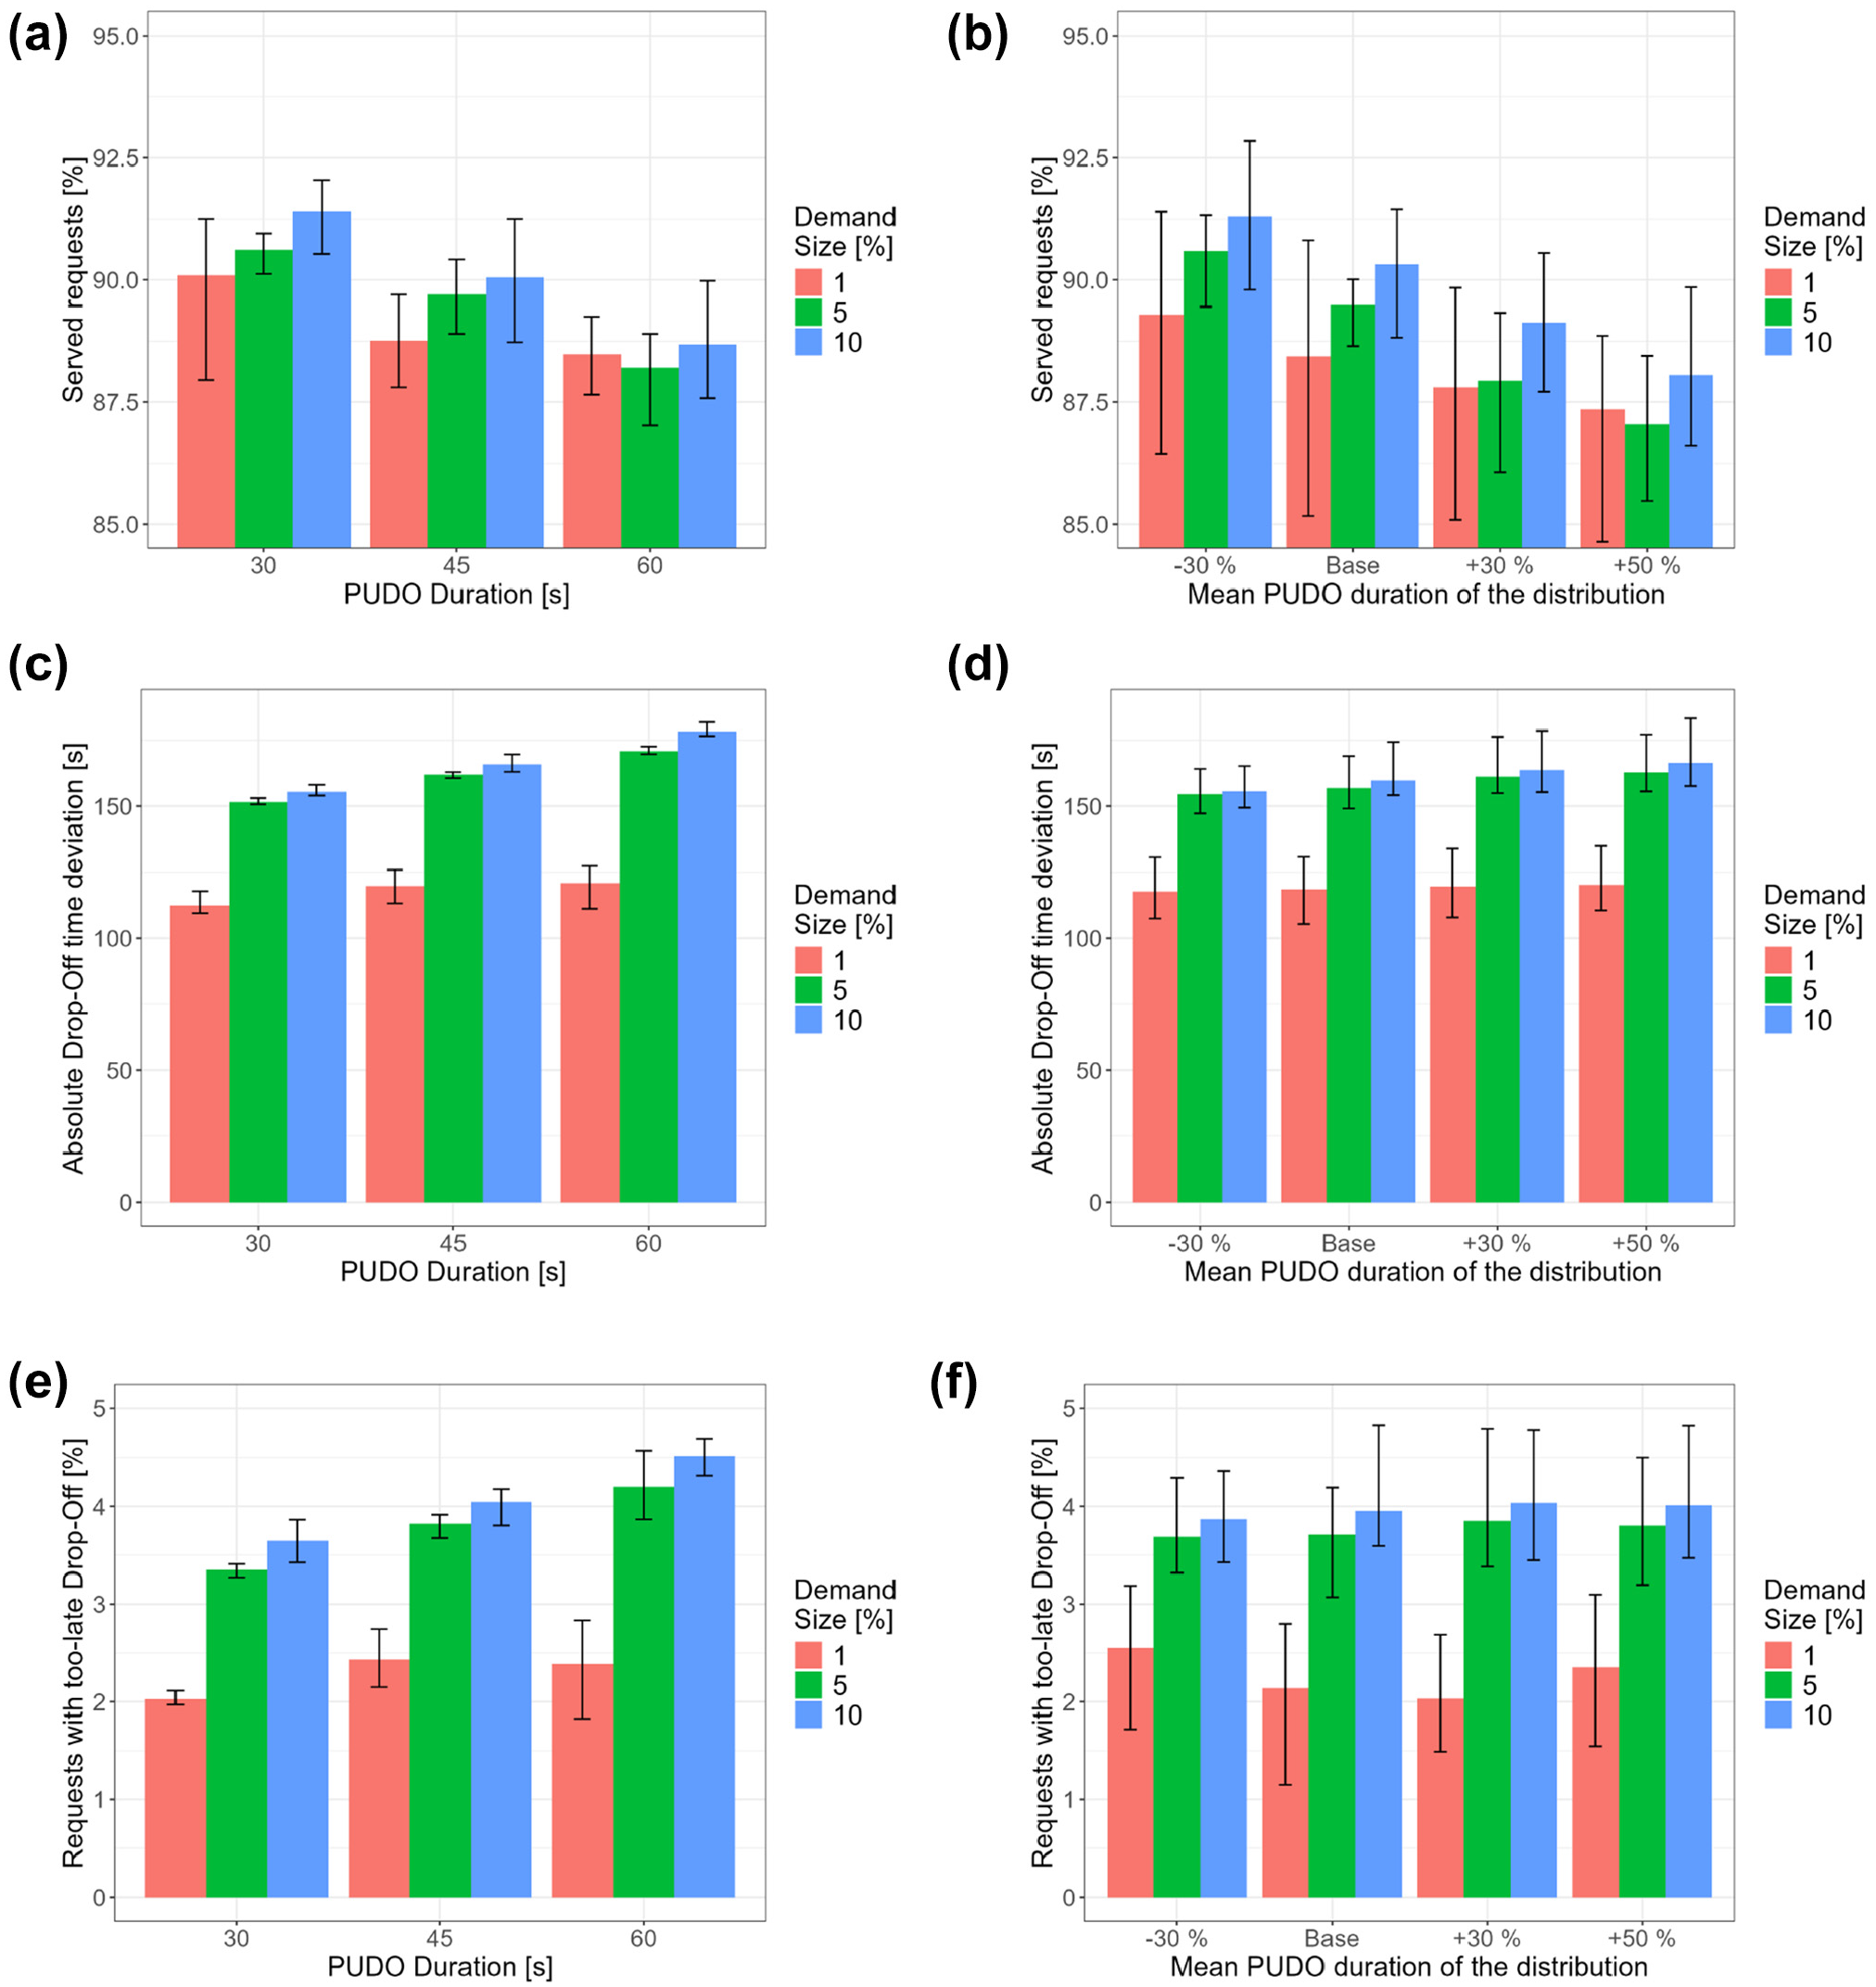
Impacts of increasing pick-up and drop-off (PUDO) duration considering fully-informed operators. (a) Served requests with constant PUDO duration across requests. (b) Served requests with heterogeneous PUDO duration. (c) Absolute drop-off (Abs. DO) time deviation with constant PUDO duration across requests. (d) Abs. DO time deviation with heterogeneous PUDO duration. (e) Late drop-off share with constant PUDO duration across requests. (f) Late drop-off share with heterogeneous PUDO duration.
With regard to the LoS experienced by the passengers, it can also be observed that it deteriorates as the PUDO duration increases. For the absolute drop-off time deviation, in Figure 3, c and d , this trend is intuitive as the boarding/alighting of the requests inserted in a vehicle schedule after an offer has been generated will take more time, thus increasing the difference with respect to the offered arrival time. For the share of requests arriving at the destination later than the customer’s temporal constraint, in Figure 3, e and f , the shown increase with longer PUDO duration requires further discussion.
Firstly, one could question why, if the operator has perfect knowledge of the PUDO duration for each request and uses this information for its fleet management, some passengers see their temporal constraints violated. The reason is that, as previously mentioned, in our case study we consider dynamic network travel times, which are updated every hour. However, when assigning a request to a vehicle, the operator only considers the network conditions at the time of the request. This means that, for trips spanning over more than one network-state period, the experienced travel times by the vehicle will partly not match those planned by the operator (and, thus, the arrival time of some requests will be later than planned). Secondly, the observed relationship between longer PUDO duration and a higher late drop-off share might not seem intuitive, but it is actually rooted in the same phenomenon discussed in the previous point. As the PUDO duration increases, so does the number of trips traveling over more than one period and, therefore, more requests might arrive at the destination later than scheduled.
Effect of PUDO Duration Stochasticity
In this section, we seek to evaluate whether PUDO duration stochasticity affects the performance of the service. We do this by analyzing (i) a subset of the deterministic scenarios (in the fully-informed deterministic family, those with the real PUDO duration based on the empirical mean of the four log-normal distributions) and (ii) those stochastic scenarios that consider the same empirical mean duration (i.e., the naive-informed stochastic family). As the comparison is made between scenarios in which the operator has the same level of information (the empirical mean PUDO duration), and the magnitude of the average PUDO duration is the same, we are able to isolate the stochasticity effect.
The results presented in Figure 4, a and b , indicate that, with respect to the share of served requests and after controlling for the magnitude of the PUDO duration, there is no significant difference when the real duration of the PUDO process is stochastic or deterministic.
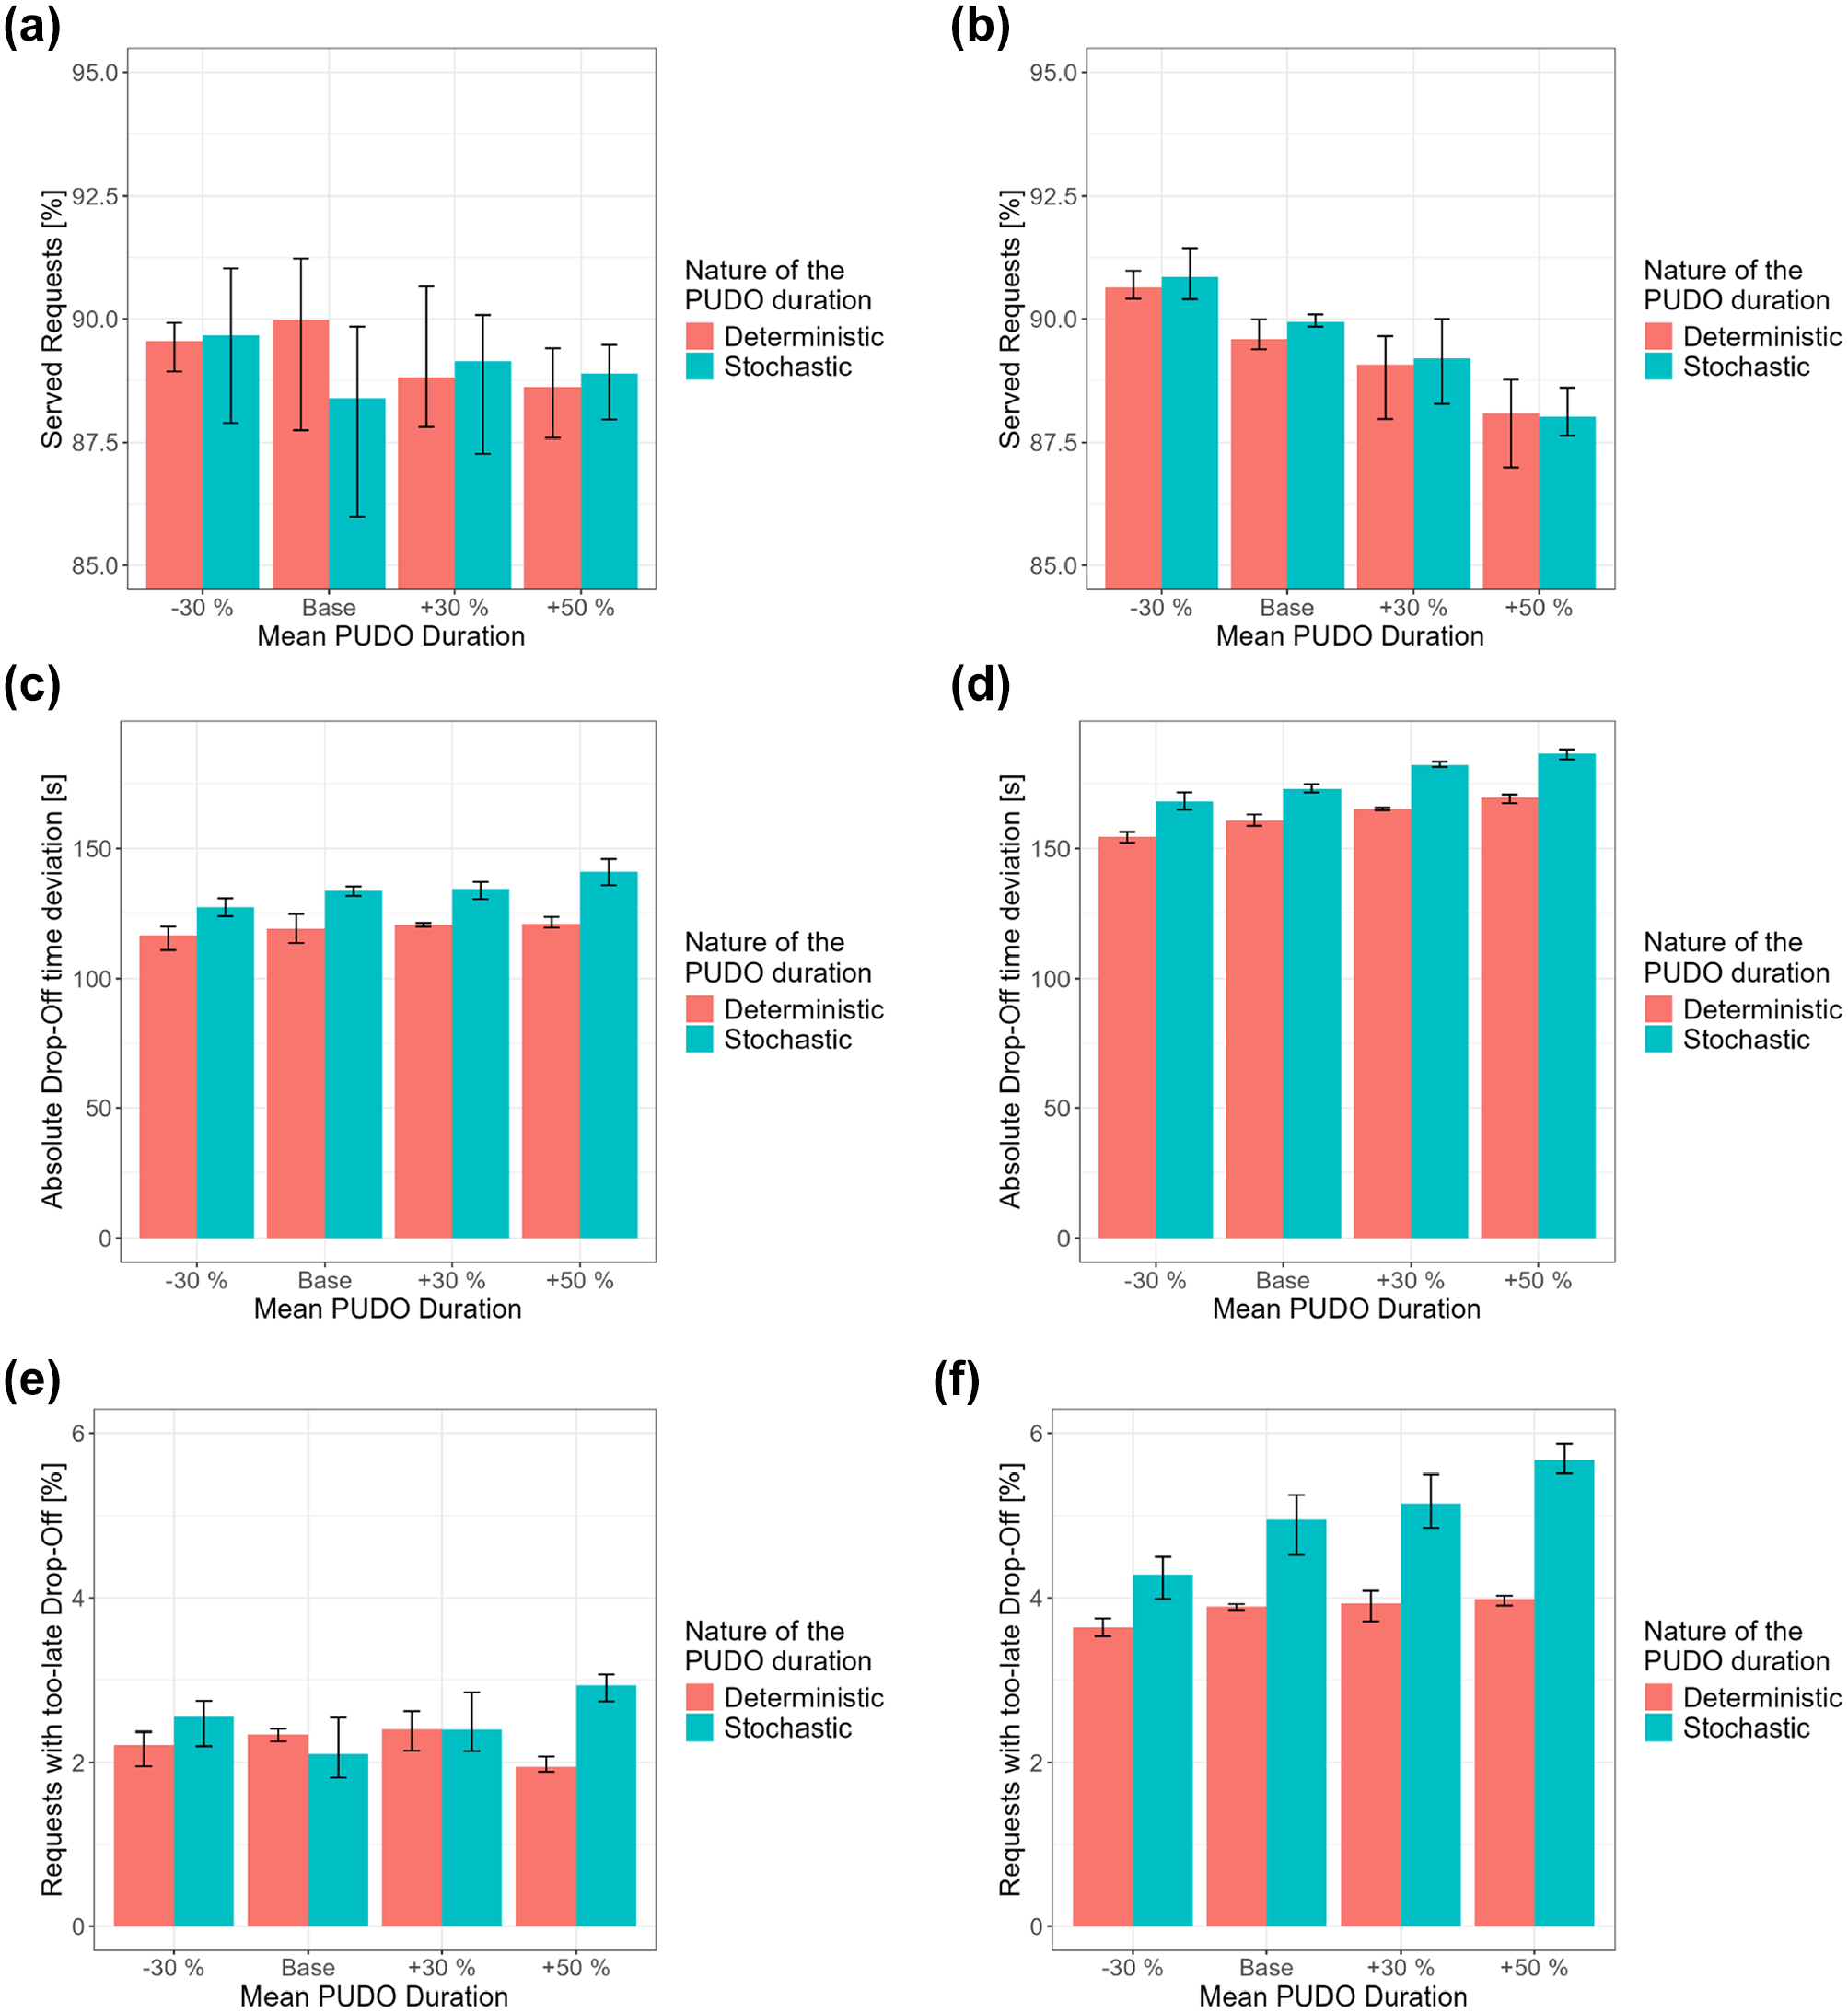
Impacts of pick-up and drop-off (PUDO) stochasticity on the mobility-on-demand service. (a) Served requests for 1% demand scenarios. (b) Served requests for 5% demand scenarios. (c) Absolute drop-off (Abs. DO) time deviation for 1% demand scenarios. (d) Abs. DO time deviation for 5% demand scenarios. (e) Late drop-off share for 1% demand scenarios. (f) Late drop-off share for 5% demand scenarios.
By contrast, the situation is notably different when we look at the effects on the LoS: the changes are in the absolute drop-off time deviation metric, in Figure 4, c and d , and in the late drop-off share, in Figure 4, e and f. Both metrics are systematically worse for the stochastic scenarios, with higher demand levels exacerbating the degradation of the LoS. As shown in Figure 4f, the presence of stochasticity can increase the share of late drop-off requests by up to 1.7%.
Effects of Predicting PUDO Duration for Each Request
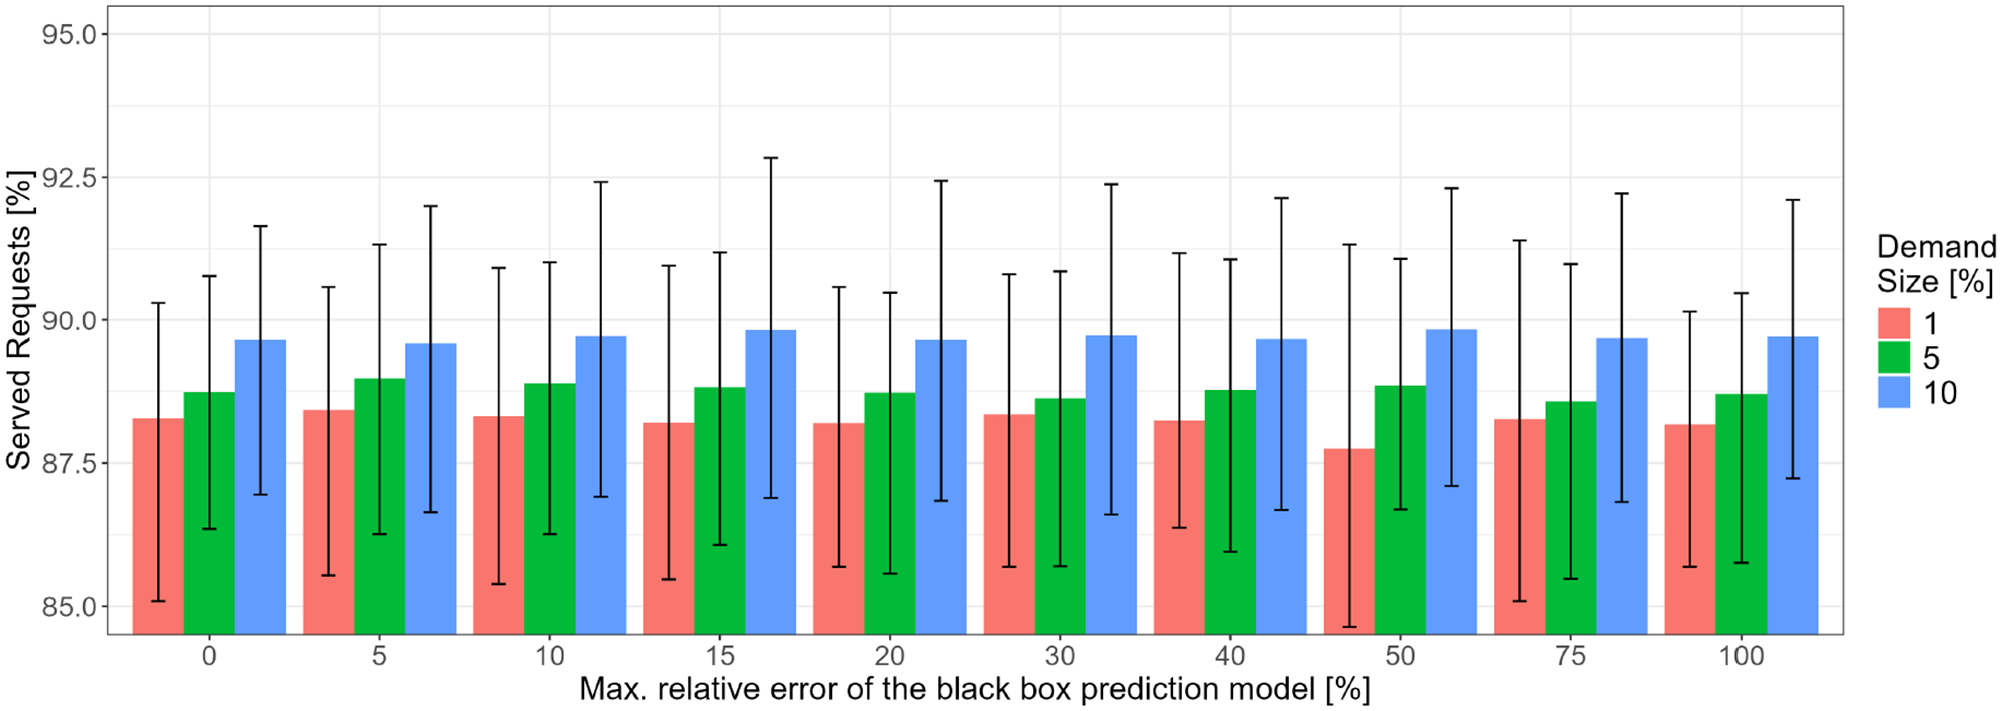
The results in Figure 5, based on the fully-informed and model-informed stochastic scenario families, reveal only a slight operational improvement trend with better prediction models (i.e., with a lower maximum relative error
Operational impact of using different pick-up and drop-off duration prediction models.
Nevertheless, we argue that the lack of a clear trend is, to a certain extent, an artifact of the PUDO duration generation process and the proposed black box model in this study. Firstly, the log-normal distribution used to generate the “real” PUDO duration is strongly right-skewed and, by nature, has a median that is significantly lower than the mean. This, combined with the truncation we implemented, leads to a much larger number of “short” stops (shorter than the mean) than “long” ones (longer than the mean). Secondly, we expect the share of served requests to be sensitive to the absolute error in the prediction model, but this error is both dependent on the maximum relative error (
Another factor that contributes to the lack of a clear trend is that the considered black box is not biased, meaning that the chances of over- and under-estimating the PUDO duration are the same (unlike the example shown in Figure 1, where the model systematically over- or under-estimates). Accordingly, when several PUDOs are planned one after the other for a vehicle, they tend to compensate over time, mitigating the operational impacts from the operator’s perspective.
Altogether, we believe that if we extended our study and considered black box models defined by their maximum absolute error, we would observe a clearer trend as poorer predictions would lead to more accepted requests becoming unfeasible, thus locking vehicles more frequently and reducing the share of served requests.
In contrast to the previous discussion, Figure 6 highlights the positive impacts on the LoS of using different black box models to predict PUDO duration. The advantage of using better prediction models, that is, the value of information, is evident in the reduction of absolute drop-off time deviation and, more significantly, in the lower late drop-off share. These trends are logical, as passengers spend only a short period in the vehicle and share the ride with a limited number of other requests. Consequently, temporal deviations caused by over- or under-predictions during the ride are less likely to be compensated.
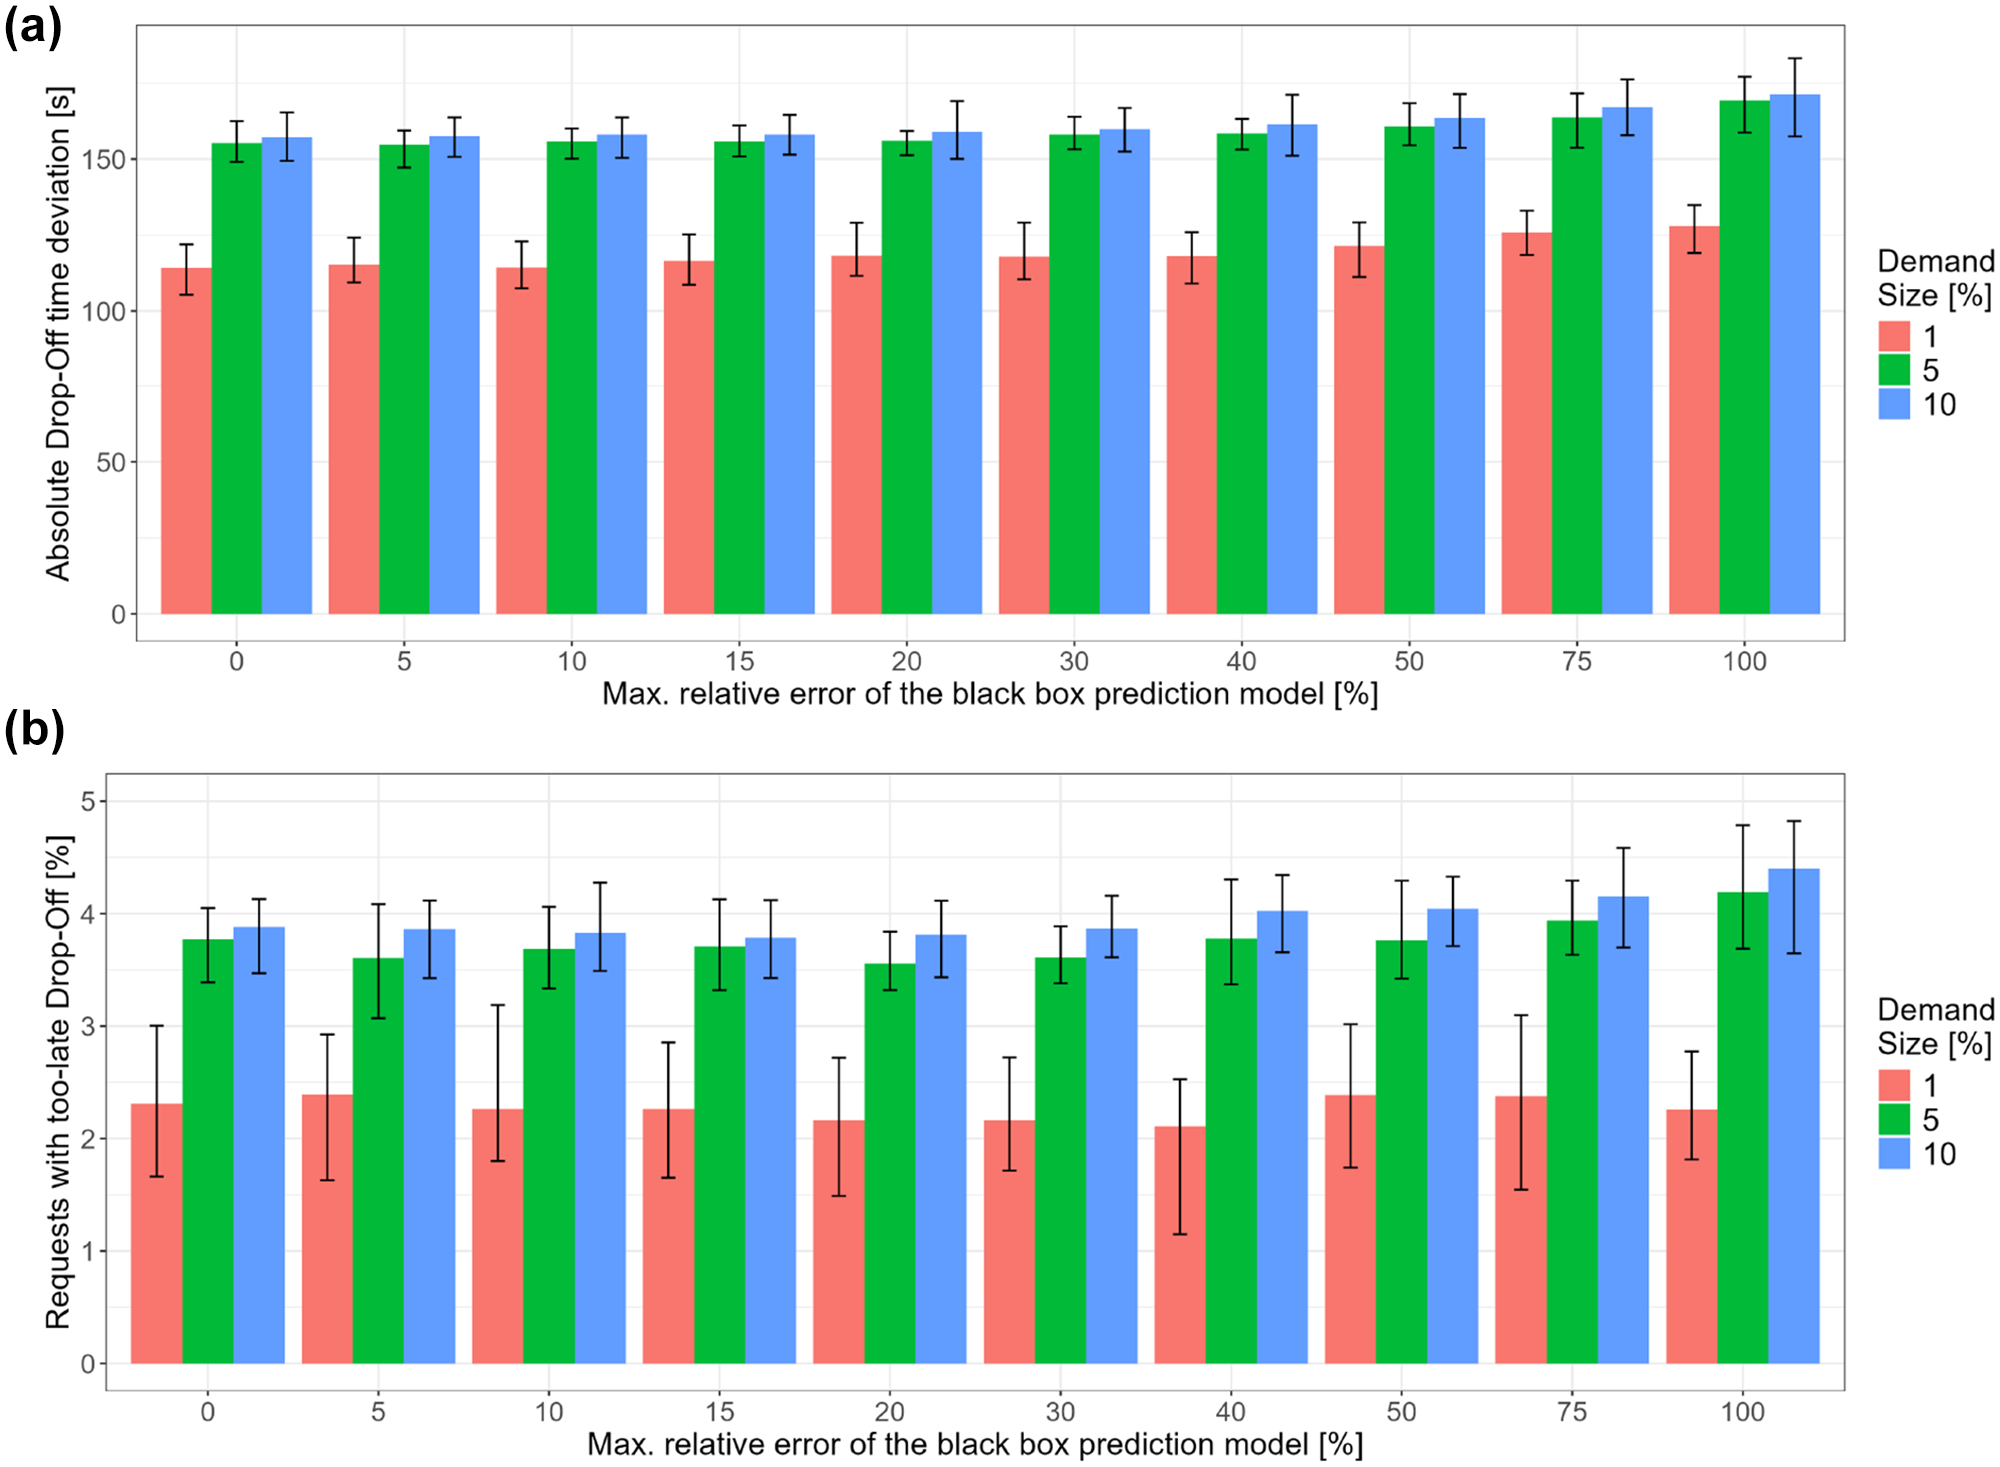
Level of service impacts of using different pick-up and drop-off duration prediction models. (a) Impact on the absolute drop-off time deviation. (b) Impact on the late drop-off share.
Effects of Using Biased versus Informed Constant PUDO Duration Values
In this final results section, we seek to understand whether, in the absence of a prediction model capable of predicting the duration of every individual PUDO process, it would be beneficial to use a naive-informed constant value for the fleet management tasks, rather than an arbitrary one, when the real PUDO duration is stochastic. To this end, we compare the results of the uninformed and naive-informed stochastic scenario families. To enrich the interpretation of the results, Figures 7 and 8 also display the results for
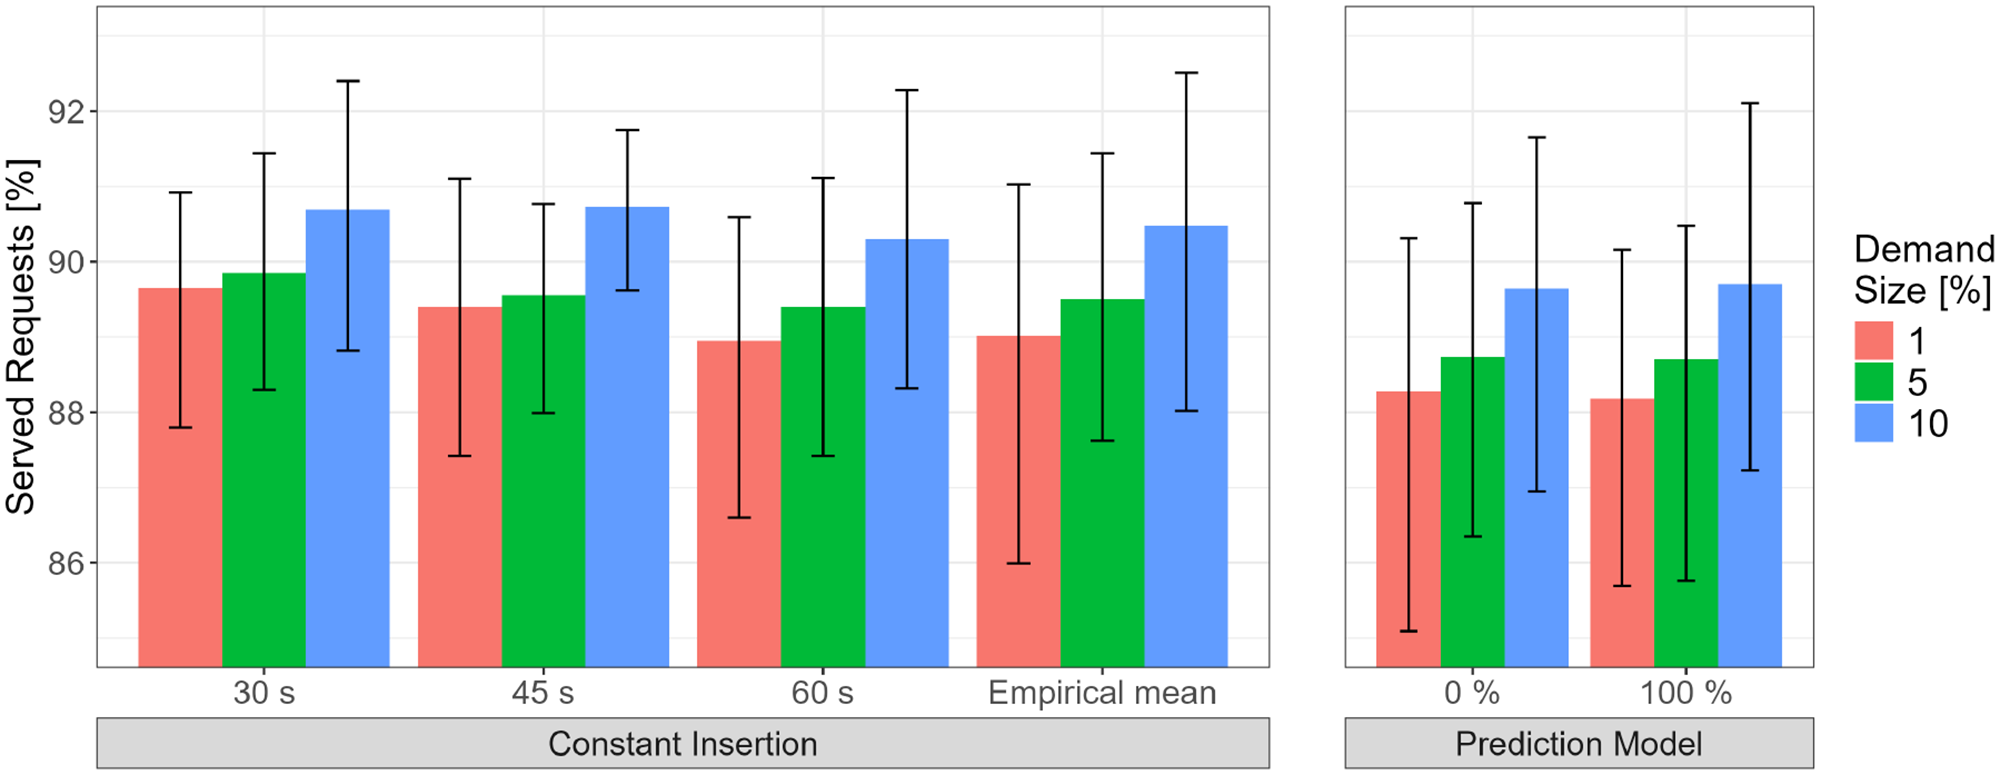
Operational impacts using different constant insertion and prediction models.
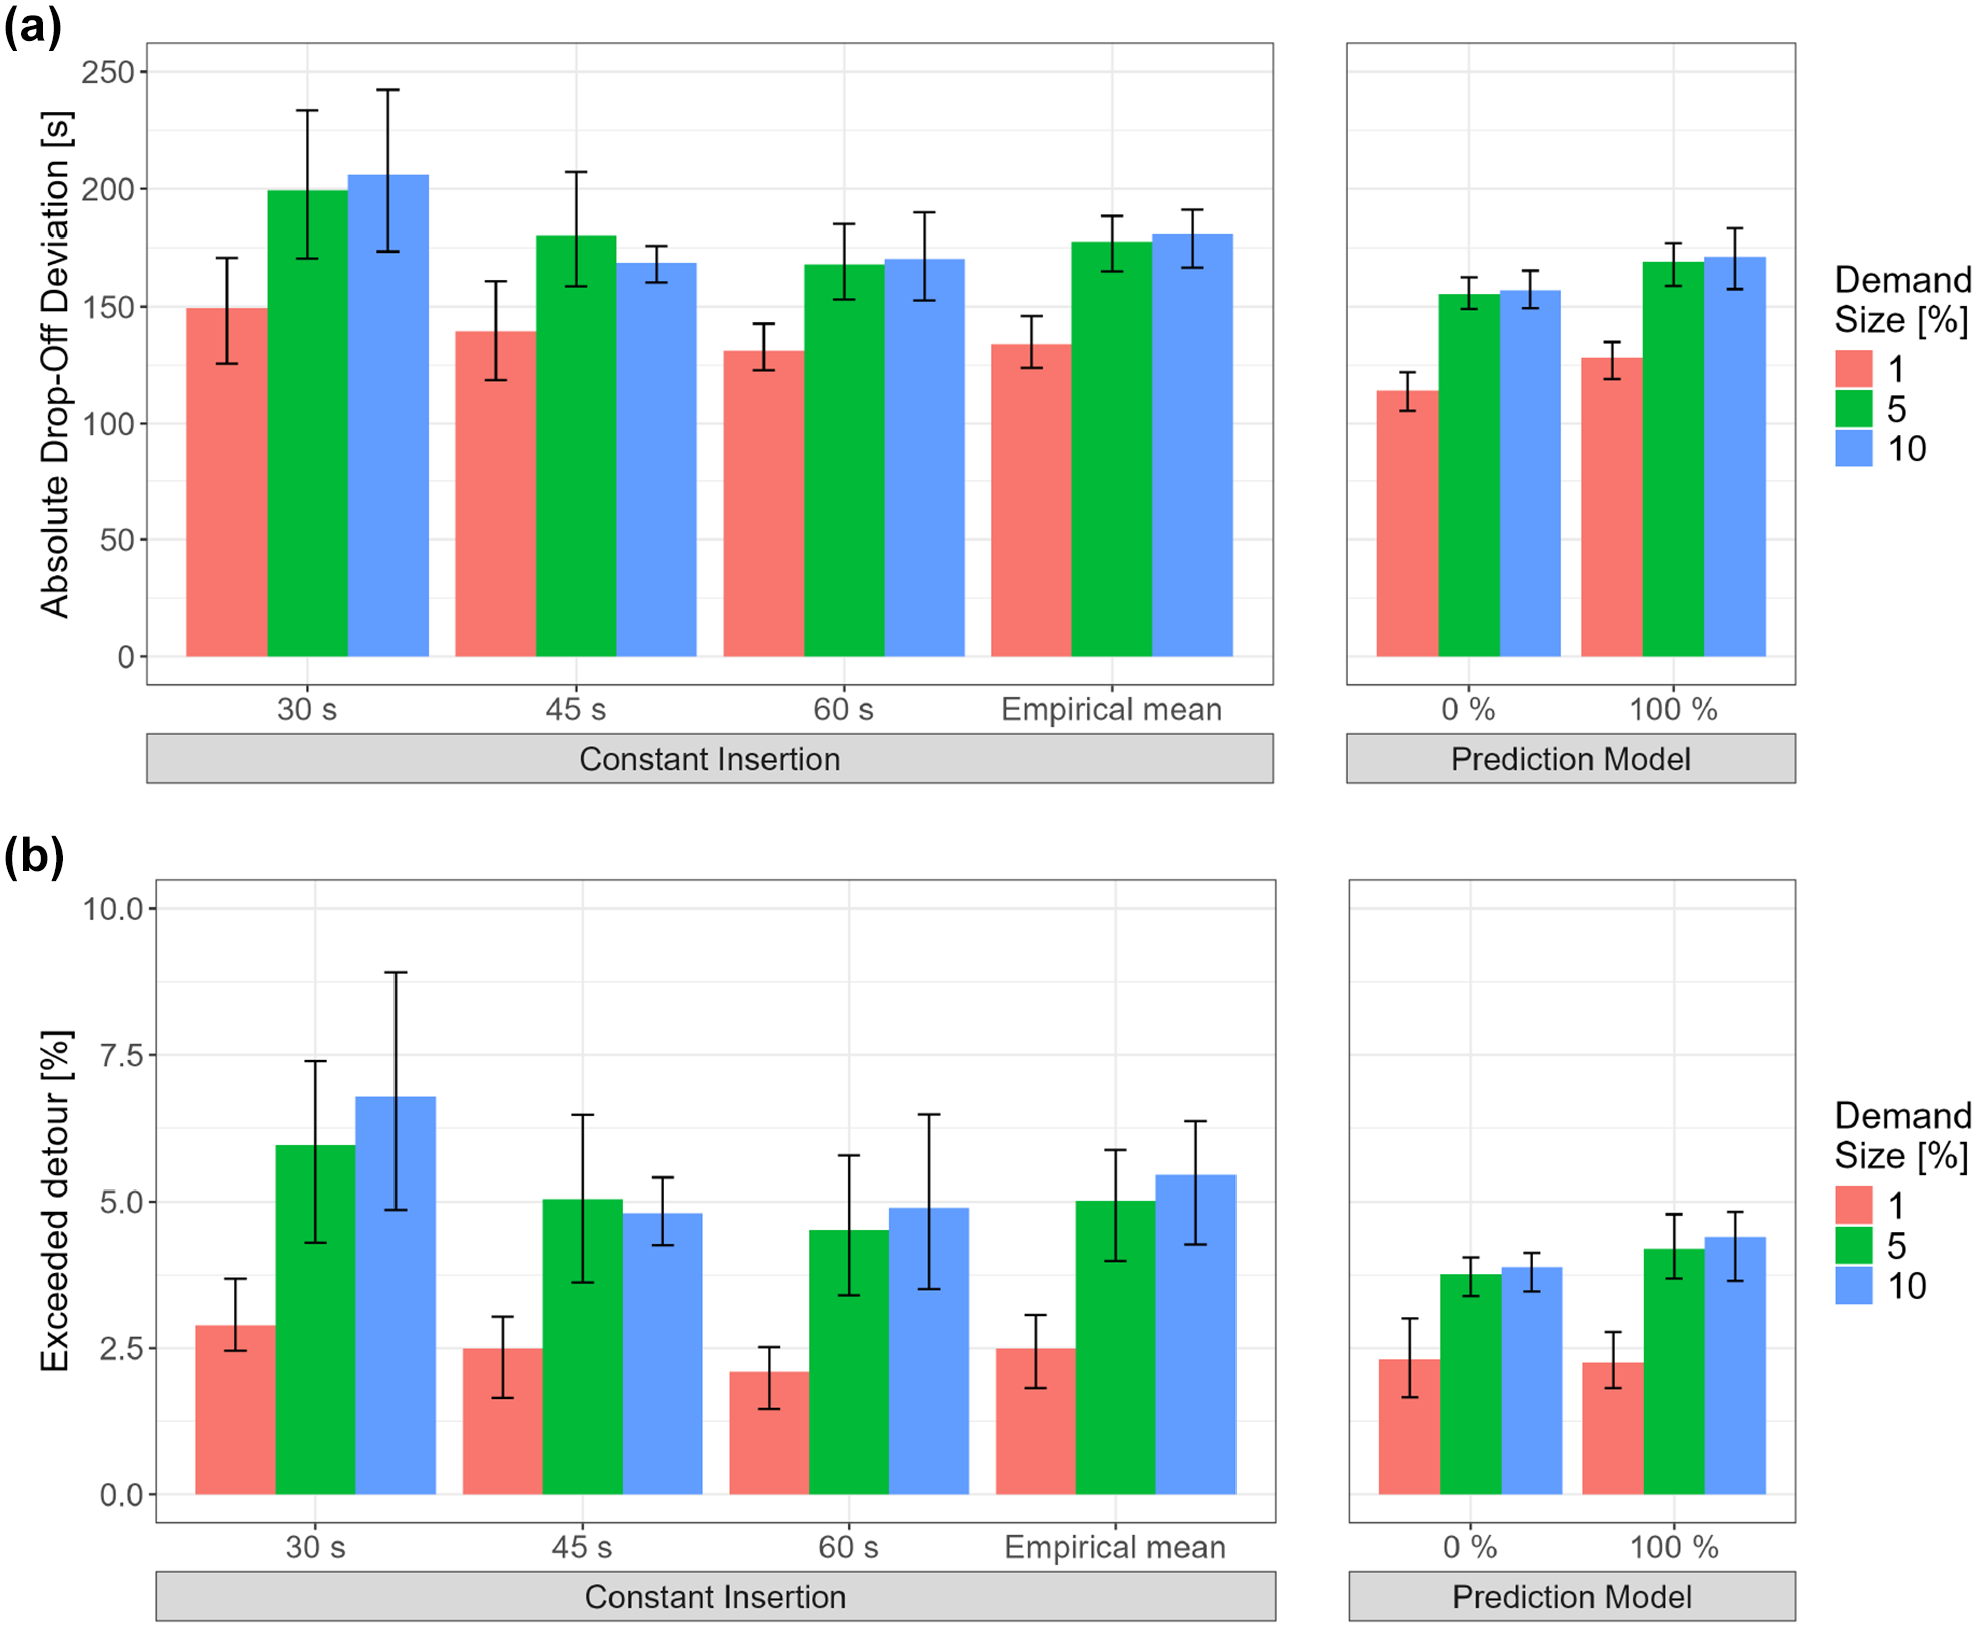
Level of service impacts using different constant insertion and prediction models. (a) Impact on the absolute drop-off time deviation. (b) Impact on the late drop-off share.
With respect to the share of served requests, in Figure 7, we observe relatively minor differences among using 30 s, 40 s, or the empirical mean value for fleet management, and a lower performance for 60 s. In comparison, using the prediction models also leads to fewer served requests across all demand size levels. This might suggest that ignoring the real duration and using a fixed 30 s value is the best approach for the operator. However, we argue that the results shown in Figure 7 are an artifact of how the simulation framework models MoD operator’s decisions (particularly the assignment algorithm) and user behavior (users cannot cancel even if the vehicle is delayed). With respect to the former, when the operator decides whether to assign a user request to a vehicle, it takes into account the feasibility of that combination ( 4 , 38 ). This feasibility depends on the necessary travel time and also on the number (and duration) of the intermediate stops for that vehicle before arriving at the origin of the new request. Thus, if the duration—considered by the operator, not necessarily the actual duration—of the intermediate PUDO processes decreases, more combinations of request–vehicle would potentially be feasible, leading to a higher share of served requests. Nevertheless, decreasing the planned PUDO duration would likely cause delays for passengers, degrading the LoS, making the service less attractive and inducing the cancellation of requests—although this last aspect is not captured by our framework. In contrast, when the operator uses a prediction model, it anticipates whether inserting that request into a vehicle’s schedule will cause already-assigned requests to arrive too late at their destinations. It then considers those request–vehicle combinations unfeasible, reducing the number of served requests but improving the service quality for the accepted ones.
Figure 8, a and
b
, supports this argument, as the LoS is always better using the empirical mean than using a 30 s constant value. However, as already mentioned, this did not affect the number of served requests in our study as we considered exogenous demand and did not allow for user cancellations even when the vehicles were significantly delayed. Interestingly, these figures also reveal that employing a prediction model, even one with
Importantly, although the improvements in the late drop-off share using the prediction models might not seem astonishing—for the 10% demand case the reduction is around 1%—we believe that the impacts on the long-term acceptance and usage of the MoD service could be considerable in certain contexts. For example, if the MoD service operated as a feeder mode to scheduled public transport services, violating the latest drop-off constraint of a request might mean missing the connection and waiting for the next service (with its high associated disutility). Thus, even small reductions in the late drop-off share could lead to an important improvement in the service’s quality.
In summary, we can conclude that using a prediction model or, alternatively, considering a constant naive-informed value, would lead to more reliable services for the passengers. We believe that this would also lead to a higher share of served requests, but this phenomenon is not realistically captured in our setup of the simulation framework.
Conclusion, Limitations, and Future Research
In this study, we have provided a deep analysis of the effect of PUDO duration on the operational performance and LoS of a ride-pooling MoD service. Specifically, we analyzed how the magnitude of the average PUDO duration, its heterogeneity across requests, and stochasticity affect the service. We also explored the possible benefits or downsides for both operators and users of using an informed PUDO duration value for fleet management when the PUDO duration is heterogeneous, stochastic, or both.
Our results reveal that even modest changes in the mean duration—regardless of the presence of stochasticity—do significantly affect the performance of the service, which is noticeable given that these changes are short in relation to the total ride duration (e.g., a 25 s PUDO duration increase, for around 18 min average ride duration, can reduce the share of served requests by over 3%). We also found that the presence of PUDO duration stochasticity leads to a substantial degradation of the LoS, particularly for higher demand levels. Finally, we noted that the LoS would be improved if operators used an informed PUDO duration value when managing their fleet (either a specific one for each request based on a data-driven prediction model or, in its simplest form, a constant naive-informed value, instead of the arbitrary 30, 45, or 60 s typically used in research and practice). In our opinion, this latter approach is particularly interesting for real-life applications, as it would require a very low burden to implement (an operator would only need to calculate the average duration across all historical trips). In this sense, we emphasize the importance of accounting for the share of requests that arrive at a destination later than acceptable (the late drop-off share metric) as this would have critical impacts if a MoD service is integrated as a feeder in public transportation.
With respect to the limitations of this study, although we created a wide experimental design and tried to derive results that can be generalized, we must acknowledge that some of our conclusions might still be specific to the fleet control algorithms we employed (e.g., batching, instead of insertion heuristics). In particular, it is conceivable that the regular reassignment of requests compensates for part of the deviations in the schedule introduced by the PUDO stochasticity. On a different note, our simulation results show that, when considering informed insertion values in a stochastic context, there is an apparent trade-off between the LoS and the share of served requests. However, as we discussed, this might be an artifact of the simulation framework. This calls for the need to investigate this issue further and, more generally, to develop better, more realistic approaches to deal with stochasticity—both in travel times and in PUDO times—that makes previously feasible requests unfeasible. In addition, it would be valuable to research how the discrepancies between the “promised” (offered) and “actual” (provided) LoS affect users’ short-term and long-term behavior and acceptance of MoD services.
In this study, we generated synthetic PUDO duration data using a parametric distribution fitted to both PUDO events reported by Machado-León et al. ( 27 ). However, this approach does not fully capture the differences between these processes, as empirical evidence from the same study indicates significant variations in duration. Unfortunately, separate distributions were not reported, and no alternative data source was available to us. We faced a similar limitation with respect to the shape of the PUDO duration distribution. We considered the log-normal distribution reported by Machado-León et al. ( 27 ), and also tested variations with the same variance but pivoted mean. We did not explore further variations in the distribution shape, as this would significantly increase the number of scenarios, making result interpretation too complex. In addition, we lacked evidence to confirm whether these alternative distributions would accurately reflect real-world conditions. Future studies could refine these aspects if more granular PUDO duration data—for example, differentiated by process type, operator, and city—becomes available. Nonetheless, we do not expect our study’s overall conclusions to be affected.
A final limitation of this study concerns the type and source of the demand for the MoD service. Firstly, as previously explained, we utilized private vehicle demand because of its availability at a fine spatial and temporal granularity. Secondly, while we considered the implicit spatial distribution of this private vehicle demand, we did not analyze how alternative spatial distributions might influence our results. In this regard, Soza-Parra et al. ( 39 ) demonstrated that demand attributes—such as the concentration of destinations and average trip lengths—affect the chance of multiple requests being pooled on the same vehicle (i.e., the shareability [ 40 ]) and that higher pooling improves average vehicle occupancy, reduces total vehicle hours, and lowers passenger costs. Similarly, our study found that higher demand levels led to increased pooling of requests within the same ride. However, we also showed that longer or more stochastic PUDO durations had increasingly negative impacts at higher demand levels, particularly on LoS metrics. We attributed this effect to the greater interaction between requests associated with higher pooling. Consequently, we anticipate that spatial demand patterns promoting higher pooling would be more significantly influenced by PUDO duration.
We recommend that future studies investigate the impacts of PUDO stochasticity in scenarios where network travel times are also stochastic. In addition, exploring larger demand size scenarios would be valuable because of the increased pooling and associated interactions between requests. Nevertheless, given the substantial increase in computational effort with larger demand sizes, it would be sensible to reduce the variables and levels considered in the experimental design.
In conclusion, the findings of this study highlight the importance of incorporating a more realistic treatment of PUDO duration in future MoD studies. Furthermore, both academic researchers and mobility service providers would significantly benefit from the availability of real-world, large-scale, request-level PUDO-related data.
Supplemental Material
sj-pdf-1-trr-10.1177_03611981251346450 – Supplemental material for Analyzing the Effects of Pick-Up and Drop-Off Duration and its Stochasticity on Mobility-On-Demand Services
Supplemental material, sj-pdf-1-trr-10.1177_03611981251346450 for Analyzing the Effects of Pick-Up and Drop-Off Duration and its Stochasticity on Mobility-On-Demand Services by Santiago Álvarez-Ossorio Martínez, Florian Dandl and Klaus Bogenberger in Transportation Research Record
Footnotes
Acknowledgements
The authors want to thank Roman Engelhardt for his advice during the implementation of the simulations and analysis of results, as well as for his role in the development team of FleetPy. The authors gratefully acknowledge the computational resources provided by the Leibniz Supercomputing Centre (![]() ). Chat-GPT 4.0 and Copilot were used for proofreading and language editing. Finally, the authors thank the reviewers of this manuscript (and of an earlier version) for their valuable and constructive feedback.
). Chat-GPT 4.0 and Copilot were used for proofreading and language editing. Finally, the authors thank the reviewers of this manuscript (and of an earlier version) for their valuable and constructive feedback.
Author Contributions
The authors confirm contribution to the paper as follows: study conception and design: Santiago Álvarez-Ossorio, Florian Dandl, Klaus Bogenberger; data collection: Santiago Álvarez-Ossorio; analysis and interpretation of results: Santiago Álvarez-Ossorio, Florian Dandl; draft manuscript preparation: Santiago Álvarez-Ossorio, Florian Dandl, Klaus Bogenberger; supervision: Klaus Bogenberger. All authors reviewed the results and approved the final version of the manuscript.
Declaration of Conflicting Interests
The author(s) declared no potential conflicts of interest with respect to the research, authorship, and/or publication of this article.
Funding
The author(s) disclosed receipt of the following financial support for the research, authorship, and/or publication of this article: S. Álvarez-Ossorio Martínez acknowledges funding from the metaCCAZE project (GA no. 101139678), part of the European Union’s Horizon Europe research and innovation program. Views and opinions expressed are those of the author(s) only and do not necessarily reflect those of the European Union or the European Climate, Infrastructure and Environment Executive Agency (CINEA). Neither the European Union nor the granting authority can be held responsible for them.
Supplemental Material
Supplemental material for this article is available online.
References
Supplementary Material
Please find the following supplemental material available below.
For Open Access articles published under a Creative Commons License, all supplemental material carries the same license as the article it is associated with.
For non-Open Access articles published, all supplemental material carries a non-exclusive license, and permission requests for re-use of supplemental material or any part of supplemental material shall be sent directly to the copyright owner as specified in the copyright notice associated with the article.