
Abstract
Mobility is indispensable for out-of-home activities and social participation. From a transport science perspective, mobility-related participation restrictions are determined by the interaction of land use structure, transport infrastructure and services, and individual characteristics. In transport planning, accessibility serves as a measure to determine participation opportunities, based on reachable destinations and expressed in travel times. Individual characteristics are usually not considered when assessing accessibility. Mobility options define a person's ability to change location, including individual characteristics alongside “objective” accessibility. This paper develops a method quantifying mobility options through an index for mobility options (MOX), calculable mode-specifically for population groups (MOXPG,m) or person-specifically (MOXP). The MOX indicates a person's mobility options using a value between 0 and 10. The method developed can, therefore, be used to obtain scientific findings on the impact mechanisms of mobility options based on statistical analyses of quantitative parameters, on the one hand. On the other hand, this method can be used to identify and spatially localise problems with regard to mobility-related social exclusion in transport and social planning. The knowledge gained about the population's mobility options can be used to develop and justify measures. Based on two household surveys in the Social2Mobility project, it was applied in the Ronnenberg area in the Hannover region. The results of the exemplary application show, for example, that people at risk of poverty, women, single parents, those with migration backgrounds, and those with physical disabilities have significantly fewer mobility options, facing higher risk of mobility-related social exclusion.
Keywords
Mobility is essential to be able to realize activities away from home, such as working, shopping, or education. Owing to the spatial distances between the places where people pursue their activities, mobility is a prerequisite for social participation ( 1 ). Mobility restrictions can therefore limit access to various areas of services of general interest, which in turn contributes to mobility-related social exclusion ( 2 , 3 ).
In Germany, the guarantee of services of general interest is often derived from the principle of the social state (Article 20 of the Basic Law) ( 4 , 5 ). The safeguarding of services of general interest in spatial planning is enshrined in the Spatial Planning Act (ROG). According to Section 1 (2) of the ROG, equivalent living conditions should be created in all areas of Germany. According to ROG §2 Para. 2 No. 1, this means balanced social, infrastructural, economic, ecological, and cultural conditions. This includes, above all, the provision of services and infrastructures of general interest, in particular the accessibility of facilities and basic services for all population groups (ROG §2 Para. 2 No. 3) ( 4 , 6 ). The 17 global sustainable development goals (SDGs) also formulate the sub-goal of providing access to safe, affordable, accessible, and sustainable transport systems for all by 2023 under the 11th goal “Sustainable cities and communities” ( 7 ).
However, analyses of the Germany’s national travel survey (MiD) in 2017 study show that not all population groups have equal access to mobility and their destinations. People with a lower economic status, for example, are less likely to own a bicycle and less likely to own a car and are more likely to walk than people with a higher economic status. The economic status is defined as the net household income (income after taxes and social security contributions) in relation to the weighted number of household members.
The average frequency of journeys also increases with rising economic status ( 8 ). One of the aims of integrated transport planning is to create fairness in transport, which includes the social inclusion of all population groups regardless of, for example, physical limitations, low income, or time restrictions ( 9 ). From a transport science perspective, mobility-related participation restrictions are primarily determined by the interaction of three elements: land use structure, transport infrastructure and services, and individual characteristics (e.g., availability of means of transport, abilities) ( 10 , 11 ). In transport planning, accessibility is used as a common and widespread measure to determine personal participation opportunities. ( 12 ). Accordingly, accessibility describes the access to a point of interest (POI) and thereby evaluates the quality of the transport infrastructure and services based on the existing land use structure. In transport planning, the term is usually understood in the sense of “objective” or “spatial” accessibility. The characteristics of the individual are not normally taken into account when evaluating accessibility ( 12 ).
Mobility is defined as a generic term for mobility options and mobility behavior. Mobility options represent the possibility of a person to change location, whereas mobility behavior describes the realized changes of location of a person with their spatial, temporal, modal, and route-specific characteristics ( 13 ). Mobility behavior is therefore determined by a person’s mobility options ( 8 ). The more mobility options a person has at their disposal, the more freely they can determine and realize their own mobility behavior. Reduced participation in transport and thus, for example, a lower mobility rate is not necessarily an indication of mobility-related social exclusion, provided that this is desired by the person concerned on the basis of subjective preferences ( 14 ). It is important to distinguish between self-determined immobility and involuntary restrictions owing to structural or social barriers. Only when mobility limitations conflict with individual needs and aspirations can they be considered a form of social exclusion.
To better reflect the mobility-related opportunities for social participation, an indicator is needed that can quantify the mobility options: that is, the possibility of a person to change location.
The central aim of this paper is, therefore, to develop a method to quantify mobility options. The result of this method is a mobility options index, which, in addition to objective accessibility, also considers the individual characteristics of people. The term “index” refers to the summarization of several separate indicators, which together form a new variable. On the one hand, the method is intended to provide scientific findings on the mobility options of different population groups and mechanisms of action. On the other, it aims to identify and spatially localize problems in transport and social planning. The method is not intended to determine which means of transport can achieve the most mobility options. The goal is to analyze which people have too few mobility options and who need to explicitly support them with measures. The method should be applicable with (freely) available or easily collectable data in Germany.
Based on an extensive literature analysis, the main factors influencing a person’s mobility options were first identified. These influencing factors then formed an essential basis for the development of the method. As the concept of mobility options is still a relatively new one in Germany, similar and related concepts such as accessibility or mobility poverty were used to identify the influencing factors ( 9 , 11 , 13 , 15 ). Figure 1 shows the identified influencing factors on mobility options, categorized by characteristics of objective accessibility and characteristics of the individual.
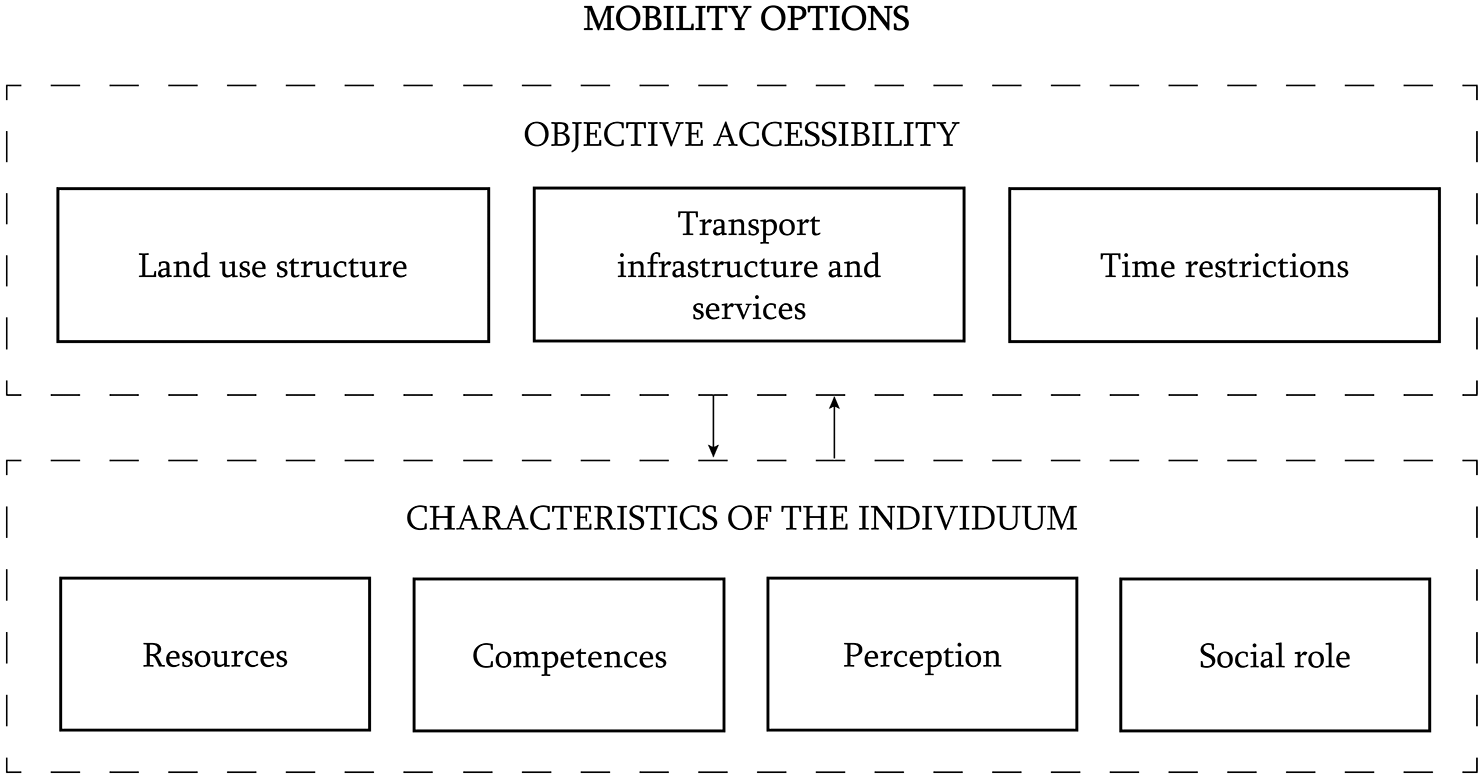
Influencing factors on mobility options.
The characteristics of objective accessibility include the land use structure, the transport infrastructure and services, and externally defined time restrictions outside the transport system. The land use structure represents the spatial distribution of activity opportunities such as workplaces, shops, and residential locations. Transport infrastructure and services includes the transport infrastructure and services provided for the movement of people, goods, or both ( 13 ). Time restrictions are fixed times over which the individual has no direct influence. These can be, for example, opening hours of target opportunities such as doctor’s surgeries or leisure facilities or working hours (defined by the employer).
The characteristics of the individual are the resources, competences, perception, and social role of a person. Resources are understood to be both material and monetary resources. Material resources can be, for example, car or bicycle ownership.
A person’s competences are understood as their sensory, motor, social, emotional, and cognitive possibilities. For example, a person has the ability to walk or ride a bicycle. The perception of a person is defined as a further category. Only if a person is aware of existing transport options will these become an option for them. The social role of a person describes the role he or she assumes in society and includes role attributions and expectations ( 16 ). Socialization and identification with a social role is primarily related to the adoption of (typical) behaviors, opinions, and value attitudes of a group ( 17 , 18 ).
The influencing variables are interrelated and can influence each other. For example, if a person cannot ride a bike (competences), they are very unlikely to own a bike (resources).
Procedure and Key Characteristics of the Method
The method for quantifying mobility options is divided into five calculation steps. If all steps of the method are completed, a mobility options index (MOX) is calculated, which quantifies a person’s mobility options. The term index refers to the combination of several individual indicators that together form a new variable ( 19 ). In addition, analyses of individual calculation steps can already serve as indicators for the mobility options of individuals or groups of people. This method also considers the normative requirements of services of general interest in Germany.
Requirements of Services of General Interest
On the basis of the ROG, it must be ensured that POI providing services of general interest are accessible to all people living in Germany. The POI of general interest considered in this article are shown in Table 1. This paper considers the facilities of general interest that are most frequently mentioned in the literature, such as in the Participation Atlas of Germany ( 20 – 26 ).
The system of central places in is Germany an important instrument of spatial planning and the spatial organization of services of general interest. Central places are places that perform supply functions for the population beyond the needs of their residential population.
In Germany, a distinction is made between three hierarchically organized central locations: basic, middle, and upper centers ( 24 ). In the lowest level of the hierarchy (often called basic centers or sub- and small centers), everyday needs and thus the basic supply of the population should be covered. These include, for example, day-care centers, bakeries, and pharmacies. At the next level of the hierarchy (often medium-sized centers) are facilities and services for higher needs, such as hospitals and medical specialists. At the top of the hierarchy of central locations are upper centers. These are intended to cover the specialized higher needs. These include facilities such as universities, theaters and specialist clinics.
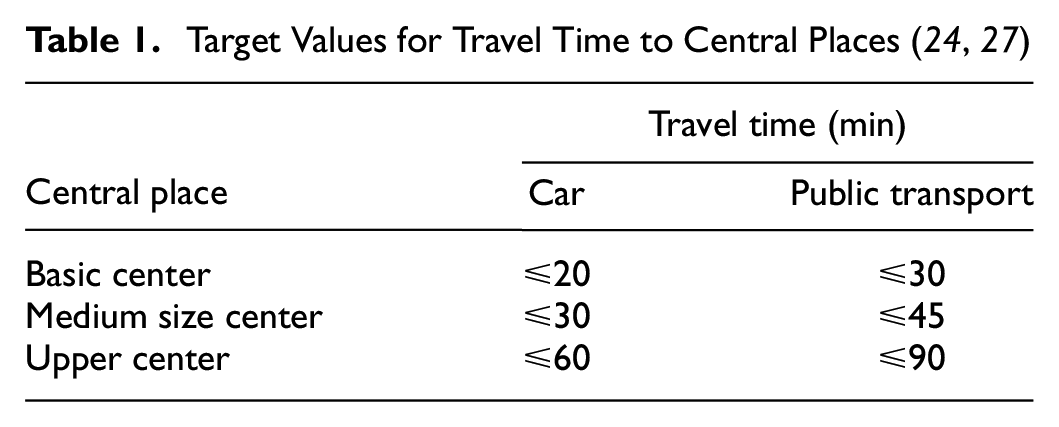
The Conference of Ministers for Spatial Planning (MKRO) has defined the following guideline values for the accessibility of central places based on motorized individual transport (MIT) and public transport:
For the purposes of this article, the target values travel time of the MKRO corresponding to the assigned central places are used as the reasonable travel time to reach the POI of general interest. The different POI are each assigned to a type of need and thus to a central place (Table 2).
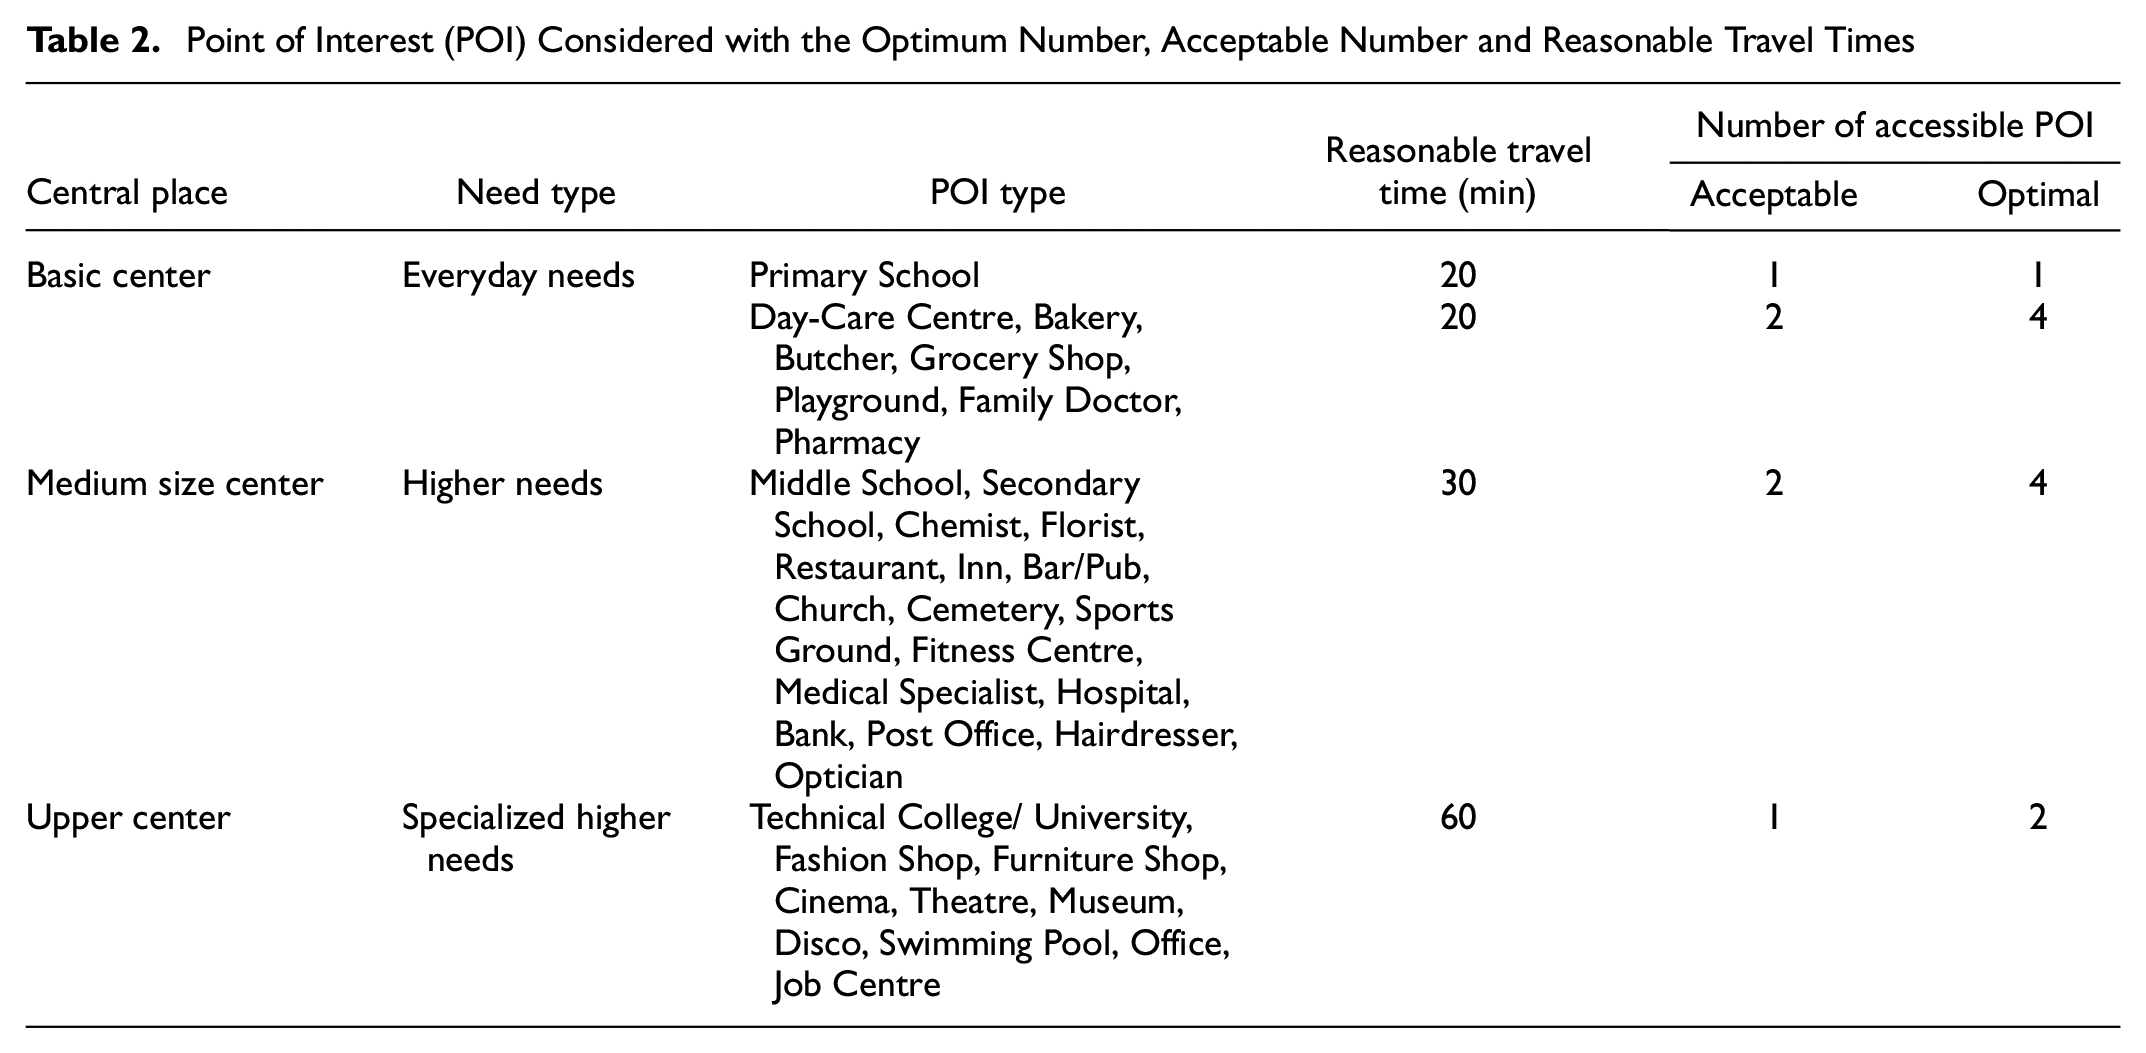
Point of Interest (POI) Considered with the Optimum Number, Acceptable Number and Reasonable Travel Times
In this article, reasonable travel times are chosen regardless of the mode of transport. On the one hand, this is justified because equivalent living conditions should be created for all population which favors the car over public transport, is contrary to compliance with the defined climate and environmental protection targets in Germany.
For the calculation of mobility options against the background of services of general interest and social participation, an ( 28 ) optimum number of accessible POI for each POI type (e.g., Hospital) is determined; this optimum number varies depending on the POI type and is also determined depending on the type of demand (Table 2).
A study conducted in Switzerland investigated how many different types of POI, such as grocery shops, are regularly visited. The researchers concluded that, overall, several POI of the same type are frequently visited, particularly for everyday and higher needs. As a result, the acceptable number of accessible POI was set to two for these types of needs ( 25 , 29 ). In contrast, POI catering to specialized higher needs are visited much less frequently, so having one accessible POI of this type was deemed acceptable. Unfortunately, there is no research on the optimal number of reachable POI for individuals. Therefore, it was decided that the optimal number would be set at twice the acceptable number. For instance, while two accessible grocery shops are considered acceptable, four accessible grocery stores are regarded as optimal. Since this optimal number was not derived empirically, a sensitivity analysis was conducted to examine the impact of varying the optimal number on the calculated mobility options. The analysis revealed that the chosen optimal number of accessible POI has only a minor influence on the calculated mobility options. The chosen optimal number of accessible POI has only a minor impact on the calculation of mobility options, since the so-called marginal utility is taken into account when evaluating the accessible POIs (step 3). This means: the closer you get to the optimal number of accessible POI, the lower the utility gain of an additional accessible POI (Gossen’s first law). The Assessment of the accessible POIs is described in more detail in the chapter “Step 3 Assessment of achievable POI.”
Primary schools are an exception when it comes to defining the acceptable and optimal number of accessible POI. In most federal states in Germany, there are fixed catchment areas for state primary schools. This means that the child is allocated to a specific primary school before the start of compulsory schooling, depending on where they live. As a rule, the child or the child’s parents cannot make this choice themselves ( 30 ). As this regulation does not allow a free choice of primary school, the method does not assume a choice of primary schools. For this reason, one accessible primary school is assumed to be both an acceptable and an optimal number.
Workplaces are not considered a traditional POI of general interest and therefore cannot be fundamentally assigned to a central place. According to the German Social Code (SGB), a daily commute (there and back) to a potential job of less than 2.5 h is generally reasonable for an unemployed person (§ 140 Absatz 4 SGB III). The reasonable travel time for one way is therefore 75 min. However, as the MKRO sets a maximum of 60 min per central places (for upper centers) when determining the target values for reasonable travel times, a reasonable travel time of 60 min is also used as the basis for reaching the workplaces. In addition, travel times of over 60 min can generally be said to be of low accessibility quality ( 21 , 27 , 31 ).
Similarly, the acceptable and the optimal number of accessible workplaces must also be determined separately. These must first be calculated for each study area. In this paper, acceptable and the optimal number of accessible workplaces for Germany are determined as an example. The simplified assumption is made that all workplaces in Germany are equally distributed spatially. The total number of workplaces is determined based on the number of working days reported in Germany (October 2023: approx. 45.8 million people) and the number of open workplaces (2023: approx. 0.8 million jobs). The total amounts to approximately 46.6 million workplaces in Germany ( 32 , 33 ). Assuming an equal spatial distribution of workspaces in Germany with a total area of 357,592 km2, there are 130 workspaces per km2. If a minimum achievable circular area of 1,257 km2 is assumed for each person, this results in a total of approx. 170,000 workspaces to be achieved with 130 workspaces per km2. This number is taken as the acceptable number of workspaces to be achieved. Analogous to the other POI, twice the number is taken as the optimal number (340,000 workspaces).
Step 1: Analyzing the Need for POI
Changes of location are purpose-bound in different ways and only in rare cases are they an end in themselves (e.g., when walking). The purpose of the trip can often be defined by the activity at the destination, for example, work or shopping. The activities carried out can be interpreted as forms of social and societal participation ( 12 ).
A person’s need for POI is therefore determined based on activity frequency and thus on the basis of POI that are relevant for a person. To identify suitable characteristics for grouping individuals, regression analyses were used to examine which characteristics influence different activity frequencies. The regression analysis was carried out on the basis of the MiD 2017 travel data set. Activity frequency and thus activity choice are based on the literature primarily determined by the personal characteristics of age, gender, employment, and household structure ( 34 , 35 ). Therefore, a linear regression was conducted for each activity frequency as the dependent variable, with the aforementioned personal characteristics as the independent variables. The regression analysis revealed that all considered factors influence the activity frequency according to the individual POI. Since the method can also be used in planning practice and therefore not an infinite number of groups are practical, the two factors with the greatest influence were chosen for group allocation: age and employment. It should be noted that this is, of course, a simplification, and other factors could also be considered for group allocation. Furthermore, it should be considered that the facts can partly influence each other and intersectionality could also be taken into account here.
To obtain representative values for Germany and thus enable the applicability of the method without a prior survey or analyses for a specific study area, this article derives the relevance of POI on the basis of the MiD 2017 travel data set for the whole of Germany.
The relevance of the POI is determined from the empirically recorded activity frequency. If an activity is visited very frequently, the relevance is higher than if an activity is visited rarely or not at all. However, some studies show that not every person’s mobility needs are actually met. So far, unmet travel needs have mainly been analyzed for older people ( 36 ). To exclude unmet mobility needs as far as possible, the analysis of activity frequency is only carried out for people who are not restricted in their mobility owing to health restrictions, monetary restrictions or very poor accessibility of destinations.
To calculate the relevance of the POI, the percentage of trips to the respective POI is calculated in relation to all trips. The calculated proportions represent the relevance of the POI for the corresponding group of people. POI that are frequently visited by the group of people are therefore assigned a high relevance and POI that are rarely or never visited by the group of people are assigned a very low relevance. For a person who works full-time, the relevance (rPG,typ) of reaching the workplace, for example, is 56%, reaching a drugstore is around 3% and reaching a school is 0%. A distinction is made between the following groups of people:
full-time employed (<25 years; 25–44 years, >44 years)
working part-time (<25 years; 25–44 years, >44 years)
marginally employed: that is, 11 to under 18 h per week
working as a part-time job or on an internship
child (cared for at home)
in kindergarten, in a crèche, with a childminder
at school (<10 years; 10–17 years; >17 years)
in vocational training
studying
housewife/househusband (<25 years; 25–44 years, >44 years)
currently unemployed
retired
Step 2: Determination of the Number of Accessible POI
In the second step of the method, the number of accessible POI is determined. This is based on the maximum reasonable travel time per POI determined in the previous chapter. All POI that can be reached in the maximum reasonable travel time are included in the calculation. The travel times are determined for each mode of transport, as travel times can differ significantly between different modes of transport. There are different options for determining the number of POI that can be reached for each destination option type and transport mode.
On the one hand, geographical information systems (GIS) such as QGIS or ArcGIS can be used. The freely available vector data from OpenStreetMap (OSM) can be used as the data basis for the POI. OSM data are available in high resolution for the whole of Germany and very often forms the basis for analyses based on routing-based questions ( 37 , 38 ). Various routing interfaces such as Here API or Google Routing API are available to carry out routing for different modes of transport. The interfaces are used to calculate isochrones with a defined travel time for population centers in the study areas and output them as polygons ( 39 ). The subsequent intersection of the isochrone polygons with the POI determines the POI that can be reached in the specified travel time for each mode.
In addition, the number of accessible POI can also be taken from commercial providers. For example, the fee-based software ArcGis offers the tool or toolset “Summarise nearby,” which outputs the number of accessible POI per POI type based on the specified travel times. The tool uses its own routable networks to determine the travel time to POI for each mode. ( 40 ).
If a transport demand model exists for the study area, this can also be used to calculate the travel times to the various POI types in the reasonable travel times. For the exemplary application of the method in this article, the existing VIS-H20 transport demand model of the Hannover Region was used.
With the help of a travel time-dependent weighting factor, it is considered that the attractiveness of POI decreases with increasing travel time ( 14 , 41 ).
The travel time-specific weighting factor is mapped using a quadratic function. The weighting factor can assume values from 0 to 1. A travel time of 0 min results in a maximum weighting factor of 1. The function is mapped in the definition range from 0 to tmax with a downward-opening parabola with the high point at (0|1). Destinations that are close to the place of residence are therefore included in the calculation to a greater extent than destinations to which a longer travel time is required. To ensure that the negative gradient of the function increases as the travel time increases, the weighting factor is mapped using a quadratic function and not a linear function. The longer the travel time to the destination in question, the more the weighting factor decreases. The function is illustrated qualitatively in Figure 2.
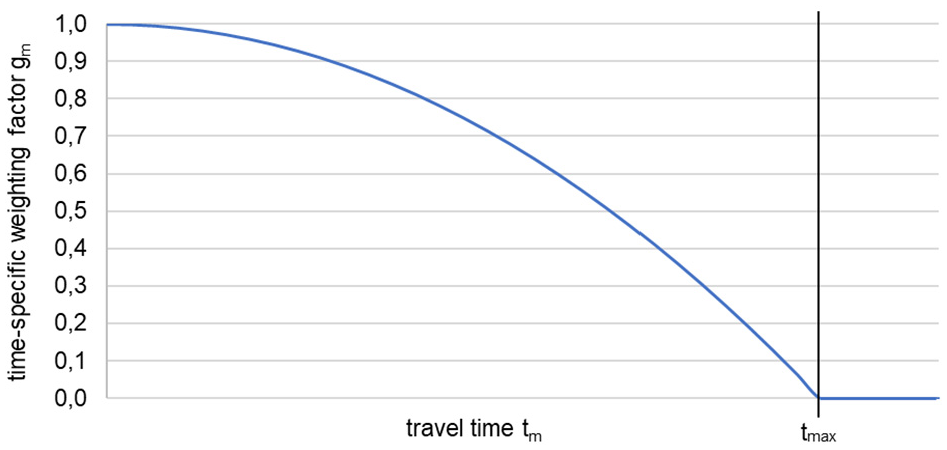
Function of travel time specific weighting factor.
With the help of this continuous function, no hard boundary is drawn between the reasonable and unreasonable travel time (fuzzification). If the maximum reasonable travel time is exceeded, the weighting factor is 0 and the corresponding POI does not count as an achievable POI.
The travel time specific weighting factor is calculated as follows (Equations 1 and 2):
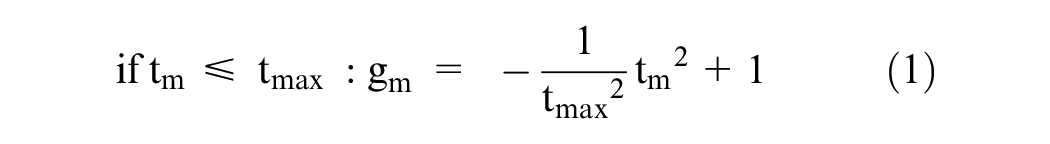

tm: Travel time with mode of transport m
tmax: Maximum reasonable travel time
gm: Travel time specific weighting factor for mode of transport m
The travel time-dependent sum of reachable POI is calculated for each type and mode of transport (Equation 3):

POITyp: Quantity of achievable POI of the POI type Typ
Step 3 Assessment of Achievable POI
To aggregate the weighted number of reachable POI of POI type (
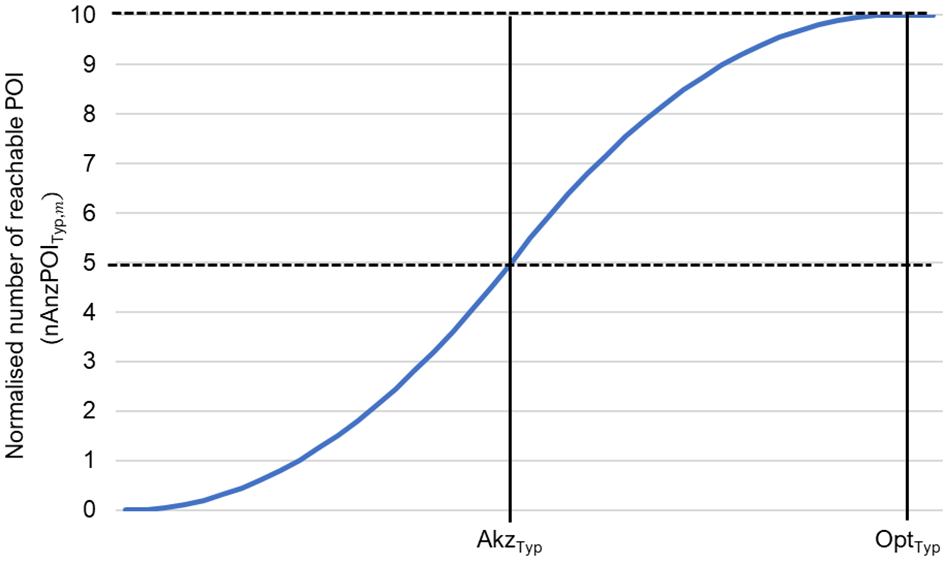
Determination of the normalized number of reachable point of interest (POI).
If the acceptable number of POI of the corresponding type is reached, 5 points are awarded. If the optimum number is reached, 10 points are awarded. Piecewise quadratic interpolation is performed between the values 0, AkzTyp and OptTyp. This creates an inflection point at (AkzTyp | 5). The gradient of the function is therefore greatest at x = AkzTyp. The normalized value therefore changes the most for an achievable number close to the acceptable number.
A saturation function is imitated between AkzTyp and OptTyp, which approaches the limit value 10 with a decreasing gradient. The first Gossen’s law (also called saturation law or Law of Diminishing Marginal Utility), which Gossen described in 1854 in “Entwicklung der Gesetze des menschlichen Verkehrs und der daraus fließenden Regeln für menschliches Handeln,” is taken into account here ( 42 ). This law states that the benefit of consuming an additional unit of a good decreases with each additional unit consumed ( 42 , 43 ). Transferred to the number of achievable POI of a type, this means that the marginal utility decreases the more POI of a type can be achieved. The increase in utility of a further achievable POI therefore becomes smaller and smaller until saturation occurs ( 43 ).
Normalized number of reachable POI is calculated as follows (Equations 4 to 8):

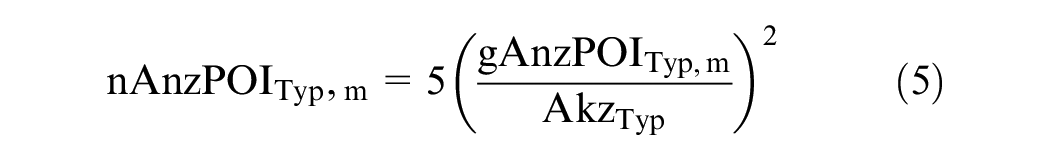

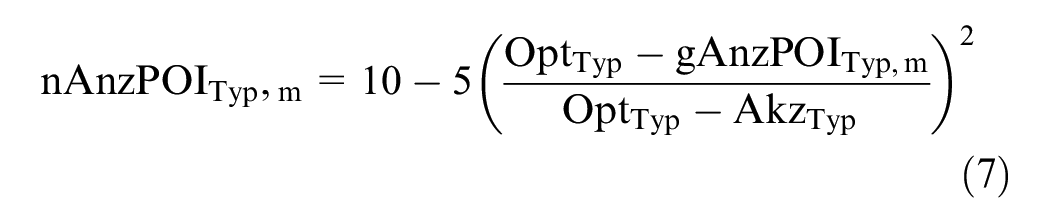

AkzTyp: Acceptable number of achievable POI of one type
OptTyp: Optimal number of achievable POI of one type
nAnzPOITyp,m: Normalized number of reachable POI of a type with mean of transport m
As the definition of an acceptable and optimal number of achievable POI to be achieved is partly based on assumptions, these values are checked using a sensitivity analysis. The effects of a higher and lower acceptable and optimal number of achievable POI to be achieved on the result of the method are analyzed. The result of the sensitivity analysis is that the change in the optimum number of achievable POI only has a minor influence on the results of the method. When varying the optimum number of achievable POI, the developed method shows a high degree of robustness.
If the acceptable number is reduced to the absolute minimum of one achievable POI per type, the mobility options are increased, particularly for the public transport and cycling modes. When applying the method and interpreting the results, it should therefore be considered that the method is based on a certain choice of POI options. If this selection option were not taken as a basis, the calculated results for public transport and cycling would be partly higher.
Step 4: Consideration of Income Effect
Since income plays a special role in a person’s resources, it is considered separately. As a monetary resource, income can compensate for other personal restrictions. For example, an individual can pay for a taxi if no car is available to them. There are costs for other forms of transport as well. For example, car trips require petrol and a ticket has to be purchased for public transport.
The assumption is made that for every activity outside the home there is a financial challenge regardless of the means of transport. Even if trips are made on foot, suitable footwear and other aids, such as a trolley, are needed to transport shopping. In addition, income resistance should also take into account trips to activities outside the home that go beyond everyday mobility. This means, for example, taxi trips that are only made in exceptional cases because an activity outside the home cannot be reached by public transport.
To derive an income effect related to income, the expenditure for the object “transport” in the sample survey on income and consumption (EVS) as well as the number of activities outside the home based on the MiD 2017 are considered. The EVS is a regularly conducted household survey of official statistics in Germany. It collects information on income and expenditure, housing conditions, and financial and material assets, among other things ( 44 ). The values used here come from the results on the income, revenue and expenditure of private households.
The expenditure on transport based on the EVS and the number of activities carried out outside the home of all household members based on the MiD were merged on the basis of the classes of household net income. Table 3 shows the intersection of the data. Missing data were interpolated linearly (shown in italics). An interesting finding is that the number of activities outside the home per month remains unchanged up to an income of 1,500–2,000 euros. Only when income continues to rise will the number of activities outside the home increase. This indicates a base minimum of household activity needed.
Intersection of Transport Expenditure (Based on EVS 2018) and Number of Activities Outside the Home
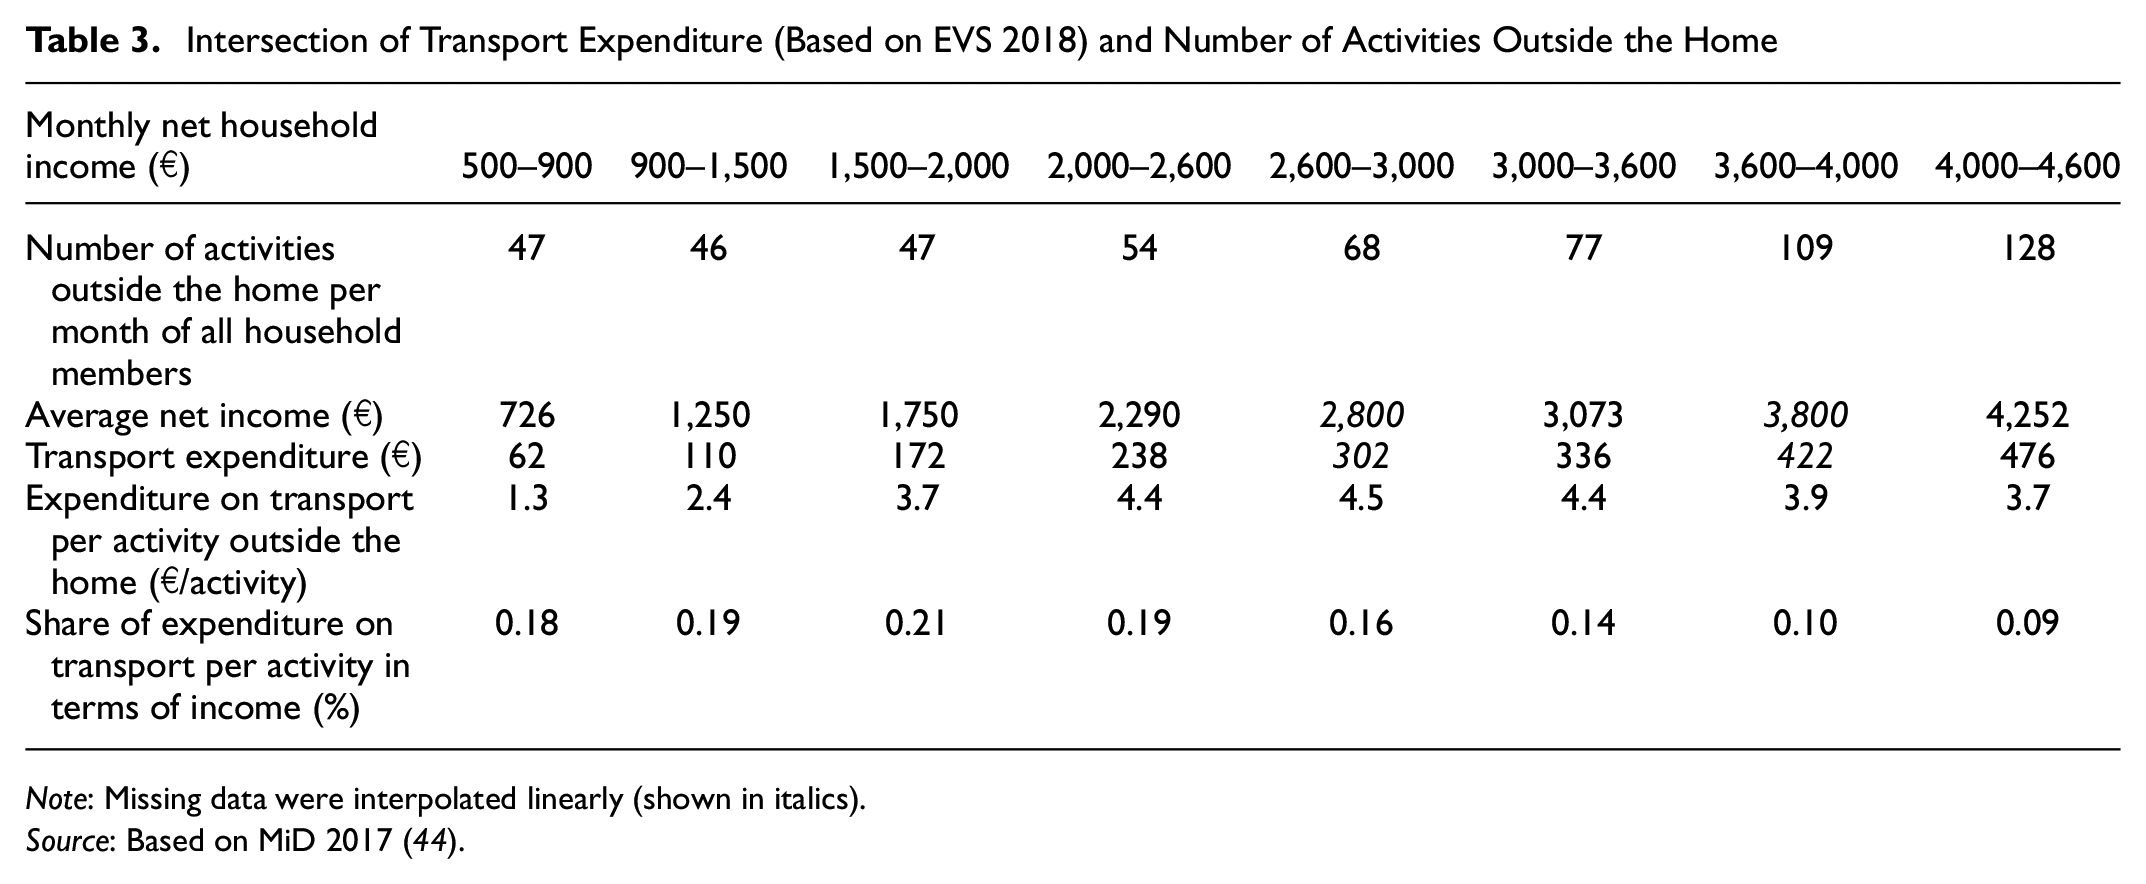
Note: Missing data were interpolated linearly (shown in italics).
Source: Based on MiD 2017 ( 44 ).
Figure 4 shows the expenditure per out-of-home activity and the share of expenditure per out-of-home activity in income. As expected, transport expenditure per activity away from home tends to rise with increasing income class, for example owing to the use of more expensive means of transport. However, the share of transport expenditure per out-of-home activity in income falls as the income class rises. The monetary burden of carrying out activities away from home therefore decreases for financially better-off households. Low-income households therefore have to spend a much larger proportion of their total budget on mobility than households with a higher income ( 45 , 46 ). Only the costs that have to be incurred to achieve the activities are considered here. Costs for the realization of an activity, for example for admission to a leisure event, are not considered and can represent an additional barrier, especially in the case of paid offers.
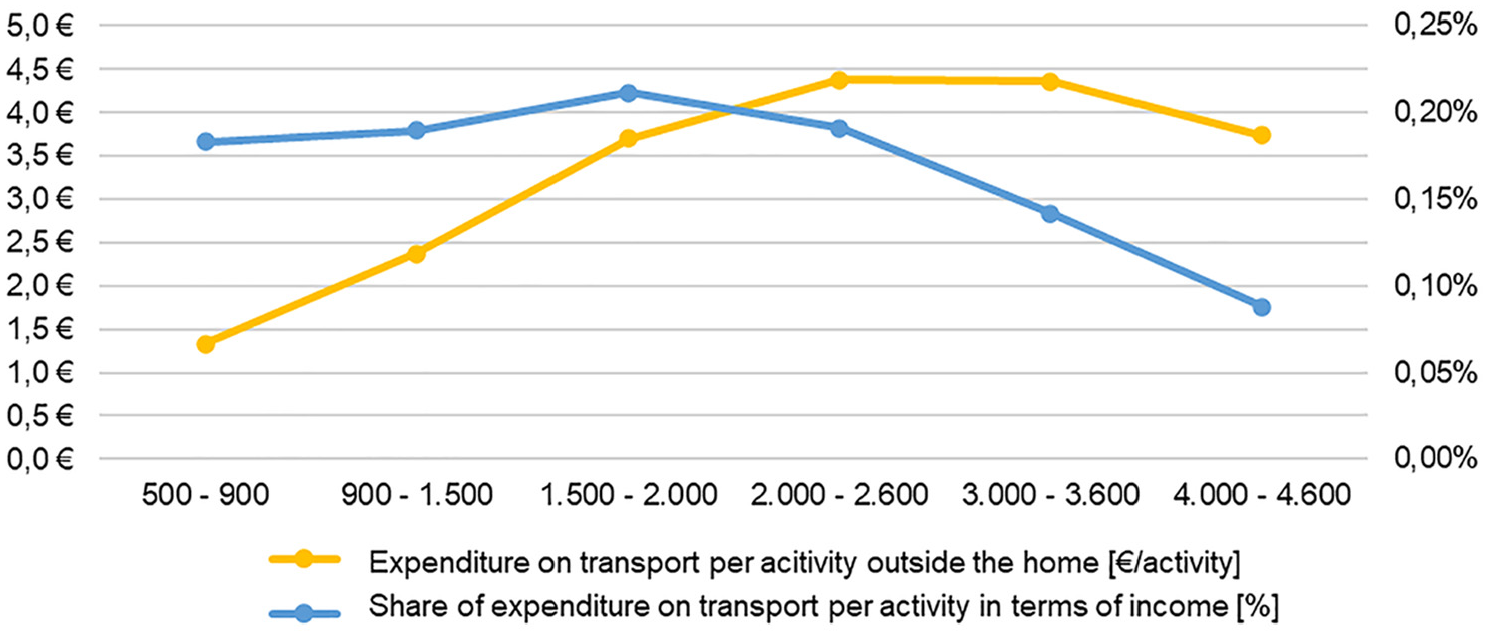
Transport expenditure per outside activity depending on monthly household net income.
The correlation shown is converted into an income effect function, which states that the resistance to undertaking an activity outside the home decreases as net household income increases. According to the EVS, the national median household income was €3,661 in 2018 ( 44 ). At this household income level, the factor should assume 1, which is why the share of expenditure per trip is normalized to this value. With higher income, the factor should become lower and, with lower income, the factor becomes higher. To derive a continuous income effect function, a curve fitting is carried out using a regression model. The exponential regression between the normalized share of expenditure per trip (independent variable) and the net household income (dependent variable) shows a highly significant result (p < 0.001). For the income effect function according to household income, the following function results with a coefficient of determination of R2 = 0.9 (Equation 9):

w(H): Income effect based on income H
H: Income (€)
The coefficient of determination R2 describes the proportion of the variance of the dependent variable that is explained by the independent variable. The coefficient of determination can assume values between 0 and 1. The higher this value, the better the variance of the dependent variable is explained.
The income effect function is monotonically decreasing with a horizontal asymptote. The slope of the function decreases with increasing income so that at higher incomes the income effect decreases only slightly.
Income is always calculated on the basis of household income. The same (total) household income is recognized for each person in a household.
Taking into account the variables calculated in steps 1 to 3, the mode-specific MOX for each group of people is calculated using the following function (Equation 10):
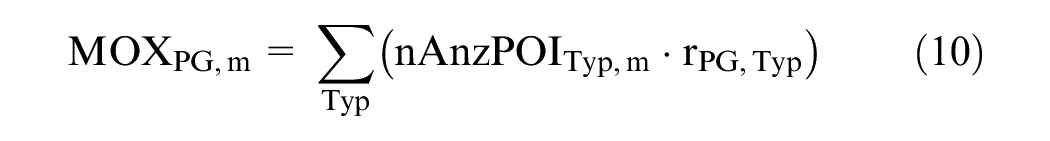
nAnzPOITyp,m: Normalized number of reachable POI of a type with mean of transport m
The MOXPG,m can be used to analyze the mode-specific mobility options. It thus offers the possibility of comparing mobility options based on different modes of transport and different groups of people. It can provide initial information about the districts in which there are few mobility options available per se concerning individual modes of transport. As it differentiates between groups of people and presents different modes of transport separately, this indicator also goes beyond conventional accessibility indicators, which are generally used in transport planning. The person-related MOXP is then calculated as follows (Equation 11):

MOXP: Mobility option index of person P
w(H): Income effect based on income H
H: Income of person P
MP: Modes of transport available to person P
m: Mode of transport
Exemplary Application of the Method
With the help of two household surveys conducted as part of the Social2Mobility research project in the town of Ronnenberg (small town in the Hanover region), the method is applied as an example. Social2Mobility is funded by the Federal Ministry of Education and Research and has a total duration of 5 years. The first survey was conducted in autumn 2020 and the population consisted of all households with children in the town of Ronnenberg. A total of 1,031 people took part in the survey. The second survey was also carried out in Ronnenberg in autumn 2022 without a focus on a specific household type. The net sample of the second survey consists of 259 persons.
Figures 5 to 8 show an exemplary evaluation of the MOXPG,m for the group of people “full-time employed (25–44 years).” Ronnenberg has diverse spatial structures. To the north, it borders directly on the state capital of Hanover and has a very urban character. The further south you go in Ronneberg, the more rural the structure becomes. The Ronnnberg study area was therefore selected because it would also allow evaluations of mobility options in different land use structures. The analysis shows that in rural areas, a MOXPG,m of over 8 points is achieved exclusively by private car in the entire study area. The principle of the car-friendly city has prevailed since the 1950s. Cities were often planned and designed for the use of a car ( 47 ). The influence of the different land-use structures is particularly evident in the modes of cycling and public transport. While cycling in the urban districts achieves a MOXPG,m of 8 to 10—absolutely sufficient—this is not the case in the rural areas south of Ronneberg (Figure 7). The public transport also shows that the MOXPG,m (Figure 8) becomes increasingly lower the further south, and thus more rural, the land-use structure becomes.
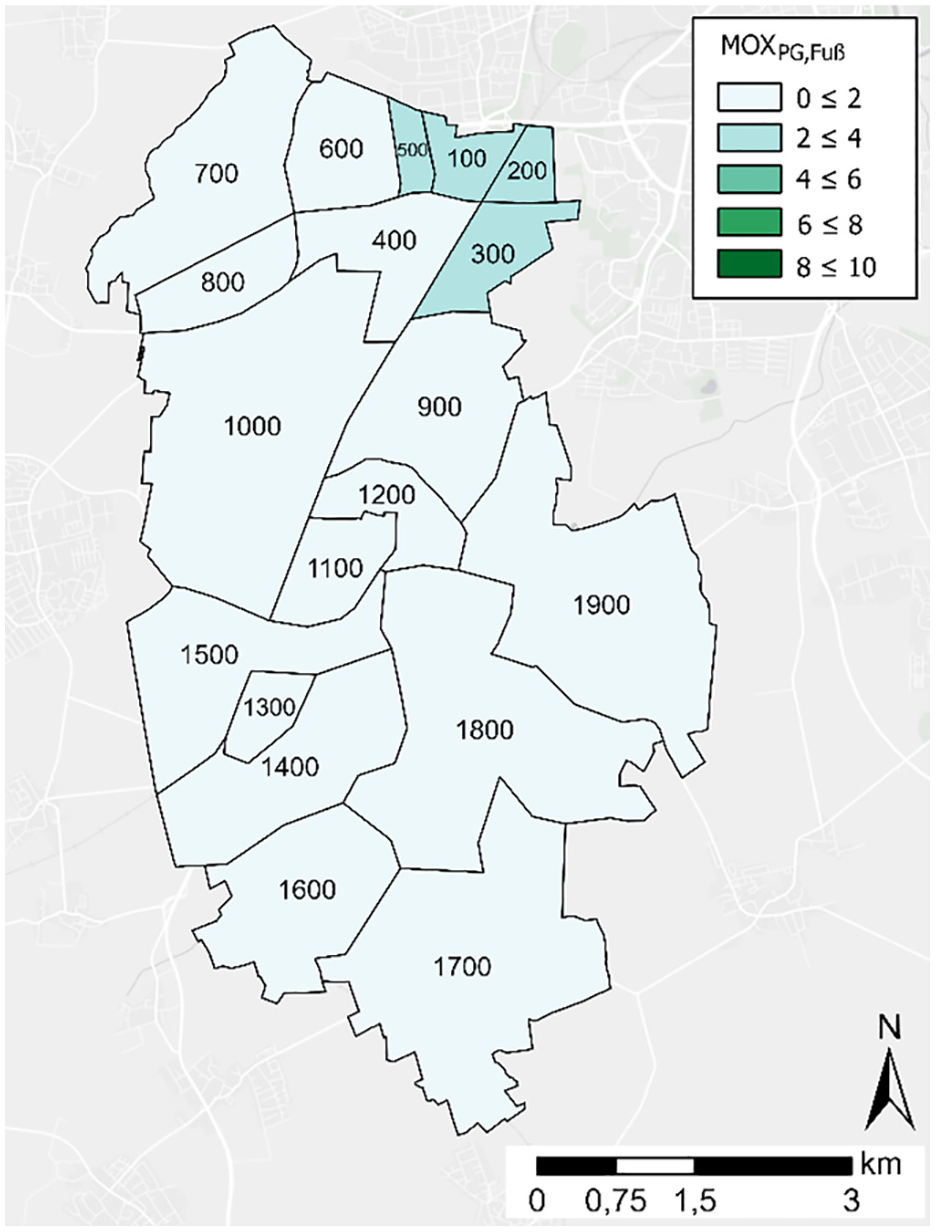
MOXPG,m with the mode walking.
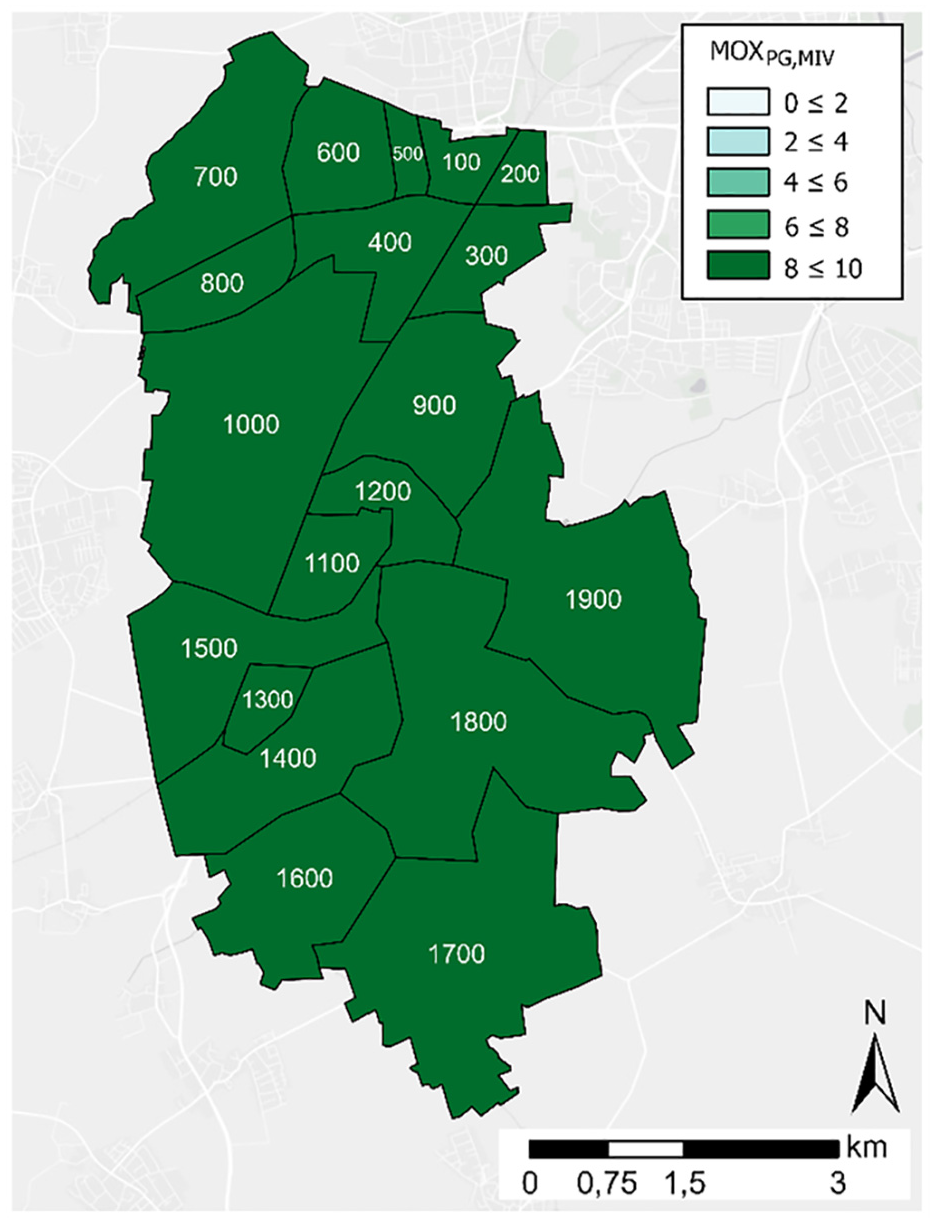
MOXPG,m with the mode car.
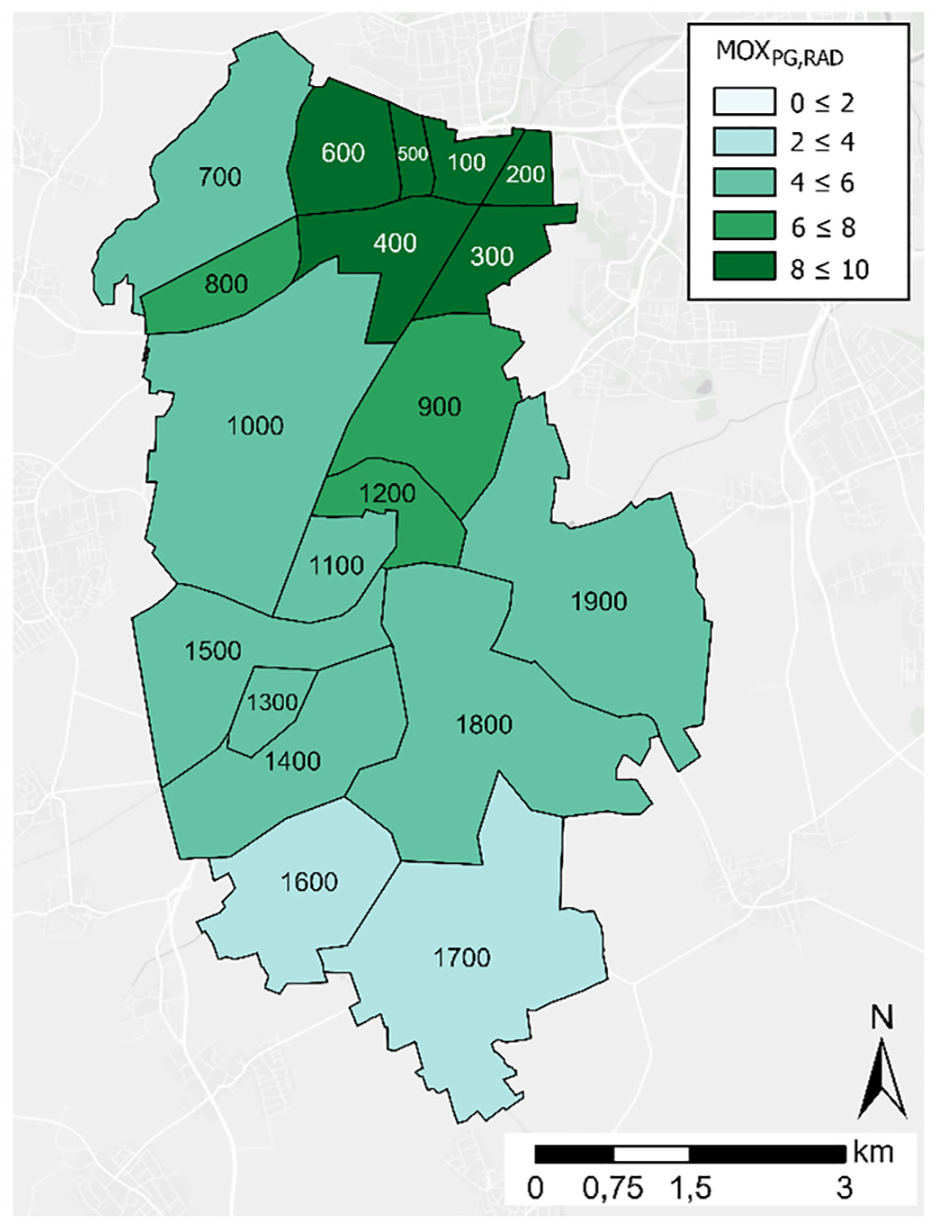
MOXPG,m with the mode bicycle.
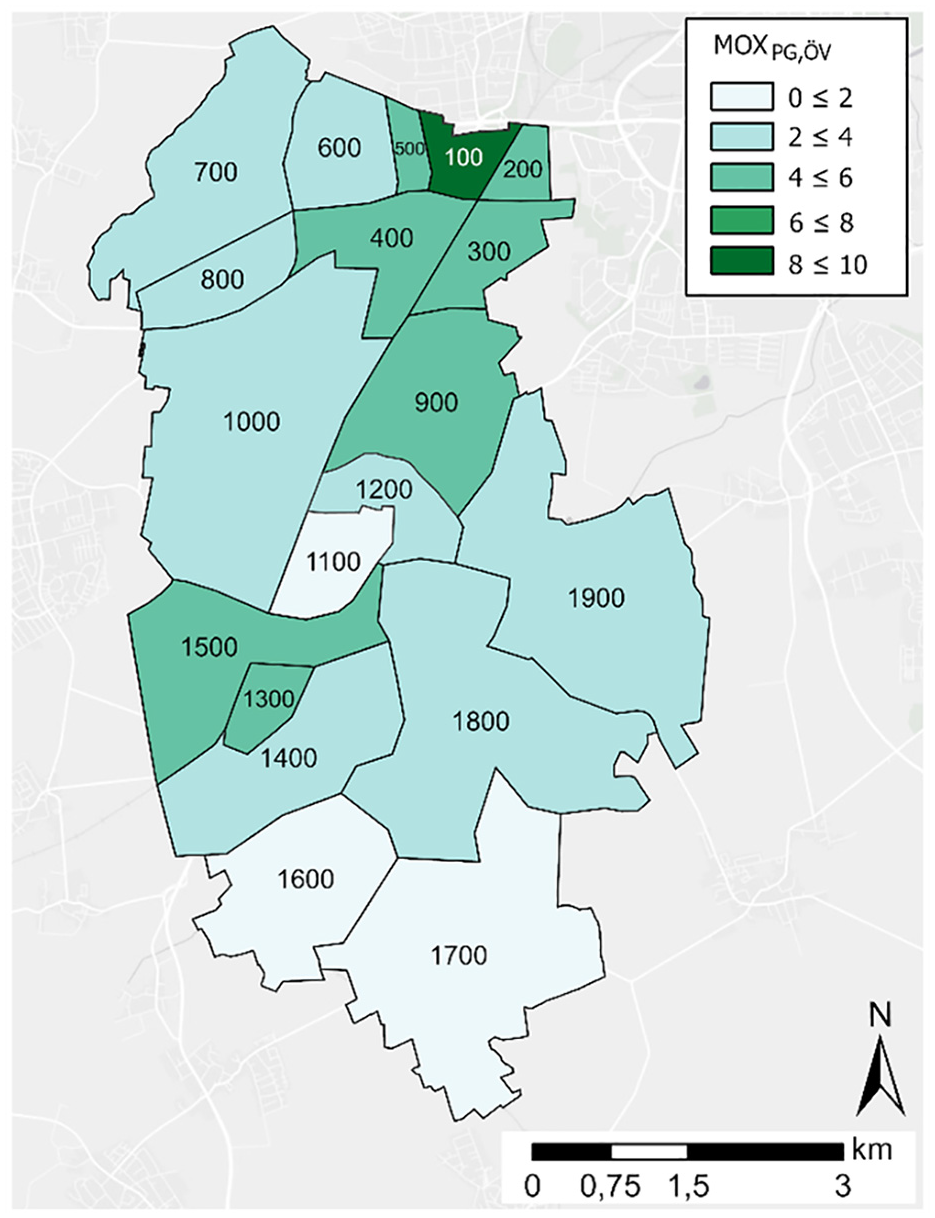
MOXPG,m with the mode public transport.
It is therefore obvious and understandable that people with a private car have many mobility options. At the same time, the high value placed on the private car becomes clear here, so that even people with a low income prefer to save money in other areas of life to own a car ( 48 ). This phenomenon is called “forced car ownership” and is known from other research in Europe, especially for households with children ( 49 ). The MOXPG,m by bike and public transport varies greatly between the individual districts. The MOXPG,m on foot is very low in all districts. People who make only trips on foot therefore have very few mobility options and the risk of mobility-related social exclusion is high. If people have neither a car nor a bike and the use of public transport cannot be financed, this is also referred to as “forced walking” ( 50 ).
In contrast to the MOXPG,m, individual characteristics are included in the calculation of the MOXP. Among other things, the MOXP can be used to analyze the mobility options of different persons and compare them with one another. In inequality research, the inequality categories of class, race, gender, and physical ability are frequently mentioned and analyzed ( 51 – 53 ). These inequality categories are understood as structural categories that generate inequality in various contexts, such as unequal access to the labor market, education or mobility options. In addition to these structural categories, the group of single parents is often categorized as particularly vulnerable and disadvantaged in the social policy debate on accessibility deficits and mobility poverty ( 12 , 14 ).
To examine the extent to which these inequality categories affect the mobility options, the people are subdivided according to the above categories and the average MOXP of each group is calculated. The average MOXP of the individuals, differentiated according to the structural categories mentioned, is shown in Figure 9. As the net household income of the individuals is included both in the calculation of the MOXP through income effect w(H) and in the determination of the at-risk-of-poverty variable, there is an obvious correlation between the MOXP and the at-risk-of-poverty variable. For this reason, the MOXP was also calculated for each person without taking income effect into account and compared for the at-risk-of-poverty variable.
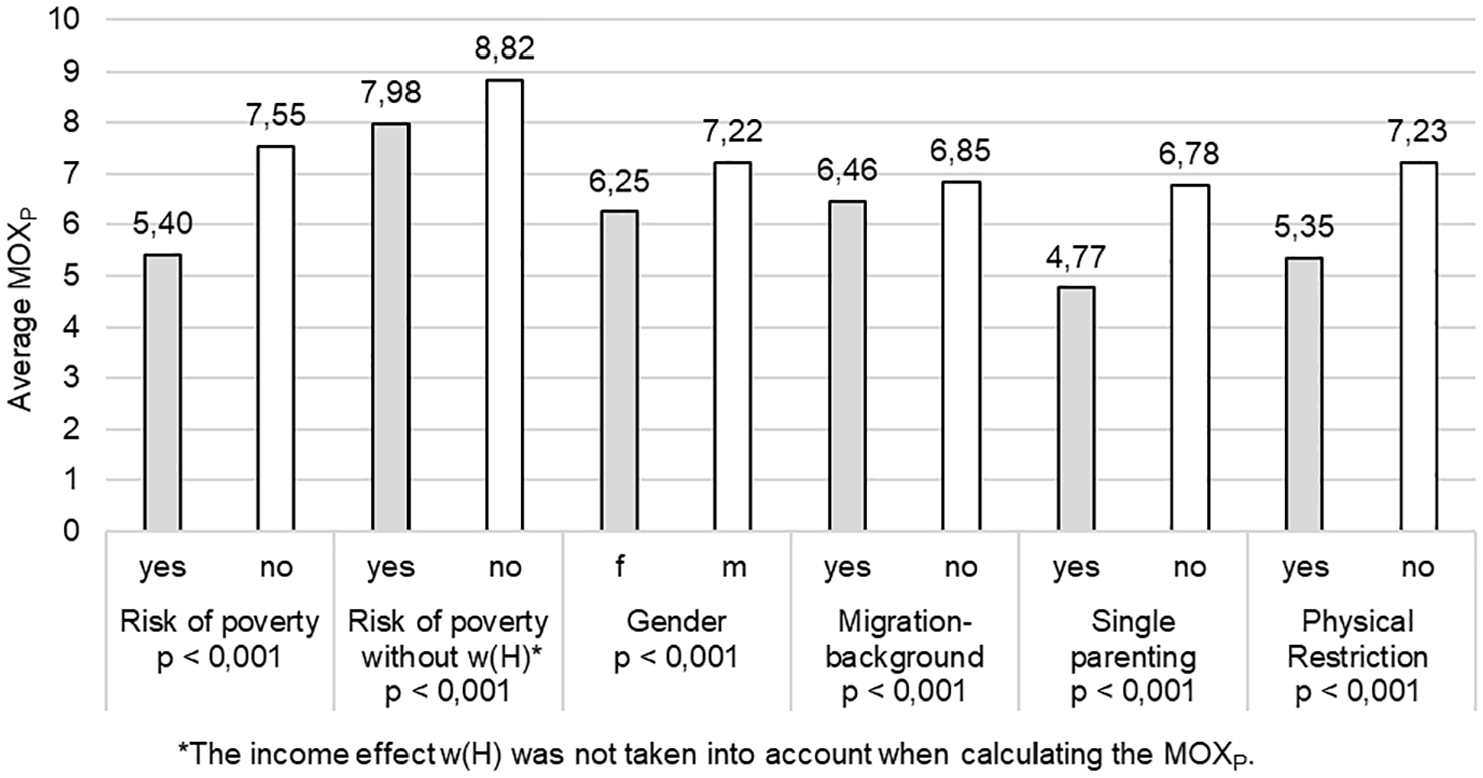
Average MOXP by different structural categories based on the second household survey in Ronnenberg in 2022.
The Mann–Whitney U test is used to test the extent to which the average MOXP differs significantly owing to the structural categories. In addition, the effect size r is calculated for further interpretation (Table 4). As can be seen in Figure 9, there is a highly significant difference between the groups for all structural categories considered (p < 0.001). People at risk of poverty, for example, have significantly fewer mobility options than people who are not at risk of poverty. This result is also evident if income effect is not taken into account when calculating the MOXP. Here, people at risk of poverty have an average MOXP of 7.98 points and people not at risk of poverty have an average MOXP of 8.82 points.
Calculated Effect Sizes for the Analysis of the MOXP Based on Different Structural Categories
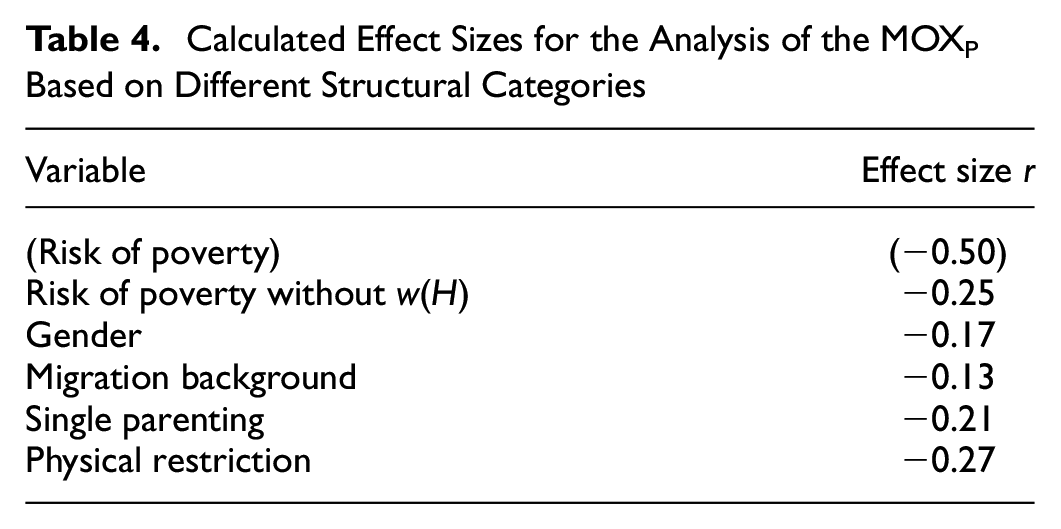
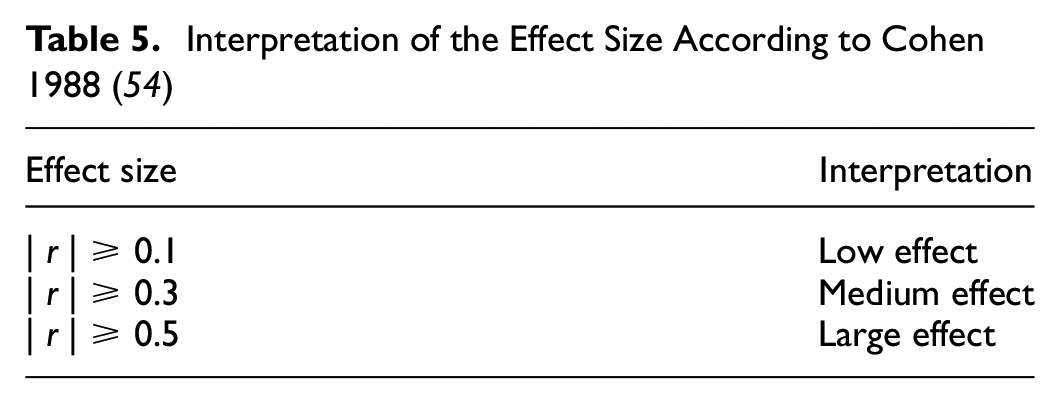
The effect size r can assume values between −1 and 1. To interpret the effect size, the limits of Cohen ( 54 ) are applied (Table 5).
Interpretation of the Effect Size According to Cohen 1988 ( 54 )
Since, as described above, the person’s net household income is included both in the calculation of the MOXP and in the determination of the at-risk-of-poverty variable, the “at-risk-of-poverty” variable is excluded from the interpretation of the effect sizes and the “at-risk-of-poverty without w(H)” variable is taken into account instead. A person’s risk of poverty has a negative impact on their mobility options. The risk of poverty or a low income is very often cited as a cause of mobility poverty and mobility-related social exclusion ( 2 , 3 , 55 ). The quantitative analysis presented here using the MOXP confirms that people who are at risk of poverty have significantly fewer mobility options available to them and are therefore more likely to be restricted in their social participation. At the same time, qualitative interviews were also conducted with households with children and older people at risk of poverty in the same study area. These also showed that low income limits people’s mobility and increases the risk of mobility-related social exclusion ( 56 , 57 ).
Some studies have shown that mobility behavior differs between the sexes. For example, women walk more often and use the car less frequently than men. Women are also much more likely to carry out care work, for example ( 58 , 59 ). Care work includes activities such as fetching and bringing children or caring for family members at home. The evaluation of the MOXP shows that not only mobility behavior, but also mobility options differ significantly between women and men. Women therefore have fewer options for changing location, although they have more complex mobility behavior, particularly owing to the higher proportion of care work. Results of the Germany’s Mobility in Cities survey (SrV) 2018 show, for example, that women between the ages of 15 and 60 travel significantly more distances than men and are highly mobile owing to the organization of complex daily routines ( 60 ).
There may be various reasons why women have a significantly lower MOXP than men. For example, women have a lower driving license and car availability than men ( 48 ). Women are therefore more likely to use public transport than men. Analyses of the MOXPG,m show that fewer mobility options are reached by sustainable mobility compared with the car, even in the urban evaluation districts.
As Figure 9 shows, people with a migration background have a significantly lower MOXP than people without a migration background. Other studies show that cycling mobility in particular differs between people with and without a migrant background ( 61 ). People with a migration background use the bicycle less frequently, have lower cycling skills and lower bicycle availability. Car availability generally does not differ between people with and without a migration background ( 61 ). It should be noted here, however, that mobility behavior differs greatly depending on the different regions of origin. It is assumed that the mobility options within people with a migration background also vary according to the different regions of origin. However, as the region of origin was not recorded in the surveys used as the basis for this study, this analysis cannot be further specified.
Single parents are very often named as a potential risk group in studies on mobility-related social exclusion. They have a comparatively high poverty risk rate and are under great time pressure ( 12 , 62 ). As Figure 9 shows, the MOXP is significantly lower in single parents than in other people. The potential risk group assumed in the literature can therefore be confirmed.
People who are physically impaired also have significantly fewer mobility options than people who are not physically impaired. The term “physically impaired” is used here to summarize all people who cannot walk, see or hear to their full extent or who are restricted owing to other health problems. That people with physical limitations may not be sufficiently mobile is known in particular from research on people with disabilities. The mobility of people with disabilities is therefore characterized by mobility-restricting barriers ( 63 ).
The household survey also asked about people’s subjective perceptions of accessibility problems. If this variable is compared with the MOXP, it becomes apparent that they correlate negatively with each other. This means that the higher the person’s mobility options index, the lower the subjectively perceived accessibility problems. This result supports the validity of the newly developed index.
Conclusion
In this paper, a method was developed that quantifies the mobility options of individuals based on (freely) available or easily collected data. If all calculation steps of the procedure are run through, an index with a value range from 0 to 10 is calculated, which depicts the mobility options of individuals. In addition to characteristics of “objective” accessibility, the method also takes into account individual characteristics of people. With the help of the method, the mobility options can be analyzed both spatially and per population group. The application of the method allows for a quantitative analysis of mobility-related social participation among the population in a study area.
On the one hand, the method developed can be used to obtain scientific findings on the impact mechanisms of mobility options on the basis of statistical analyses based on quantitative variables. For example, the method was used to prove that women and people with a migration background, among others, have significantly fewer mobility options than other people. It was also shown that people who only perform all their trips by walking have too few mobility options to be able to participate sufficiently in society.
On the other hand, the method can be used to identify and spatially localize problems in transport and social planning. The knowledge thus gained about the mobility options of the population in a study area can be used to develop and justify interventions. In sustainable urban mobility planning, the method can be integrated into all planning phases. As the MOXP can be used to analyze the impact of measures with reference to increasing mobility options, the method can be used when investigating measures. People with insufficient mobility options in particular benefit because this (social) effect is taken into account in the evaluation of transport measures.
When considering the usability of the results, a distinction must be made between the usability of the method and the findings based on the exemplary application of the method in this paper. The method was developed to be applicable in Germany with the help of (freely) available data. It is based on German normative public service requirements, such as the maximum travel times per mean of transport set in Germany and data regularly collected in throughout Germany. In principle, the method itself is also applicable in other countries, but may need to be modified and based on other target values. During the development of the method, care was taken to ensure its practical applicability. Therefore, some conditions were set. For example, the bicycle resource does not consider whether it is fully functional. Such details, for example, are not considered in the method.
The findings based on the exemplary application (e.g., that women have fewer mobility options than men) are meaningful for the study area under consideration. Nevertheless, it can be assumed that this evaluation will be similar for other cities in Germany with a similar structure. Since other literature, some of which is described in the presentation of the results also fits the evaluations of this paper.
Footnotes
Author Contributions
The authors confirm contribution to the paper as follows: study conception and design: Henkel, Sommer; data collection: Henkel; analysis and interpretation of results: Henkel, Sommer; draft manuscript preparation: Henkel. All authors reviewed the results and approved the final version of the manuscript.
Declaration of Conflicting Interests
The authors declared no potential conflicts of interest with respect to the research, authorship, and/or publication of this article.
Funding
The authors disclosed receipt of the following financial support for the research, authorship, and/or publication of this article: The research project “Social2Mobility,” which this paper is partly based on, has been financed by the German Federal Ministry for Education and Research (grant number 01UR1803A).