
Abstract
Biochar is produced by pyrolysis of various wastes and is considered a promising construction material aimed to replace or supplement ordinary cement or supplementary cementitious materials owing to its low-carbon, environment-friendly characteristics, and waste management benefits. However, the large variance in properties among different biochars is a challenge for understanding and controlling its physical–chemical–mechanical roles in cementitious mixtures. In addition, the unique water retention characteristics of biochar and its influence on the overall performance of cement composites are not fully understood. This study examines the effects of biochar characteristics (e.g., chemical composition and saturation state) on cement paste properties, particularly focusing on early-age hydration and fresh properties. We performed a set of laboratory measurements that includes (a) the characterization of fundamental properties of biochars, (b) the hydration behavior of cement pastes infused with biochar, and (c) the compressive strength of cement paste samples cured up to 7 days. The results show that incorporating biochar affects early-age behavior and fresh properties of cement paste such as setting time, workability, hydration kinetics, and rheological behavior. In addition, those effects depend on biochar’s physical, chemical, and morphological characteristics. The physical characteristics of biochar associated with surface area, particle size, and water absorption-retention capacity tend to control the overall early-age performance of cement paste. Incorporating 5 wt% biochar can improve the compressive strength of cement paste. While the Si-rich biochar (rice husk biochar) exhibited noticeable pozzolanic reactivity, its effect on early-age hydration was not significant at up to 5 wt% examined in this study.
Keywords
Reducing carbon dioxide (CO2) emissions and achieving carbon neutrality have long been recognized as effective strategies for mitigating global warming and climate change. Given the significant CO2 emissions associated with cement manufacturing, governments worldwide are requiring the concrete industry to utilize low-carbon materials to control greenhouse gas emissions. Furthermore, with looming CO2 global taxation rates of 2 United States dollars (USD) to 168 USD per equivalent short ton of CO2 produced ( 1 ), the importance of evolving concrete toward low-carbon materials has continuously gained attention.
Biochar, derived from the pyrolysis of organic waste material, agricultural leftovers, sewage sludge, and various biomass wastes under limited oxygen conditions, is considered a promising low-carbon material ( 2 , 3 ). Biochar can stabilize and store carbon during the pyrolysis process ( 4 ). The potential impact of biochar on CO2 reduction varies depending on the feedstock type and pyrolysis conditions, but it is estimated to be between 2.0 to 2.6 tonnes of trapped CO2 for each tonne of biochar ( 5 ). When integrated with a concrete system, biochar’s porous structure and high surface area can potentially absorb CO2 from the environment, acting as a diffusion channel and providing additional nucleation sites for stable carbonate formation ( 6 , 7 ).
Various studies have analyzed the effect of biochar on the performance of cement composites. Choi et al. ( 8 ) used 5 wt% of hardwood-derived biochar as a cement replacement and found that water released from biochar inside the mortar specimen led to strength increases of about 12 % at 28 days of curing. However, biochar itself is inherently weak and generally induces a strength drop when used at high replacement levels in the mixture. Biochar can also retain a large volume of water and therefore can provide internal curing benefits to improve the durability of concrete (e.g., reduced permeability and improved long-term hydration) ( 5 ). Biochar incorporation helps improve the rate of early-age hydration by providing additional surface area for the nucleation of hydration products and by reducing the water-film thickness of cement particles, leading to closely spaced and bridged particles ( 9 ). It can be concluded that most of the performance changes in biochar-cement composites are affected by biochar’s high surface area, porous structure, water absorption capacity, and internal curing effect.
As biochar’s water absorption capacity is considered one of the key parameters contributing to the performance of biochar-cement composites, previous studies have investigated the influences of using dry versus pre-saturated biochar in a mix. Gupta and Kua ( 10 ) used dry and pre-saturated wood sawdust-derived biochar and found that pre-saturated biochar improved strength and reduced permeability, which is expected to lead to better durability. Additionally, pre-saturated biochar showed reduced compressive strength under internal carbonation conditions ( 11 ). This occurs because CO2 dissolved in the water film near the biochar enhances early carbonation rates, leads to the decalcification of calcium hydroxide (CH) or calcium silicate hydrate (C-S-H), and weakens the interfacial transition zone between the paste and aggregates. The authors used the following cement chemistry notation in this study; C: CaO, S: SiO2, and H: H2O. These findings underscore the importance of determining the proper preconditioning before implementing biochar.
Those studies indicate that biochar chemical composition and saturation state before mixing affect the properties and performance of cementitious composites. Most studies have focused on the carbon capture efficiency, mechanical and durability properties of biochar-infused cementitious composites, but the biochar’s unique water retention and its influence on early-age performance still have not been fully explored. In addition, biochar’s physicochemical properties depend greatly on its feedstock and production method, which can result in differing effects on the cement hydration process. This variability is a major challenge for fully understanding and controlling biochar’s physical, chemical, and mechanical roles in cementitious mixtures. That variability is a primary reason why biochar has not been adopted more widely in the construction industry. In addition, for the practical implementation of biochar as a construction material, examining early-age performance is just as crucial as assessing long-term performance, as it can significantly influence the concrete requirements for most construction projects.
To address these challenges, this study explores how the chemical composition and saturation conditions of biochar, before mixing, influence the properties of cement paste, with a particular focus on early-age performance. We use two widely differing biochars to better elaborate on how biochar characteristics influence early-age hydration and fresh properties, employing a suite of laboratory measurements to characterize fundamental properties of biochars, their influence on early-age properties and hydration behavior of cement paste, and their effects on the compressive strength of hardened cement pastes cured up to 7 days.
Materials and Methods
Raw Materials
Type I ordinary Portland cement (OPC) was used as the binder material, and two commercially available biochars were used as partial cement replacements. One biochar was derived from rice husk waste (referred to as RH-BC hereafter). The other biochar was produced from wood sawdust waste (referred to as SD-BC hereafter). The physical properties of the as-received biochars, such as particle size distribution and bulk density, were obtained from the manufacturer’s specification sheets.
Biochar Preparation and Characterization
To investigate biochar as a potential cement replacement, the particle size was reduced from granular to fine powder form. A laboratory ball milling machine was used to grind the biochar as described in Figure 1. Before starting the ball milling, both types of biochar were dried in at 105°C for 24 h to remove moisture. A ball mill with zirconia media (10 mm diameter) was used to grind biochar for the same 24 h for both biochar cases. The particle size distribution was measured by laser diffraction using ethanol as the dispersing agent. Figure 1 shows that the ground RH-BC had an average particle size of 7.0 µm and SD-BC had an average particle size of 16.5 µm.
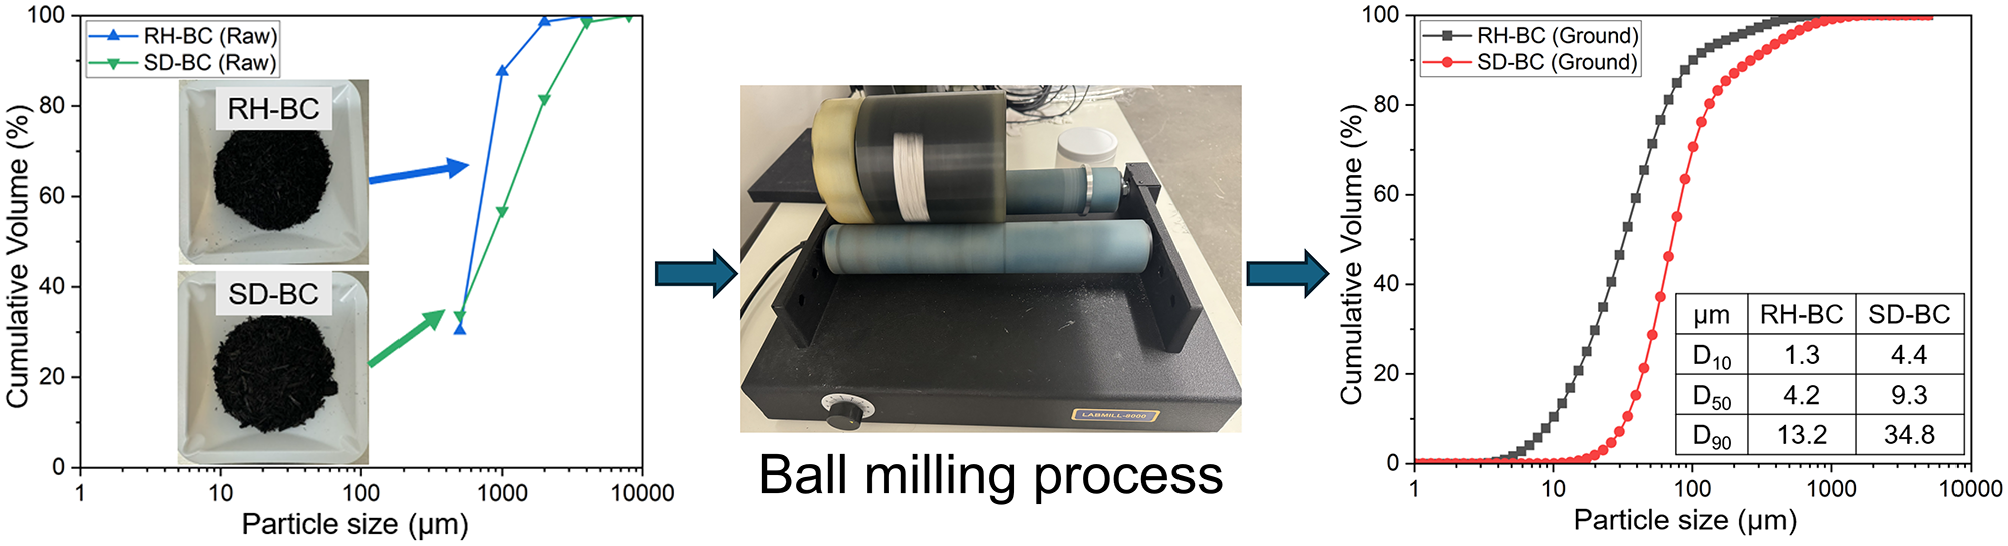
Biochar ball milling procedure, showing the as-received particle size distribution (left) and the ground size distribution after milling (right).
The ground biochars are used throughout the remainder of this study. They were characterized by X-ray fluorescence (XRF) to determine equivalent oxide compositions. Their specific surface areas were measured by nitrogen adsorption using the Brunauer–Emmett–Teller (BET) isotherm. The water absorption capacities of both biochars were assessed using the “tea-bag” method for up to 4 h as described in a previous study ( 10 ), whereby the absorption capacity is calculated from the mass difference between a tea bag containing biochar and an empty tea bag after immersion in water for a desired period. This mass difference was then divided by the initial mass of biochar inside the tea bag. Some residual water on the surface or between biochar particles may lead to an overestimation of the absorption capacity, which is considered a limitation of the tea-bag method.
The pozzolanic reactivities of the biochars were characterized by isothermal microcalorimetry following the approach by Suraneni and Weiss ( 12 ). Specifically, binder blends were made by mixing a 3:1 mass ratio of CH and dry biochar with a 0.5M potassium hydroxide solution, fixing a liquid-to-solid ratio of 0.9. The isothermal microcalorimeter was preconditioned at 50°C and allowed to stabilize for 45 min. The measurement was completed over 160 h, and the normalized heat release was calculated to compare the pozzolanic reactivity of biochars. After completing the microcalorimetry test, approximately 20 mg to 50 mg of the material were extracted from the ampoules and subjected to thermogravimetric analysis (TGA) to determine the CH consumption during the reaction process. The TGA method can quantify phases by capturing weight changes via normalizing the signal by the initial sample mass. Typical sample masses depend on the instrument specifications, ranging from 20 mg to 50 mg commonly used in cement research ( 13 , 14 ). For the TGA, the fully consolidated RH-BC was ground, and the fine powder was collected by passing it through a No. 200 sieve as attempted by a similar previous study ( 14 ). For the non-fully consolidated SD-BC case, TGA samples were directly collected from the ampoules. TGA was performed by heating the samples from 25°C to 500°C at 10°C/min under a nitrogen (N2) atmosphere. This analysis was performed within 5 h of removing the material from the ampoules to minimize further hydration. Scanning electron microscopy (SEM) operating in secondary emission mode was employed to observe the morphology of the biochar before and after the grinding process.
Mix Proportions and Fabrication
The mix proportions of biochar-infused cement paste are shown in Table 1. Each biochar replaced 5 wt% of the cement. When desired, the biochars were pre-saturated before mixing with cement by pouring water equal to the biochar’s water absorption capacity and sealing for three hours. The total water-to-solid mass ratio was fixed at 0.35 in both dry and pre-saturated biochar cases, so the remaining amount of water was adjusted accordingly in the pre-saturated biochar cases. Figure 2 demonstrates the details of the biochar-cement paste mixing process with dry and pre-saturated biochar.
Mix Proportions of Biochar-Cement Paste
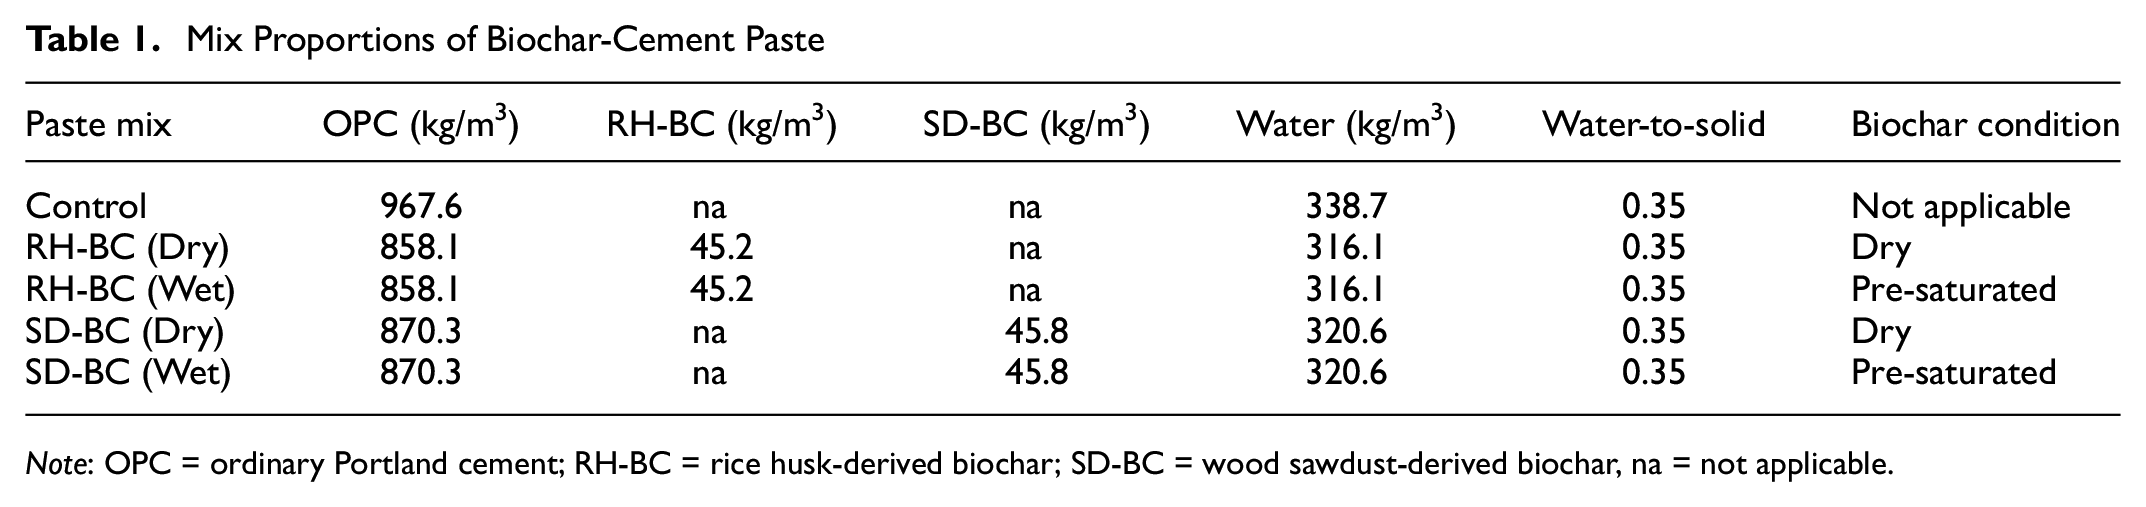
Note: OPC = ordinary Portland cement; RH-BC = rice husk-derived biochar; SD-BC = wood sawdust-derived biochar, na = not applicable.
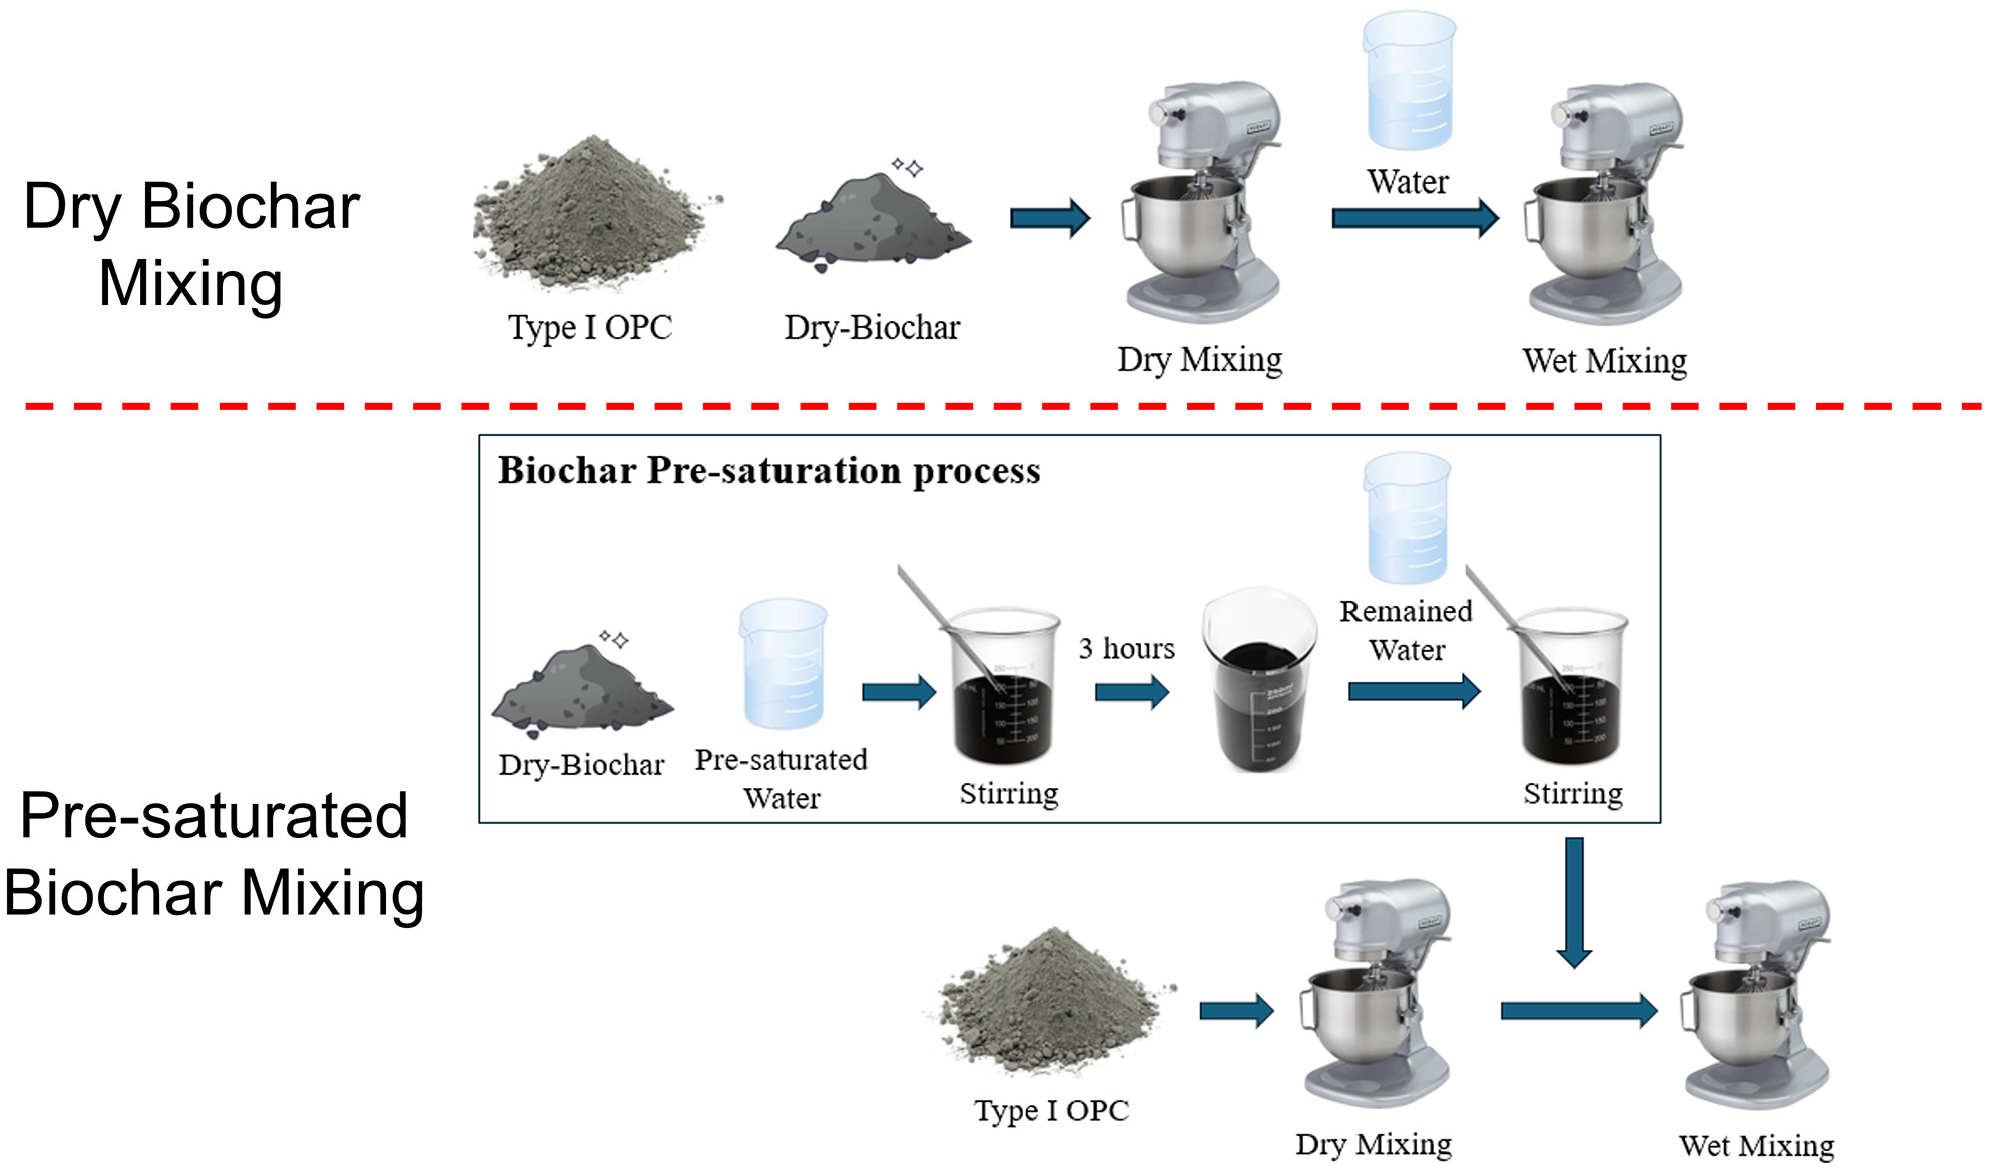
Schematic diagram of dry and pre-saturated biochar mixing procedure.
A planetary mixer with a 5-quart capacity was used for the mixing process. Before adding water, the dry powders (biochar and cement) were pre-mixed at a 139 rpm for 120 s to homogenize them. Water was then added to the dry ingredients and mixed at 139 rpm for 180 s, followed by an increase to 285 rpm for another 180 s and then a final 139 rpm mixing for 120 s. The mixed biochar-cement paste was directly used for the fresh property measurement, and the cast samples were stored in a high humidity (relative humidity [RH] 95 ± 5%) chamber at 23°C until the desired testing date.
Test Methods
Setting Time and Workability
The initial and final setting times of the biochar-cement paste were determined using an automatic Vicat machine following the ASTM C191 standard. A 120-min delay was applied for all cases, and measurements were made every 5 min until the final setting time was reached. The workability of biochar-cement paste mixtures was tested using the flow table according to ASTM C230. The flow table test was conducted twice for each paste mixture to measure fluidity, and the average value was reported.
Hydration Kinetics
The effect of biochar on hydration kinetics was investigated using an isothermal calorimetry test by measuring heat flow and cumulative heat of reaction over 72 h according to ASTM C1702. A total of 4.63 g of the blended mixture, which contains cement, biochar, and water, was used for the measurements. For the pre-saturated biochar case, the biochar was immersed in water inside a glass ampoule for 3 h and sealed with paraffin film before being mixed with cement and the remaining water.
Rheological Properties
The rheological behavior of biochar-cement paste was investigated using a rotational Brookfield RST-SST rheometer with a 40 mm height and 20 mm diameter vane setup in accordance with ASTM C1749. A paste volume of 140 mL was placed in a 150 mL beaker. Plastic viscosity and yield stress were inferred from shear-controlled flow curve measurements. The details of the flow curve experiments are adopted from Xiao et al. ( 15 ), and the resulting data are shown in Figure 3.
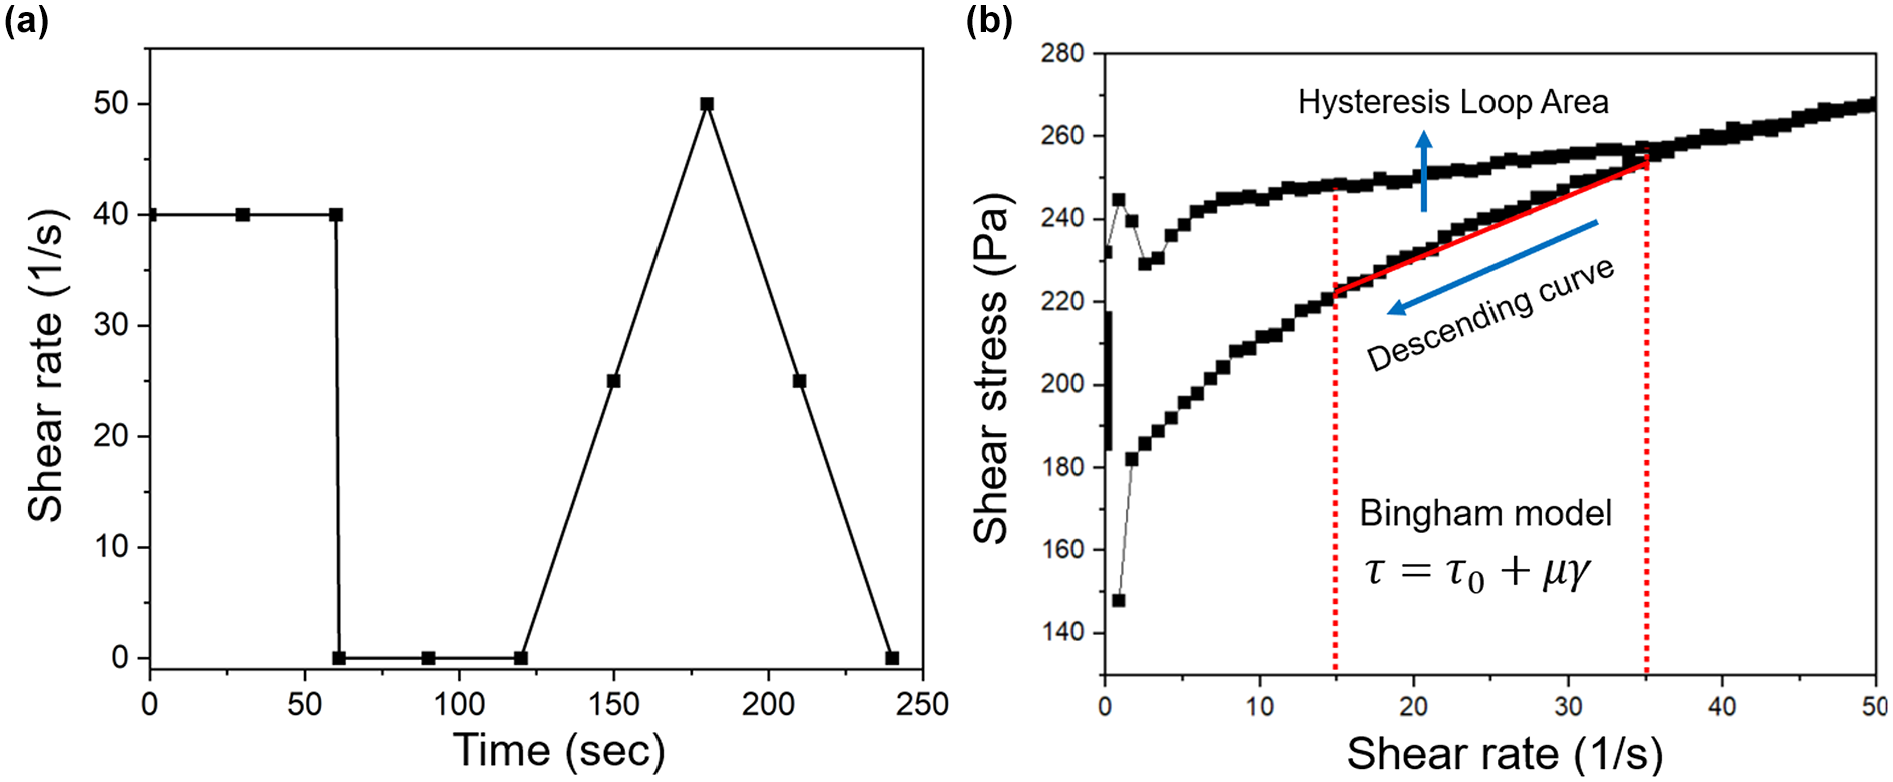
Rheological behavior test of biochar-cement paste; (a): flow curve test profile and (b) example result and calculation.
The biochar-cement pastes were first pre-sheared at 40 s−1 for 60 s and then rested for 60 s to achieve a uniform state. Subsequently, the shear rate was increased to 50 s−1 for 60 s and then stopped for another 60 s. The descending curve between 15 s−1 and 35 s−1 was selected to calculate the plastic viscosity and yield stress based on the Bingham model ( 15 ) and the hysteresis loop area was calculated to quantify the thixotropy of biochar-cement paste ( 16 ). Two replicates were used, and the average values are reported.
Compressive Strength
To evaluate the early-age mechanical properties of biochar-cement paste, compressive strength measurements were made at 3 days and 7 days of curing following ASTM C109 using 50 mm cube specimens. At each testing age, three cubes were measured per paste mixture, and the average values were reported.
Results and Discussion
Biochar Characterization
Physical and Chemical Characteristics
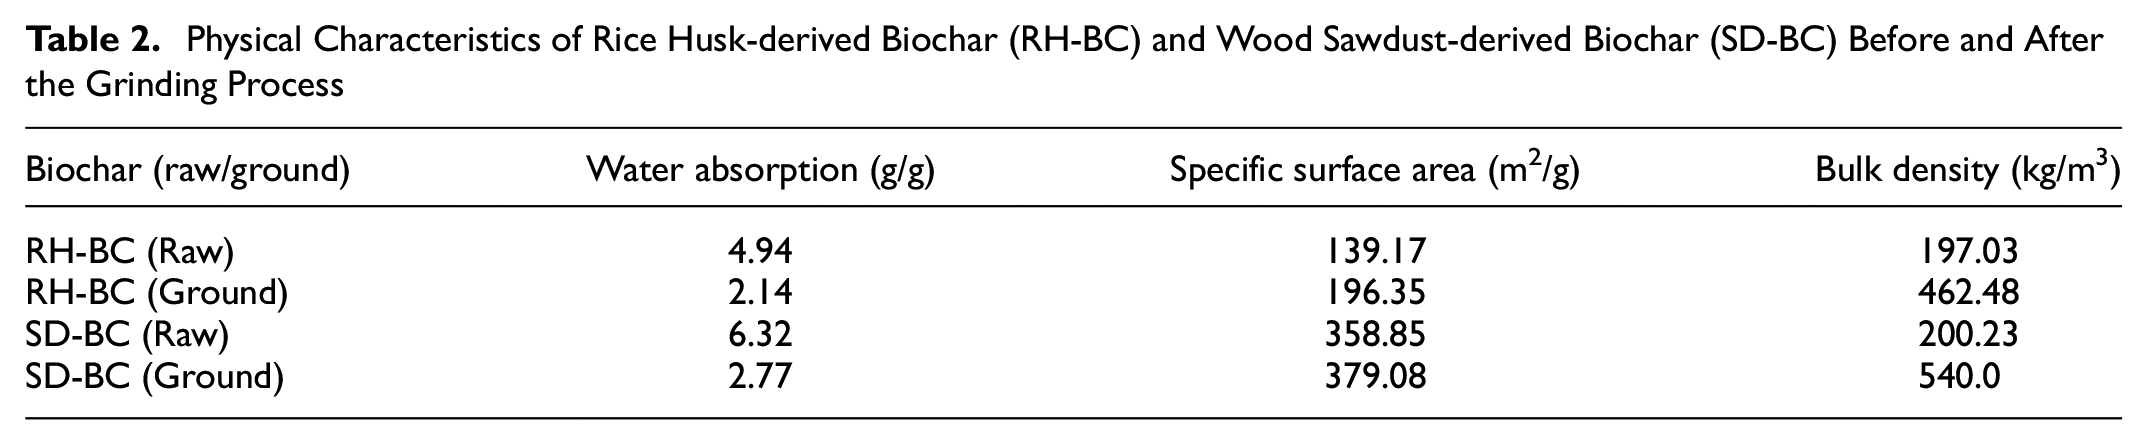
The physical characteristics of the biochars before and after the grinding process are described in Table 2. The bulk density of SD-BC is slightly higher than that of RH-BC both before and after grinding. However, the specific surface area of SD-BC is significantly greater than that of RH-BC. After grinding, the specific surface area increases only marginally, which indicates that the finer pores provide the greatest contribution to the surface area. RH-BC has a much smaller specific surface area compared with SD-BC, despite its smaller particle size, further confirming that the internal skeletal structure is the primary determinant of specific surface area and that SD-BC has a more porous structure with a larger volume of finer pores than RH-BC. Additionally, the large specific surface area of SD-BC enables it to hold more water within its structure and on the surface of its particles, resulting in a higher water absorption capacity. Both RH-BC and SD-BC show a reduction of >50% in water absorption capacity after grinding, implying that the process may eliminate relatively larger pores that are more effective for storing water inside the biochar.
Physical Characteristics of Rice Husk-derived Biochar (RH-BC) and Wood Sawdust-derived Biochar (SD-BC) Before and After the Grinding Process
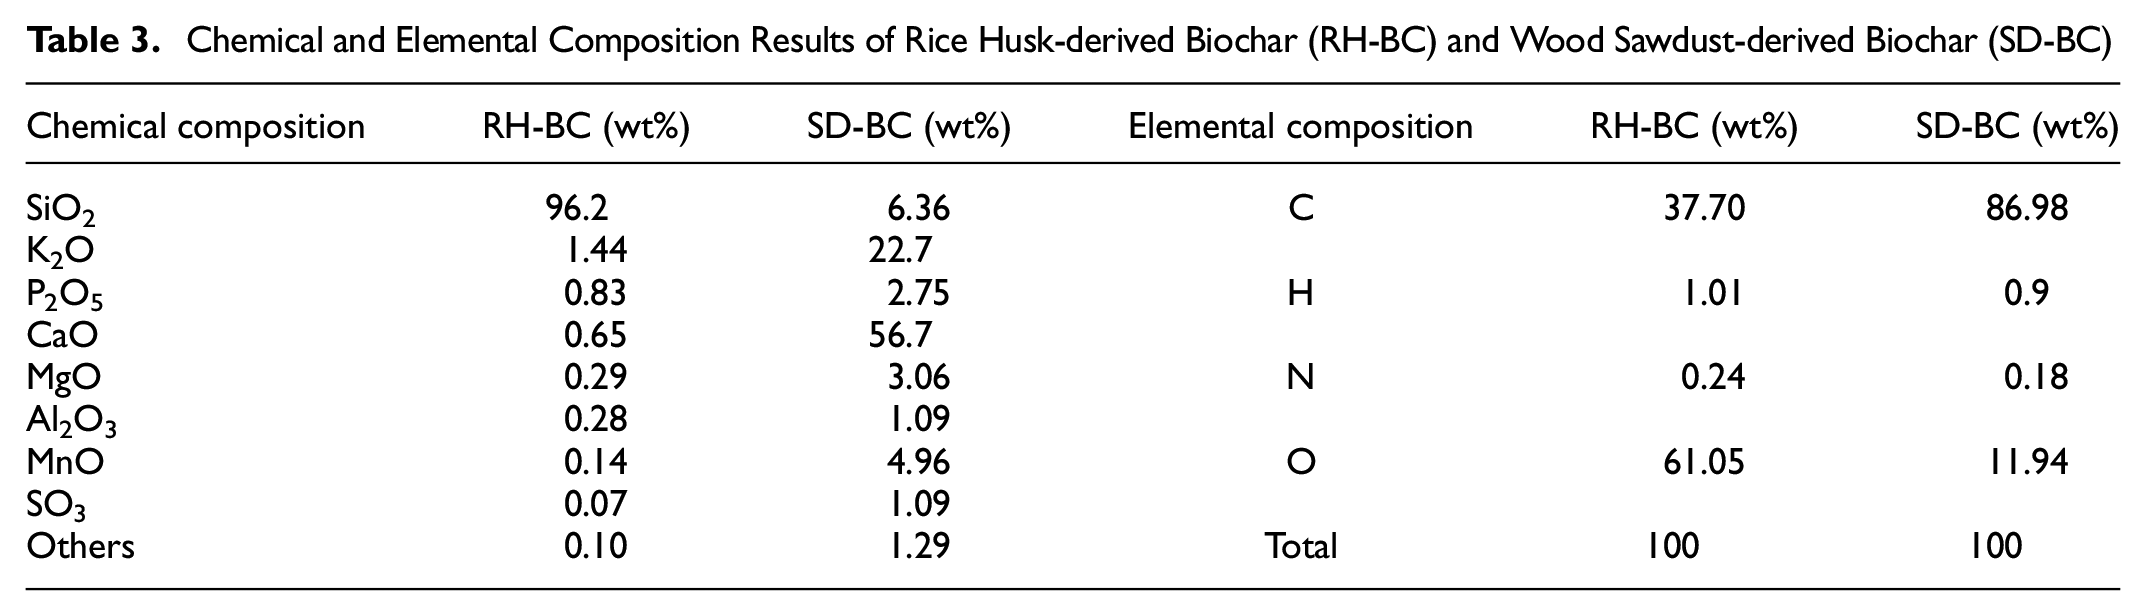
The composition of both biochars obtained from XRF and elemental analysis are given in Table 3. The oxygen content is inferred from the difference in the sum of carbon, hydrogen, and nitrogen. Biochar generally has low nitrogen content regardless of pyrolysis conditions ( 15 ). In addition, the hydrogen content is ≲1 wt%, so carbon and oxygen mainly account for biochar’s elemental composition. The major difference between RH-BC and SD-BC is their SiO2 content. RH-BC has a SiO2 content of 96.2 wt%, while SD-BC has only 6.36 wt%. Previous studies ( 17 , 18 ) have found that high silica content is owing to the biochar being derived from silica-rich feedstock, such as agricultural waste, together with a relatively high ash content. SD-BC showed relatively high K2O (22.7 wt%) and CaO (56.7 wt%) content compared with RH-BC, while it should be noted that the actual wt% of K2O and CaO in SD-BC is not very high owing to the low content of oxygen in SD-BC.
Chemical and Elemental Composition Results of Rice Husk-derived Biochar (RH-BC) and Wood Sawdust-derived Biochar (SD-BC)
Pozzolanic Reactivity of Biochar
The silica component of biochar may be pozzolanically reactive if it is amorphous, so the pozzolanic reactivities of RH-BC and SD-BC were compared using cumulative isothermal heat release results and CH consumption as shown in Figure 4. Only the dry biochars were used here because the measurement requires submersion in a KOH solution. The RH-BC shows much higher heat release (378.56 J/g) compared with SD-BC (77.29 J/g) up to 160 h, suggesting that RH-BC’s higher SiO2 content enables more dissolution and reaction with CH. Based on the positive correlation between SiO2 content and heat release, we hypothesize that much of the silica in RH-BC is either cryptocrystalline or amorphous. The heat release of SD-BC, in contrast, is similar to that of limestone (21 J/g) and quartz (82 J/g) ( 17 ), which implies that SD-BC can be considered pozzolanically inert. In contrast, RH-BC has a similar heat release to fly ash (327 J/g [ 19 ]). In Figure 4b, RH-BC exhibits much higher CH consumption owing to the reaction between CH and SiO2 from the biochar, whereas SD-BC shows only marginal CH consumption during the test period. However, it should be noted that CaO in SD-BC can form additional CH, potentially increasing the final CH amount and leading to an underestimation of its CH consumption.
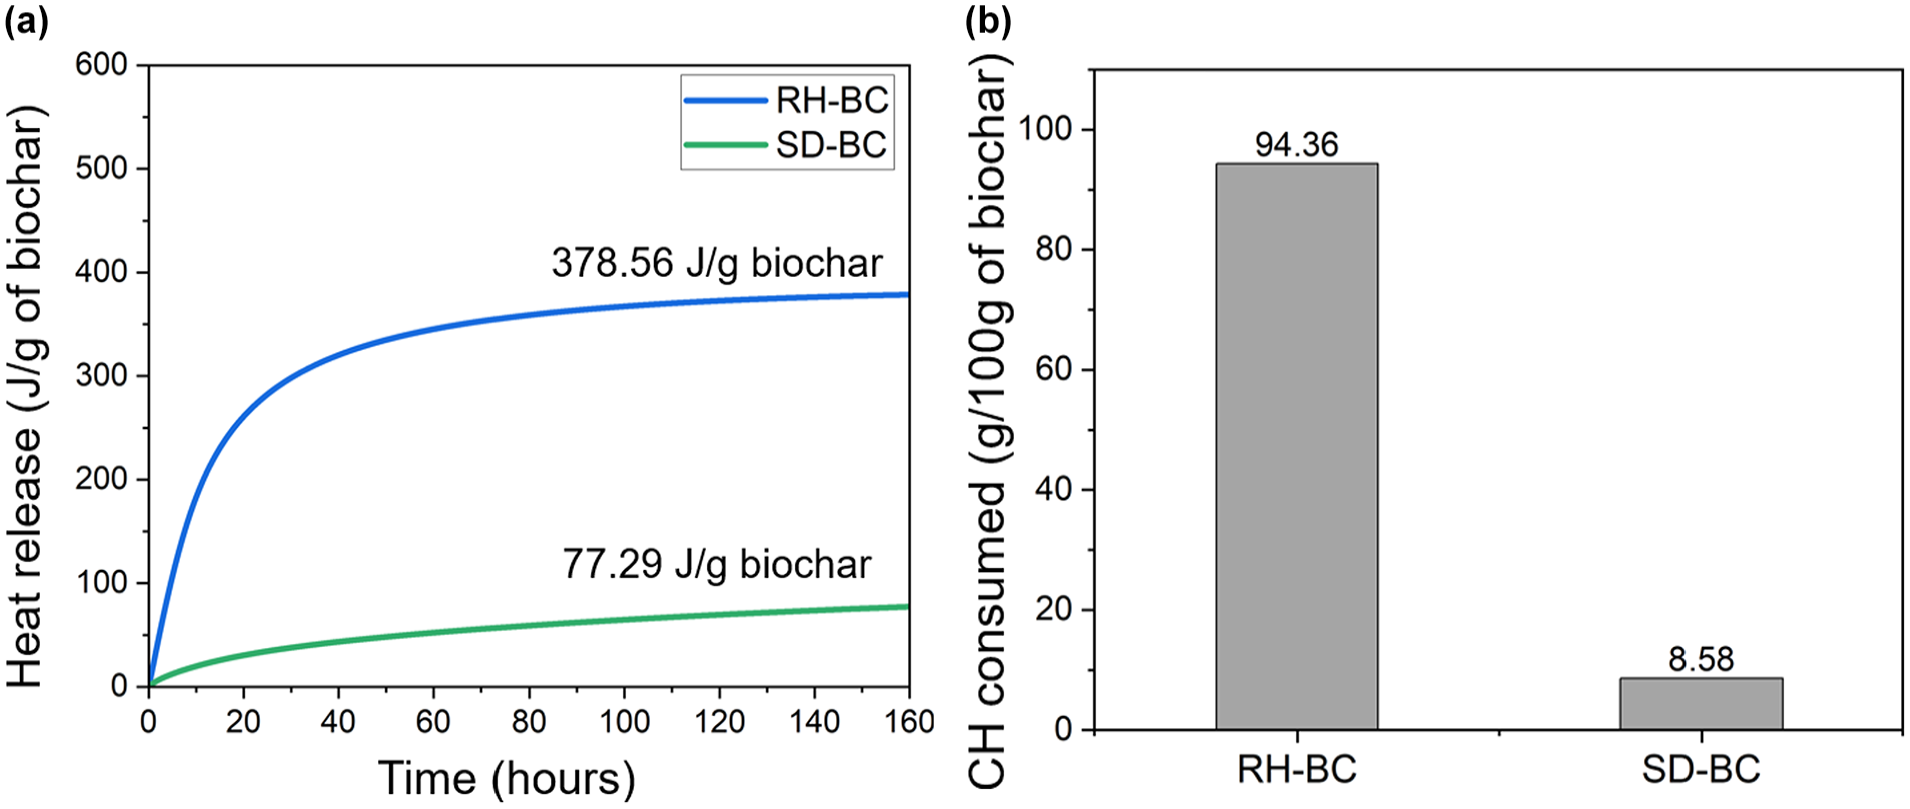
Pozzolanic reactivity of rice husk-derived biochar (RH-BC) and wood sawdust-derived biochar (SD-BC) (a): cumulative heat release, (b): amount of CH consumption.
Biochar Morphology
The morphologies of the raw and ground biochars are shown in Figures 5 and 6. In their raw condition, both RH-BC and SD-BC clearly have a cellular structure with cylindrical pores. However, grinding appears to largely destroy the cellular structure. Biochar is known to include different pore sizes, such as micropores (0.1 nm to 1 nm), mesopores (1 nm to 100 nm), and macropores (>100 nm) ( 20 ). The micro- and meso-pores are difficult to observe by SEM owing to resolution limitations, but these smaller pores play an important role in maintaining the water retention characteristics of biochar ( 8 ). The changes in biochar’s physical characteristics by grinding, as described in the previous section, indicate that grinding significantly reduces its water absorption capacity. However, ground biochar still can absorb more than twice its mass in water. Furthermore, despite the elimination of visible micropores during grinding, there is only a slight increase in the specific surface area. This suggests that micropores and mesopores continue to play a significant role in determining the specific surface area. Additionally, the ground RH-BC exhibits an irregular and rough surface, as seen in Figure 5d, whereas the ground SD-BC displays sharp and angular surfaces, as shown in Figure 6d.
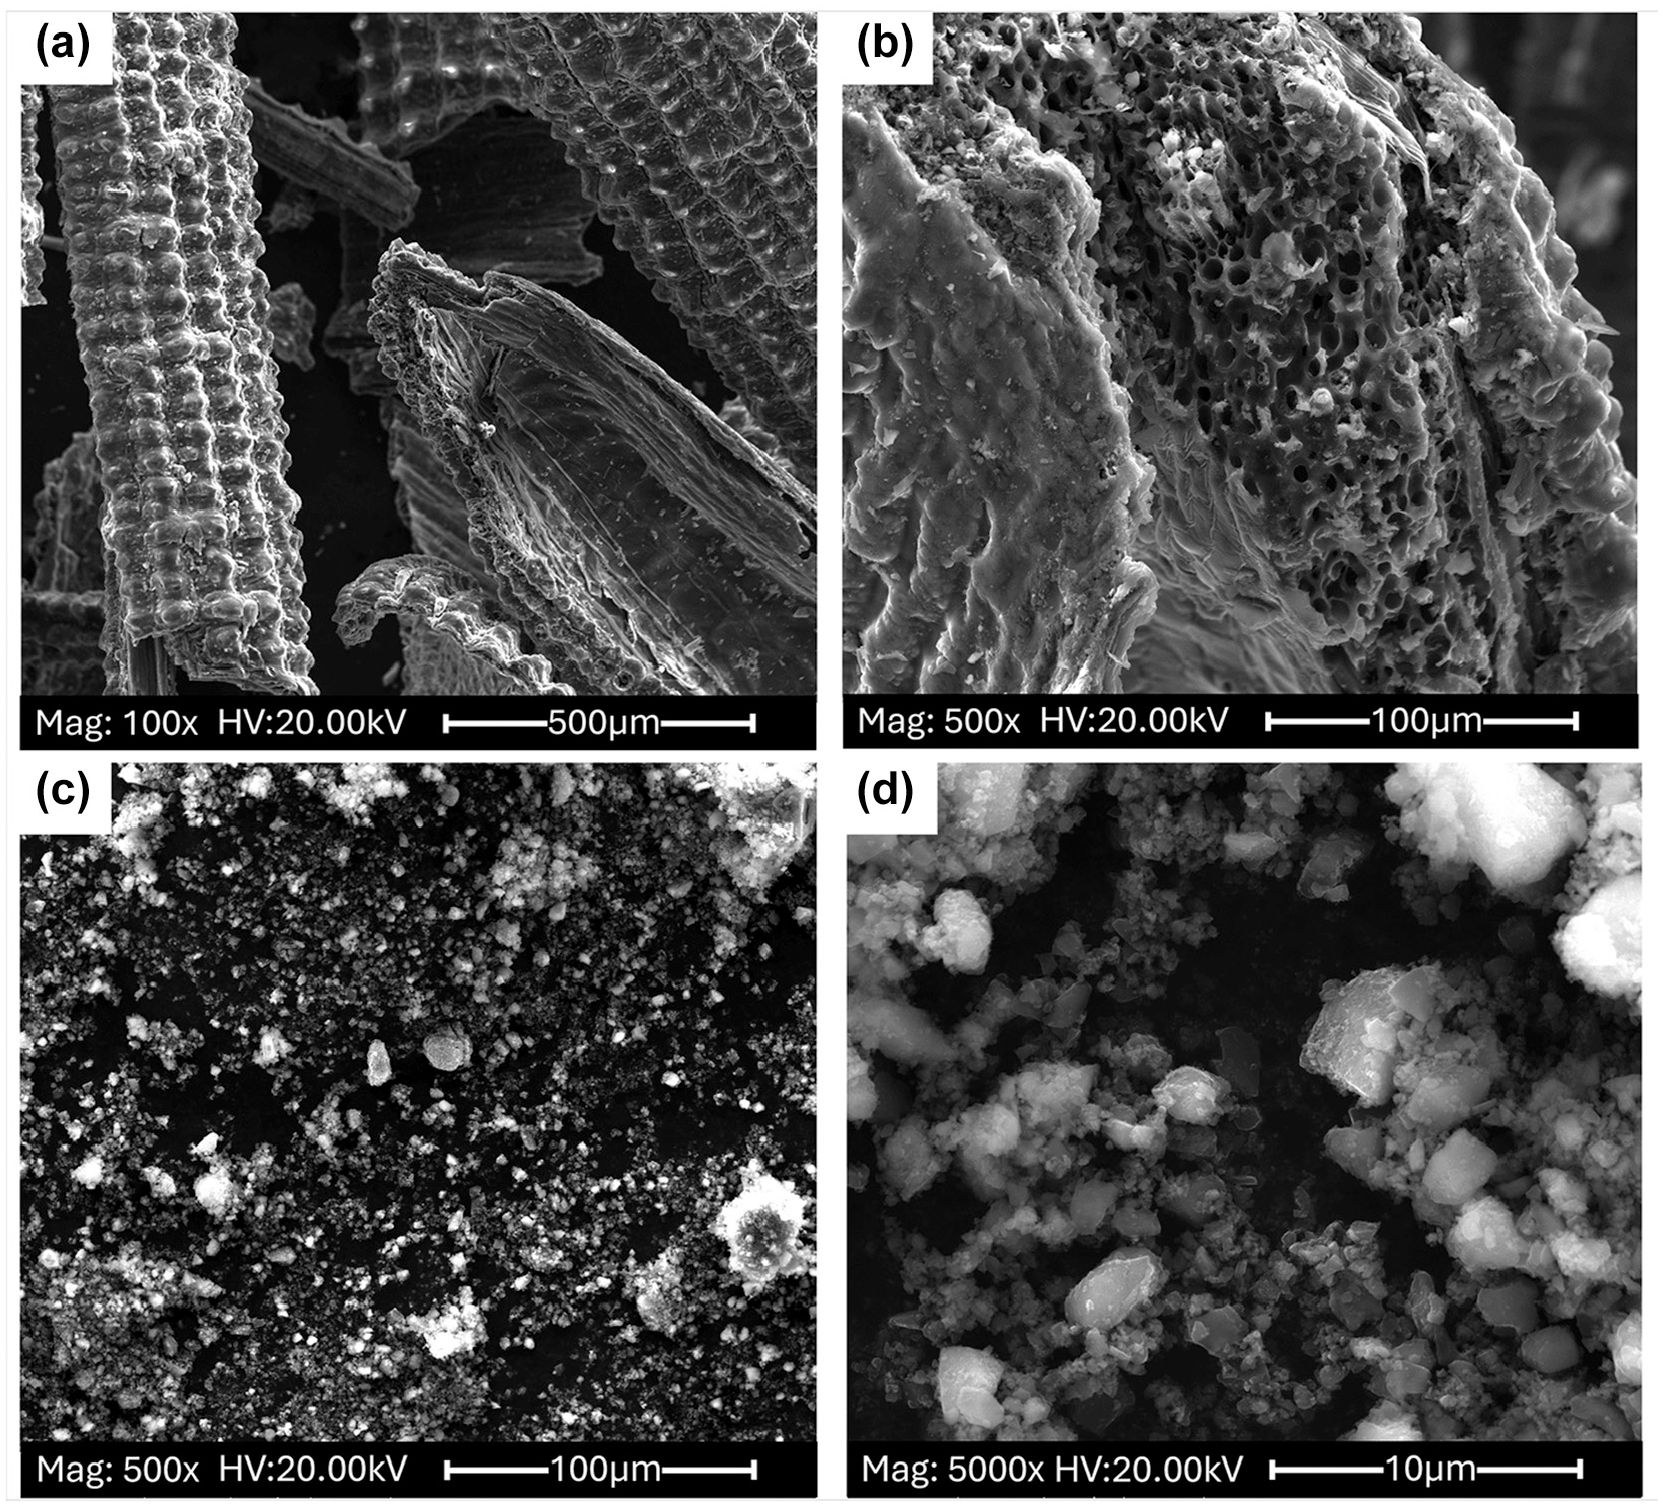
Scanning electron microscopy (SEM) images of (a, b) raw rice husk-derived biochar (RH-BC) and (c, d) ground RH-BC.
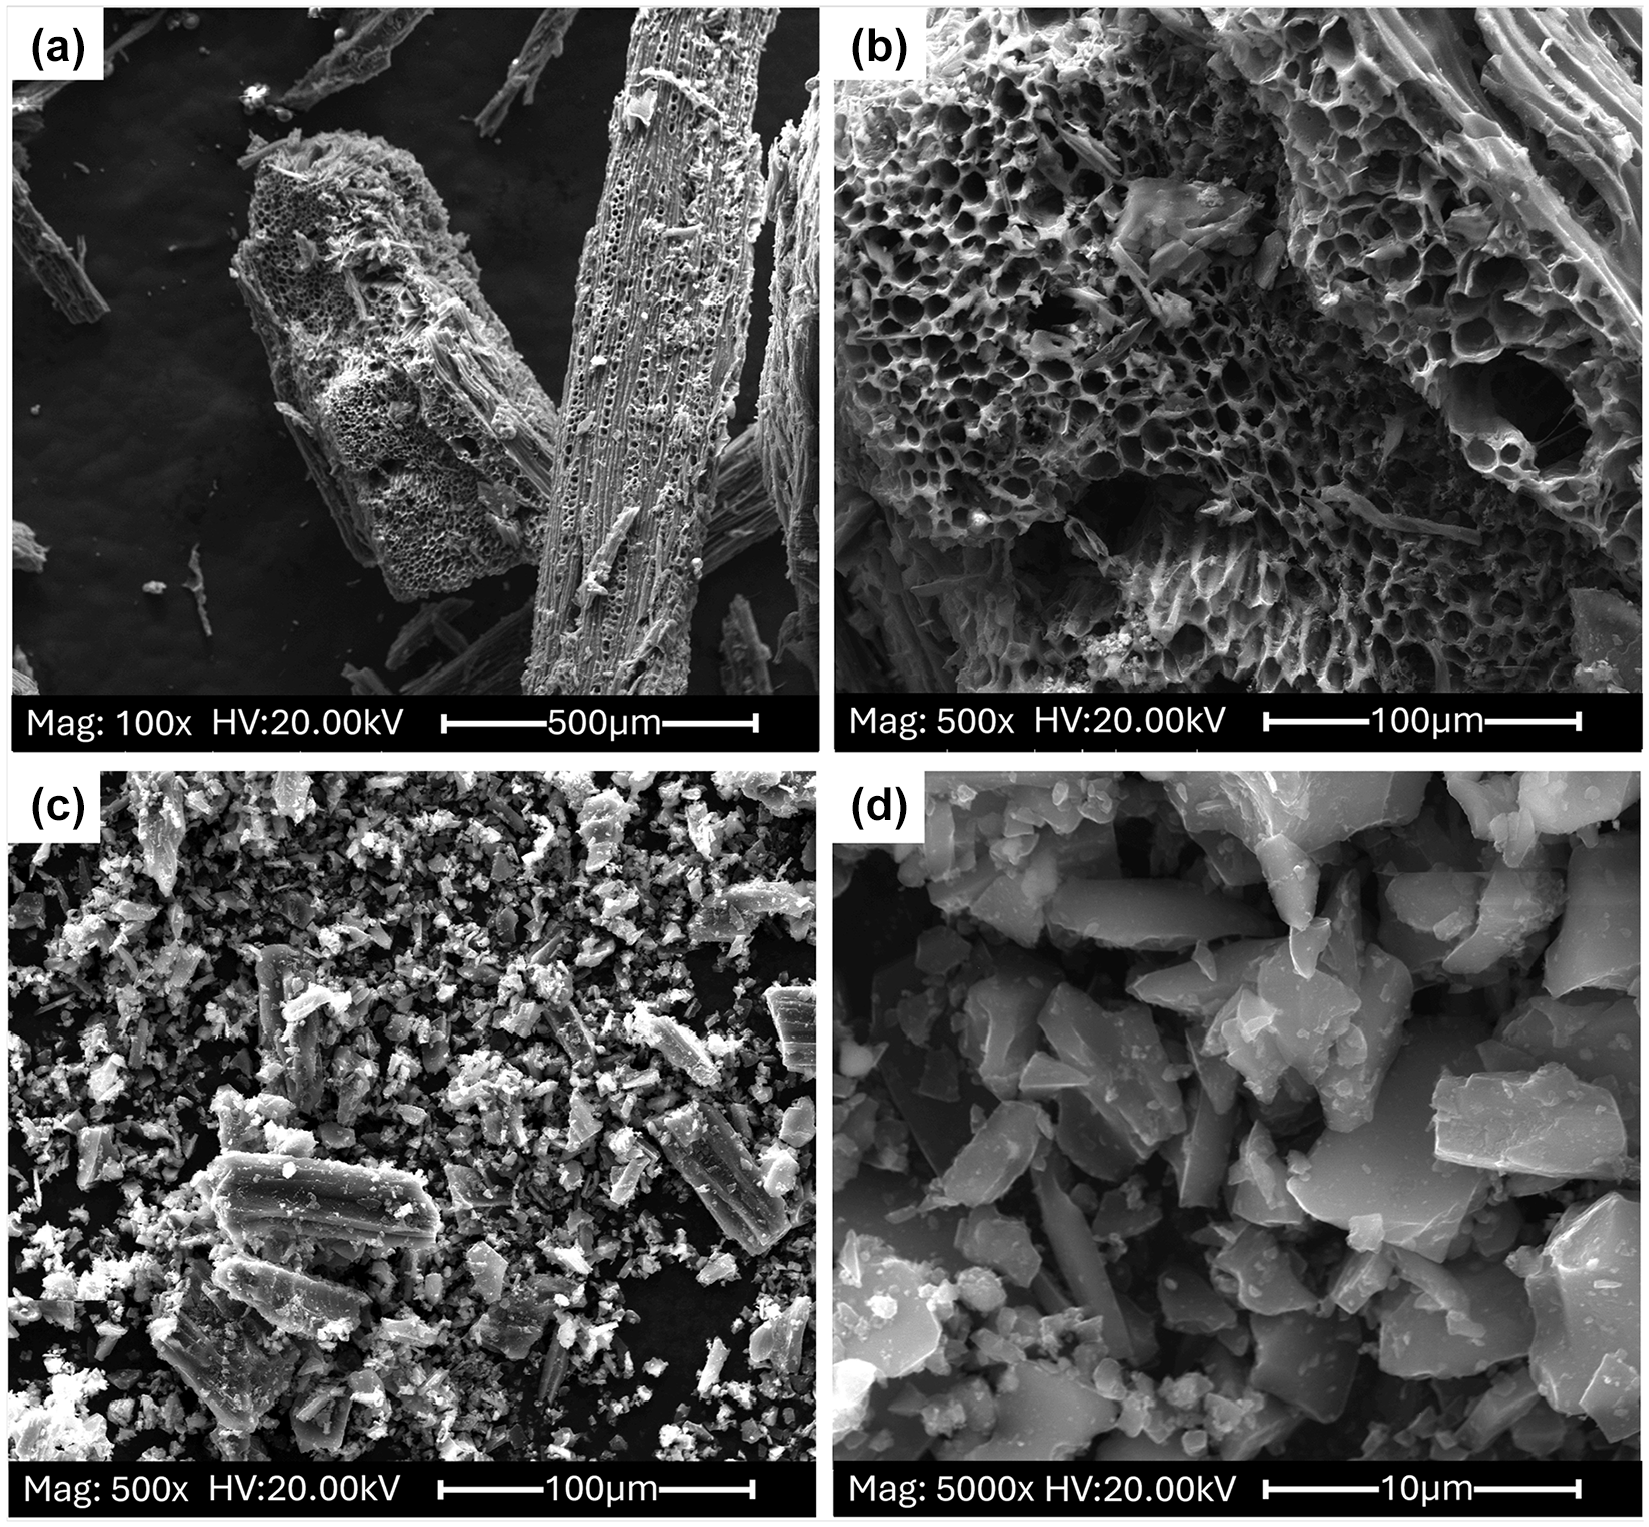
Scanning electron microscopy (SEM) images of (a, b) raw wood sawdust-derived biochar (SD-BC) (c, d) ground SD-BC.
Paste Setting Time and Workability
Figure 7a shows the initial and final setting times of pastes made with either of the two different biochars when added in either dry or pre-saturated condition. Regardless of biochar type and saturation condition, all pastes have similar initial setting times but shorter final setting times compared with the control (cement only). The reduced final setting time in biochar-cement mixes may result from the combined effects of accelerated hydration owing to the enhanced total solid volume fraction through biochar incorporation and the false-setting phenomenon. The fine particles and high porous structure of biochar can absorb water, reducing the volume of free water in the paste. In addition, the fine particle size of biochar can fill the space between cement particles and thereby increase the packing density. This filler effect and water retention characteristics of biochar can reduce setting time, consistent with a previous study ( 21 ). Another possible reason is the false-setting phenomenon proposed by Pârvan et al. ( 22 ). Fine biochar particles can increase the interaction between cement and biochar, enhance the yield stress and resist needle penetration even before the actual setting time. The greater reduction in setting time observed with SD-BC indicates that its high surface area may affect the setting time in a greater manner than the higher pozzolanic reactivity of RH-BC. Pre-saturating either of the biochars corresponds with a delayed setting time compared with dry biochar. The absorbed water near the pre-saturated biochar surface could help dispersion by lubricating the cement particles, leading to more uniform water distribution and prolonged setting time. In mixes where dry biochar is used but may not be fully saturated after mixing, the availability of free water may decrease as the biochar continues to absorb surrounding water. However, in mixes with pre-saturated biochar, the availability of free water may increase owing to the gradual release of water from the saturated biochar during the setting time measurement, potentially leading to an extended setting time.
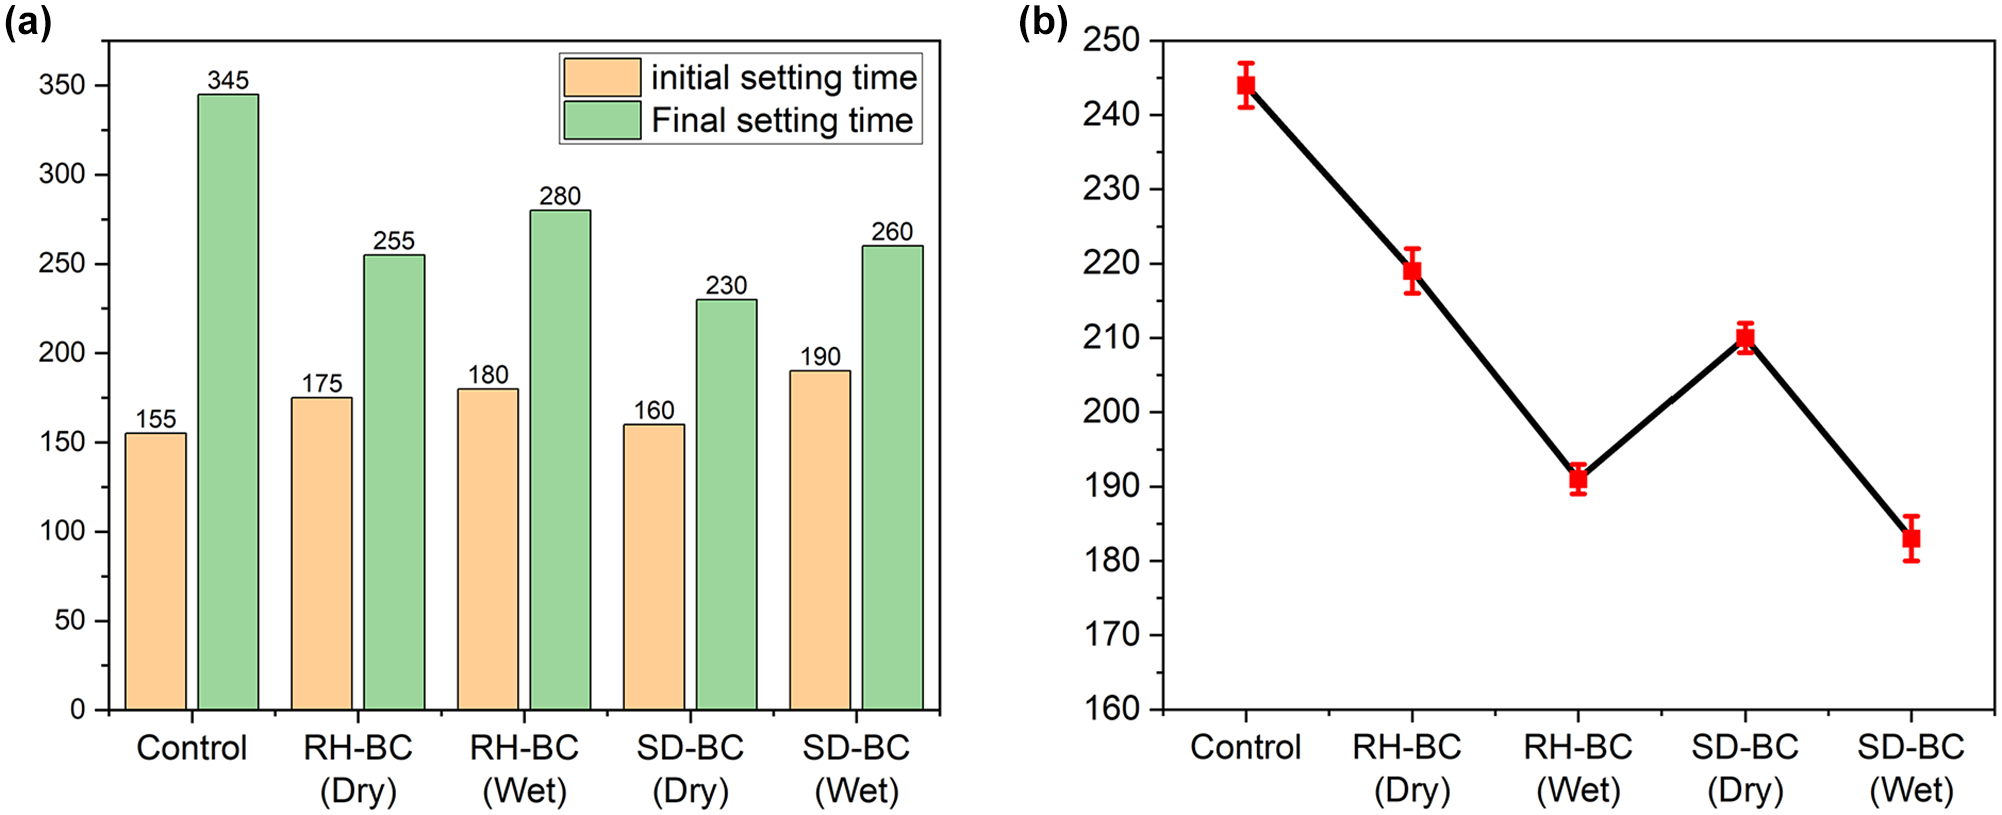
(a) Initial and final setting times and (b) fluidity measurements of biochar-cement pastes. The estimated uncertainty in the setting time with a standard deviation of 12 min for the initial setting and 20 min for the final setting is based on the ASTM C191-21 precision statement.
The flow table method (ASTM C230) was used to measure fluidity investigating the impact of biochar incorporation and its saturation state on the workability of cement paste. The results are summarized in Figure 7b. Pastes that incorporate either RH-BC or SD-BC, regardless of their saturation state, have lower fluidity than the control, which consistent with findings of previous studies ( 21 , 23 ). The reduced workability is primarily owing to biochar’s water absorption capacity, which decreases the amount of available mixing water. Pre-saturated biochar showed even lower fluidity than dry biochar, indicating that although some water is released during mixing, the release is limited. Furthermore, the pre-saturated amount of water can reduce the effective mixing water and affect fluidity significantly. In the case of dry biochar, the short mixing time may have prevented the biochar from fully absorbing water, leaving more water available to interact with the cement particles. Generally, fluidity values below 150 mm indicate poor flowability, and values under 60 mm suggest that the mixture hardly flows ( 24 ). While incorporating 5 wt% biochar tends to reduce the workability of cement paste, the fluidity remains within an acceptable range for practical use.
Hydration Kinetics of Biochar-infused Cement Paste
The effect of biochar types and pre-saturation conditions on the hydration of biochar-cement pastes was investigated by isothermal microcalorimetry. Figure 8, a and b , shows that both of the pastes with biochar have two peaks, while the control OPC paste has only a single peak. The first peak in the pastes with either RH-BC or SD-BC corresponds to the dissolution of the tricalcium silicate (C3S), which occurs earlier than in the paste without biochar. This suggests an enhancement in hydration rate catalyzed by the finer particle size and greater surface area of biochar, relative to cement particles, that provides favorable sites for nucleation and growth of hydration products ( 9 , 25 ). The slightly higher second peak reflects the aluminate phase reaction. Previous studies ( 26 , 27 ) have shown that fine mineral fillers in OPC systems accelerate the precipitation rate of C-S-H, increasing sulfate adsorption. Once gypsum is depleted, sulfate is desorbed from C-S-H, becoming available for further ettringite precipitation. The enthalpy of ettringite precipitation is responsible for the second peak. Incorporating finer particles thus influences the hydration process and especially amplifies the reactivity of aluminate phases.
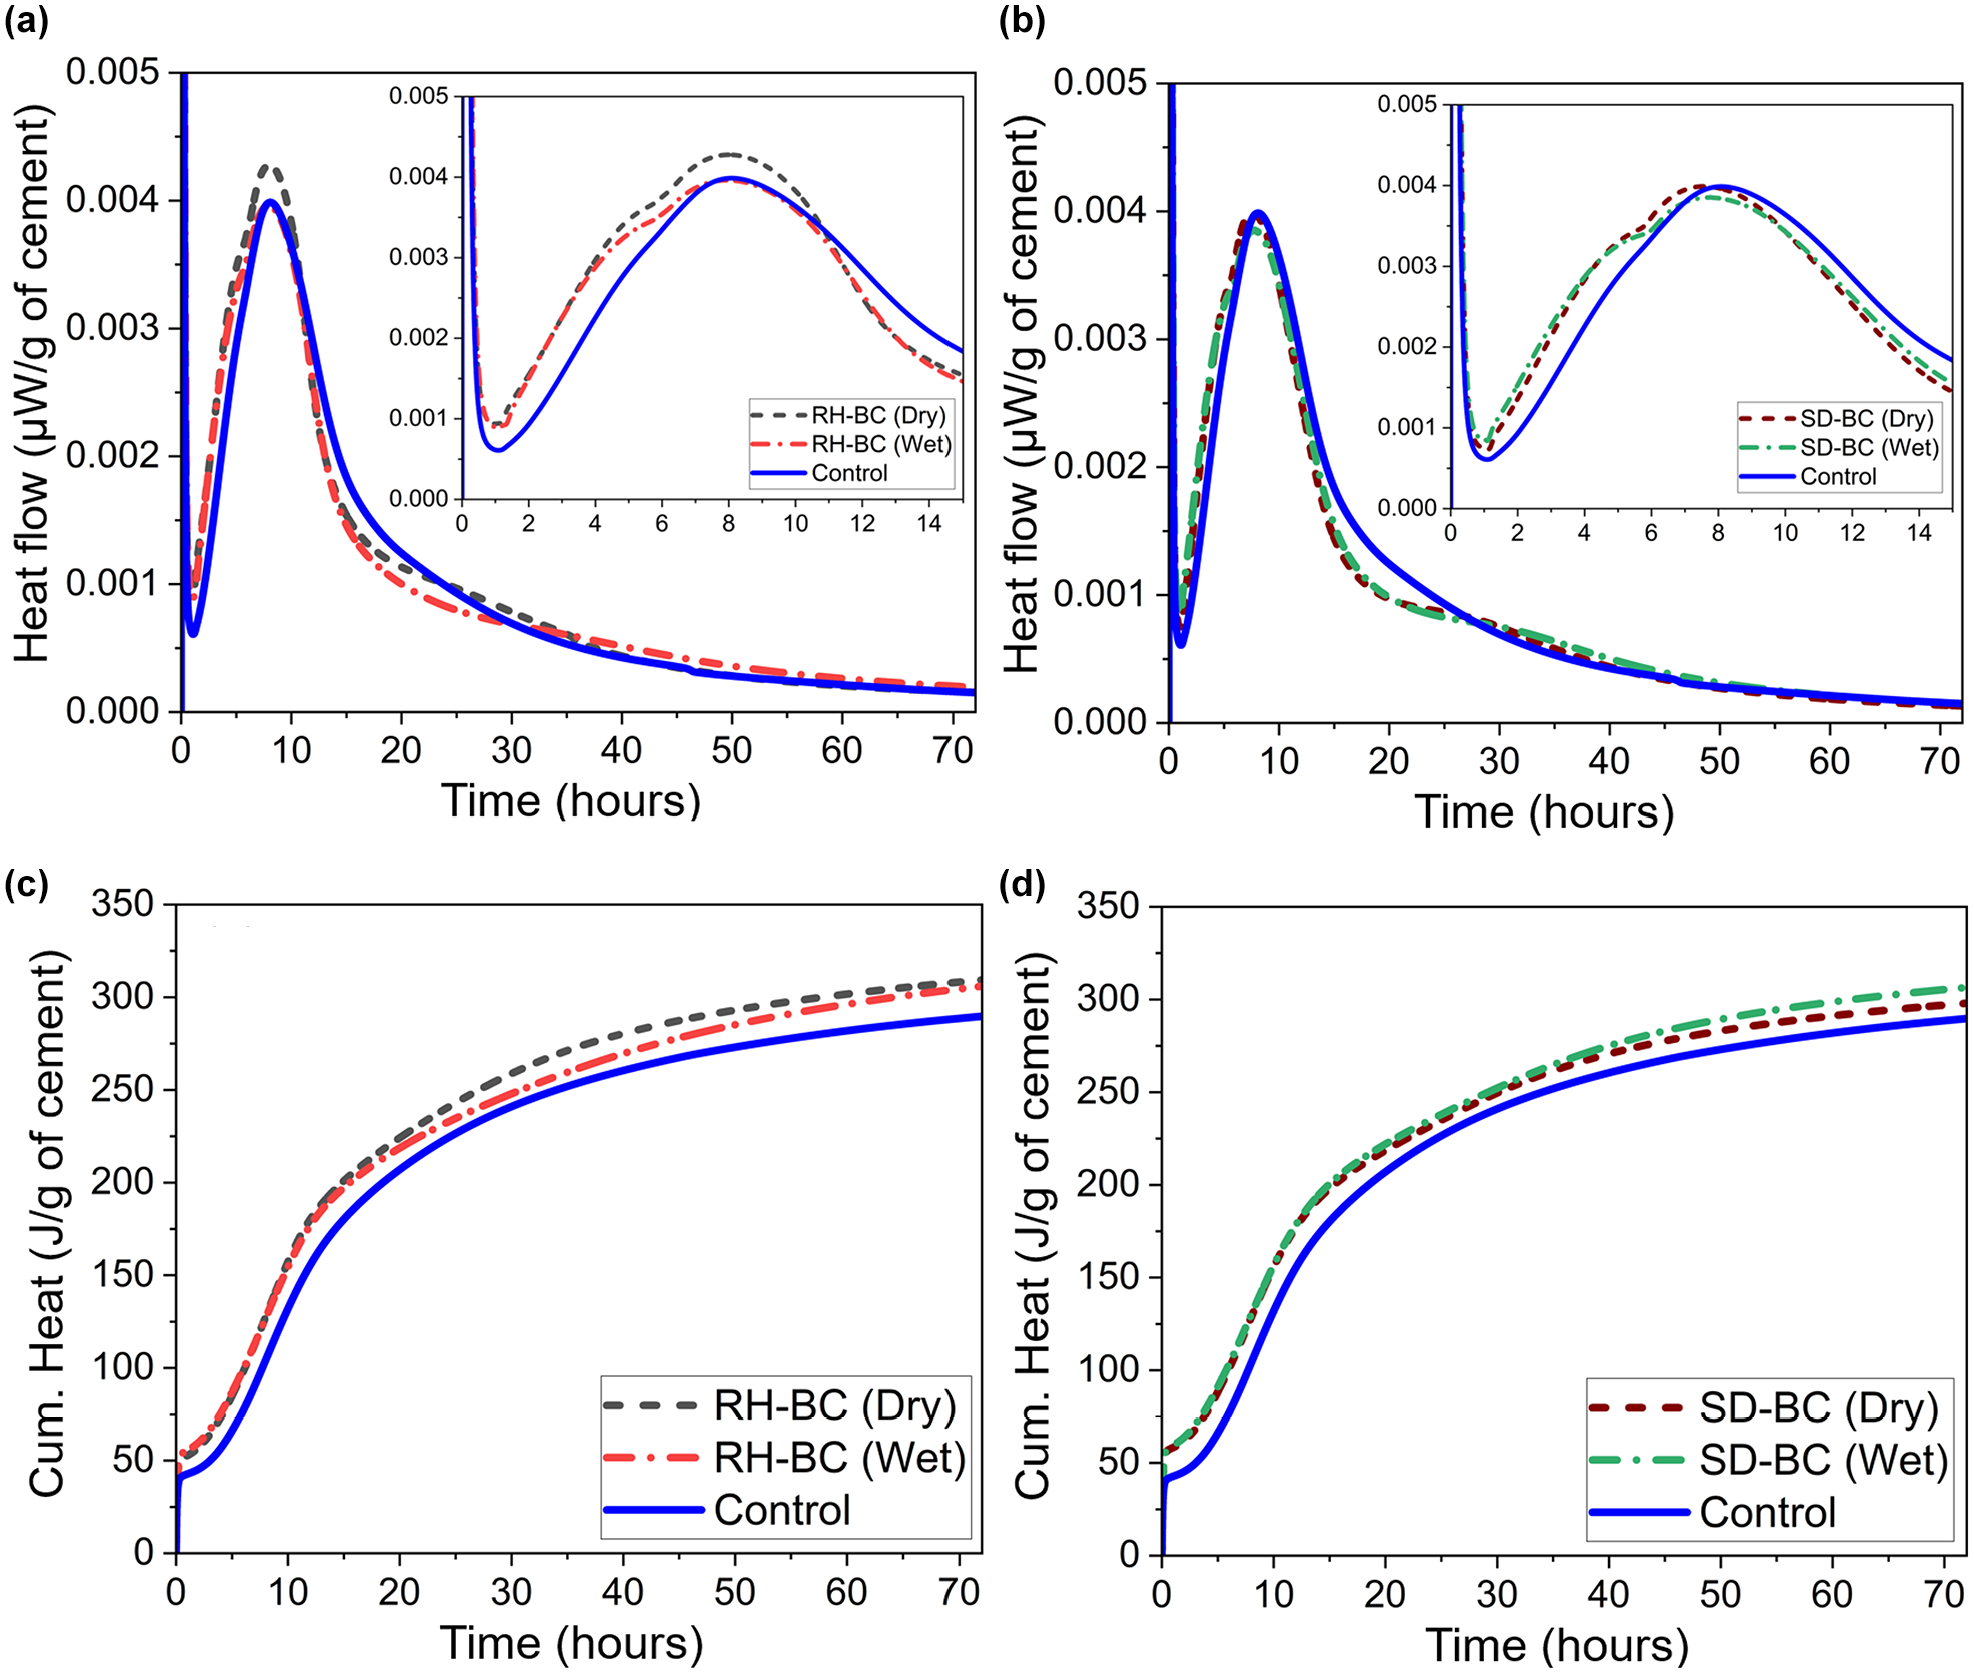
Isothermal calorimetry results of biochar-infused cement paste: (a) and (c) RH-BC case; and (b) and (d) SD-BC case.
In both RH-BC and SD-BC, dry biochar enhances the peaks compared with pastes with pre-saturated biochar, and RH-BC exhibits a slightly higher peak than SD-BC. The dry biochar absorbs water in the initial stage and may provide additional nucleation sites for C-S-H. In Figure 8, c and d , the difference in total heat release was negligible regardless of biochar type and pre-saturation condition. This implies that the pozzolanic reactivity of biochar may not be a key parameter in controlling early-age cement hydration; instead, physical characteristics such as particle size and surface area are more important controlling factors for early-age hydration. This hypothesis is preliminary with the limited cases investigated, and additional experiments are needed with different biochar replacement dosages to understand the actual impact of biochar on early-age pozzolanic hydration.
Rheological Behavior
The rheological characteristics (i.e., yield stress, plastic viscosity, and thixotropy) of biochar-cement pastes obtained from flow curve tests are summarized in Figure 9. Yield stress is the critical shear stress required to initiate the flow of cementitious mixtures ( 9 ), and it is increased by incorporating biochar regardless of the pre-saturation condition. Additionally, the use of pre-saturated biochar leads to higher yield stresses than when dry biochar is used. We speculate that the higher specific surface area and water absorption capacity of the biochar are the main reasons for yield stress enhancement. Use of SD-BC leads to higher yield stress in both dry and pre-saturated conditions than when RH-BC is used. This is somewhat surprising because RH-BC has a smaller particle size and should more effectively fill the space between the cement particles. However, the SD-BC has higher specific surface area and water absorption capacity, so less free water is available in the mixture. Previous studies ( 28 , 29 ) found that the water-film thickness around the cement particle surfaces reduces interparticle friction. If the higher water absorption capacity of SD-BC decreases this water film thickness, it could lead to the higher yield stresses observed here. At a constant water to solid mass ratio, the pre-saturated biochar further reduces the effective water in the early-age mixing, demonstrated by the higher yield stress than dry biochar cases.
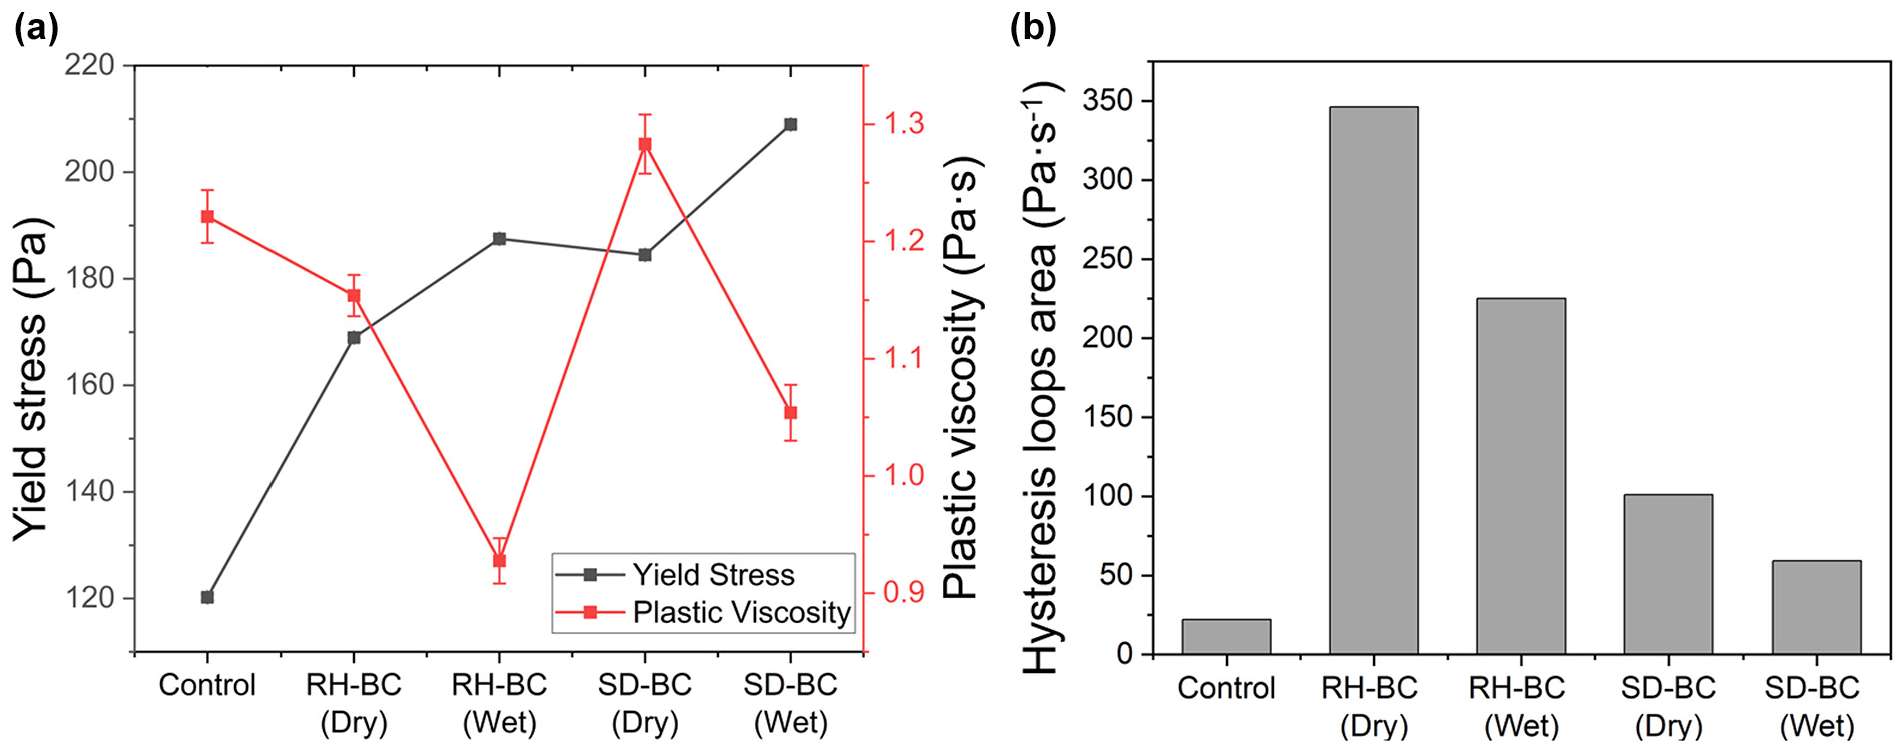
Rheological behavior of biochar-cement pastes (a) yield stress and plastic viscosity (b) thixotropy (hysteresis loop area) results.
Figure 9a also shows that using pre-saturated biochar leads to lower plastic viscosity than when dry biochar is used. Pre-saturated biochar does not need to cannibalize free water during mixing, so the presence of water on the biochar surface may promote a more uniform distribution of biochar and may reduce friction among the cement particles and biochar. Pastes with pre-saturated biochar also have lower plastic viscosity than even the biochar-free control paste, whereas pre-saturated biochar cases show reduced fluidity compared with control as described in the previous section. This indicates that the pre-saturated biochar in the mix can compensate for the loss of workability under continued shear conditions, thereby enhancing its potential for practical use without compromising workability.
In Figure 9b, the biochar-infused cement pastes have higher thixotropy—measured as the area inside the hysteresis loop formed from ascending and descending shear rates—compared with the control, and the pastes with RH-BC have greater hysteresis than those with SD-BC whether dry or pre-saturated biochar is used. Although it requires further examination to make a definite explanation for the differences observed, the relatively finer particle size of RH-BC may facilitate greater interaction with cement particles than SD-BC, which can then lead to a more pronounced formation and subsequent breakdown of the microstructural network under shear, resulting in more evident thixotropic behavior. In addition, dry biochar shows higher thixotropy than the pre-saturated case in both RH-BC and SD-BC cases. The lower yield stress and higher plastic viscosity obtained when dry biochar is used indicates a weaker initial structural network but greater resistance to deformation during continued shearing. Therefore, higher structural rearrangement potential should lead to greater thixotropy in biochar-cement paste. Owing to its physical characteristics, incorporating biochar affects the rheological properties of cement paste. Moreover, biochar’s pre-saturation condition can potentially reduce plastic viscosity, which may be beneficial for practical implementation. However, more in-depth rheological analysis with changing variables should be undertaken to better determine the impact of biochar for specific target applications.
Compressive Strength
Figure 10 illustrates the early-age compressive strengths of biochar-cement pastes. All specimens show similar compressive strength, ranging between 47.75 MPa and 52.66 MPa at 3 days of curing, regardless of biochar type and pre-saturation condition of biochar. However, at the 7 days of curing, RH-BC showed significant strength improvements up to 76.68 MPa, while the compressive strength of control and SD-BC reached up to 61.33 MPa and 66.95 MPa, respectively.
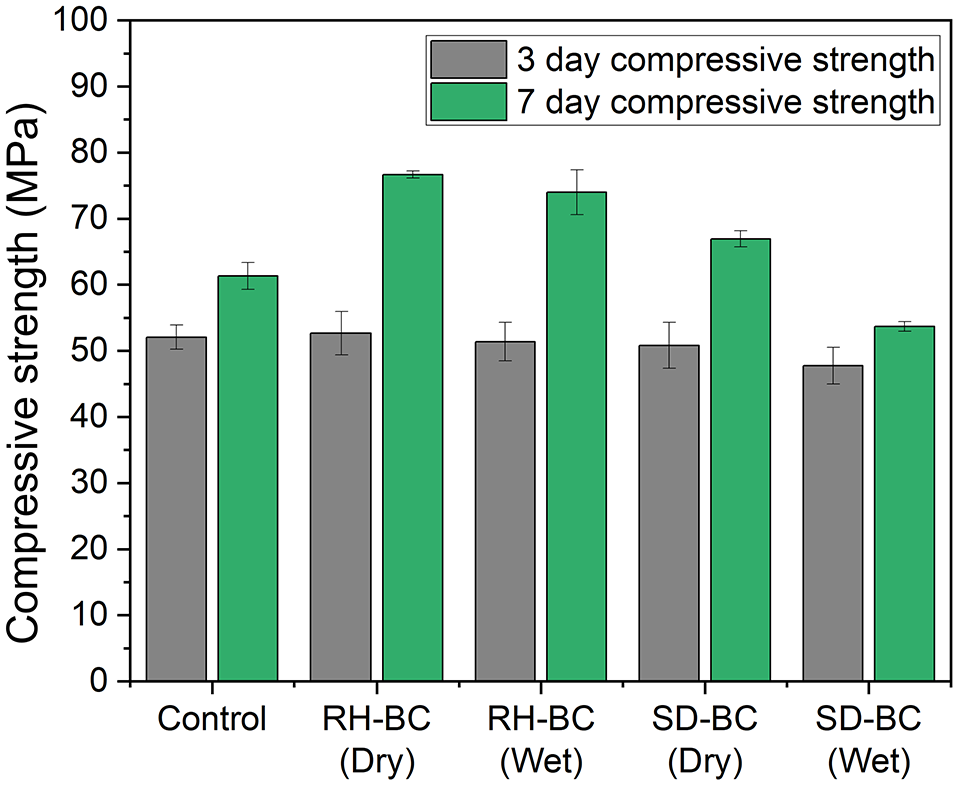
Compressive strength of 3-day and 7-day biochar-cement pastes.
As discussed in the previous section on hydration kinetics, the finer particle size of RH-BC, rather than its pozzolanic reactivity, helped enhancing cement hydration through the filler effect, leading to the production of more hydration products and densifying the microstructure to produce greater strength compared with pastes with SD-BC. These results contrast with a previous study by Gupta and Kua ( 10 ), where pre-saturated biochar showed a higher compressive strength of biochar-cement mortar in both moist and ambient curing conditions. The mixture design from Gupta and Kua (10) used a minimum water-to-cement mass ratio of 0.22 with pre-saturated biochar to allow internal curing from the biochar to aid in strength development, which is not the case in this study.
In general, the minimum effective water-to-cement ratio for cement to complete its hydration is known to be between 0.22 and 0.25. Therefore, dry biochar in this study can absorb water as it is mixed with cement, resulting in a lower water-to-solid ratio from 0.35 to a value close to the effective mixing water ratio. The higher water absorption rate of biochar could negatively affect the strength development. Based on a one-way analysis of variance (ANOVA) with a significance level of 0.05, the pastes infused with RH-BC have the same strength at 7 days whether dry or pre-saturated biochar is used (p = 0.335). In contrast, the SD-BC-infused pastes are stronger at 7 days when pre-saturated biochar is used than when dry biochar is used (p < 0.001). The higher water absorption capacity of SD-BC requires a lower effective mixing water ratio when the pre-saturated material is used, and the lower volume of free water during mixing reduces the cement–water interactions during mixing even though the absorbed water can be released from the biochar afterward. Therefore, the lack of reactive water in the pre-saturated SD-BC may be responsible for slower strength development. The results imply that the total water-to-solid ratio in biochar-induced mixes must be considered with both minimum effective water content and water absorption capacity of biochar.
Conclusions
Several laboratory experiments were used to gain insights on early-age hydration and fresh properties of cement paste infused with biochars by varying their characteristics (chemical composition and saturation state). The following conclusions can be drawn from these measurements:
Incorporating biochar in cement paste generally affects early-age behavior and fresh properties of cement paste in ways that depend on the biochar’s physical and chemical characteristics.
Biochar properties are highly dependent on the source material. RH-BC has a higher SiO2 content and is considered a pozzolanic material. In contrast, SD-BC exhibits a higher specific surface area and greater water absorption capacity than RH-BC, but is regarded as an inert material.
Biochar in cement paste reduces workability and accelerates setting time because its high water absorption capacity decreases the effective water content in the mixture. Variations in setting time and workability between dry and pre-saturated biochar cases imply that water release from biochar is delayed.
The physical properties of biochar seem to be dominant factors in affecting hydration, despite an unclear linkage with pozzolanic reactivity. The smaller particle size of RH-BC results in a higher reaction peak.
Incorporating 5 wt% biochar in this study could improve the compressive strength of cement paste at 7 days. Biochar’s unique water absorption characteristics can influence strength development by reducing excess water in the cement paste. However, pre-saturated biochar may impede strength gain, especially in the early stage if the effective mixing water is not achieved in the mixture.
Incorporating biochar into cement paste can modify its rheological behavior by affecting yield stress, plastic viscosity, and thixotropy. These alterations indicate how the type of biochar and its pre-saturation conditions influence the rheological properties of cement paste, highlighting the necessity of careful tailoring for practical application.
This study primarily focused on examining the characteristics of biochar in early-age hydration and fresh properties, limiting the scope to one replacement ratio (i.e., 5 wt%) with two different biochar types and two saturation states. The authors are currently working on optimizing biochar usage with higher dosages, and the results will be reported in a separate paper in the future.
This study examines the potential of converting waste into biochar and its subsequent applications in construction materials. In particular, the performance and availability of RH-BC underscores its potential for integration into concrete formulations at construction sites. However, owing to its high variability in properties, a more comprehensive investigation is needed to identify the property-structure-processing-performance relationship of cementitious mixtures with biochar. To optimize biochar-incorporated concrete for practical construction applications, future optimization efforts need to consider both short-term physical and mechanical properties and long-term durability factors, such as freeze–thaw resistance and shrinkage performance.
Footnotes
Acknowledgements
This work was supported by the US Department of Transportation through the IBT-ABC University Transportation Center, under award number 69A3552348322. The authors gratefully acknowledge the Texas A&M University System Center for Infrastructure Renewal and the Texas A&M University Microscopy and Imaging Center for the use of their research facilities. The authors also appreciate the Texas Lehigh Cement for providing Type I OPC for this research.
Author Contributions
The authors confirm contribution to the paper as follows: study conception and design: I.K. Jeon, Y.R. Kim, and J. W. Bullard; data collection: I.K. Jeon; analysis and interpretation of results: I.K. Jeon; draft manuscript preparation: I.K. Jeon, Y.R. Kim., J.W. Bullard. All authors reviewed the results and approved the final version of the manuscript
Data Accessibility Statement
Data supporting the findings of this study are available from the authors on request.
Declaration of Conflicting Interests
The authors declared no potential conflicts of interest with respect to the research, authorship, and/or publication of this article.
Funding
The authors disclosed receipt of the following financial support for the research, authorship, and/or publication of this article: This TAMU research (Project #: TAM-2024-1-01) was supported by IBT/ABC-UTC project (grant number: 69A3552348322) through the US Department of Transportation.