
Abstract
Highway authorities create and implement pavement maintenance and rehabilitation (M&R) programs to keep pavement conditions at a suitable level. Highway agencies generally face financial uncertainty for initiatives involving pavement repair and restoration because of limited resources and fluctuating government policies. Furthermore, natural and manufactured hazards, as well as rising concerns about inequity and ecology in the face of limited resources, make maintaining the pavement network at user-satisfactory standards significantly more difficult. In addition, recent research has found evidence of inequity and social injustice in tranportation policy and decision making. In this paper, a pavement M&R scheduling and budget allocation model is explored, with consideration in the formulation gives to maximization of average network condition, minimization of a horizontal equity measure (Gini index), and prioritization of pavement M&R based on social vulnerability. The uncertainty of available budget is modeled as a chance-constrained optimization problem. The proposed model provides an M&R program for the pavement network that achieves certain levels of equity vertically and horizontally. A case study examining the pavement network from Rockwall, Texas is conducted. The solutions for different chances of budget constraint are presented. Also, the value of the system to the decision maker is discussed. The results show that the proposed model is a practical and flexible way to include equity considerations in the management of pavement maintenance at the network level.
Keywords
The United States has invested heavily in developing around 2 million lane miles of public roadways over the past 100 years, providing accessibility, mobility, and facilitating the movement of goods fostering a better socioeconomic environment ( 1 – 4 ). The rising need to protect the vast infrastructure network prompted the development of the pavement management system (PMS) ( 5 ). Since then, to meet the expanding need for maintenance and rehabilitation (M&R), the scopes, techniques, and methodologies in PMS have been increased. The idea of a PMS originated from these ideas ( 6 ). In addition, legislative requirements through the Moving Ahead for Progress in the 21st Century (MAP-21) and Fixing America’s Surface Transportation (FAST) ( 7 , 8 ) Act gave momentum to the development of PMS ( 9 ). Despite the development of PMS tools, pavement management is still a challenging task for state highway agencies (SHAs) because of wide gaps in the funding for pavement M&R. The funding shortfall leads to a significant backlog in timely M&R applications. ASCE, in the report card for America’s infrastructure, graded road infrastructure as a “D” and reported that there is a $435 billion backlog in pavement repair ( 10 ) which leaves about 43% of highways in fair to poor condition ( 10 ). Pavement management becomes more challenging for multiple reasons such as the aged pavement system deteriorating more quickly ( 11 , 12 ), growing demand for travel (especially freight traffic), the consequences of inclement weather, and more attention being given to sustainable management practices. The growing demand will necessitate larger capital expenditure for maintenance and repair as the present transportation infrastructure ages and deteriorates. This financing is mostly provided by the highway trust fund and is derived from the fuel tax. However, owing to stagnating state and federal gasoline taxes, more fuel-efficient automobiles, and rising construction and maintenance expenses, this fund can no longer offer a solid basis for highway investment demands ( 13 ).
Deteriorating roadway pavements generate a variety of difficulties, including increased user costs, dangerous driving conditions, increased GHG emissions and air pollution, as well as poorer water quality. According to research, poorly maintained roads force users to pay an extra $599 in car operating expenses on average ( 1 ). Additionally, several research studies have revealed that deteriorated pavement affects traffic safety ( 14 – 16 ). Poor pavement conditions can add to the environmental cost by increasing fuel use, lowering air and water quality, and increasing noise ( 17 ). Furthermore, poor road conditions exacerbate the difficulties faced by underprivileged populations and socially vulnerable communities. For example, low-income households may face financial hardship as a result of increasing car running expenses caused by poor pavement conditions since transportation costs consume a significant portion of household income. Several studies have discovered inequity and injustice for socially vulnerable populations caused by highway construction and maintenance investment ( 18 – 20 ). The principal reasons identified behind the notion of inequity in transportation are limited funding, disinvestments, imbalances in urban and rural systems, and formula-based funding allocations.
Decisions on transportation system development and maintenance have significant impacts on societies and can create social injustice ( 21 ). It is, therefore, important to incorporate equity measures in investment decision making along with sound engineering and economic principles ( 22 ). With the growing demand for sustainability and equity considerations in transportation to seek fairness, the FHWA pavement management roadmap identified research and development needs taking into account equity in several pavement management areas including data, decision-making tools, workforce, and community ( 9 ).
This study is derived from a doctoral dissertation ( 23 ) which explored models and frameworks to optimize pavement mainatenance and rehabilitation (M&R) programs incoroprating multiple considerations; the study aims to incorporate inequity considerations into M&R budget allocation programming to develop budget allocation and M&R programs for a network of pavement segments. This study incorporates both horizontal and vertical equity considerations along with benefit maximization into the pavement management model. Furthermore, the study employed a chance-constrained optimization method to reflect the lack of funding (funding fluctuates within the planning horizon) in network-level pavement M&R planning.
Background
This section of the article discusses pavement M&R planning approaches and methods. It also discusses equity, equity in transportation, equity measures, and equity considerations in network-level pavement M&R budget allocation and programming.
Pavement Maintenance and Rehabilitation Planning
Pavement M&R programming involves optimizing the use of limited funding to maintain pavement conditions at or above the pre-specified target condition level ( 24 – 27 ). To make optimal use of money available for keeping pavement conditions at the target level, highway agencies employ pavement management systems (PMS) that help store, retrieve, monitor, and synthesize pavement condition data to make strategic decisions M&R ( 28 – 32 ). PMS offers logical data to assist in deciding which pavement portion will undergo treatment, when the treatment will be carried out, and what kind of treatment will be used ( 33 ). The M&R schedule based on PMS tools helps pavement maintenance decision makers to formulate a pavement management plan (PMP) over a planning period ( 34 , 35 ). Pavement M&R planning can be of two types: project-level M&R planning, where M&R plans are project-specific through analysis of detailed data on a pavement segment ( 36 – 38 ); and network-level M&R planning which considers a set of pavement segments as a network ( 25 , 39 – 41 ). Network-level pavement M&R planning can broadly be classified as a budget planning problem and budget allocation problem. The network-level budget planning problem obtains required funding estimates for chosen pavement network condition targets, while the budget allocation problem involves the distribution of available funds so that benefits can be optimized ( 42 ).
Several researchers have proposed a variety of approaches for network-level M&R planning. Most of these models include identification of network characteristics, evaluation of current needs, definition of treatment strategies, prediction of future conditions, development of optimization algorithms, and selection of appropriate treatments ( 43 ). Most of the proposed optimization approaches have two essential components in common: an optimization algorithm and a pavement performance prediction model. Since the development of PMSs, many researchers have adopted optimization algorithms. These include integer programming ( 24 , 25 , 44 – 46 ), linear programming ( 39 , 47 , 48 ), dynamic programming ( 49 , 50 ), and heuristic methods ( 33 , 51 – 53 ).
Models for pavement M&R assume a specific budget, but current funding scenarios make this unrealistic. Funds for pavement M&R programs can fluctuate given constrained resources, policy changes, and competition. Therefore, models should consider the random nature of budgets to avoid suboptimal maintenance plans and unstable pavement conditions ( 34 , 47 , 54 , 55 ).
Despite numerous pavement M&R planning models, most focus on economic aspects. It is crucial to consider people’s perspectives in decision making for pavement management, as research shows unfair distribution and inequity in transportation services.
Equity Concepts and Equity in Transportation
Equity, a multifaceted concept, encompasses social justice, fairness in resource allocation, and benefits to different communities ( 56 ). It refers to a person’s perception of fairness in exchange, while inequity is dissatisfaction with outcomes to input ratios ( 57 , 58 ). Adams’ theory of inequity advocates that individuals and groups feel their efforts and rewards are unequal in social exchanges, leading to perceived dissatisfaction and distress, ultimately affecting societal growth and well-being by altering the relationship between inputs and outputs ( 59 , 60 ).
Growing inequity, including income inequality, is a global problem affecting economic growth ( 61 ). In the United States, it includes income inequality, wealth distribution, and ethnicity disparities ( 62 ). Inequity within policies and organizational arrangements is a moral and economic issue, causing increased stress and instability ( 62 , 63 ). To improve social integration and well-being, inequity in every organization should be addressed and policies that lead to equity should be adopted.
The transportation industry also deals with policies and decisions that can create inequity in society ( 64 ). With the growing concern over inequity in society, equity analysis, policy making, and planning in transportation have begun to consider equity in the research and development process ( 65 ). However, there are well-developed frameworks for such analysis. Equity in transportation broadly applies social justice principles to the objective of achieving equality in mobility and accessibility ( 66 ). The recent Executive Order 13985 ( 67 ) directed that systematic methodology should be developed to integrate equity into the decision-making process in organizations and programs.
To integrate the equity consideration or develop inequity-averse decision-making processes, it is necessary to explore the dimensions of equity, both horizontal equity and vertical equity ( 56 ). Horizontal equity relates to the concept of fairness and egalitarianism that everybody has equal priority while vertical equity encompasses social justice, environmental justice, and social inclusion ( 56 , 65 ).
Several researchers have considered equity in transportation research over recent decades. Wachs and Kumagai demonstrated a method to include equity theory in transportation planning in relation to accessibility ( 68 ). Analysis of accessibility from the social viewpoint and its integration into transportation planning have been explored in numerous research efforts ( 69 – 76 ). Social justice in public transportation has been investigated from the perspective of public transit policies, availability, spatial distributions, infrastructure, and costs ( 77 – 84 ). Social equity, spatial equity, and their combination are often studied to advocate fairness in bike and pedestrian facilities ( 72 , 75 , 85 – 89 ). Recent studies have emphasized equity and fairness in transportation infrastructure distribution and investment, considering conditions, improvements, and social and spatial distribution. Increased emergencies necessitate equity consideration in project assessments ( 22 , 69 , 90 – 95 ).
Although there is significant research available on transportation systems that explicitly and/or implicitly consider equity and fairness, equity considerations in pavement management are limited. Porras-Alvarado et al. stated that equity consideration in cross-asset fund allocation is often neglected ( 96 ) and proposed a multi-objective framework with consideration of efficiency and equity for the allocation of budget to pavement and bridges ( 96 ). However, they considered equity only from the asset’s perspective. Boyles ( 22 ) investigated equity concerns in association with network-level maintenance optimization, examining a multi-functional form of equality measures to deal with a convex optimization problem. However, the model explored only one direction of equity measures. France-Mensah et al. ( 97 ) investigated social equity quantitatively in the context of pavement management. The model is extended to include a sustainability measure such as GHG emissions ( 98 ). Naseri et al. ( 99 ) presented an equity index in International Roughness Index (IRI). Despite some quantitative models available for equity considerations in pavement M&R programming, equity considerations need to be explored more from the perspective of society and a pragmatic management process. Amin et al. ( 100 ) proposed a pavement M&R budget allocation plan considering multiple goals and stakeholders’ preferences to create equity in the achievement of goals.
This paper proposes a framework for inequity-averse pavement M&R budget allocation and programming, incorporating horizontal and vertical equity considerations for efficient PMSs.
Problem Formulation
This section presents a methodological framework ( 23 ) for pavement M&R budget allocation and scheduling problems, integrating social exchange, and prioritizing pavement quality in vulnerable areas (Figure 1). It is a multi-objective mathematical program considering budget constraints, M&R selection, and future conditions.
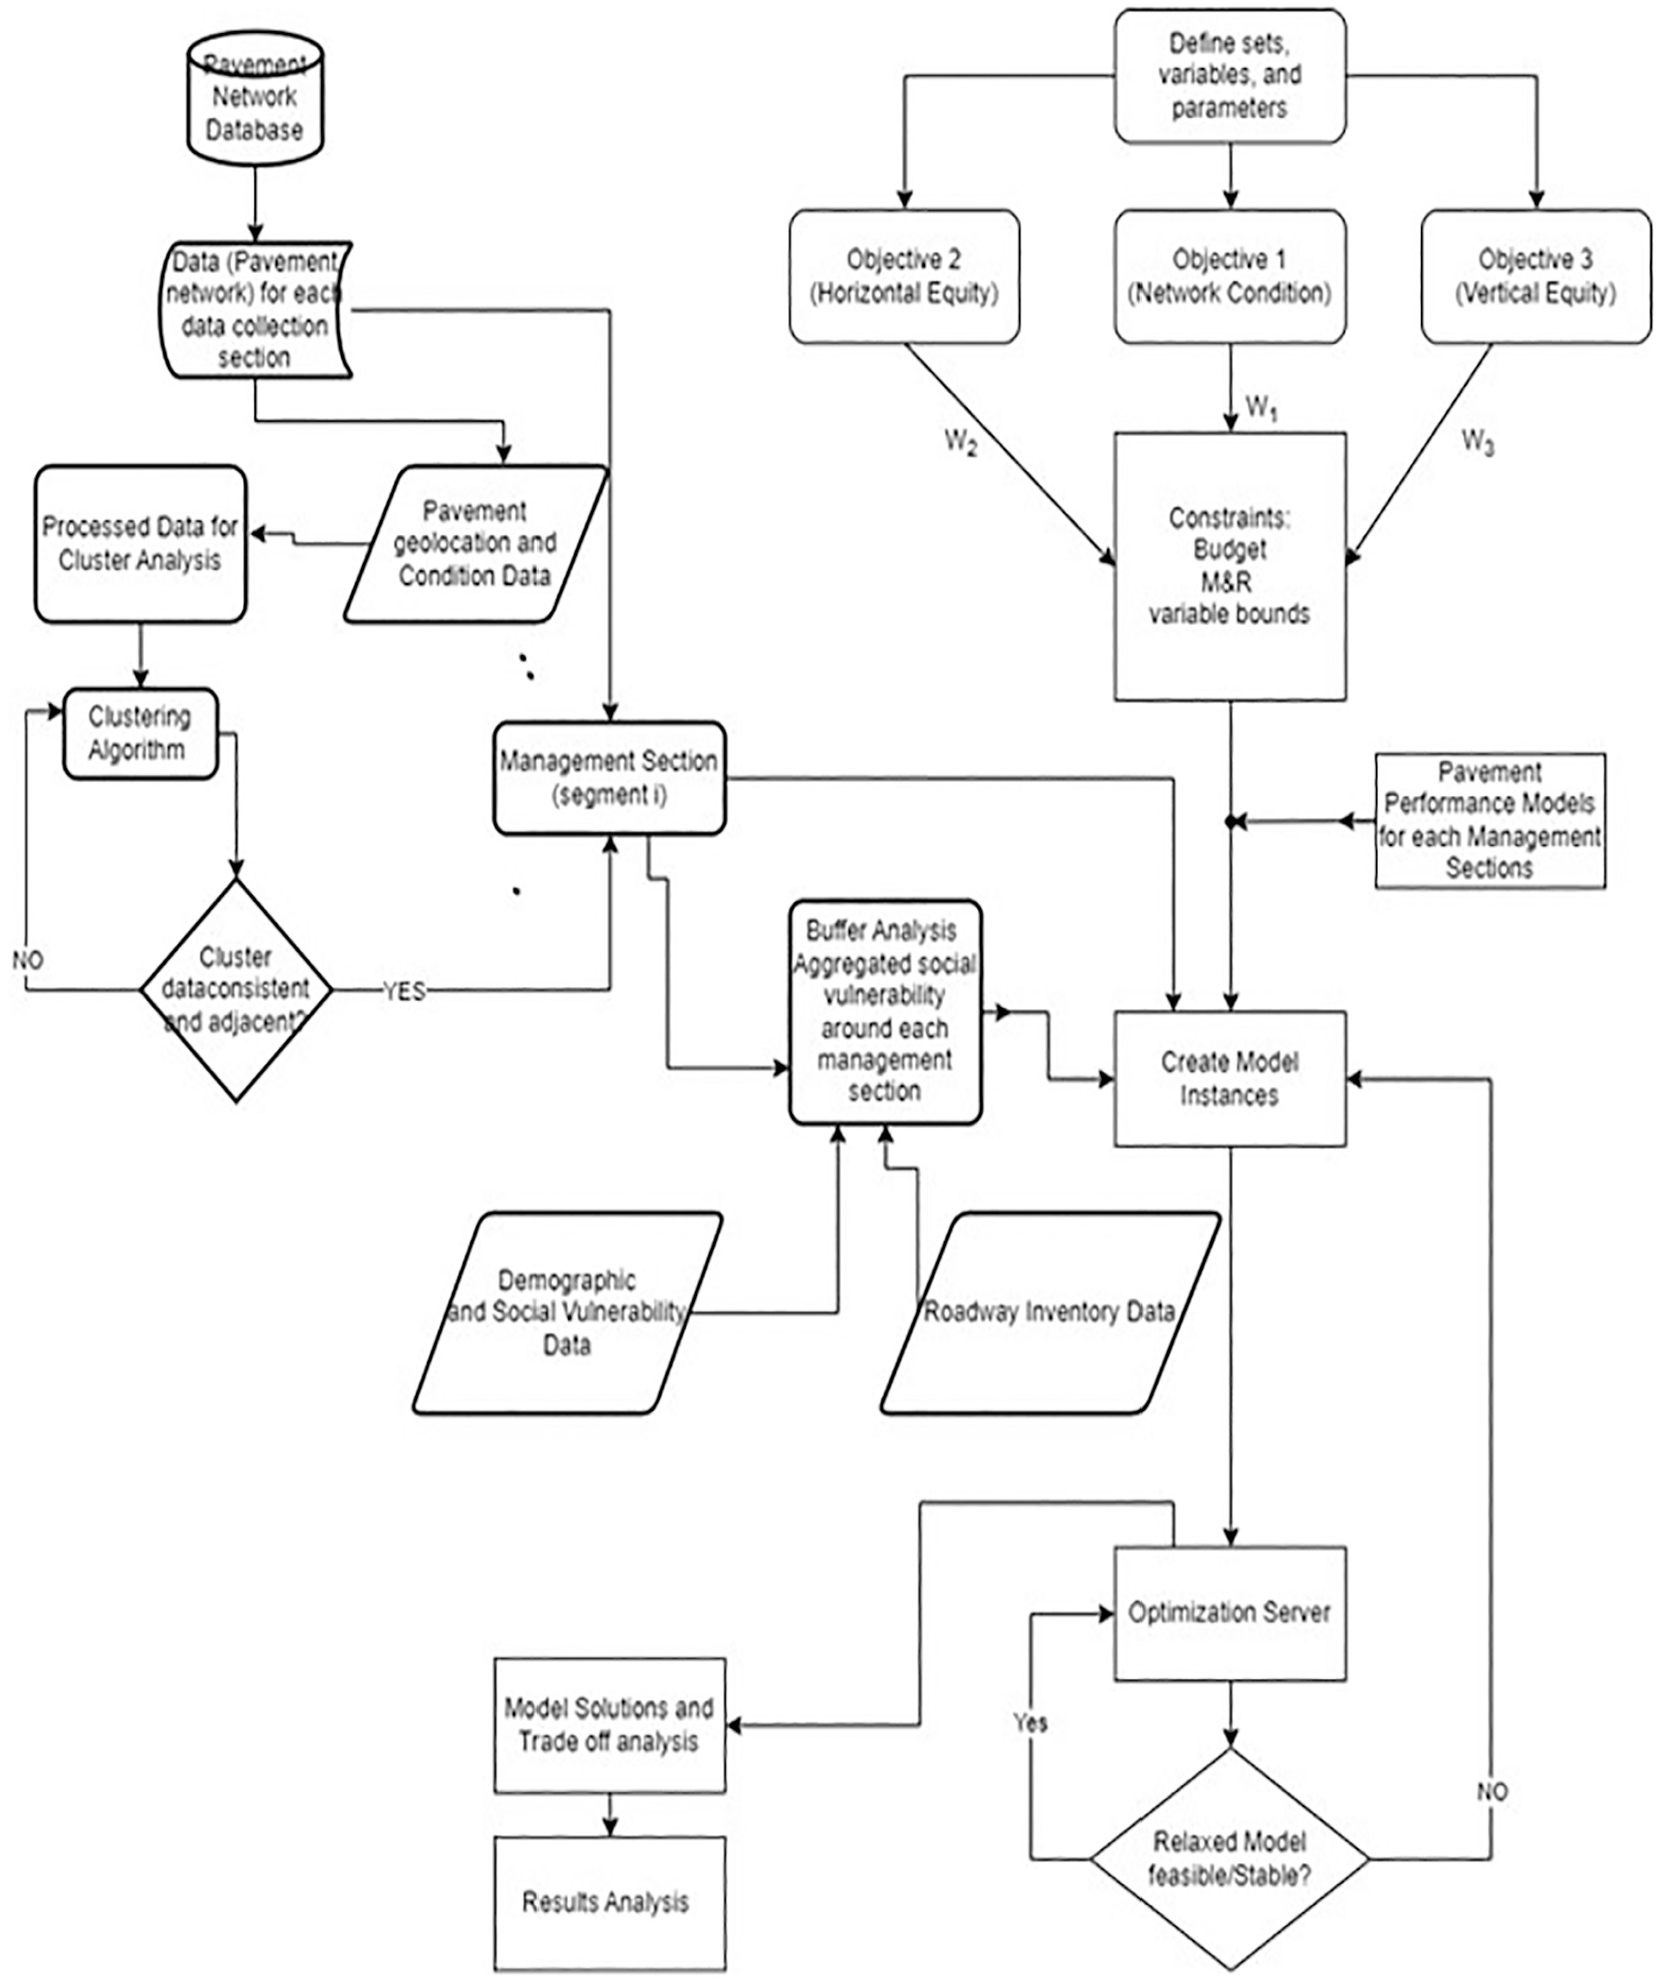
Methodological framework of the proposed mode.
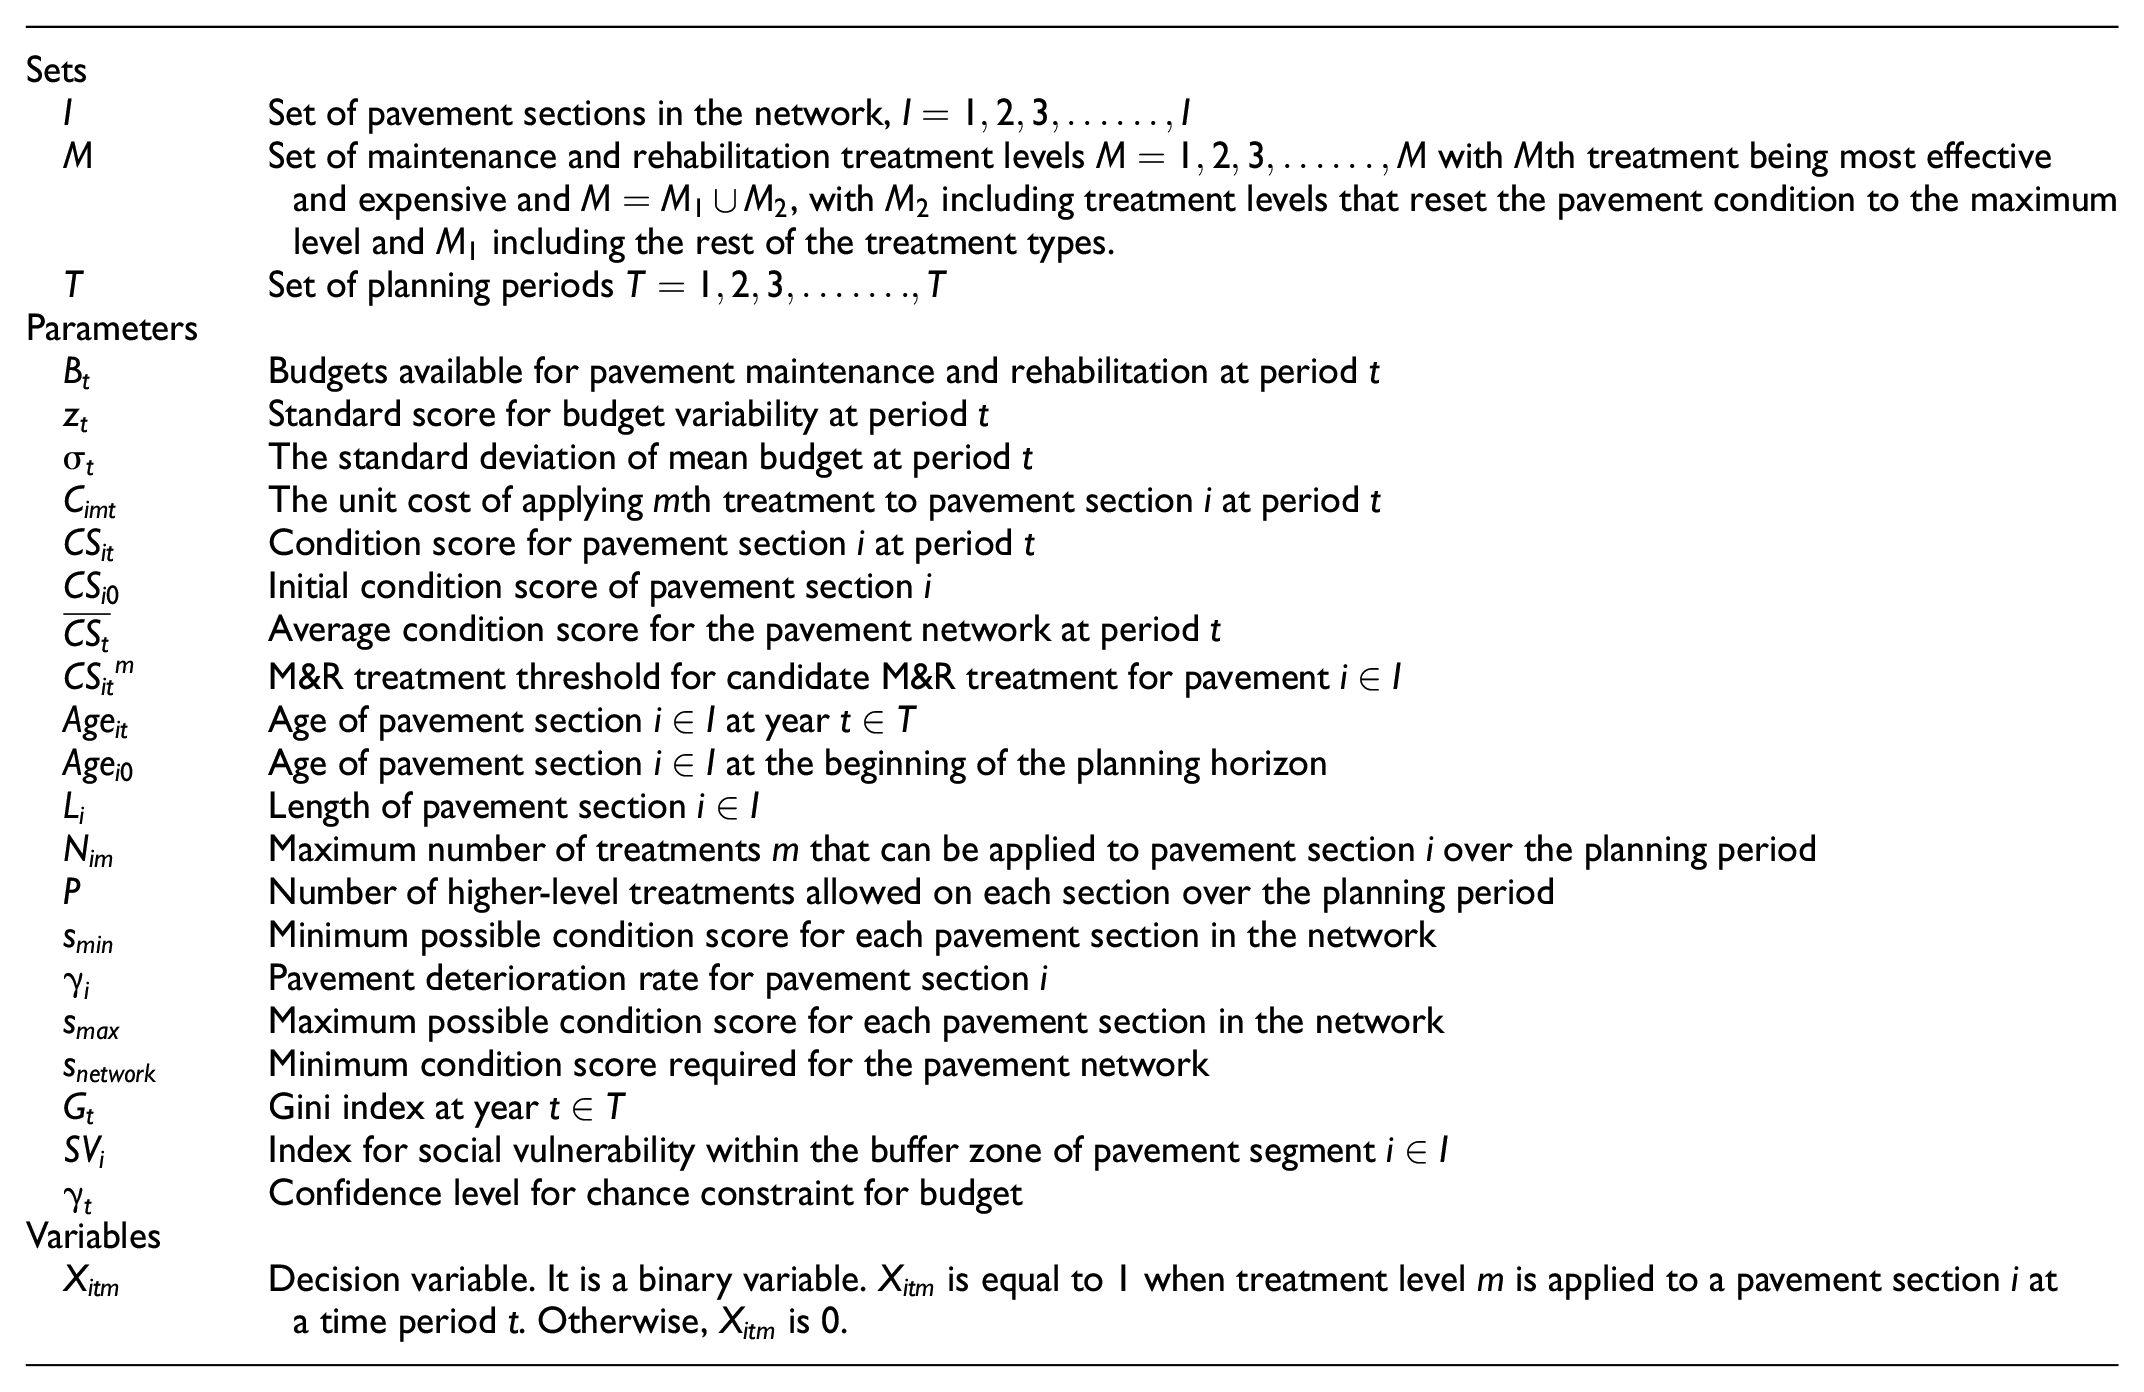
Nomenclature
The sets, parameters, and variables used in the formulation of the mathematical models are described as follows:
Pavement Deterioration and Prediction of Condition Score
The proposed framework includes a pavement performance model to map variables such as age and load repetition to pavement responses, guiding the evolution of pavement section condition annually, considering M&R treatments ( 101 , 102 ). The study uses the pavement condition score (CS) as a performance measure for individual pavement sections and the entire network, evaluating ride quality and pavement distress ( 103 – 106 ):
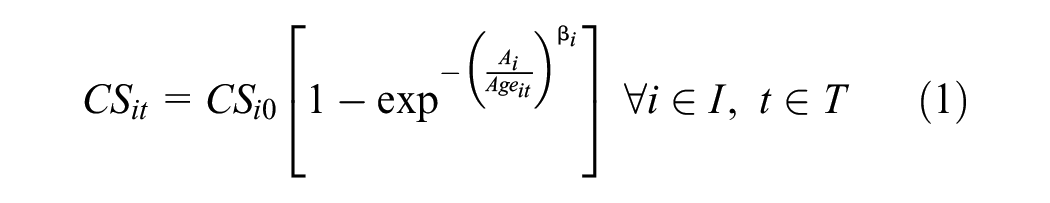
Pavement peformance function in Equation 1 is demonstrated in Figure 2.
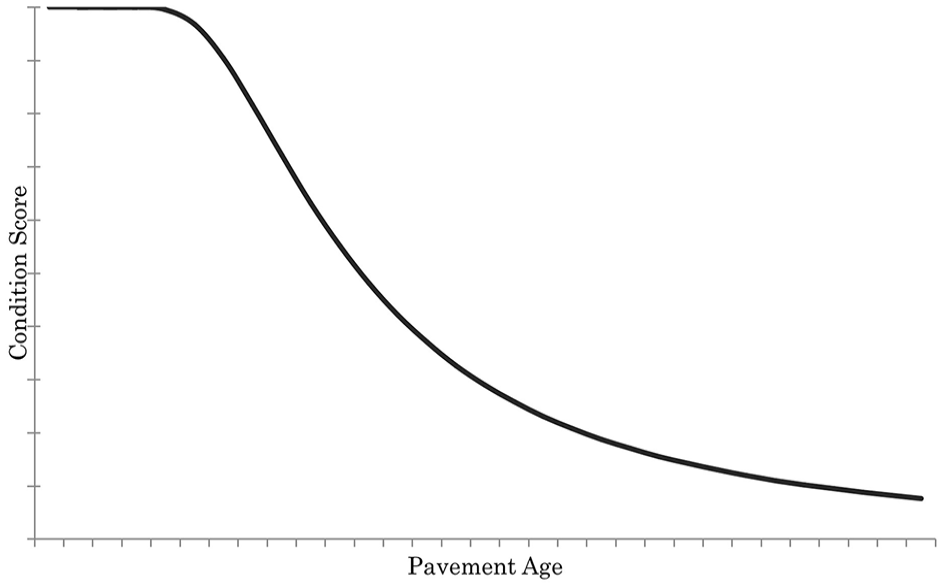
Pavement performance curve.
As illustrated in Figure 2, a pavement section
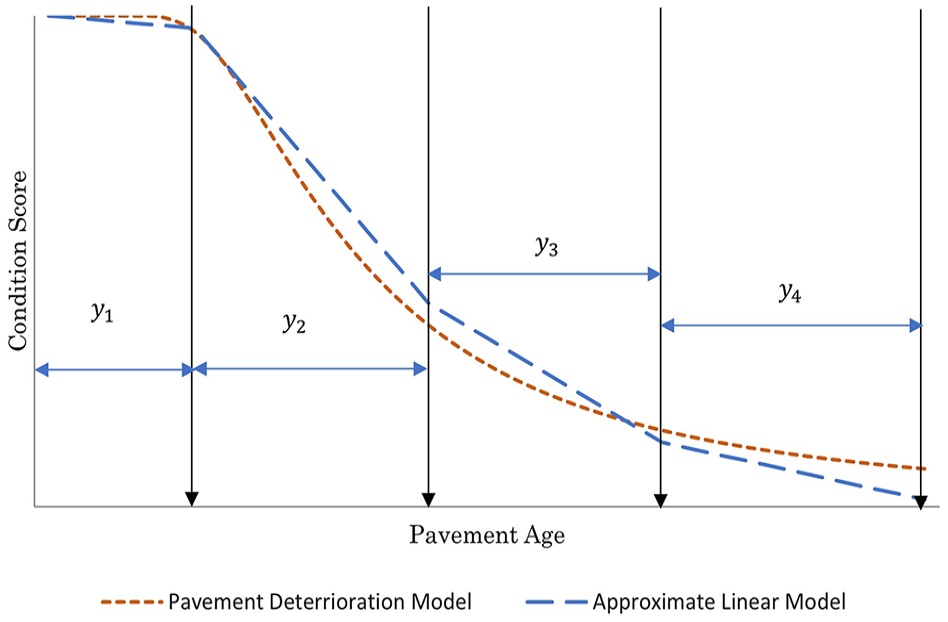
The pavement performance model used in the study is approximated using a piecewise linear function (
108
). Equations 2 and 3 show the approximate linear pavement performance model. Equation 2 represents that the age of a pavement section is split into
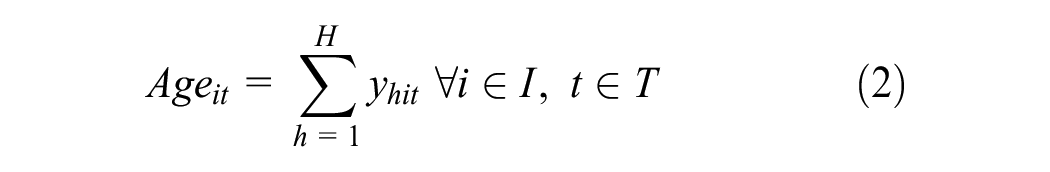

Figure 3 shows the approximate linear performance model for a pavement section when the age is split into four segments (Figure 3).
Example of pavement performance models.
Grouping Pavement Data Collection Sections into Management Sections
Pavement data collection sections are usually short length segments (∼0.5 mi) to collect roughness, and distress data ( 41 , 109 ). From the practice perspective (prioritize projects, project letting, and implementation) adjacent pavement data collection sections need to be stitched together to form a pavement management section. This study uses clustering techniques to form a management section using pavement-related data including pavement functional class, pavement mile points, geographic location, pavement condition, reference markers, pavement roadbed (i.e., mainlane, frontage road, etc.), annual average daily traffic (AADT), and a pavement data collection section adjacency matrix. This study employs a k-means clustering algorithm to group homogeneous adjacent pavement data collection segments into pavement management sections using the scikit-learn Python package ( 110 – 113 ).
Objective 1: Condition Score
Objective function 1 in this study is to maximize the average network-level condition score over the planning period:


The objective function 1 is expressed in Equations 4 and 5. Equation 5 describes the average network-level condition as the length-weighted average from all management sections
Objective 2: Horizontal Equity
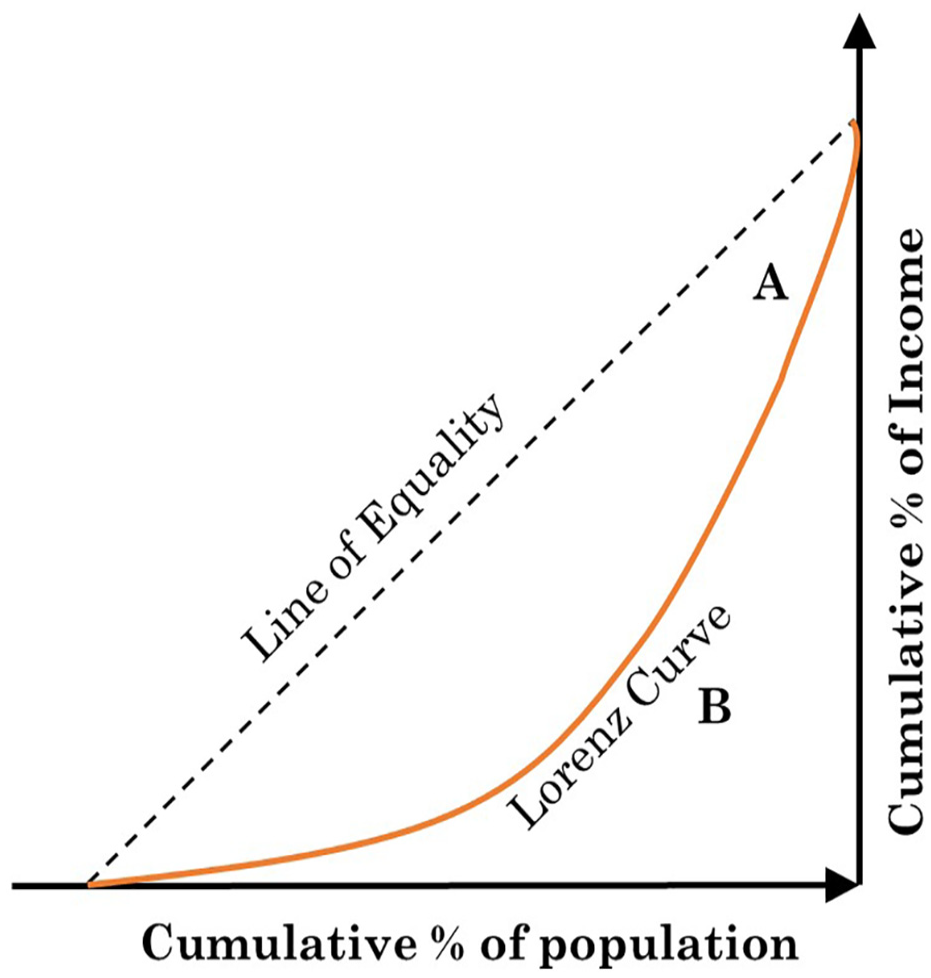
Horizontal equity refers to equality and fairness. Horizontal equity encompasses equal treatment for equal distribution of benefits and costs ( 55 ). Traditionally, different metrics have been used for assessing horizontal equity measures ( 75 , 114 – 116 ). This study applies the Gini index, proposed by Corrado Gini ( 117 ) to measure inequality in income distribution. The Gini index can be described graphically by the Lorenz curve ( 118 ). Figure 4 shows a schematic of the Lorenz curve, from which the Gini index can be calculated as:

Lorenz curve.
The total surface area under the line of equality (45° line) is equal to

An alternate definition of the Gini coefficient that is comparable to the definition based on the Lorenz curve is half of the relative mean absolute difference. The relative mean absolute difference is calculated by dividing the mean absolute difference by the average to adjust for scale, and the mean absolute difference is the average absolute difference of all pairs of population items. Let


Equation 8 represents the measure of the horizontal degree of equality among pavement segments in the network, which in turn can lead to the notion that all people served by the pavement network received the same preference during the planning of the pavement M&R under a limited budget. Therefore, we have the second objective function as:

Objective 3: Vertical Equity
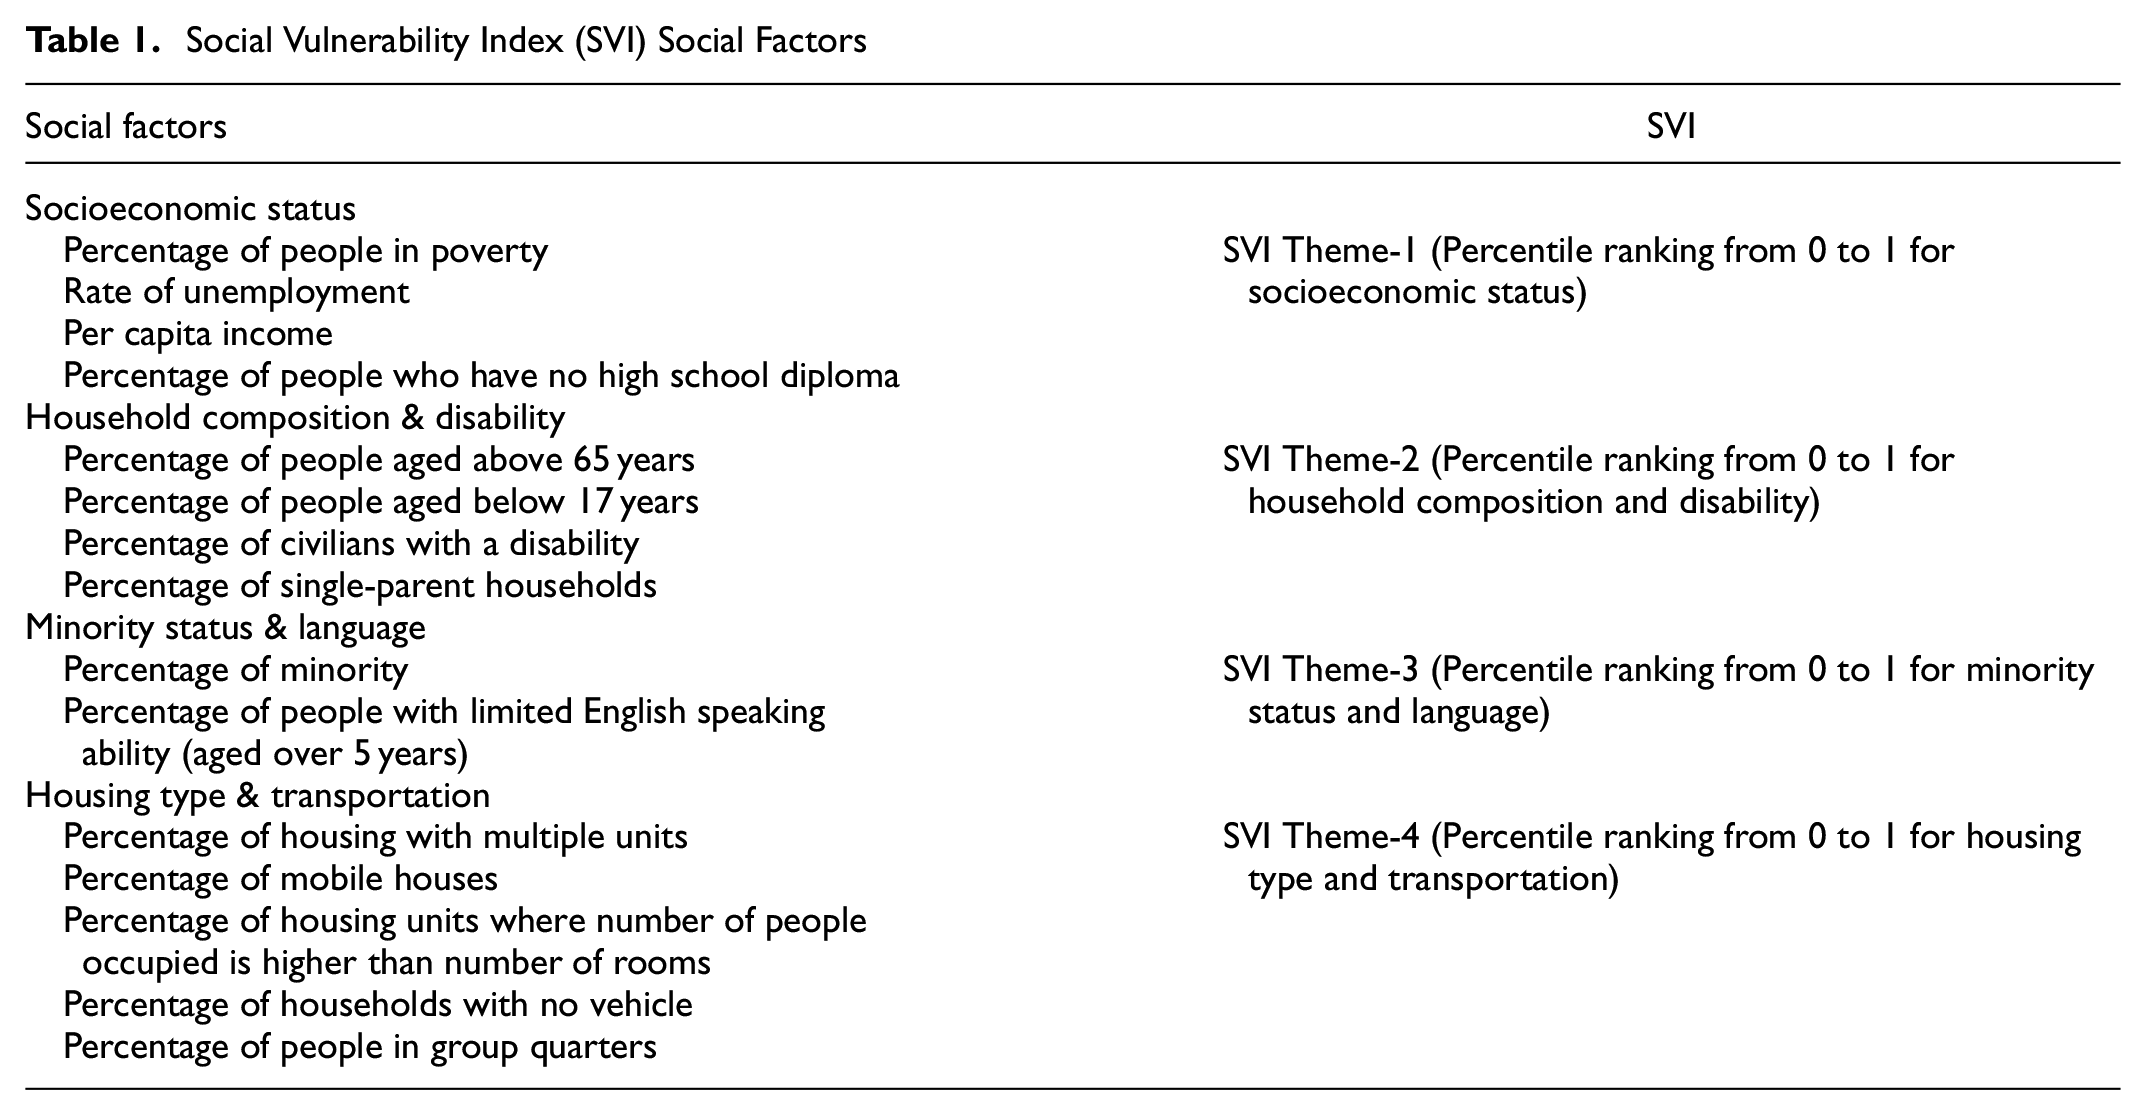
Vertical equity stands for the philosophy that disadvantaged individuals, groups, or regions should have the preference in the distribution of impacts of a policy intervention ( 56 , 94 , 119 , 120 ). Following this philosophy this study considers social vulnerability measures to prioritize the pavement M&R budget allocation and scheduling. Social vulnerability refers to the ability of individuals, groups, or regions to adapt and recover from natural and anthropogenic disasters, often linked to social inequities, which are factors that undermine their ability to respond ( 121 ). Poor pavement conditions can significantly affect socially vulnerable populations; for instance, there is a correlation between poor pavement conditions and road safety ( 16 , 122 , 123 ). Socially vulnerable people could experience comparably higher distress from a road crash than people with more social resilience ( 124 , 125 ). Therefore, social vulnerability measures should be incorporated into the pavement M&R budget allocation and scheduling framework. Several studies have explored the development of a metric and/or an index that combines multiple social factors based on the area of applications ( 126 ). This study employs the Social Vulnerability Index (SVI) developed by the Center for Disease Control and Prevention (CDC) as a vertical equity metric for pavement M&R budget allocations and scheduling ( 127 , 128 ). The CDC’s SVI is a tool based on American Community Survey (ACS) data, categorized into four themes: socioeconomic status; household composition and disability; minority status and language; and housing type and transportation (Table 1).
Social Vulnerability Index (SVI) Social Factors
The study used data from the CDC SVI database, pavement sections, and highway attributes to conduct proximity analysis and estimate the SVI for pavement segments. The third objective is to minimize the proportion of networks with poor to very poor condition scores prioritized by SVI. Equation 10 represents objective function 3 as:
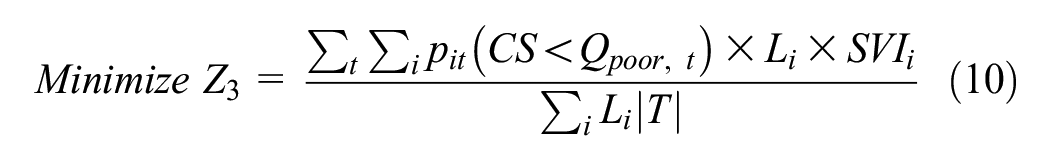
where
Chance-Constrained Programming for Budget Uncertainty
This paper uses a chance-constrained programming (CCP) model ( 129 ) to address uncertainties in pavement M&R budgets, focusing on the confidence level that determines the likelihood of satisfying an uncertain constraint.
Mathematically, the chance-constrained model is specified as:

That is, the solution to this model minimizes the objective function while satisfying the chance constraint

The equivalent deterministic constraint for a normal distribution can be formulated as follows:


The constrained budget can be represented by:

where
The available annual budget is a random variable

The transformation converts the stochastic chance constraint to an equivalent deterministic constraint, making the model easier to solve with a predetermined confidence level (reliability).
Other Constraints
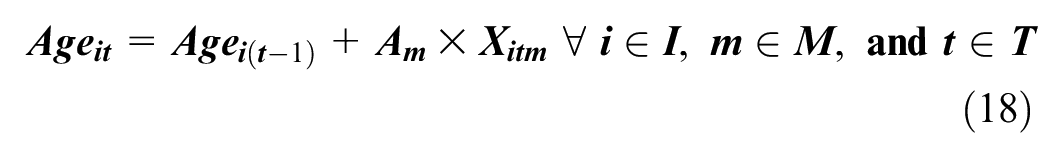
The pavement performance model, as depicted in Equations 2 and 3, accurately reflects the evolution of pavement conditions over the course of planning years. The application of an M&R treatment to a pavement section results in a change in its age and condition scores. If a pavement section
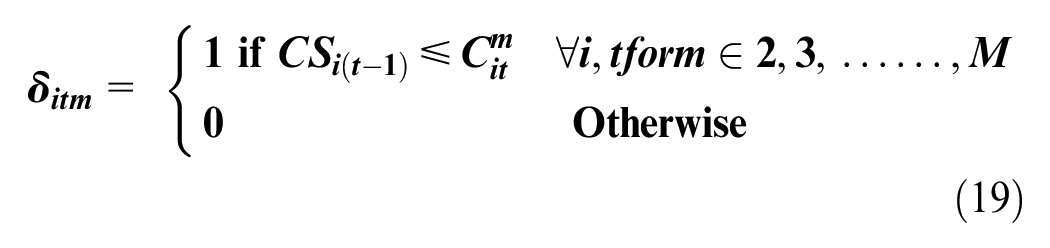
The candidate M&R treatment level for a pavement section is decided based on its condition in the previous year (Equation 19):
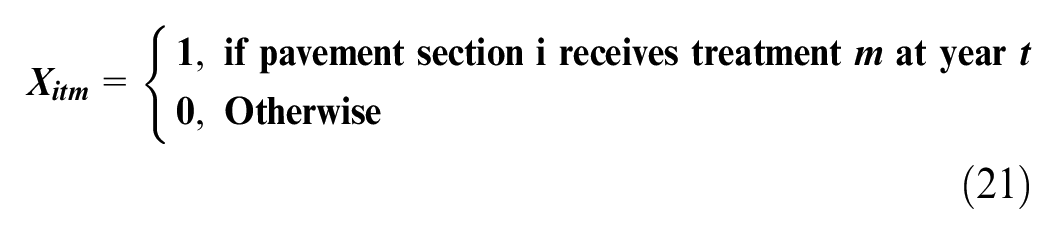
The treatment will be assigned based on the degree of preference for objectives and available budget using the following equation:

where
Equation 22 provides upper and lower bounds on the condition of a pavement section at any year in the planning horizon:

Average network condition can also be bounded by:

Equation 24 defines the maximum number of M&R treatment types that a pavement section can receive over the planning horizon:

Equation 25 limits the number of different treatment types that a pavement can receive over the planning period:

Equation 26 requires that a pavement section should only receive one M&R treatment type per year during the planning period:

Multi-Objective Optimization
Generally, the multi-objective optimization problem can be expressed mathematically as


where
In this case, the feasible region can be expressed as

If the weights
Case Study
The inequity-averse pavement M&R budget allocation model was applied to a county road network using GAMS and Gurobi optimizer on the NEOS server ( 133 – 136 ), with results discussed in subsequent sections.
Data for The Case Study
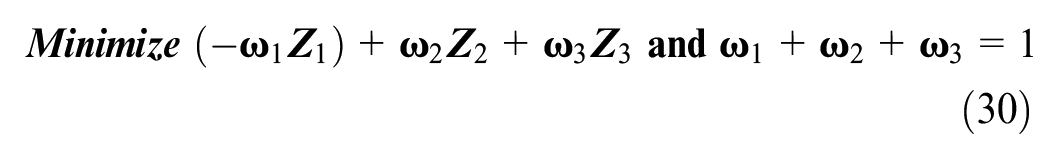
The proposed model has been applied on a county-level pavement network. Rockwall County in the Dallas District of the Texas pavement network has been used for the model demonstration (Figure 5).
Rockwall County, Dallas, Texas ( 137 ).
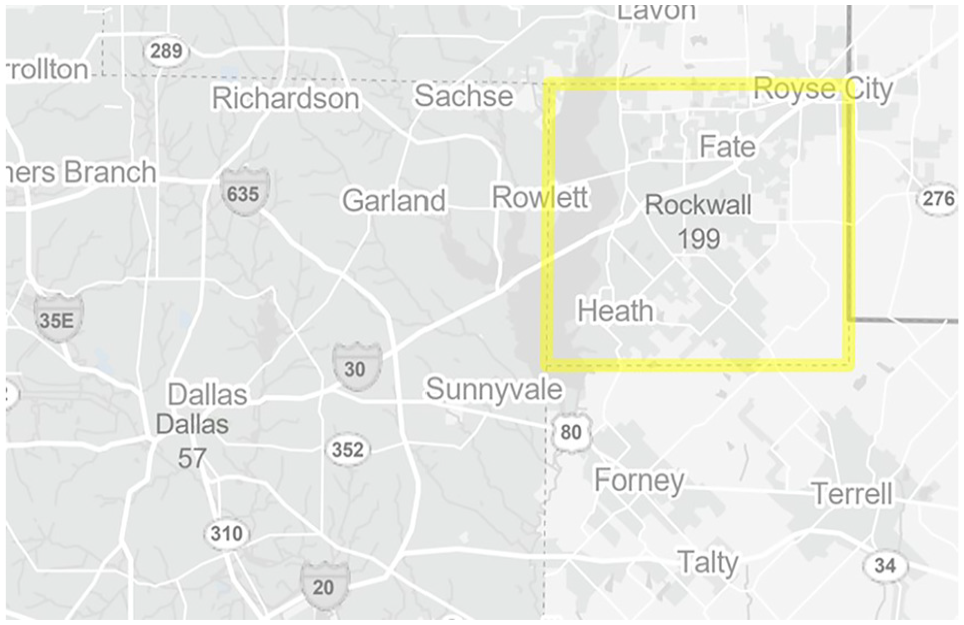
The 2018 Texas Department of Transportation’s (DOT) PMIS data, extracted from 307 collection sections, provide information on pavement conditions and network attributes across 322 lane miles. The daily vehicle miles traveled (VMT) is around 2 million with 215 thousand Truck VMT. The initial mean condition score is 61.8 with a standard deviation of 31 (Figure 6).
Initial condition of the pavement.
The case study uses condition score (CS) as the index for pavement conditions. Condition score is a composite index produced by aggregating pavement distress ratings and ride quality and ranges from 0 to 100 ( 102 ).
Data collection sections are usually 0.5-mi-long segments of highways designated by the Texas DOT reference markers and the distance from the origin (DFO) ( 138 ). PMIS data also contain highway designation along with functional classification and roadbed information, traffic data (e.g., AADT, percentage of trucks, traffic loadings), speed limits, pavement condition data (condition score, distress scores, ride score, IRI), pavement classification, and number of through lanes. These data are processed and used as input to group the PMIS data collection sections into homogeneous pavement management sections ( 139 ). An unsupervised classification algorithm, k-means clustering is employed to process PMIS using the scikit-learn package in Python (scikit-learn 2022) to create homogenous groups of pavement data collection segments into pavement management sections. The following rules are implemented to retain the adjacency of pavement sections:
The segments in a cluster must be on the same highway.
Roadbed (i.e., main lane, frontage road, left lane, right lane) within clusters must be the same.
Sections within a cluster must be adjacent in accordance with the adjacency matrix (developed using reference markers and DFO).
The k-means algorithm iterates until these requirements are met and pavement sections are consistent. The optimal number of clusters is found to be 70 using the elbow method ( 140 ). Therefore, the pavement network used in the case study has 70 pavement management segments with a total of 322 lane miles. The lengths of the management sections vary between 2 lane miles and 10 lane miles ( 107 , 139 ).
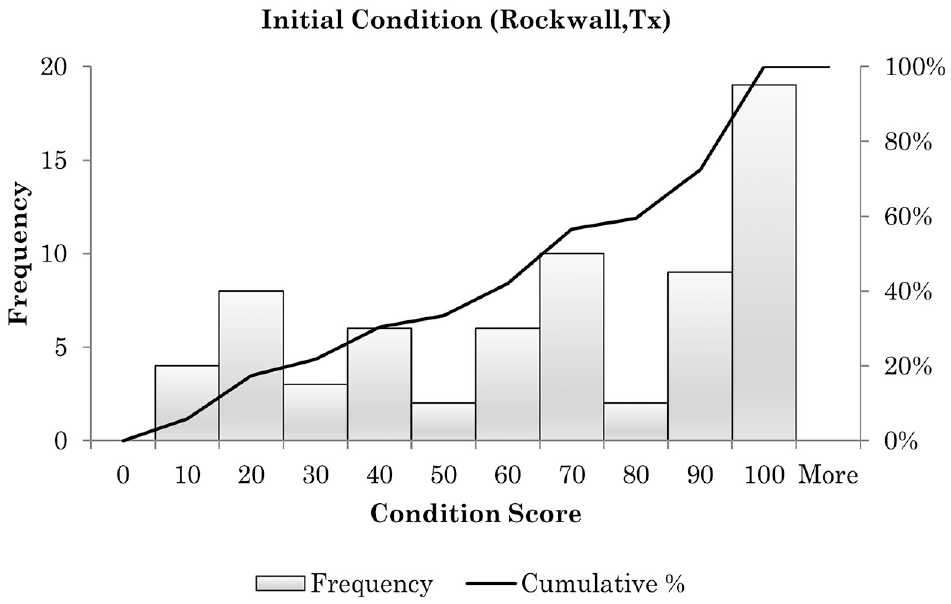
M&R treatments applied to the pavement sections in the case study are grouped into five treatment type categories: Do Nothing (DN), Preventive Maintenance (PM), Light Rehabilitation (LR), Medium Rehabilitation (MR), and Heavy Rehabilitation (HR). Since we cannot treat all pavement sections in the network, some of the pavement sections may be left untreated (i.e., assigned with DN). Table 2 shows the types of maintenance actions under each M&R treatment type ( 35 ) and unit cost.
Maintenance and Rehabilitation Treatment Types, Types of Maintenance, Unit Cost
Pavement performance functions are estimated using climate-subgrade zone parameters, and the final models are piecewise linear approximations. Initial pavement section age is estimated by backtracking initial condition scores.
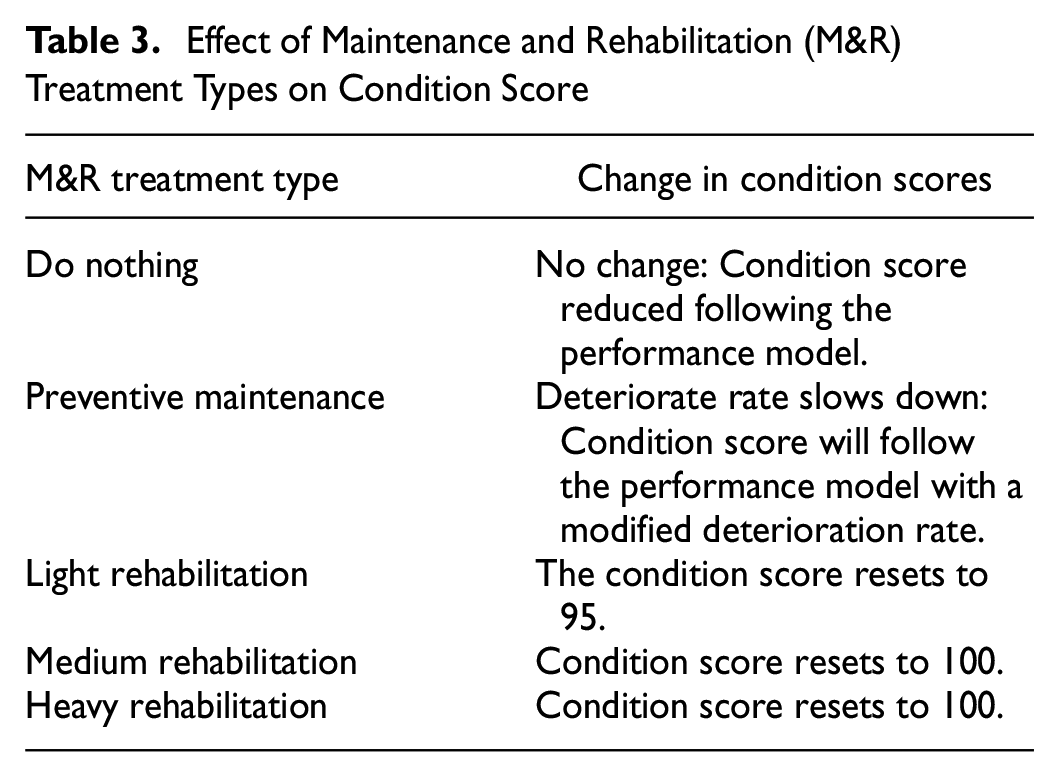
The effects of different treatment types on a pavement section are presented in Table 3.
Effect of Maintenance and Rehabilitation (M&R) Treatment Types on Condition Score
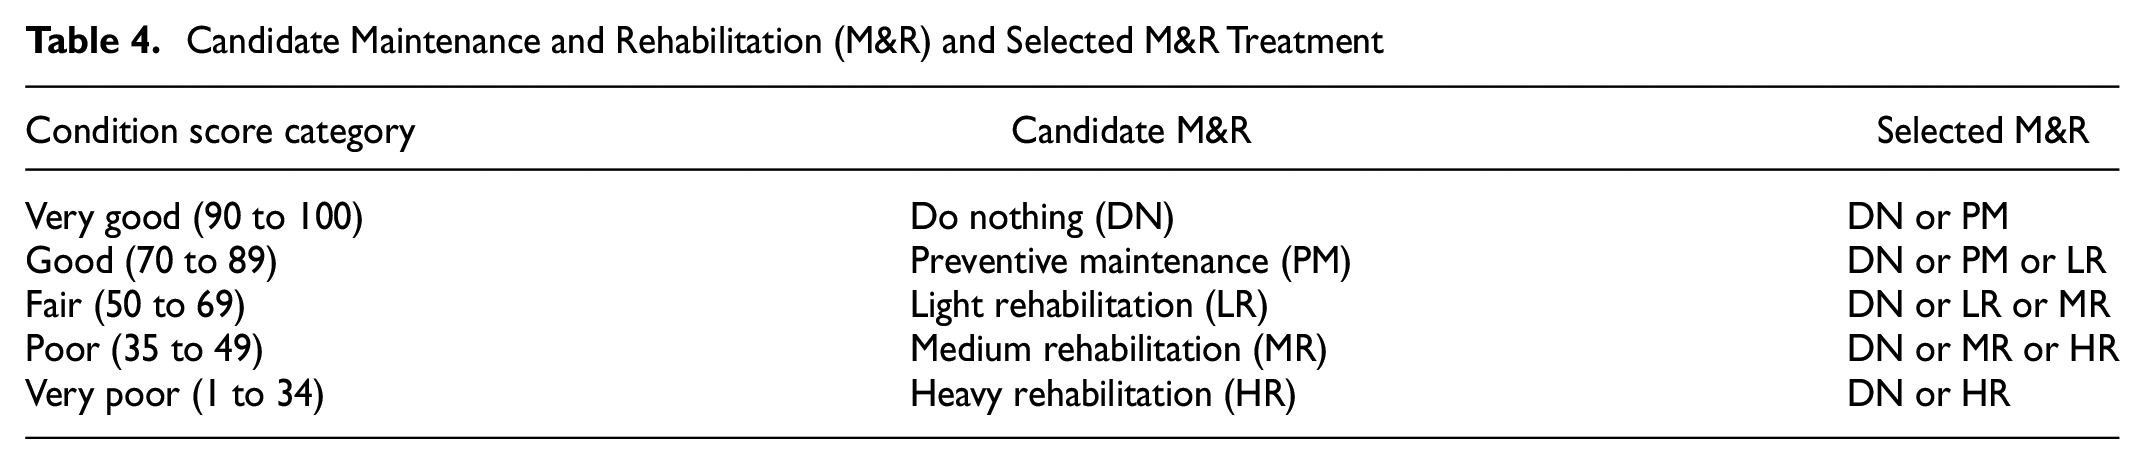
The M&R treatment type needed (candidate M&R) for a pavement section is decided based on the condition score category in the previous year (Table 4).
Candidate Maintenance and Rehabilitation (M&R) and Selected M&R Treatment
The optimization model selects pavement section M&R treatment type based on pavement condition, budget, and objective functions, with the flexibility to adopt a decision tree for candidate M&Rs. The proposed model limits pavement section treatments within the planning period, ensuring that a section receives no subsequent rehabilitation treatment in any given year.
The case study uses Texas DOT’s Database and Information System Characterising Objects in Space (DISCOS) data from 2015 to 2018 to estimate the annual pavement network budget, using a triangular distribution with parameters (6,000, 8,500, 10,000) and Monte Carlo simulation to approximate the random budget (Figure 7).
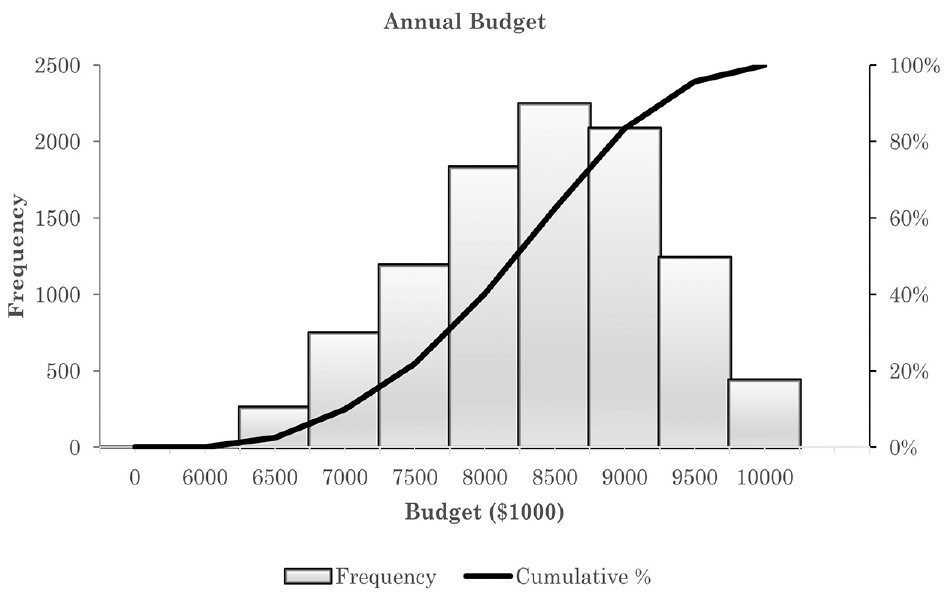
Monte Carlo simulation of annual budget.
The following objectives are considered in the case study:
Objective-1
Objective-2
Objective-2
The study uses 2018 CDC SVI data and ArcGIS roadway inventory to analyze vertical inequity in each census tract, incorporating proximity analysis for all pavement sections. Figure 8 presents SVIs for the case study, ranging from 0 to 1, with 1 indicating the highest vulnerability and 0 indicating no vulnerability.
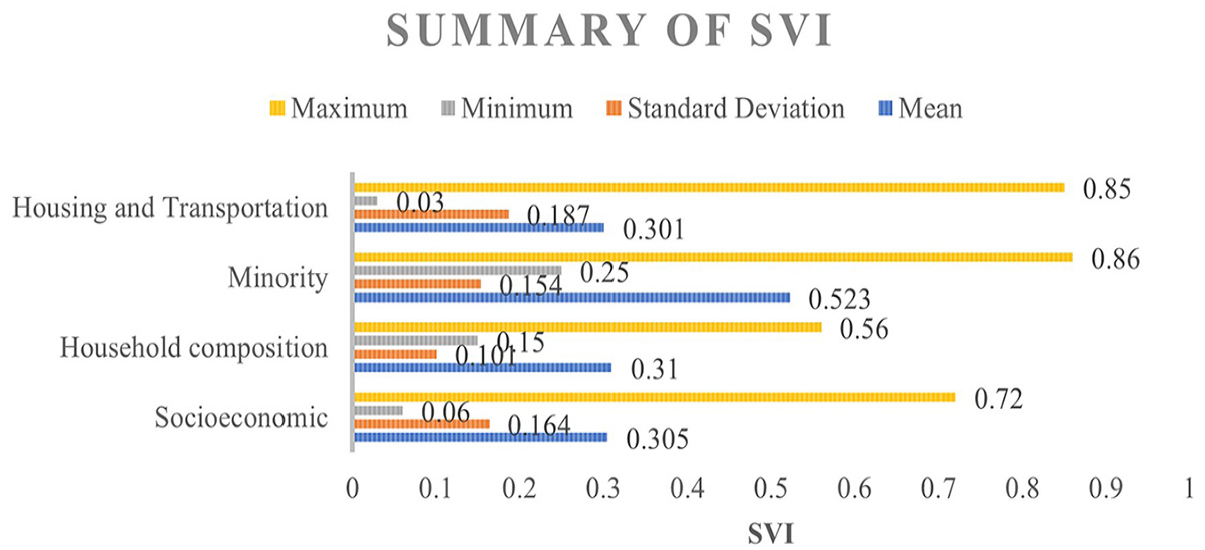
Social vulnerability indices (SVIs) for the case study.
Figure 9 shows an example of the buffer around a pavement section.
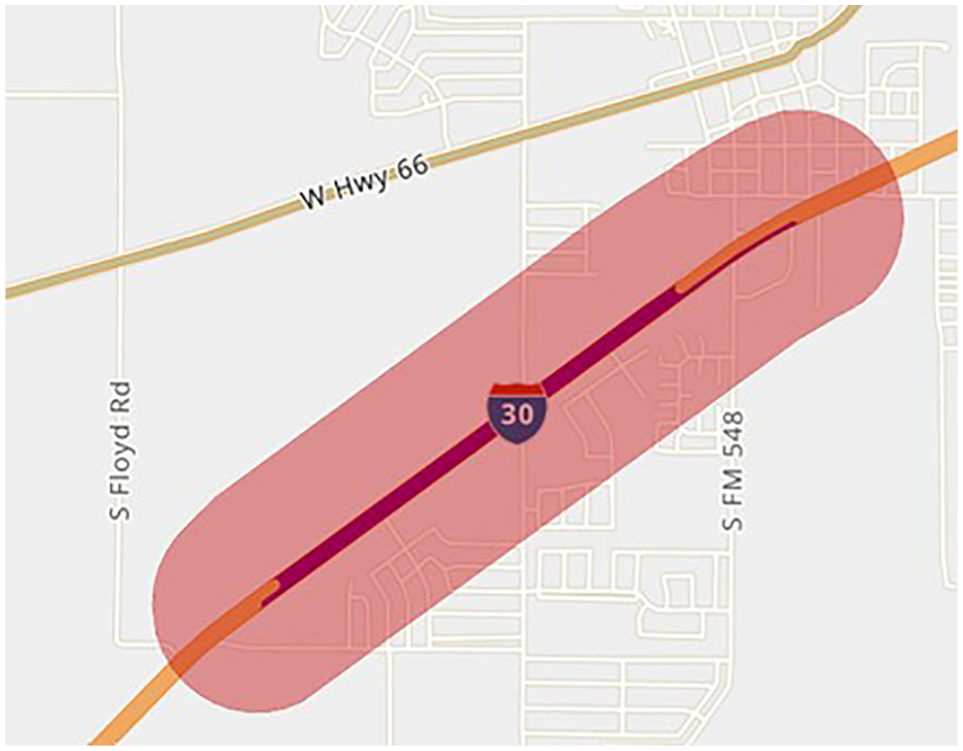
An example of a buffer around a pavement section.
Results and Discussions
The proposed budget allocation and M&R scheduling model is solved using model instances, NEOS server optimization, Gurobi solver, and mixed integer programming problems. Since we have three objective functions which are formulated as linear combinations using preferential weights:
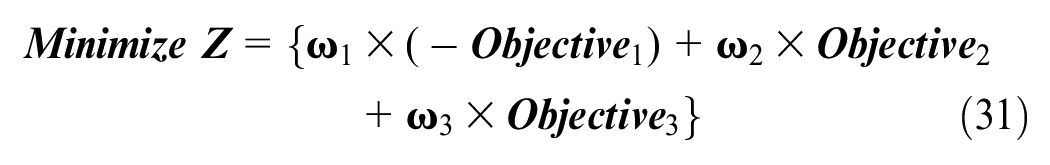
where
In this case study, we created different policies for budget allocation and pavement M&R programming by setting different weights on the objectives for the deterministic annual budget (setting
Different Weights on Objectives for the Case Study
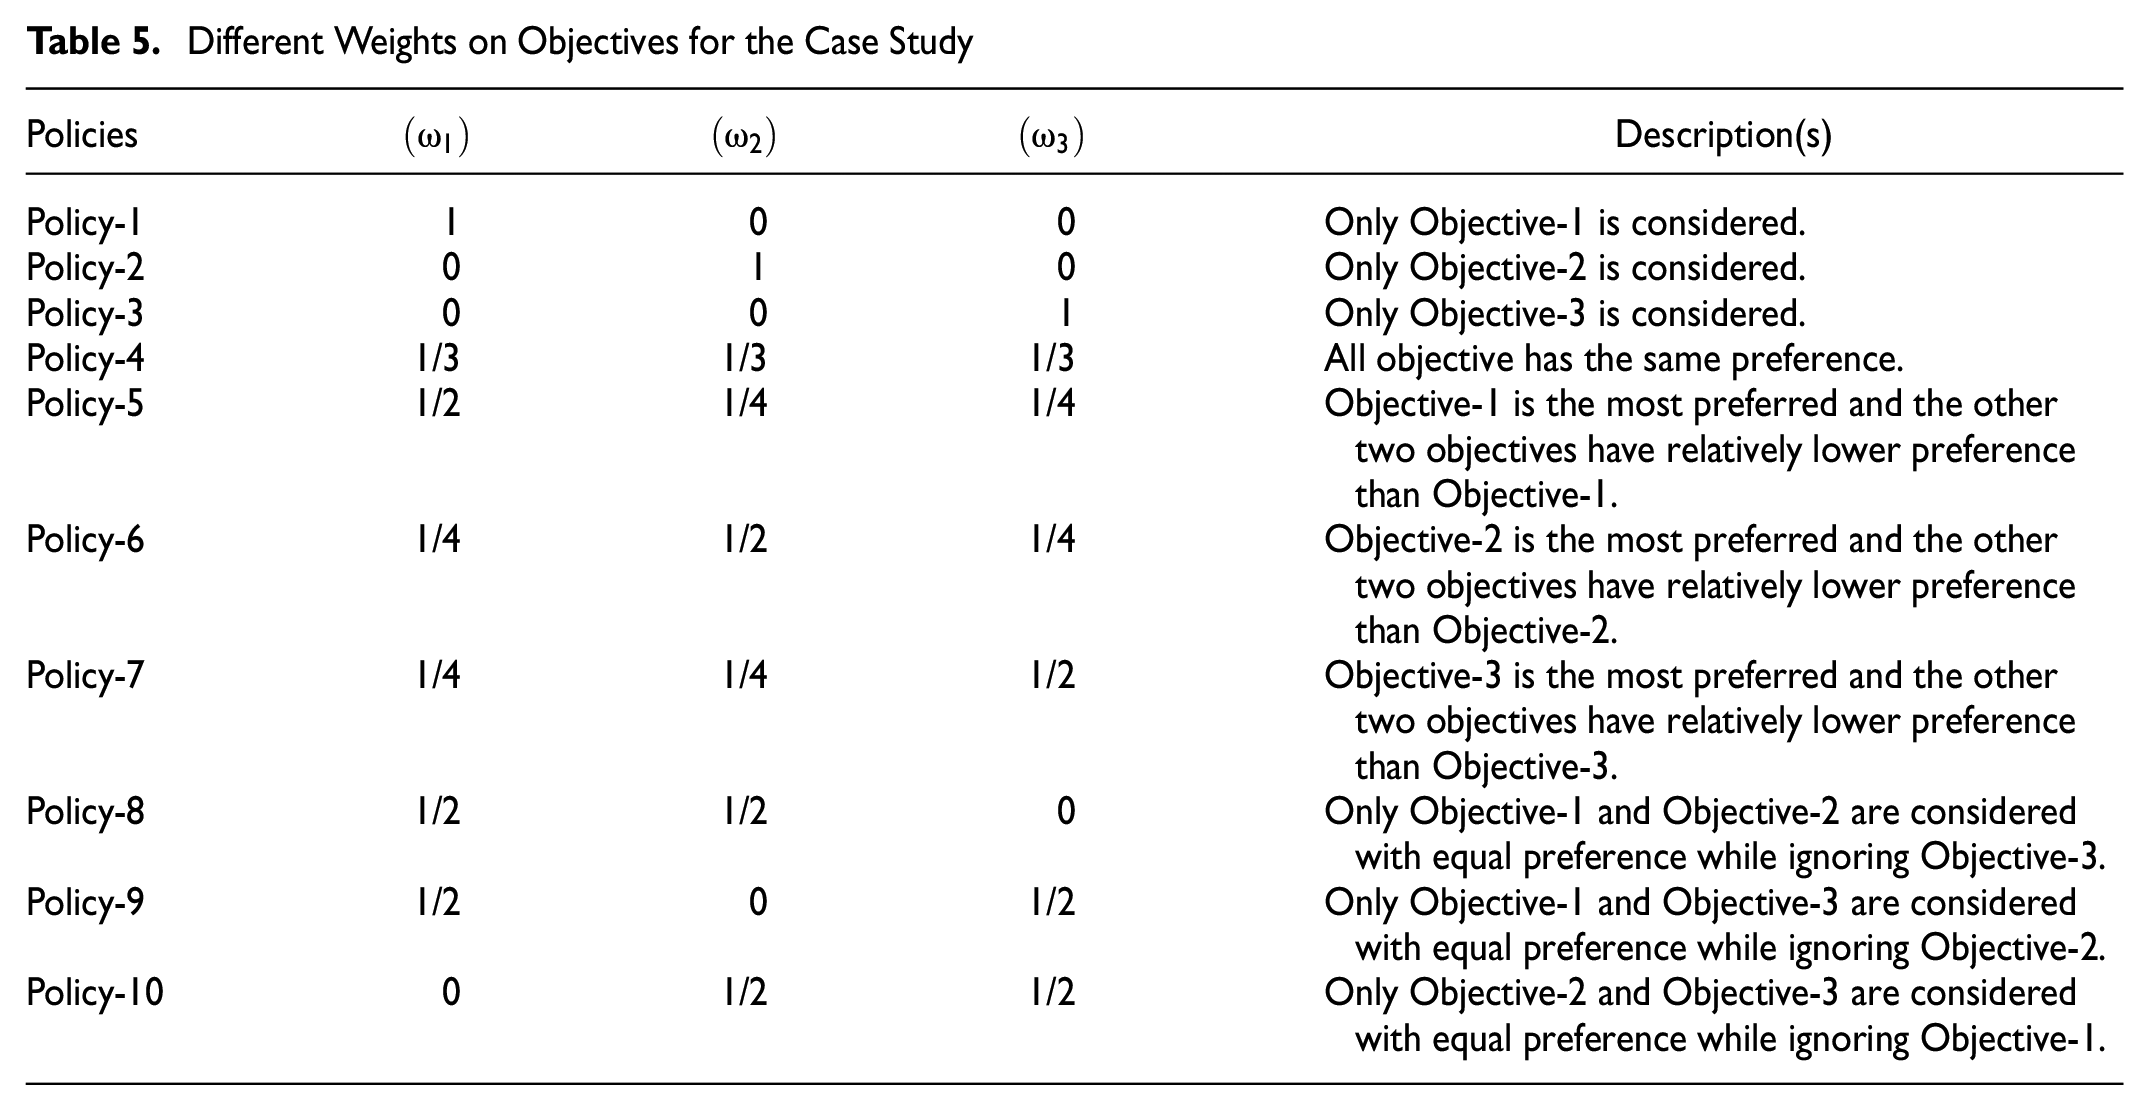
Figure 10 shows average costs of M&R activities vary under different budget allocation policies, with Policies 5, 8, and 10 showing significant variation in costs.
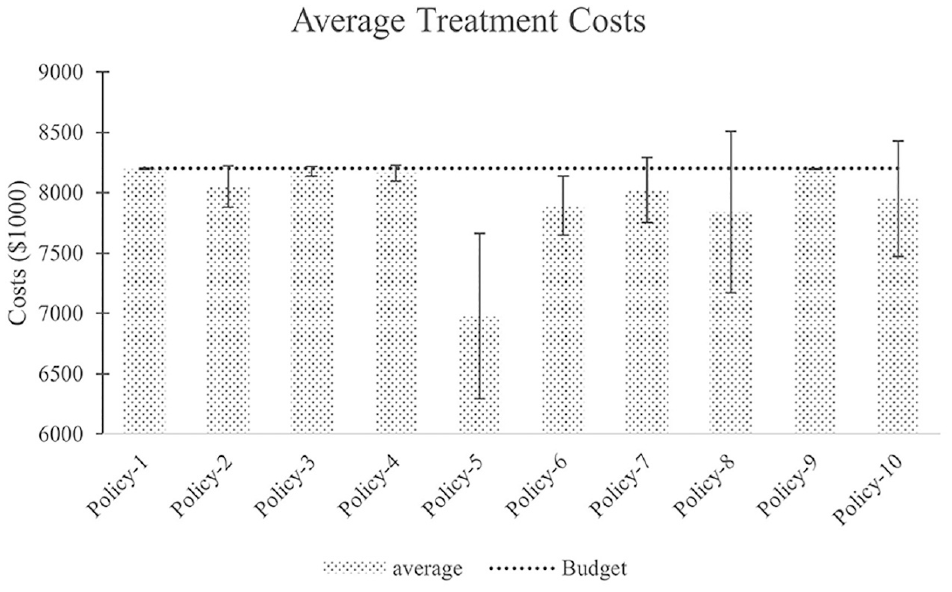
Average costs of pavement network maintenance and rehabilitation (M&R) treatments over the planning period.
Policy 5 aimed to balance three objectives, prioritizing pavement conditions maximization by allocating resources to maximize average conditions under inequity aversion to create a win-win situation. (Policy 5 has equal importance for both horizontal and vertical equity). This notion is also supported by the proportion of poor to very poor pavements in the network (Figure 11). Figure 11 shows that the proportion of poor to very poor pavements in the network under Policy 1 is relatively higher than that of Policies 5, 8, and 10.
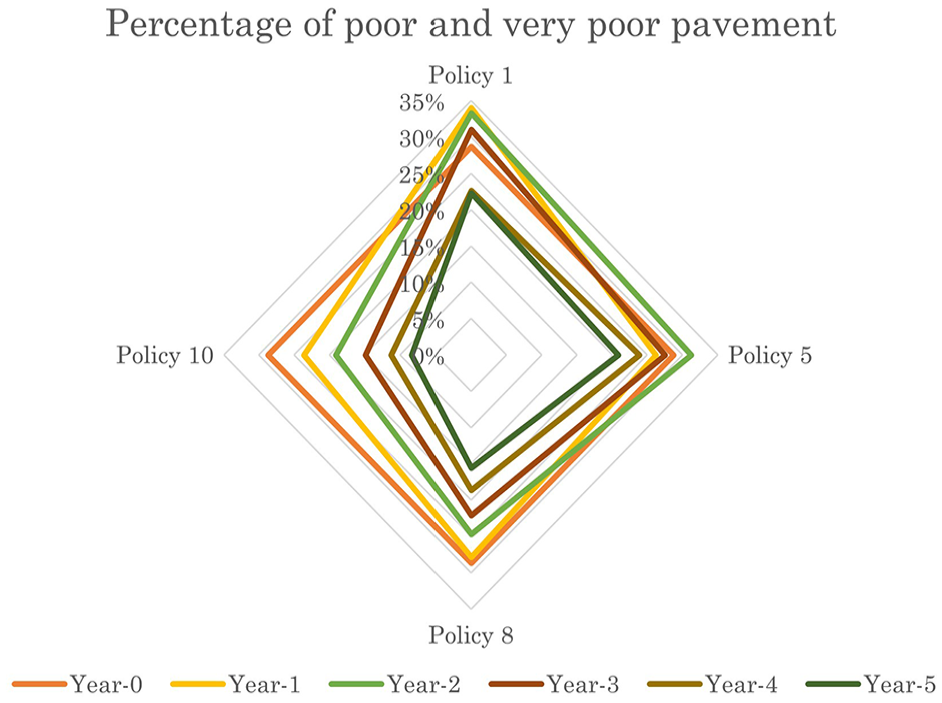
Proportion of poor to very poor pavement under different policies.
The proposed model optimizes network conditions by allocating resources for preventive maintenance, shifting allocation toward pavement sections with poor conditions when Objective-1’s importance is reduced. Figures 12 and 13 demonstrate changes in pavement condition scores under various policies and variability, with the inclusion of inequity metric reducing these distributions. These figures indicate that Policies 2, 4, and 10 yield reasonable average conditions with less variance.
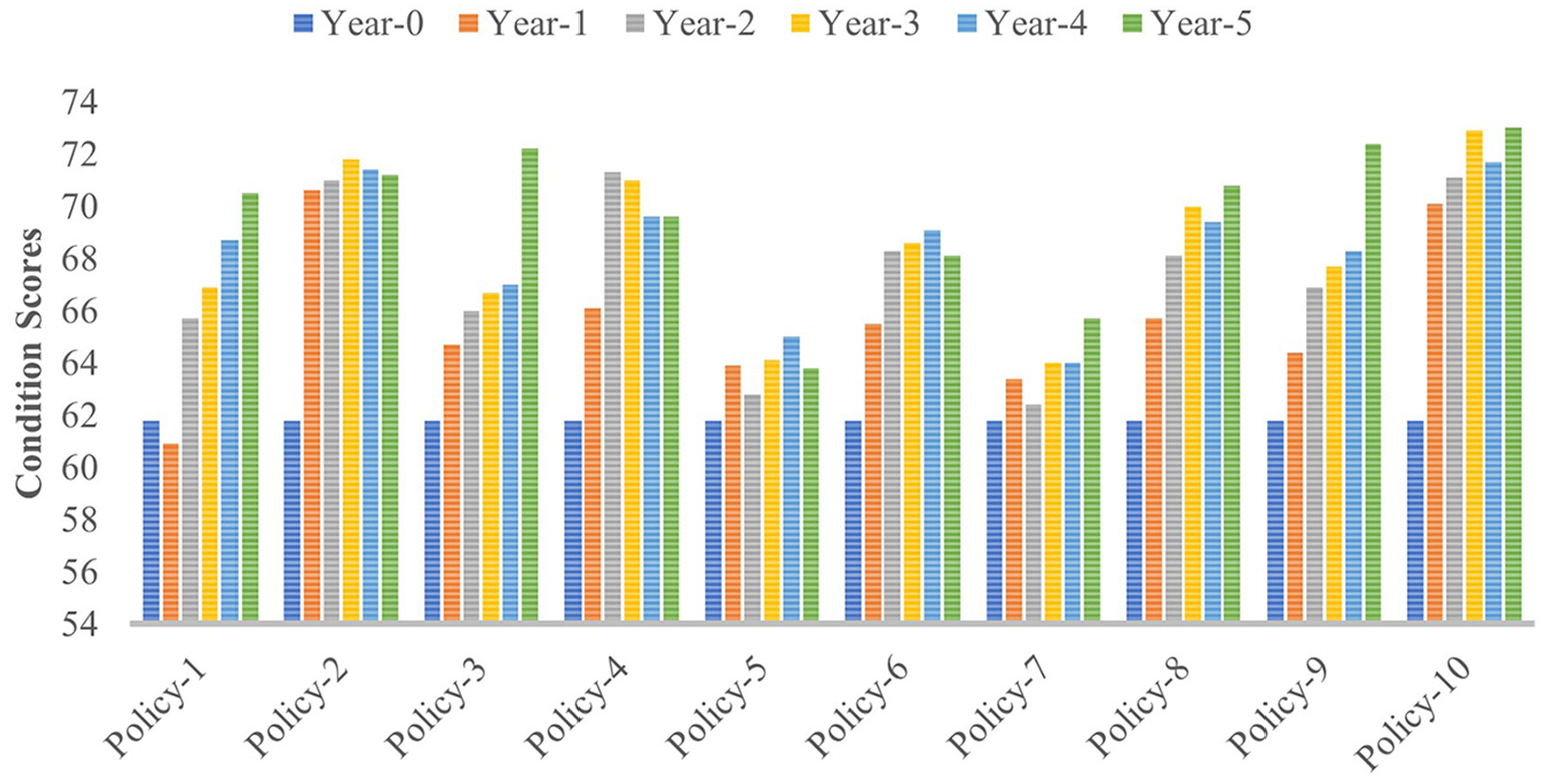
Average condition score for different policies.
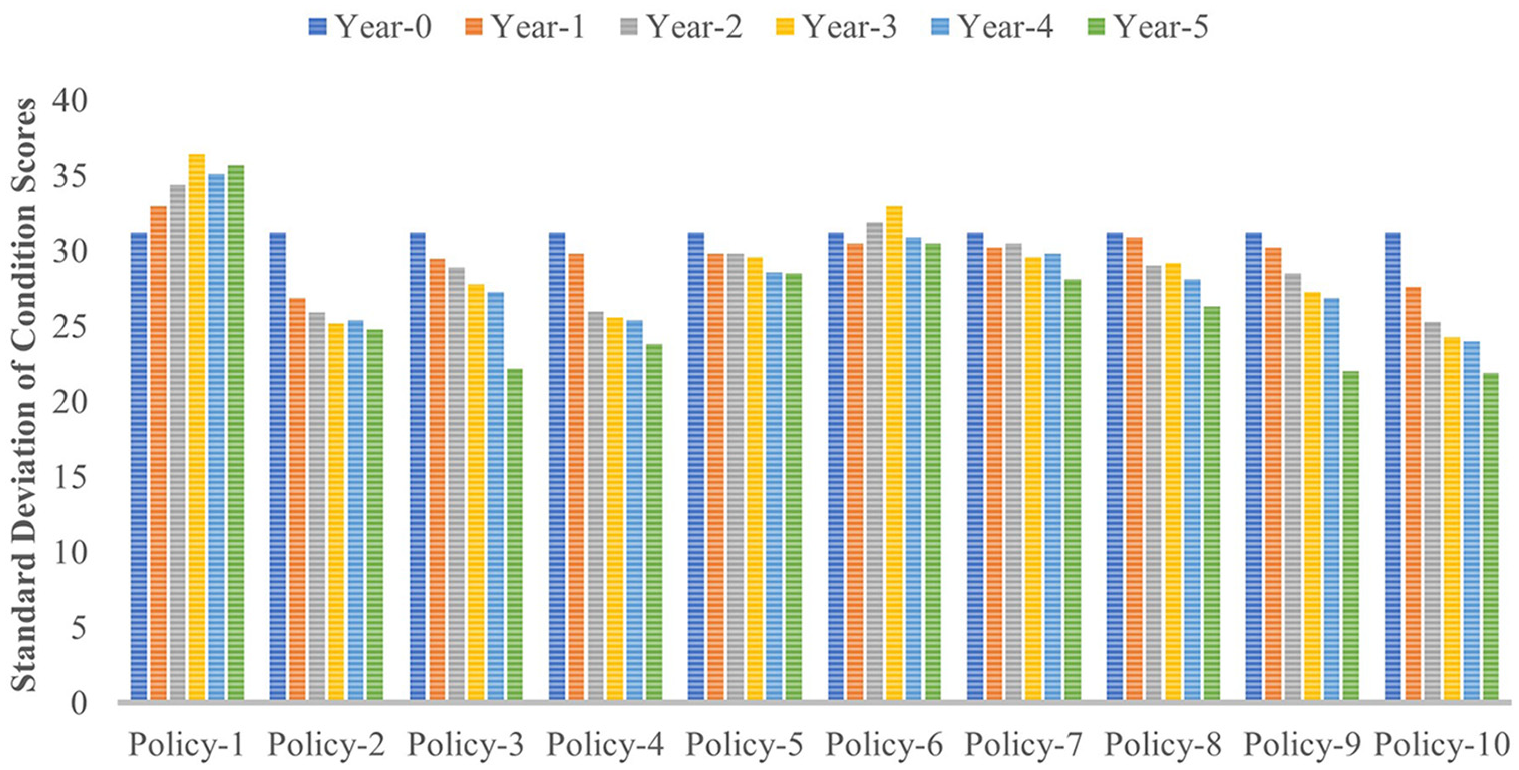
Standard deviation of condition score for different policies.
Studies ( 141 – 143 ) use the coefficient of variation to measure inequities in strategy distribution effects, as shown in Figure 14, comparing relative inequity aversion among policies. Policies 2, 4, and 10 show the smallest coefficients of variation. Furthermore, Figure 15 shows the average Gini index over the planning period under different allocation policies. Figure 15 reveals that Policy 2 (Objective-2: minimize Gini Index) only and Policy 10 (minimize both Objective-2 and Objective-3 with equal priority) show the least inequity followed by Policy 4 (all three objectives receive equal priority).
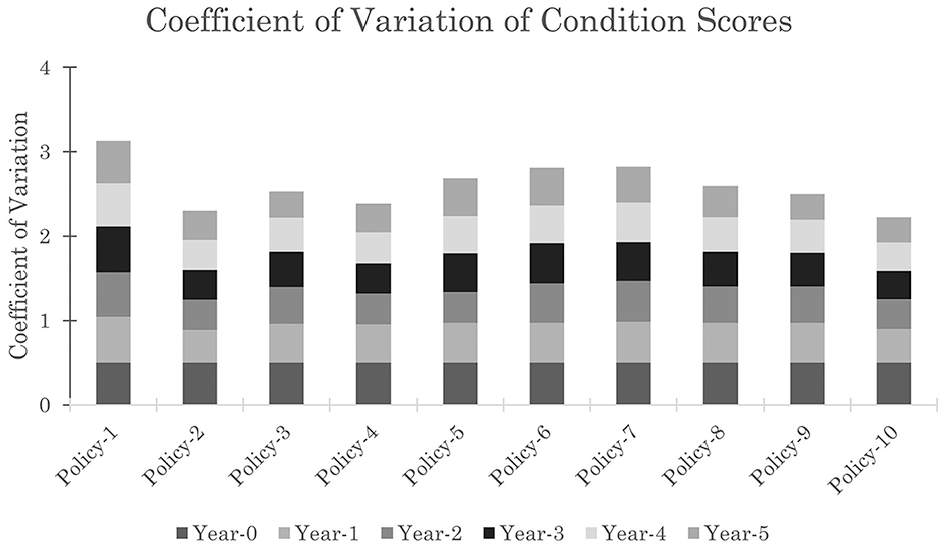
Variation in condition score under different policies.
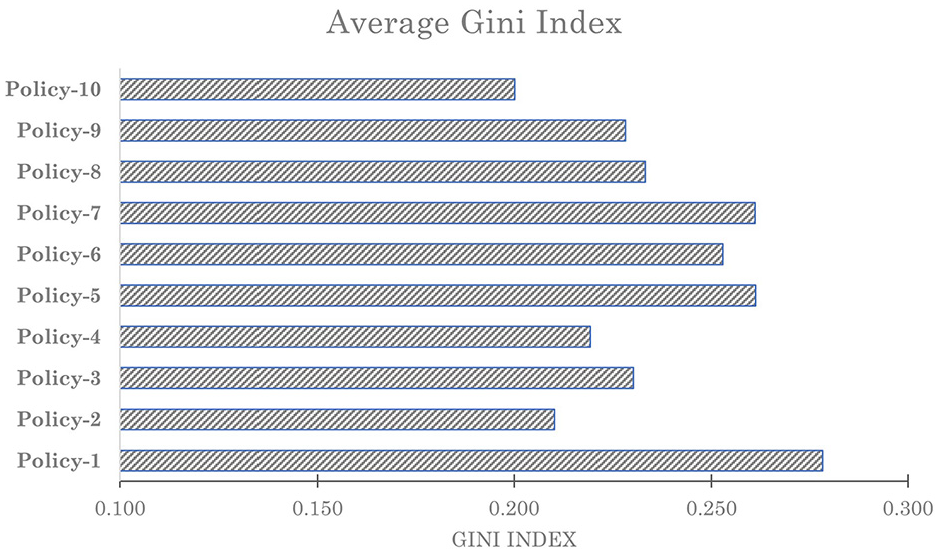
GINI index for different policies.
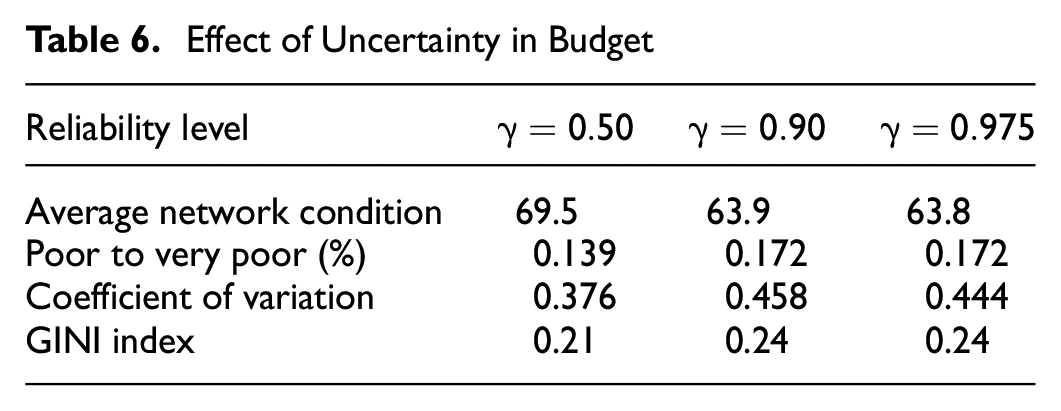
The above-mentioned results are based on a deterministic budget strategy (50% reliability). The budget uncertainty is examined based on Policy 4 (
Effect of Uncertainty in Budget
Conclusions
The paper discusses pavement M&R budget allocation and programming at the network level using a multi-period integer programming model with three objectives: maximizing network average condition score and minimizing horizontal and vertical inequity. A case study in Texas demonstrates the application and flexibility of a proposed model for pavement M&R, considering an uncertain annual budget. The case study used a clustering algorithm to group pavement data segments, integrating demographic and social vulnerability with pavement M&R budget allocation and programming model. The proposed inequity-averse multi-objective M&R programming model is solved using the weighted sum method. The relative importance of objectives for optimal planning is discussed. The results of the numerical example indicate that:
The proposed model is a unique approach that integrates both horizontal and vertical equity measures for network-level pavement management.
The study demonstrates that incorporating inequity aversion into pavement M&R programming can effectively manage network-level pavement conditions, promoting social justice and reducing social exclusion.
The model can enhance accountability and fairness for decision makers in managing pavement network conditions.
In summary, the proposed model could be applied as a tool for decision makers to make more rational decisions in developing an inequity-averse M&R program at the network level.
The future scope of work for this study could include improving efficiency and integrating additional features. The scope of the proposed model considers the benefits of inequity-averse pavement management at the network level, including safety, environmental justice, road user costs, and social opportunities, while considering stakeholder opinions. Furthermore, factors that influence the decision such as functional classification, traffic, and so forth, would be considered to make the model more pragmatic.
Footnotes
Author Contributions
The authors confirm contribution to the paper as follows: study conception and design: Al-Amin, M, R.B. Machemehl, R.B; data collection: Al-Amin; analysis and interpretation of results: M. Al-Amin; draft manuscript preparation: M. Al-Amin. R.B. Machemhl. All authors reviewed the results and approved the final version of the manuscript.
Declaration of Conflicting Interests
The author(s) declared no potential conflicts of interest with respect to the research, authorship, and/or publication of this article.
Funding
The author(s) received no financial support for the research, authorship, and/or publication of this article.