
Abstract
Change detection is the process of identifying variations in roadway asset conditions and flagging them for timely repair or replacement. This practice is crucial for maintaining road safety and infrastructure integrity but is highly time-consuming. Automating change detection with mobile lidar technology has been considered by many agencies, but the cost of high-resolution lidar is a significant burden. Although low-cost lidar is available, it is not clear whether the point cloud density from such systems is sufficient for accurate change detection. We addressed this gap by conducting a sensitivity analysis on the effect of varying mobile lidar point densities on the accuracy of traffic sign change detection. The assessment involved randomly simulating changes (e.g., damage) in traffic signs, then subsampling the point cloud to different densities. A machine learning algorithm was used to detect changes at these densities. Additionally, a logistic regression model was used to statistically assess the relationship between point density, traffic sign size, and change detection accuracy using data from over 130 traffic signs across three highways. Results show that point densities above 250 points/m2 yield F1 scores and detection rates exceeding 95% for both partial breakage and rotational changes, establishing a critical threshold for high detection accuracy. The study revealed that both point density and change magnitude are significant predictors of detection accuracy, with traffic sign size being significant for partial breakage changes. This paper also highlights the effect of change size per unit area on detection precision, offering broader insights for road infrastructure maintenance.
Keywords
Change detection is a critical process in monitoring and maintaining infrastructure. The process involves the identification of defects or modifications over time (i.e., monitoring how asset conditions have changed over time). Change detection plays a key role in ensuring road safety and operational efficiency. Traditionally, change detection has relied on manual inspections and periodic surveys, which are time-consuming, labor-intensive, and costly. These methods might also fail to capture minor but critical changes in a timely manner ( 1 ). As a result, there is an increasing demand for more efficient, automated approaches, particularly in the context of traffic sign monitoring and other critical road assets.
Recent advances in remote sensing technologies, such as lidar and high-resolution imagery, have significantly improved the efficiency of the data collection process ( 2 ). Lidar technology, in particular, has proven highly valuable in transportation infrastructure management ( 3 ). Lidar has been used in applications ranging from road surface condition assessment ( 4 ) and roadside safety evaluation ( 5 ), to sight distance analysis ( 6 ), bridge integrity inspection ( 7 ), and digital terrain model creation ( 8 ).
Compared with traditional methods, remote sensing technologies such as lidar offer several advantages. These include rapid data collection over large areas, greater precision in detecting subtle changes, and reduced reliance on manual labor ( 9 ). Lidar’s ability to generate high-resolution point clouds also enables more accurate and automated assessments of road conditions, tasks that would otherwise require significant time and resources using conventional approaches ( 10 ). A key factor in the effectiveness of lidar technology for such assessments is the resolution—or point density—of the data, which directly influences the accuracy of many evaluations ( 11 , 12 ).
Understanding the correlation between lidar point density and data quality—especially in detecting changes over time (i.e., change detection)—is crucial to highway maintenance operations ( 13 ). This relationship directly affects operational costs. Finding the optimal point density that offers a balance between accuracy and cost-efficiency is essential for effective change detection, which helps identify and address potential issues in a timely manner. Higher densities generally provide more reliable results ( 14 ), but can be cost-prohibitive and require longer processing times. Conversely, lower point densities may reduce costs but risk missing critical changes.
As a result, understanding the optimal point density for specific applications is essential to balance cost and data quality. For instance, such tasks as detecting road surfaces might require a lower point density ( 3 ), while more intricate analyses, for example, assessing damage or diagnosing cracks on roads, could necessitate a higher point density for detailed examination ( 15 ). This balance ensures that a cost-effective scanning system can still provide the necessary detail for effective analysis. Identifying the optimal point density for different tasks is also important for agencies already equipped with high-capability scanners, as it helps determine the appropriate vehicle speed during data collection. Slower speeds allow for higher density but increase operational time and potentially costs. Additionally, a lower point cloud density can help reduce computational costs and improve scanning efficiency ( 16 ).
To address the aforementioned challenges, the aim of this study is to conduct a comprehensive sensitivity analysis of the effects of mobile lidar point cloud density on traffic sign change detection. The primary objective is to determine the optimal point density that maintains consistent accuracy in detecting changes in traffic sign conditions. Additionally, in this study, we seek to determine how variations in point density affect the accuracy of change detection, with the goal of identifying a density threshold that balances cost and detection performance. To the best of our knowledge, no previous research has specifically addressed the optimal lidar point density required for effective traffic sign change detection.
To conduct the assessment, we considered mobile lidar data collected along three different highways from two Canadian provinces, covering approximately 22 km and including more than 130 traffic signs. To evaluate the effect of point density on detection accuracy, the maintenance scans (i.e., point clouds containing the simulated changes) were subsampled to various densities ranging from 350 points/m2 to 50 points/m2. Furthermore, logistic regression was used to assess, statistically, the relationship between point density, change size (measured in square meters), and detection accuracy. This approach provided deeper insights into how point density influences change detection, establishing critical thresholds for different conditions. These insights extend the understanding of point density effects to broader applications, beyond traffic signs.
Literature Review
While the adoption of mobile lidar technology among transportation agencies has increased in recent years, a limited amount of research has been focused on assessing the effects of lidar point density on its use for transportation applications in general, and traffic sign change detection in particular. This section is a review of the limited research available in this area.
In contrast to the field of transportation, in other fields, such as forestry and terrain studies, various studies have been dedicated to examining the effect of lidar point density on change detection. Singh et al. ( 17 ) discovered that reducing lidar point density by 99% resulted in an 11.5% decrease in biomass estimation accuracy. Similarly, Garcia et al. ( 18 ) found that, even with point densities as low as 1 point/m2, the accuracy loss in biomass estimation was minimal. Luo et al. ( 19 ) demonstrated that reduced point densities, down to 2.94 points/m2, could still yield accurate leaf area index measurements. Additionally, Zhang et al. ( 20 ) confirmed that lower point densities (0.25–25.44 points/m2) maintained high classification accuracies in mapping tea plucking areas. In terrain mapping, Garzón Barrero et al. ( 21 ) showed that reducing lidar data to 1% of the initial density did not significantly impair digital elevation model (DEM) accuracy. Asal ( 22 ) also reported that a reduction in point density to 0.128 points/m2 led to only a 4.83% decrease in DEM accuracy, indicating the resilience of terrain models to downsampling.
Reducing point density also affects processing efficiency. Liu et al. ( 23 ) investigated the effect of reducing lidar data density on the accuracy and efficiency of DEM generation. They found that halving lidar data density does not significantly affect DEM accuracy, while substantially decreasing file size and processing time. This demonstrates that significant data reduction can be achieved without compromising DEM quality, suggesting an optimized balance between data detail and resource efficiency. This is supported by Petras et al. ( 24 ), who found that the use of high-density lidar data increases processing requirements without significantly improving DEM quality. Additionally, Hu et al. ( 25 ) explored the use of a low-cost unmanned aerial vehicle (UAV)–lidar system for forest inventory applications, finding that it effectively captures forest canopy and terrain information, with performance depending on flight height and speed.
In the field of transportation, Gargoum and El-Basyouny ( 26 ) explored the point density requirements for accurate traffic sign detection. They found that a point cloud density reduced to 35% of the original still allowed high detection rates for large traffic signs, suggesting that a density of around 100 points/m2 could suffice for this application. For more detailed features, such as cross-section slopes and horizontal curves, Gargoum and El-Basyouny ( 27 ) highlighted the need for higher point densities, indicating a greater sensitivity to density reductions in these cases.
In other work to assess the effects of point density on feature extraction quality, Lari and Habib ( 28 ) emphasized the importance of accurately estimating local point density to enhance segmentation quality, noting that higher local densities generally yield more detailed environmental representations. Milenković et al. ( 29 ) further investigated the effect of point density on the precision of roughness spectra in multi-scale lidar point clouds, underscoring point density as a key factor in determining the quality of outcomes. Additionally, Viedma ( 30 ) discussed terrain modeling, noting that while lower pulse densities during data acquisition might affect the quality of DEMs and canopy metrics, high-density lidar datasets can be effectively reduced in density with appropriate methodological approaches.
Recently, researchers have directed some attention to the relationship between lidar point cloud density and change detection accuracy. Kharroubi et al. ( 31 ) conducted a comprehensive review study, highlighting the superior performance of deep learning methods in addressing the challenges of density variability and occlusion in point clouds for change detection applications. They found that deep learning techniques significantly improve the detection of changes in various assets, such as buildings and vegetation, by effectively managing noise, occlusions, and variations in point cloud density. Suchocki and Błaszczak-Bąk. ( 32 ) found that reducing the point density to 2% of the original 456,556-point dataset significantly affects accuracy in building diagnostics. Specifically, only 71.0% of the points were correctly identified as undamaged when the density was reduced to 2%, compared with 97.3% accuracy for the full dataset. They also noted that, while lower densities improve the detection of larger damage, smaller damage is more likely to be overlooked.
de Gélis et al. ( 33 ) reported that the inclusion of hand-crafted features within deep learning models markedly improved change detection capabilities, as reflected in better accuracy and intersection over union metrics for identifying changes, although specific numerical improvements were not detailed. In road infrastructure, Fuse and Yokozawa ( 34 ) found that lower point densities affect the ability to detect small-scale changes, such as minor cracks or slight deformations in the road surface. Their study emphasizes the need for a balanced approach to voxel size and computation time for effective change detection. Fiorucci et al. ( 35 ) analyzed the effect of different point densities on the performance of machine learning algorithms in change detection tasks, particularly focusing on urban environments. They noted that the processing of high-density point clouds necessitates division of data into smaller segments, which significantly increases the computational load. Their findings suggest that while higher point densities improve the detection of fine details and small changes, they also demand substantial computational resources and time.
As evident in this review, a notable gap persists in understanding the effect of lidar point density on change detection accuracy, especially in transportation infrastructure. In forest and terrain mapping applications, the current literature suggests that point cloud density has a limited role in determining accuracy, and increased scanning speeds and reduced point density are often recommended to decrease operational costs and processing times. Conversely, studies in transportation infrastructure analysis and damage detection underscore the criticality of point cloud density for accurate change detection, yet without a clear delineation of the relationship between point density and detection accuracy.
To address this gap, the aim of this study is to understand how point density affects change detection accuracy, with a special emphasis on traffic sign change detection. Traffic signs, though small, are crucial elements of highway infrastructure and traffic sign change detection is profoundly influenced by point density variations. Furthermore, in this research, the examination is extended to include the effect of change extent per unit area on detection accuracy.
Data Preparation
This section outlines the procedures used for gathering and preparing lidar data from three highway segments.
Highway Segments
In this study, mobile lidar data were collected for three different highway segments in Canada, two highways from Alberta and one highway in British Columbia. These segments were selected for their diverse characteristics. The details of lidar data acquisition are described in the next few paragraphs. Moreover, the geographical layouts of these highways are illustrated in Figure 1.
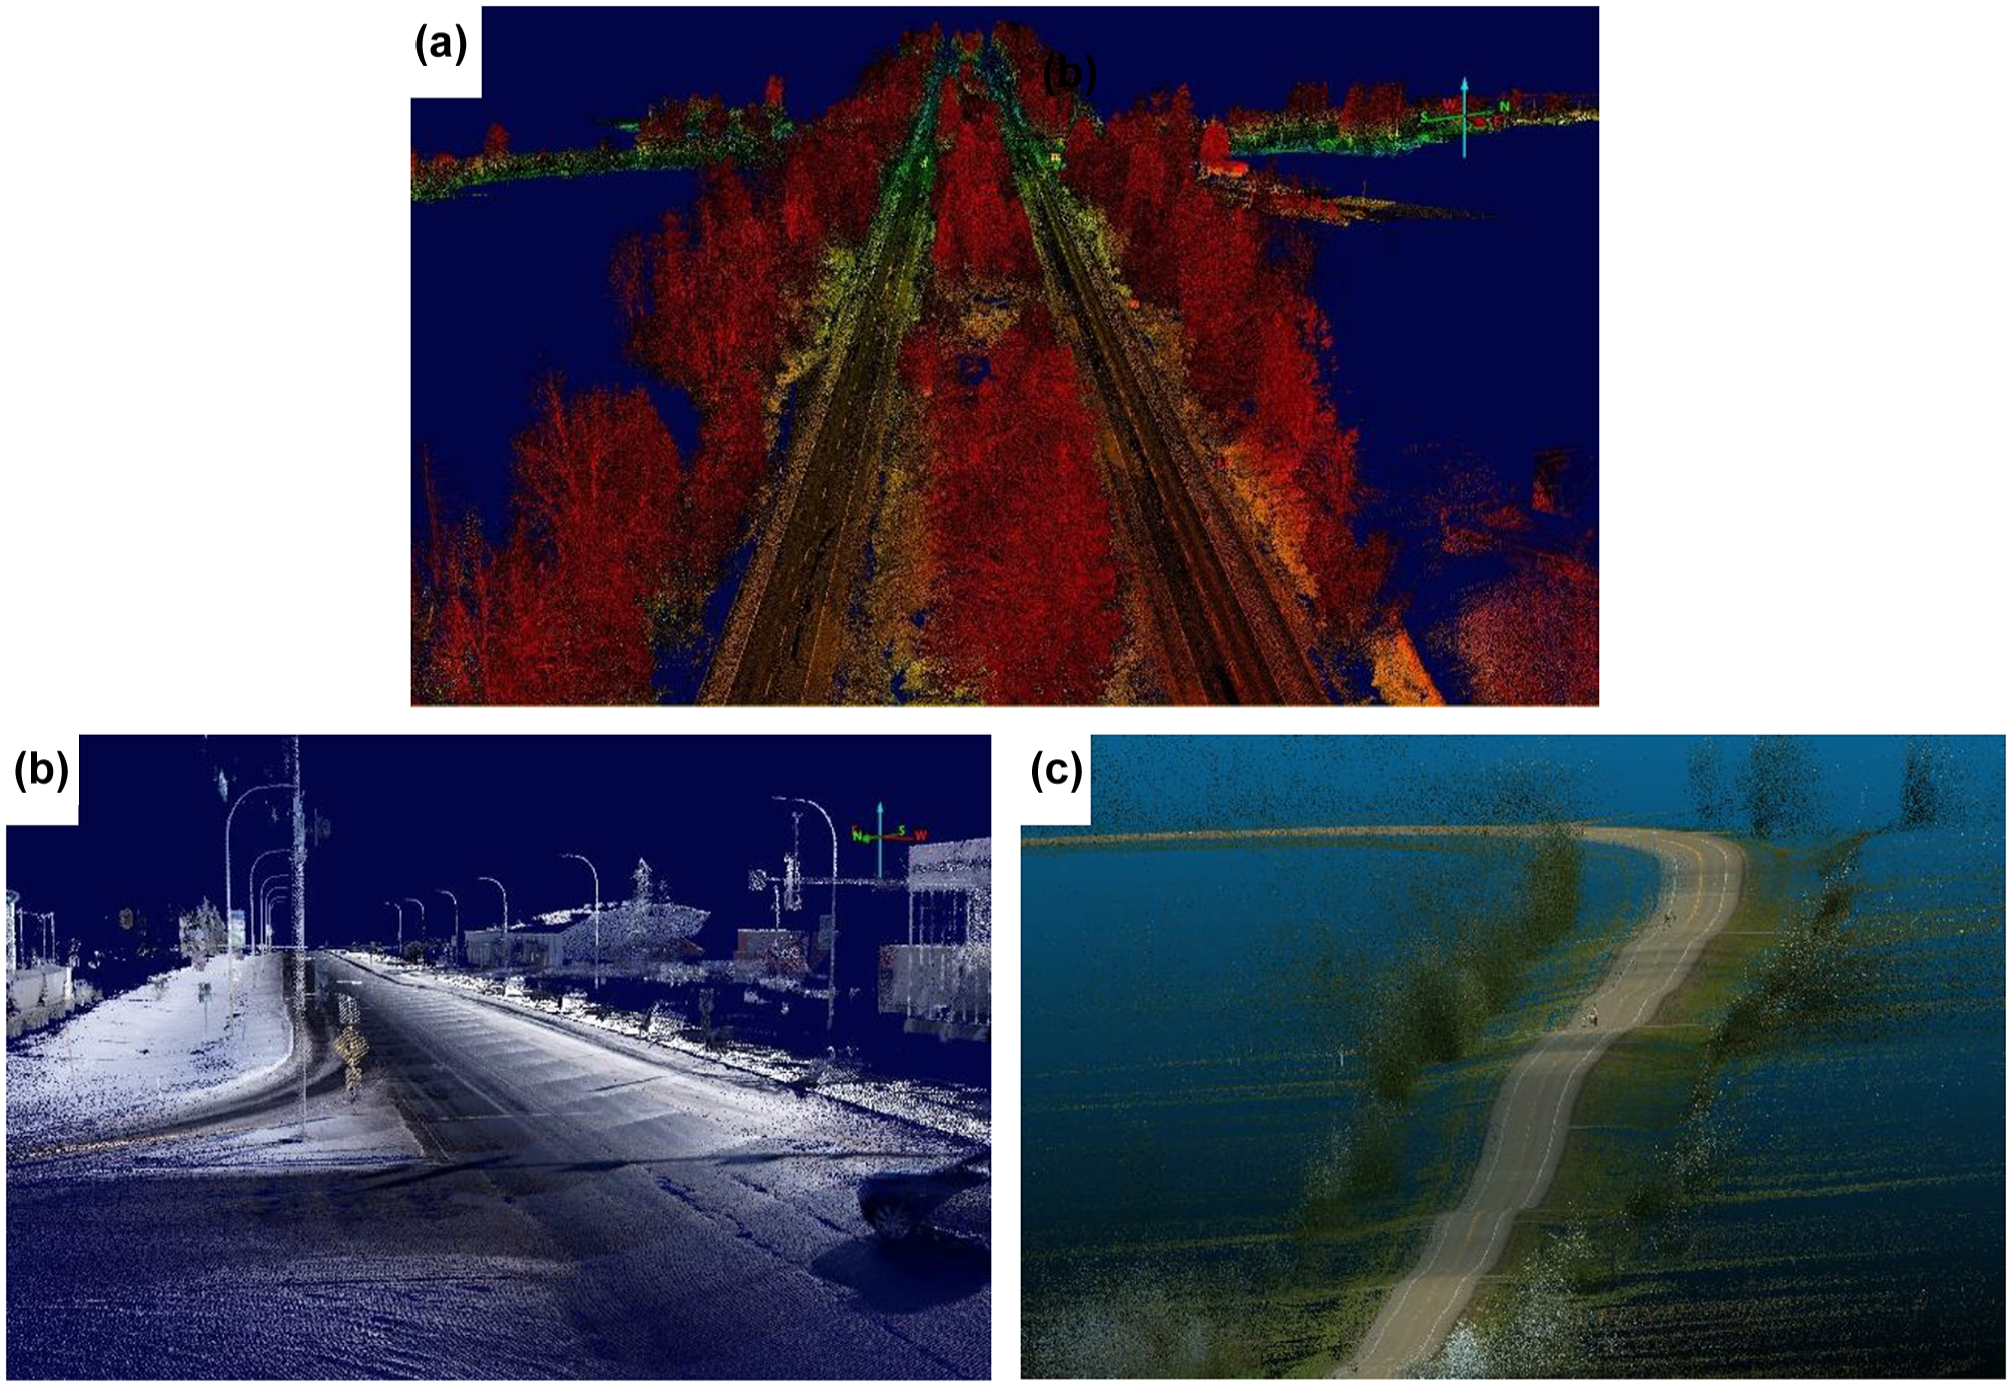
Geographical layouts and lidar data acquisition details for highway segments: (a) 1; (b) 43; (c) 22.
Lidar data for Highway 43 were collected along the section of the highway that runs within Whitecourt town in Northern Alberta. The segment analyzed is a six-lane divided road that is 0.6 km long. Data collection was performed using a Leica Pegasus Two Ultimate scanner at an average speed of 50 km/h, and was conducted on the northbound lanes. The original point density of the scan was approximately 3000 points/m2 on the road surface, totaling about 27.4 million points captured.
The Highway 22 segment extends 9.8 km and is a bidirectional undivided road with two lanes in Alberta. The conducted scan captured all roadside traffic signs relevant to both directions of travel, with the vehicle moving southbound. The original point density of the scan across this section was approximately 900 points/m2 on the road surface, with a total of about 320 million points captured.
The third segment is a 10.5 km stretch of Highway 1 (Trans-Canada Highway) extending north of Langley, situated in a rural setting in British Columbia. This segment features a dual-lane configuration in each direction, with a 34-m wide, densely vegetated median dividing the lanes. Scans were performed for each direction separately and subsequently merged. Using an RIEGL VMX-450 scanner at an average speed of 80 km/h, the data collection achieved an average density of 1400 points/m2 on both directions of the road surface, resulting in approximately 920 million points in the lidar point cloud.
Simulating Changes in Traffic Signs
The aim of this study was to understand the effects of point density on detecting changes (i.e., damage, breakage, dents, etc.) in traffic signs. Therefore, it was necessary to have a version of the point cloud in which some signs were damaged. Since it is not feasible to wait until such changes happen naturally (if ever), part of the data preparation involved randomly simulating damage to the signs (i.e., creating a point cloud where some of the signs were damaged). In this study, two types of alteration in traffic signs were explored: partial breakage and rotational changes. These alterations are designed to assess detection sensitivity in varied conditions. Both changes were applied to the entire set of traffic signs across three segments, totaling 137 signs. The accuracy of detecting each type of change was estimated separately.
•Partial Breakage Change Simulation. This simulation involves removing a top portion from a traffic sign’s point cloud cluster. A random percentage, ranging from 10% to 100% of the traffic sign, is calculated for removal to mimic the effects of environmental factors or vandalism, leading to partial visibility.
•Rotation Change Simulation. Variability in the orientation of traffic signs is introduced through a rotation change simulation. A random rotation between 20° and 60° around the base axis of the sign is applied, to test the algorithm’s effectiveness in detecting orientation changes. The axis of rotation, chosen randomly as either x or y, facilitates a comprehensive evaluation of the algorithm’s performance across different potential real-world alterations.
Both types of simulation were applied to the point cloud data of traffic signs, enabling a realistic representation of changes. To ensure a robust evaluation, a control group was maintained within the dataset for each highway segment. This involved selectively modifying a percentage of the traffic signs while leaving others unchanged. Such a setup provides a balanced environment to test the detection algorithm’s ability to differentiate altered and unaltered signs accurately.
Methodology
As already noted, the aim of this study is to explore the effect of point cloud density reduction on the ability to detect changes (i.e., damage, breakage, etc.) automatically in traffic signs. To that end, the first step of the sensitivity analysis involved reducing the density of the point cloud to different levels. Subsequently, change detection was attempted at the different levels of point density. Finally, logistic regression analysis was conducted to statistically quantify the effects of the different variables, including point cloud density, change magnitude, and traffic sign dimensions, on change detection feasibility.
Point Cloud Subsampling
Point cloud subsampling involved reducing the density of the point cloud to several different levels by randomly selecting points from the original point cloud. The method used was stratified random sampling (SRS), a technique widely recognized in point cloud thinning, particularly in building and transportation research ( 26 , 27 , 36 ).
In SRS, the study area is divided into smaller, distinct, sections or strata. Points are randomly selected from each stratum at a predetermined rate, ensuring that the sample remains representative of the overall population. This method preserves the spatial distribution and structural integrity of features in the point cloud, such as traffic signs.
Point cloud density was reduced to specific levels: 350, 300, 250, 200, 150, 100, and 50 points/m2. These target densities were chosen to encompass a wide range of scenarios, from medium-density scans typical of standard survey speeds to low-density scans associated with variable scanning speeds. This selection ensures a comprehensive analysis across a broad spectrum of data densities, facilitating a deeper understanding of how point cloud density influences the accuracy and reliability of traffic sign change detection. Figure 2 is a graphical representation of these target densities.
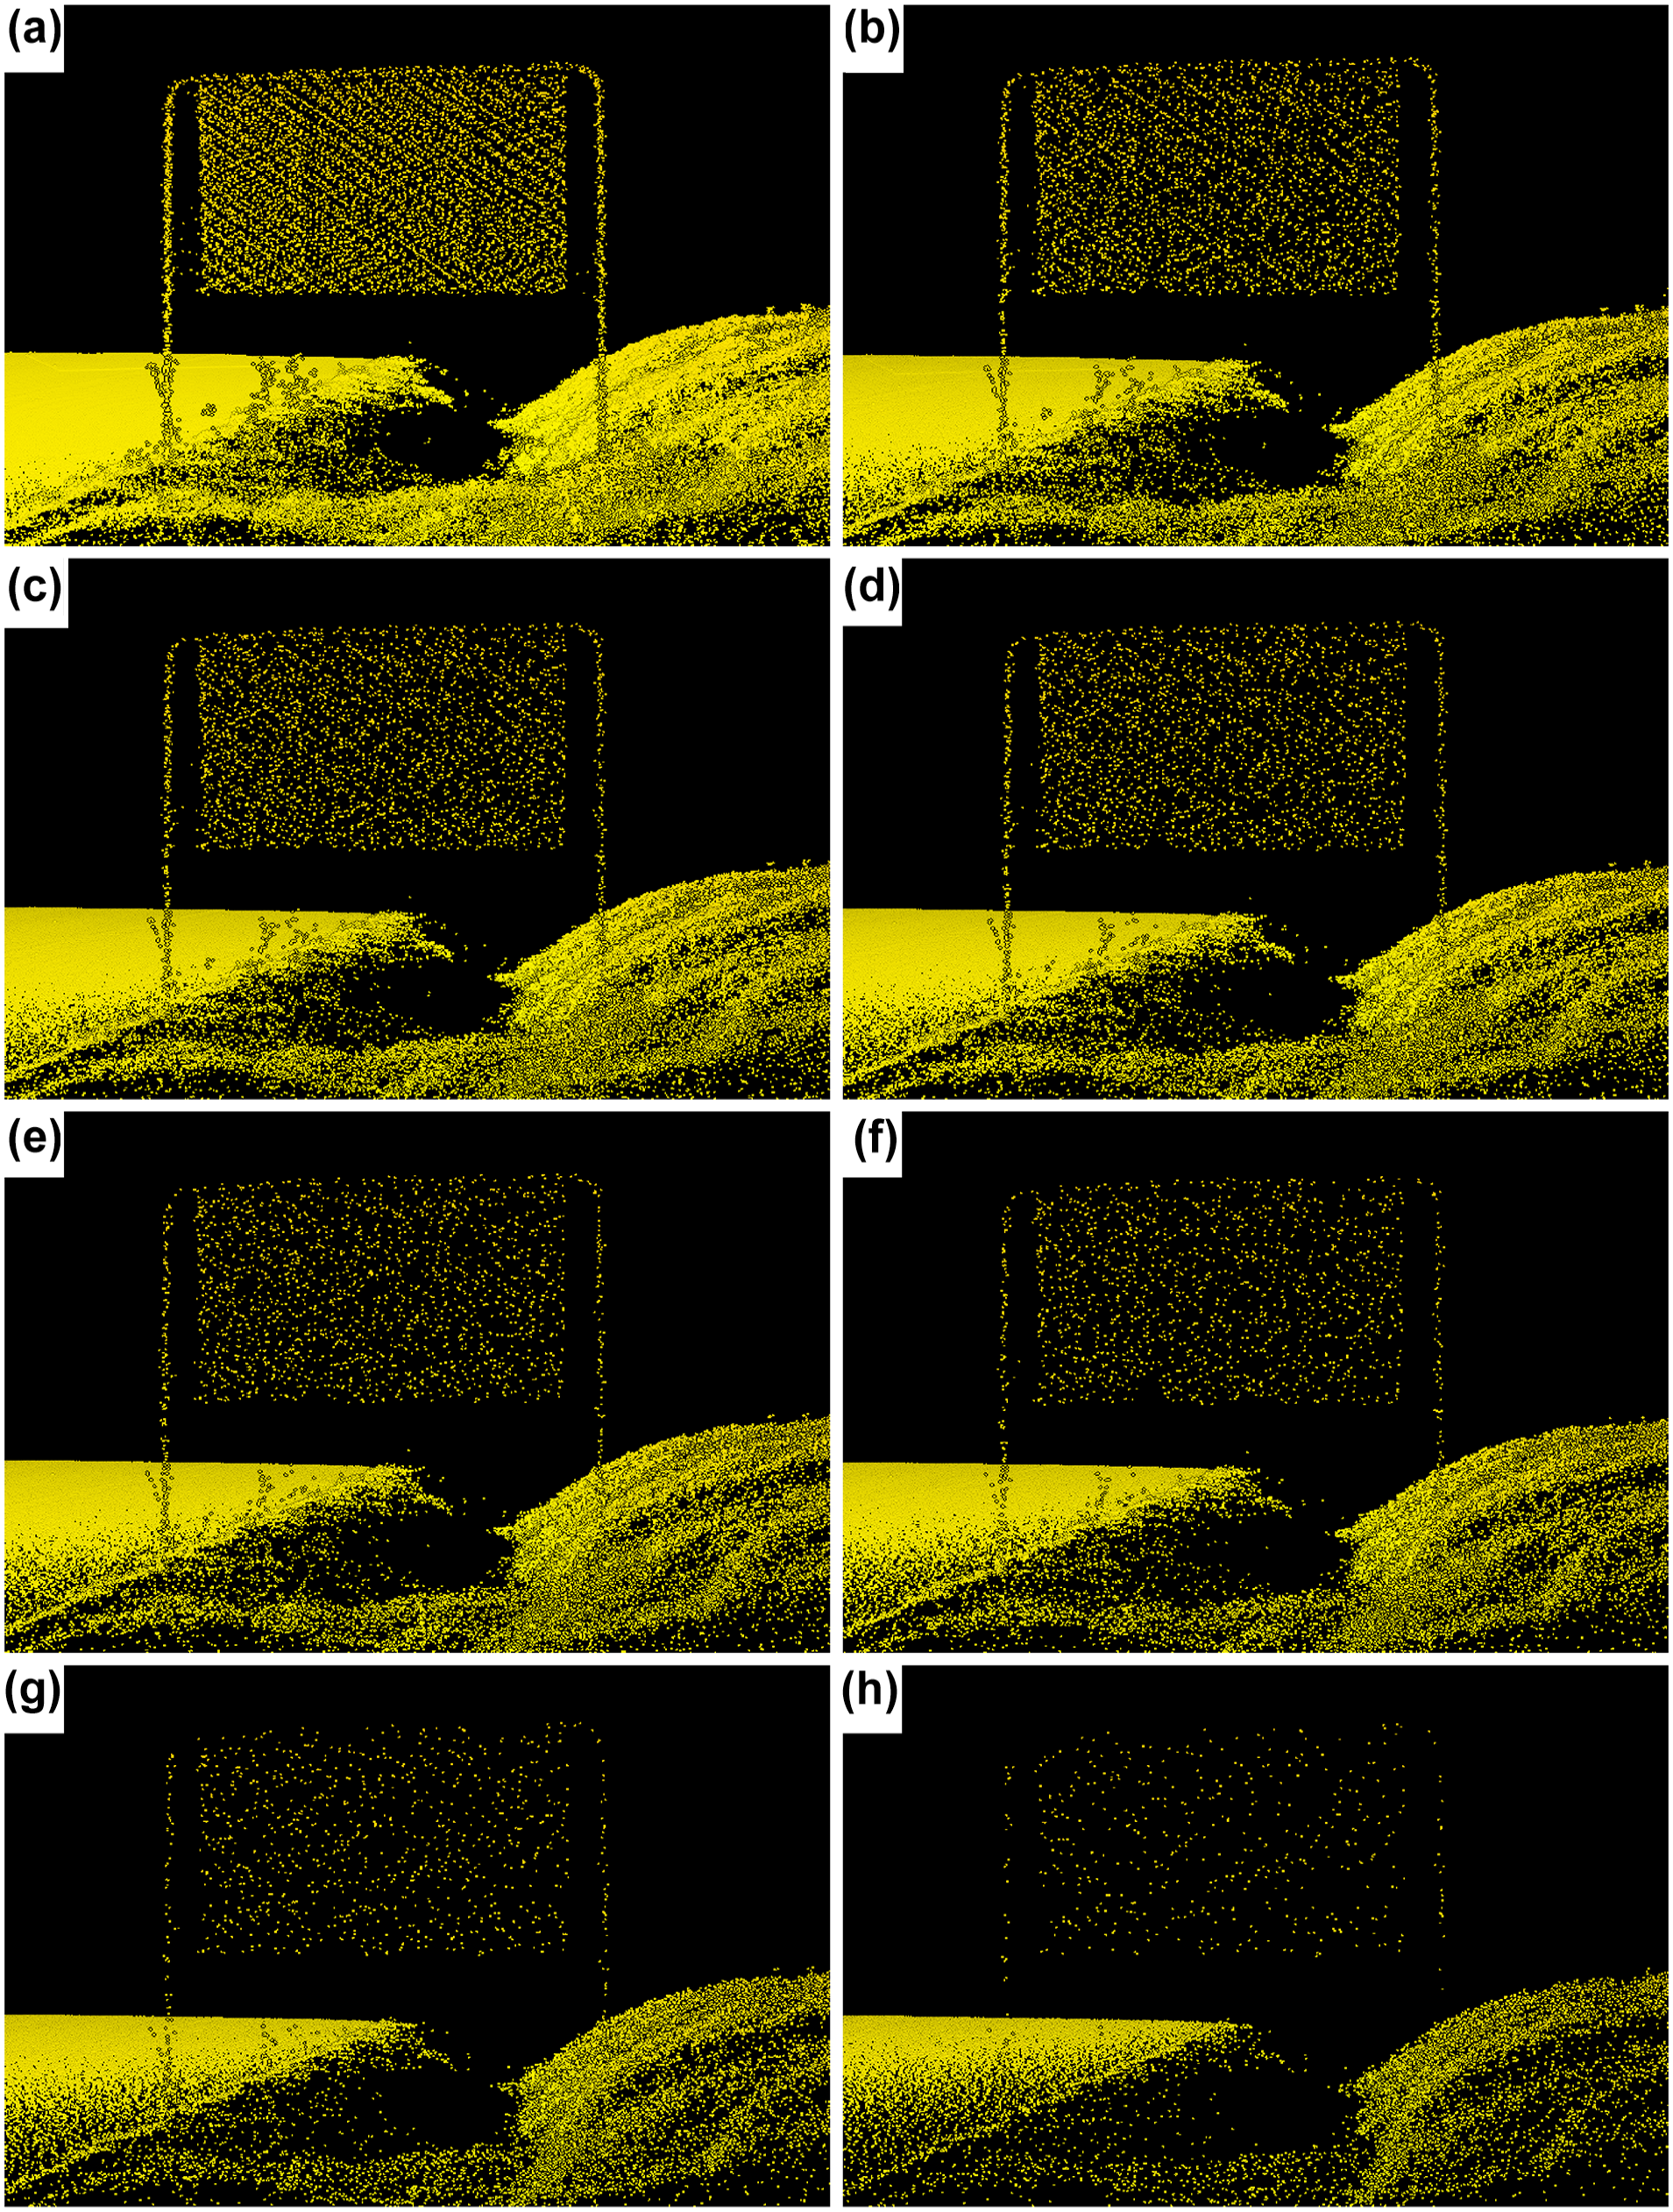
Visual representation of stratified random sampling densities on Highway 1 at (a) original density and (b–h) reduced densities at (b) 350 points/m2; (c) 300 points/m2; (d) 250 points/m2; (e) 200 points/m2; (f) 150 points/m2; (g) 100 points/m2; (h) 50 points/m2.
Change Detection Process
The traffic sign change detection algorithm used is the one proposed in Khataan and Gargoum ( 2 ). The method comprises three main steps: point cloud restructuring, change detection, and noise elimination. The method implements such techniques as voxelization, cross-scan k-dimensional (KD) tree, and Density-Based Spatial Clustering of Applications with Noise (DBSCAN). For a detailed description of the methodology and its efficacy, readers are encouraged to refer to the original paper.
•Point Cloud Restructuring. The process begins with voxelization, in which unstructured point clouds are transformed into a grid of structured voxels (three-dimensional (3D) pixels). This step, aimed at data standardization, ensures consistency across scans by reducing outliers in high-density baseline scans (initial detailed high-density scans of the environment) and aligning patterns between baseline and subsequent maintenance scans (periodic low-density scans used to detect changes or updates).
•Cross-Scan KD-Tree. In this phase, low-density lidar data are leveraged from routine maintenance scans supplemented by high-density baseline scans to establish a robust baseline. The cross-scan KD-tree structure efficiently identifies changes between scans by managing density differences, utilizing a radial search within the KD-tree to locate changes and bridge the gap in density variations between different scan types.
•Noise Removal or Elimination. The methodology concludes with noise reduction and false positive elimination using the unsupervised DBSCAN technique. This step enhances the change detection process’s precision and overall accuracy, as actual changes are distinguished from mere density variations.
In the context of conducting a sensitivity analysis on the effect of point density on the efficacy of change detection, the algorithm parameters are consistently set across different scanning systems in the three test segments. This uniformity is essential to ensure the reliability of the change detection technique.
The methodology was tested in two scenarios: first, applying the algorithm to the entire point cloud, and second, focusing only on traffic signs extracted from baseline scans (i.e., isolating the traffic signs from the remainder of the point cloud and then applying the change detection algorithm).
Logistic Regression Process
Logistic regression was chosen to support the sensitivity analysis in this study, as it models binary outcomes—specifically, whether changes in traffic signs are detected or not. This approach allows us to include several predictor variables, such as point density, change magnitude, and traffic sign dimensions, and to assess their unique effects on detection accuracy ( 37 ). By applying logistic regression, each factor’s influence on the probability of detection can be statistically assessed while holding other variables constant; this provides a clearer understanding of their unique contributions ( 38 ). Logistic regression also allows the relationships between key variables to be assessed statistically, offering a precise framework to interpret their effects on detection outcomes.
Logistic regression is widely applied in fields requiring binary decision modeling, such as smart grid monitoring, where several factors influence the likelihood of detecting system faults ( 39 ). Its capacity to handle complex predictor variables and binary outcomes makes it particularly suitable for sensitivity analysis in this study. This model provides a robust statistical foundation for interpreting the relationships between critical factors, enhancing understanding of detection accuracy under different conditions.
Variables Included in Logistic Regression
The ability to detect changes in traffic signs at varying point cloud densities can be significantly influenced by additional factors. Alongside point density, the magnitude of the change (i.e., damage) and the dimensions of traffic signs are expected to influence the accuracy of change detection and, therefore, were included in the logistic regression.
•Change Magnitude. The magnitude of the change is characterized by the percentage of change in cases of partial breakage and by the angle of rotation in cases of rotation change. The previously applied values were considered for each traffic sign : 10% to 100% for partial breakage and 20° to 60° for rotational changes. This change in magnitude can significantly affect detection because larger changes are generally easier to detect than smaller ones. Logistic regression is used to estimate how this magnitude can influence detectability.
•Traffic Sign Size. Including the size of the traffic sign in the analysis is also crucial as it can significantly affect the detectability of changes. To estimate the area of traffic signs accurately, we employed the concave hull method, providing a robust mathematical foundation for analyzing how dimensions influence detection accuracy. Unlike the traditional convex hull approach, the concave hull method is favored for its adeptness at managing irregular and often concave geometries, a characteristic highlighted by El Sayed et al. ( 40 ).
The procedure begins with projection of 3D point clouds onto a two-dimensional (2D) plane using principal component analysis. In this technique, the plane that minimizes the distance from the points to the projection is identified, thus simplifying spatial data while preserving critical geometric features.
On reducing the data to relevant 2D points, the concave hull of these points is computed. Figure 3 shows the estimated area for two traffic signs, varying in size and shape, along with the actual area determined using the concave hull method. The concave hull method is particularly advantageous because it can accurately outline the true shape of traffic signs, including any concave features or irregularities. This precision is vital for signs with intricate edges or internal cutouts, allowing for a true-to-form geometric representation.
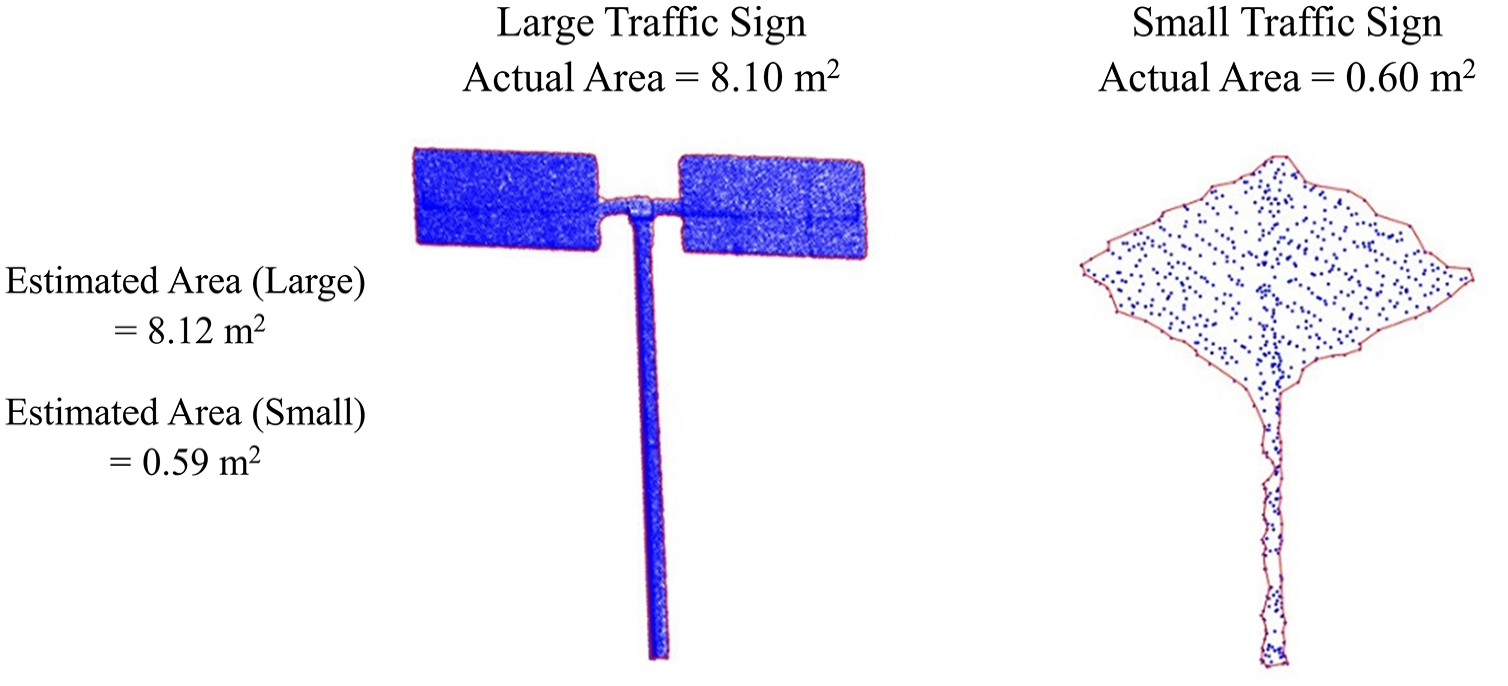
Estimated areas of traffic signs using concave hull method for varying sizes and shapes.
Mathematical Notation
In logistic regression, the probability
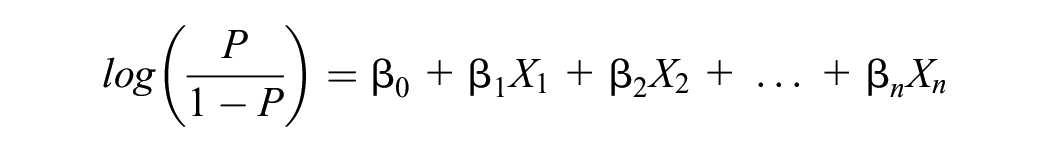
where
The logistic regression model is used to determine how variations in predictor variables affect the accuracy of change detection by adjusting one predictor at a time while maintaining others at their mean levels.
Additionally, for scenarios involving partial breakage, an extra predictor is incorporated: the difference between the pre-change and post-change areas of the traffic sign, which provides a measure of change per unit area. This measure aids in elucidating the relationship between the size of the change, point density, and detection accuracy without considering the initial size of the traffic sign as an influencing factor. Using this change size per unit area as a predictor provides deeper insights into the dynamics between change size and detection accuracy for general applications, beyond just traffic signs.
Results and Discussion
Effect of Point Density on Traffic Sign Change Detection Accuracy
Analyzing the effect of point cloud density on traffic sign change detection accuracy involves evaluating results in two specific scenarios: the full point cloud and the scenario utilizing only extracted traffic signs. The F1 score and detection rate, which are key metrics, owing to their established prominence in the literature, serve as the primary measures for this analysis. The F1 score balances false positives and false negatives by averaging precision and recall, providing a comprehensive measure of the model’s accuracy. The detection rate is sensitive to false negatives, which are particularly significant in traffic sign detection applications, where missing a true change (e.g., damaged stop sign) can lead to severe consequences.
Figure 4 presents the F1 scores and detection rates at varying point cloud densities across all tested highways and in both the full point cloud and extracted traffic sign scenarios. The data reveal consistent trends across all three highway segments, suggesting that while absolute values of F1 scores and detection rates might be affected by external factors, such as surrounding vegetation, the relative effect of point density on detection accuracy remains consistent.
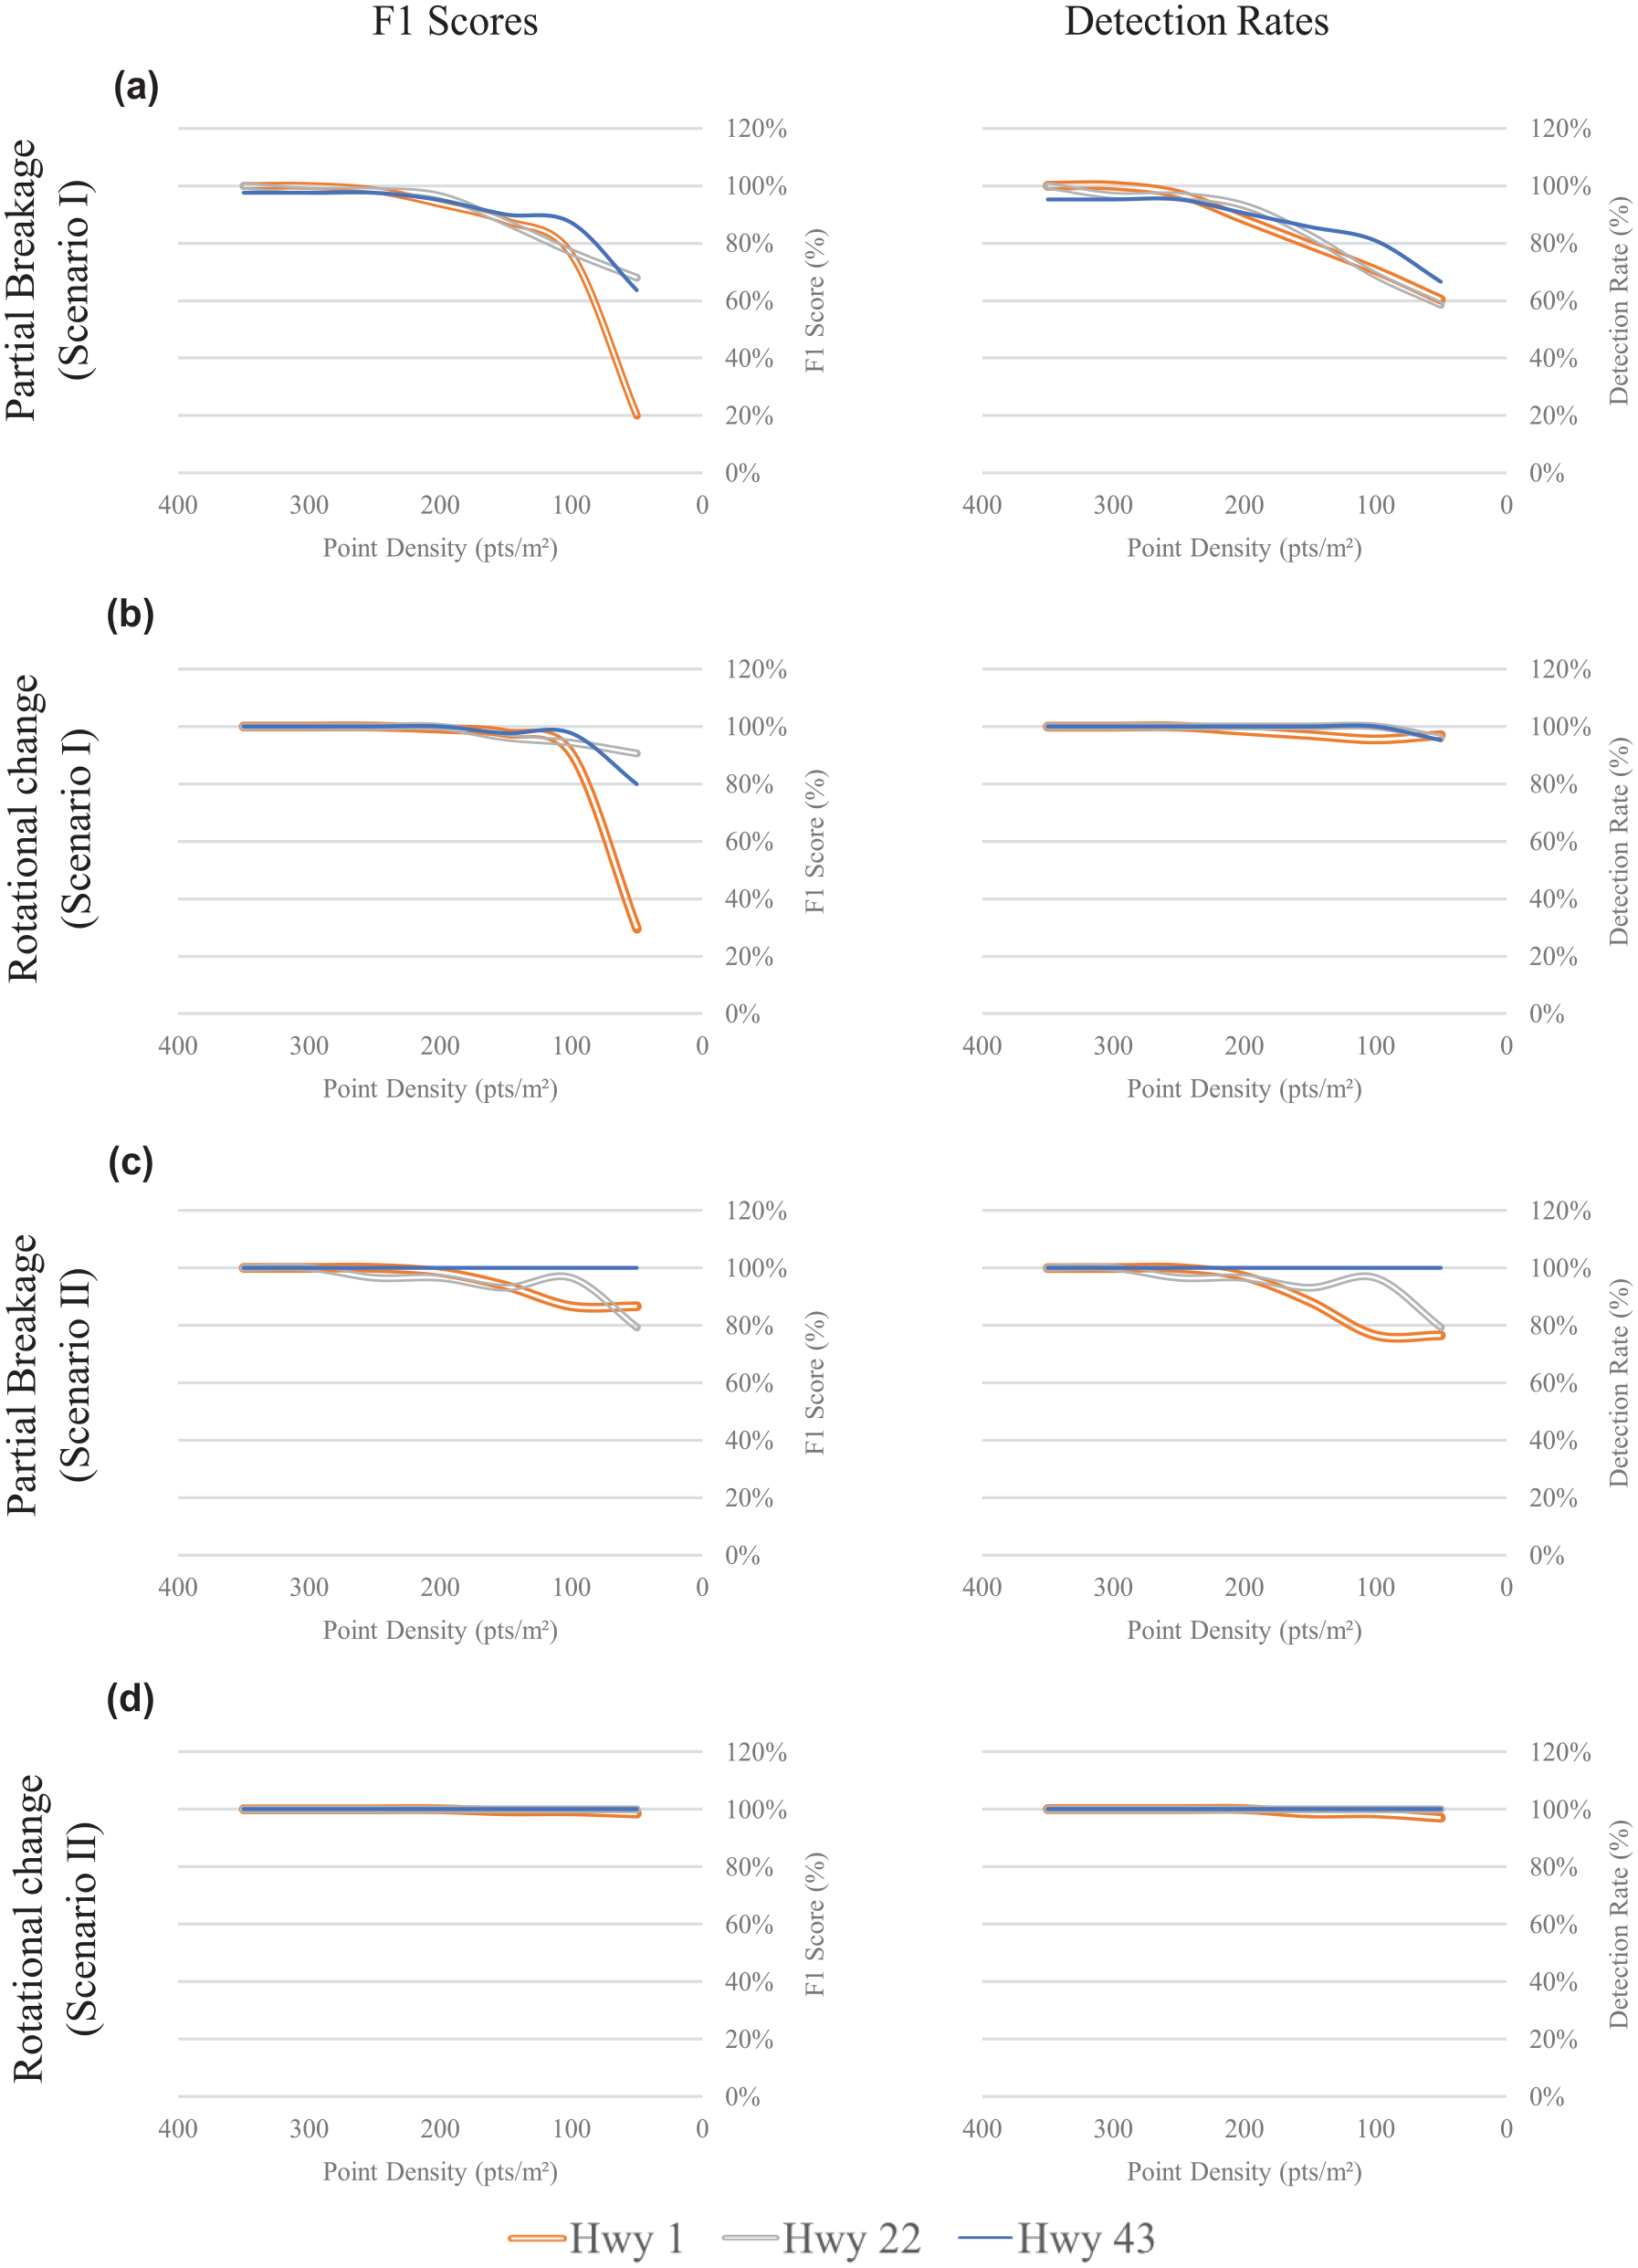
Effect of point cloud density on F1 score and detection rate for partial breakage and rotational changes under two scenarios: full point cloud (a, b) and extracted traffic signs (c, d), across three highway segments.
Full Point Cloud Scenario
In the full point cloud scenario, as shown in Figure 4a, the F1 score for detecting partial breakage significantly decreases at reduced point densities, particularly below 150 points/m2. For rotational changes, as shown in Figure 4b, the decline in F1 score becomes more significant at densities less than 100 points/m2, indicating a critical threshold below which detection accuracy notably deteriorates. On Highway 1, the F1 score remains consistent with other highways until the density drops to 100 points/m2. However, the drop in F1 score is especially sharp at very low densities, reaching as low as 20% at 50 points/m2. Despite these declines, the detection rate—which emphasizes identification of actual changes while minimizing false negatives—remains relatively stable across all three highways.
Extracted Traffic Signs Scenario
Conversely, the scenario using only extracted traffic signs demonstrates a substantial improvement in both the F1 score and detection rate. In this setup, detection efficacy is significantly enhanced across all tested highways and point densities, with F1 scores often remaining at 100%, even at lower densities of 50 points/m2. This improvement is particularly evident in rotational change detection, where F1 scores remain nearly perfect or perfect down to the lowest density tested. The detection rate also exhibits high consistency across all conditions, with a slight decrease in partial breakage detection at the lowest densities on Highway 1, yet the rate is 76% or higher. For rotational changes, detection rates are consistently high, never falling below 97%, even at densities as low as 50 points/m2.
Interpretation of Detection Accuracy Results
The analysis of detection accuracy highlights the pivotal role of point density in identifying changes in traffic signs. Crucially, it has been observed that point densities exceeding 250 points/m2 consistently produce nearly perfect F1 scores and detection rates, nearing 100% accuracy for both partial breakage and rotational changes. This finding suggests that, once this density threshold is exceeded, further increases do not substantially enhance detection accuracy. Decreases in point density, however, have severe effects on accuracy. Therefore, for entities constrained by budget limitations, selecting a scanner that maintains a point density just above this threshold could be both cost-effective and sufficient for reliable change detection.
In the case of the scenario utilizing only extracted traffic signs, this approach significantly enhances detection accuracy by focusing solely on relevant traffic sign data and eliminating background noise from the point cloud. Such noise reduction minimizes false positives, thus improving the precision of change detection. However, while this method improves accuracy, it requires more effort in capturing traffic signs from the existing conditions (the baseline scan), which might not always be feasible in all situations.
The results also demonstrate that detecting partial breakage changes is consistently more challenging than detecting rotational changes across both scenarios. This challenge is particularly pronounced for small-scale changes on smaller traffic signs, where slight reductions in detection performance can lead to significant accuracy effects. The delicate nature of partial breakage detection necessitates a refined detection capability, more vulnerable to reduced point densities.
Furthermore, Highway 1 demonstrated relatively lower accuracy in both scenarios. Dense vegetation adjacent to the highway contributes to this by obscuring traffic signs and leading to a higher incidence of false positives, which detrimentally affects the F1 score’s precision, especially at the lowest point densities in the first scenario. This indicates that, for traffic sign detection in areas with high vegetation, the results from Highway 1 can serve as a valuable guide. In the second scenario, on the same highway, the smaller traffic signs increase the likelihood of false negatives, thereby affecting the detection rate. The effect of traffic sign size on detection accuracy is substantial and merits further analysis; this is addressed in the following section.
Logistic Regression Results
In the logistic regression analysis, three interrelated predictors were hypothesized to effect the accuracy of change detection: point density, the size of the traffic sign, and the magnitude of the simulated change. The magnitude of change is categorized by either the percentage of the area affected, in partial breakage cases, or the angle of rotation, for rotational changes. The outcomes of this analysis are detailed in Table 1, which presents the coefficients, standard errors, and p for each predictor variable in both partial breakage and rotational change cases. This table provides a comprehensive overview of the statistical significance and effect of each variable on change detection accuracy.
Logistic Regression Analysis Outcomes: Size of Traffic sign (m2), Point Density, and Magnitude of Change
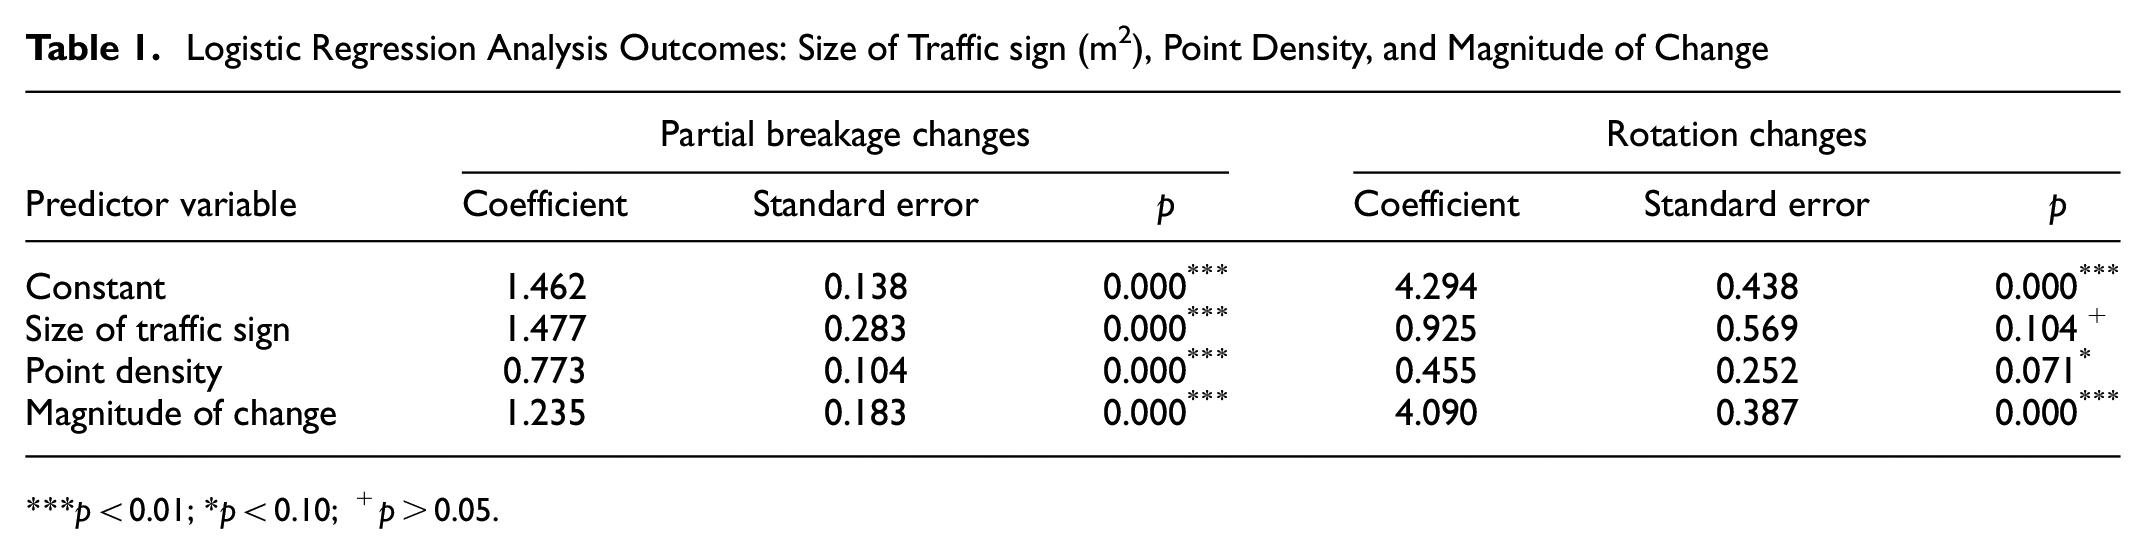
p < 0.01; *p < 0.10; + p > 0.05.
The analysis reveals that, for partial breakage changes, the size of the traffic sign has a strong direct relationship with change detection efficacy, highlighting the importance of sign dimensions in identifying alterations. Point density also plays a crucial role, underscoring its significant effect on detection accuracy. The magnitude of change is another critical factor, indicating a strong and statistically significant relationship. This suggests that larger changes, with respect to breakage extent, enhance the model’s ability to detect alterations accurately.
For rotational changes, the size of the traffic sign is a less dominant predictor, indicating that it is not statistically significant at the 0.05 level but is close to the 0.10 threshold. In contrast, the magnitude of change in rotational changes has the highest coefficient, making it the most influential predictor for this type of change. Point density, with p = 0.071, is marginally significant at the 0.10 level; this indicates its influence on detection accuracy in rotational changes.
Further insights are provided by partial dependency (PD) plots (Figure 5), which outline the relationships between predictor variables and the accuracy of change detection. These plots, particularly Figure 5, b and c , demonstrate a clear correlation between higher point densities and larger traffic sign sizes, with improved detection accuracy, especially in cases involving partial breakage changes. Moreover, Figure 5d illustrates that detection accuracy significantly improves with the extent of alteration, such as when partial breakage surpasses 50% of the traffic sign’s area or when rotational changes exceed 30°. This positive relationship between the magnitude of change and the model’s capabilities is critical, affirming the influence of these predictors.
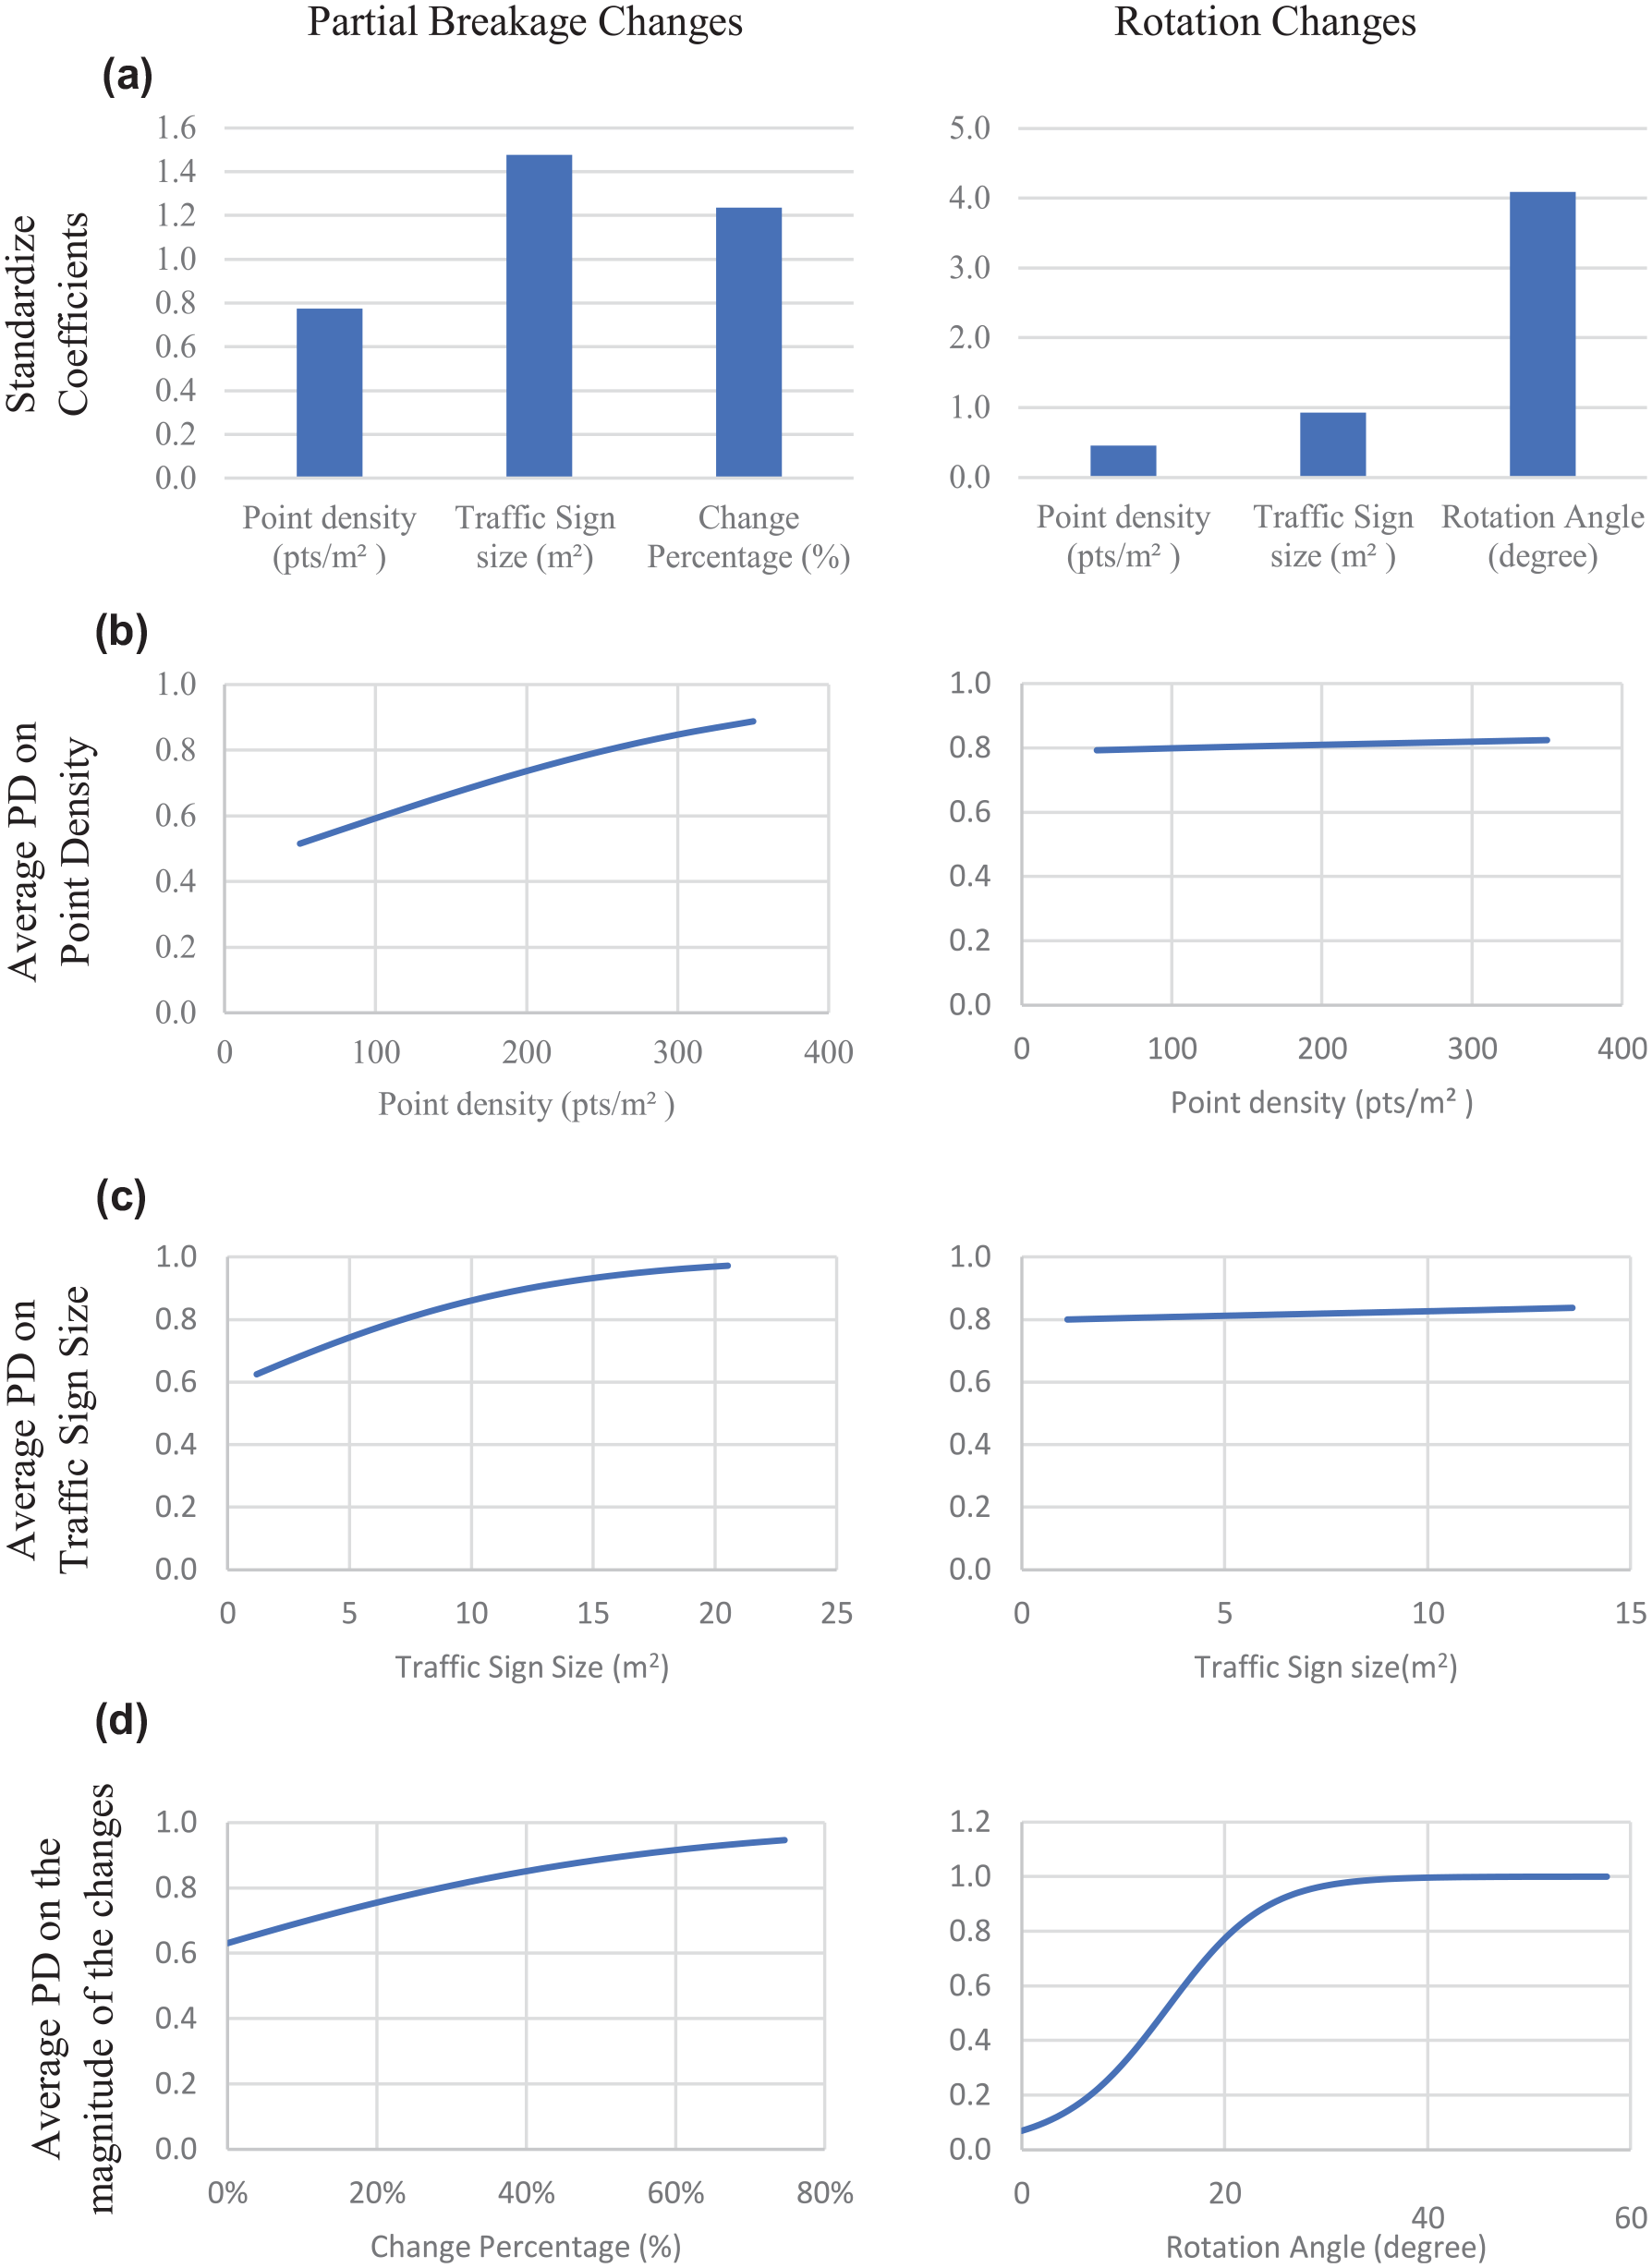
Illustration of key predictors influencing change detection accuracy. Standardized coefficients: (a) and partial dependence plots (b–d) show the effect of point density, traffic sign size, and change magnitude, respectively, on detection accuracy for both partial breakage and rotational changes.
These observations are reasonable, considering the nature of rotation changes, which affect the entire position of the traffic sign. As rotation angles exceed 30°, the distinction between the changed and original positions becomes more pronounced, making this type of change more distinct, even at very low point densities. This finding supports the earlier observation that detection accuracy for rotational changes tends to be greater across various point densities than for partial breakage changes, owing to the more distinct and noticeable shift in the sign’s appearance.
Broader Implications and Applications of Change Detection
Beyond traffic signs, the aim in this part of the work is to quantify the effect of change size on various road assets subjected to changes. While rotational changes primarily affect infrastructure elements, such as traffic signs and light poles, breakage changes and dents can influence a broader range of components, including guard rails, bus stops, toll booths, sound barriers, bridge supports, and building facades. Understanding how different point densities affect the detection of changes of various sizes is crucial, extending implications from traffic sign maintenance to broader infrastructure care.
In this study, we applied the concave hull method to measure the area difference of traffic signs before and after changes, using this metric as a normalized indicator to assess how change size per unit area influences detection accuracy. Logistic regression analysis was subsequently performed, incorporating this measure—change size per square meter—as a new predictor. This new predictor replaced the previous traffic sign-specific predictors, such as sign size and change percentage, while still including point density. The outcomes of this logistic regression analysis are presented in Table 2.
Logistic Regression Analysis Outcomes: Change Size (m2) and Point Density
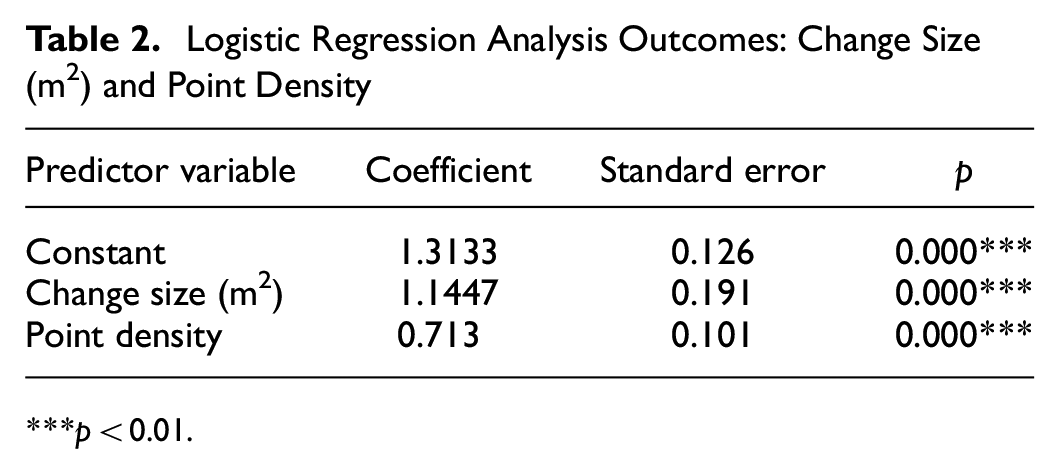
p < 0.01.
The logistic regression results indicate that both change size and point density are significant predictors of detection accuracy. The coefficients for change size (1.1447) and point density (0.713) highlight their strong influence on the model’s ability to detect changes.
Further insights are illustrated in Figure 6, which delineates the correlation between change size per square meter, point density, and the probability of detecting these changes. The heat map confirms that detection accuracy improves with increased point density and that the probability of detecting changes also escalates with the size of the change. For instance, at a point density of 250 points/m2, the detection accuracy is about 90% if the change size is approximately 0.4 m2; it increases to 95% if the size of the change is larger than 0.6 m2. This relationship is crucial across various applications and is generalizable, facilitating its adoption in diverse conditions.
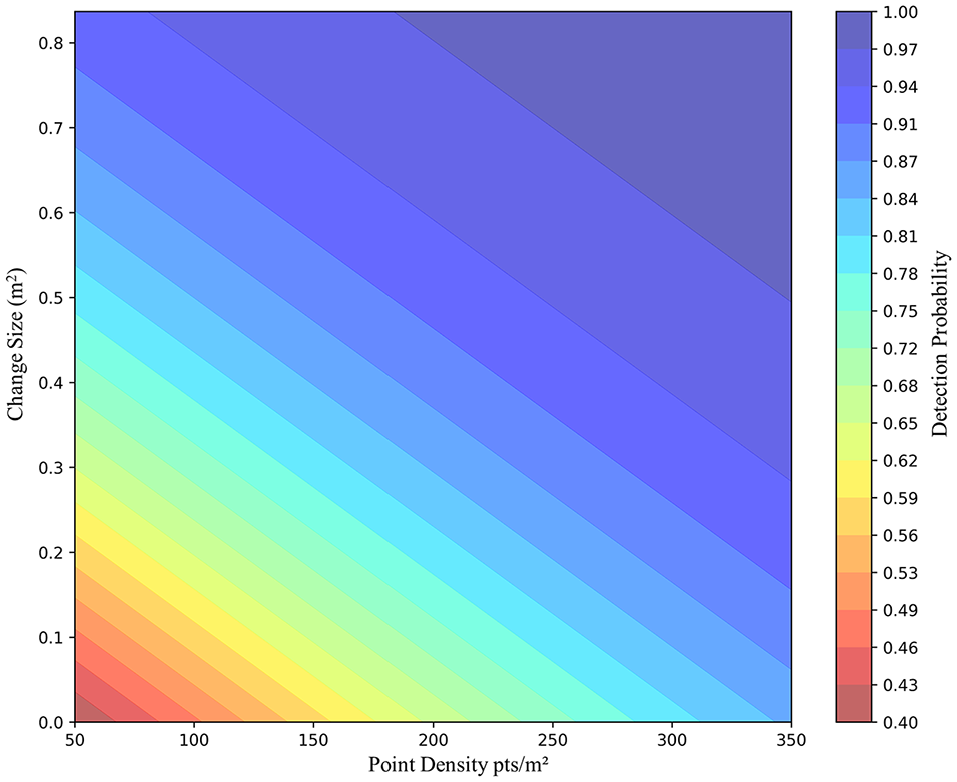
Heat map visualization of change detection probability, excluding traffic sign size effects, across varied point densities and change magnitudes.
Additionally, the heat map helps to identify optimal point densities for effective change detection and assess the probability of detecting changes at specific densities across different change sizes. Ultimately, Figure 6 is crucial for guiding strategic decisions in infrastructure monitoring and maintenance, emphasizing the extensive implications and applications of change detection in enhancing highway safety.
Theoretical and Practical Implications of This Study
Theoretically, this study extends the existing literature on infrastructure monitoring by providing an in-depth analysis of the effects of lidar point cloud density and change size on detection accuracy for road asset modifications. Previous studies have extensively explored lidar applications in such fields as forestry ( 17 – 19 ) and building diagnostics ( 31 , 32 ), establishing a baseline understanding of point density effects on detection accuracy in these contexts. However, there remains a notable gap in transportation infrastructure research specifically addressing how point density and change size affect detection accuracy for road assets, such as traffic signs and other critical components ( 26 , 27 ). This study addresses this gap by statistically quantifying the effects of varying point densities and change sizes, offering insights that allow for a more precise understanding of detection performance.
Practically, these findings can support transportation agencies in optimizing mobile lidar operations and making informed equipment purchases. The outcomes of this study suggest that agencies can confidently invest in lower-cost lidar systems with sufficient resolution for effective change detection across various road assets. By reducing the need for ultra-high-resolution scans, agencies can conduct more frequent and widespread monitoring within budget constraints, ultimately enhancing infrastructure safety and maintenance planning. For example, agencies could adjust scanning settings to achieve the identified point density threshold of 250 points/m2 when monitoring traffic signs, ensuring high detection accuracy without the costs associated with higher-density scans. This approach could also extend to monitoring other road assets—such as guard rails, bridge supports, and overhead structures—where a similar balance between resolution and detection accuracy is essential.
Conclusion
The adoption of mobile lidar technology for traffic sign change detection has been hindered by the high costs associated with purchasing and operating high-resolution scanning systems. This study contributes to the existing literature by providing insights into the feasibility of utilizing low-resolution point clouds for such purposes. Using mobile lidar data collected from over 130 traffic signs along three different highways in two provinces in Canada, it was established that a point density threshold of approximately 250 points/m2 is critical for accurate change detection in traffic signs. Below this threshold, the accuracy of detecting changes—both partial breakage and rotational changes—begins to deteriorate.
This research clarifies the effect of point density on detection accuracy and examines how traffic sign dimensions and the magnitude of changes affect detection outcomes. Logistic regression results indicate that the size of the traffic sign significantly affects the ability to detect partial breakage, while the magnitude of change has a more pronounced effect on detecting rotational changes. Additionally, to generalize the findings, the effect of change size per square meter was evaluated, establishing a clear relationship between point density and the absolute area of change, and their combined influence on change detection accuracy.
For transportation agencies, these results provide insights into balancing data quality with operational efficiency, aiding in the management of mobile lidar scanning costs while ensuring the collection of detailed data for accurate change detection. Although this paper presents a comprehensive assessment of the effects of several variables on change detection accuracy, the focus was specifically on traffic signs. Therefore, it is recommended that future work should be considered to extend this assessment to other infrastructure assets.
Footnotes
Acknowledgements
The authors extend their gratitude to Nektar 3D for providing the data used in this research.
Author Contributions
The authors confirm contribution to the paper as follows: study conception and design: Khataan, Gargoum; data collection: Khataan; analysis and interpretation of results: Khataan, Gargoum; draft manuscript preparation: Khataan. All authors reviewed the results and approved the final version of the manuscript.
Declaration of Conflicting Interests
The author(s) declared no potential conflicts of interest with respect to the research, authorship, and/or publication of this article.
Funding
The author(s) disclosed receipt of the following financial support for the research, authorship, and/or publication of this article: This research was supported by the NSERC Discovery Grant and NSERC Alliance.