
Abstract
Governments and public transport (PT) companies worldwide are assessing the impact of PT fare innovations such as the Deutschlandticket or fare-free PT in response to promoting sustainable mobility and increasing ridership in a postpandemic world. However, to date, studies analyzing the impact of fare innovations on travel behavior have not fully exploited the spatial and temporal insights provided by novel smartphone-based tracking data. Our study addresses this gap by introducing four novel indicators that are simple yet insightful: (a) generalized cost of travel in fare associations, (b) travel distance per weekday and fare zone, (c) activity time per fare zone, and (d) travel direction per mode and zone of residence. The methodological relevance of these indicators for PT fare innovation assessment is discussed by applying these indicators to the case of the Deutschlandticket, an inexpensive, flat fare, nationwide PT travel pass, which replaces several local travel cards. We used multimonth, semipassive, smartphone-based tracking data from the Mobilitä.Leben study to assess the impact of the Deutschlandticket. The results showed that the effects of the Deutschlandticket exceeded purely monetary benefits and varied across fare zones, weekdays, and times of the year. This paper contributes to the assessment of the Deutschlandticket and expands scientific methods for assessing PT fare policy innovations. Spatial and temporal dimensions of activity time, trip distance, and trip direction are integrated into one assessment, creating new insights for urban planning and equity analysis. PT operators could use the indicators to optimize revenue distributions and adapt fare structures.
Keywords
Fare innovations affect public transport (PT) and travelers in cities and countries worldwide: Luxembourg ( 1 , 2 ) and Tallinn ( 3 , 4 ) introduced fare-free public transport (FFPT), Austria ( 5 , 6 ) introduced the KlimaTicket, and digital or smartphone-based ticketing has become widespread ( 7 ). Among those innovations, the Deutschlandticket (D-Ticket), a low-cost, fixed-rate travel pass for PT in Germany, is Germany’s most prominent and radical fare innovation in decades. It grants PT access everywhere in Germany for a monthly subscription of €49 instead of significantly more costly tickets and a patchwork of local and regional fares. Note that the change in cost and benefits of the D-Ticket is so substantial that it can also be approached from the FFPT perspective. Considering the high cost of 3 billion euros annually in public subsidies ( 8 ), its assessment has become crucial and a subject of public debate. However, several traditional assessment approaches have failed to capture the critical dimensions of the D-Ticket, which is supposed to simultaneously accomplish financial relief and more sustainable transport ( 9 ). This study introduces four novel indicators that exploit innovative data to address previously neglected dimensions of fare innovation assessment, specifically how impacts vary across space and time.
Mobility policy goals increasingly focus on sustainability, accessibility, and mobility justice. Cost efficiency and political feasibility remain essential. Societies across the globe are working to achieve the United Nations Sustainable Development Goals ( 10 ). To this end, the assessment of sustainability, equity, and resilient mobility infrastructure systems becomes essential for assessing mobility policies. Many cities and countries are striving to reduce emissions and inequalities by reducing car traffic and shifting demand toward PT with fare innovations ( 11 ). Furthermore, the shift in travel patterns and preferences in a postpandemic world has required governments and transit agencies to redesign PT fare policies that ensure financial sustainability and incentivize sustainable travel ( 12 – 15 ). Pricing and regulation are not novel public policy instruments but are increasingly tailored toward PT and active mobility to increase accessibility and equity ( 16 – 18 ). Introducing FFPT or low-cost fixed-rate travel passes has been a prominent approach in Europe over the past few years ( 3 , 5 , 19 – 21 ). Considering the associated costs for society and companies for operating PT systems in general and introducing novel fare policies, in particular, implies that assessing the impact of fare policy decisions is crucial.
Literature assessing the impact of PT fare innovations dates back to the 1980s, if not earlier ( 22 , 23 ), and indicators established then are still in use today ( 3 , 24 ), like trip numbers, distances, and durations based on travel diaries, even though the data collection methods have changed. Meanwhile, smartphones have become a dominant element in human life and in mobility, changing how people navigate and buy tickets ( 25 , 26 ). For example, Mobility-as-a-Service (MaaS) uses the smartphone for information, pricing, and data collection ( 27 , 28 ). The potential to use smartphone-based travel data for mobility assessment has long been recognized ( 29 ).
When introducing FFPT or a fare policy without physical ticketing infrastructure, traditional fare card- or trip-level data will no longer be available for assessment ( 30 ); here, smartphone-based tracking data, that is, GPS trajectories, provide a valuable alternative. Tracking data covering a period before and after the introduction of the D-Ticket ( 31 ) can not only compensate for lost data but also hold the potential for further analysis of combined temporal and spatial dimensions. This potential encompasses the time spent on activities at different locations, which is the primary motivation for mobility ( 32 ). This paper contributes to the public and academic debate on the benefits of the D-Ticket and advances the methodology of PT fare innovation assessment, and provides the first results on the spatial distribution of generalized cost of travel (GCT) and changes in time spent on activities owing to the D-Ticket. To the best of our knowledge, this study is the first to calculate GCT based on GPS trajectories on multi-month panel data, and the first to integrate multimonth activity time measures in PT fare innovation assessment. Moreover, we introduce travel direction as a new level of analysis, which is especially relevant for fare associations with spatially segregated zones. These indicators offer novel insights into individual travel following introduction of the D-Ticket. The analysis is based on the smartphone-based tracking panel Mobilität.Leben ( 31 ) and enriches previous assessments of the D-Ticket ( 20 , 33 ).
The following sections provide context and a case description, a summary of the literature on established and innovative data and the indicators used to assess European fare policy interventions, and the data and methodology used in the current study, before introducing the novel indicators for mobility policy assessment. The results of these novel indicators are presented for the case of the D-Ticket, and their relevance is discussed at the end of the paper.
Background and Case Description
Travel Pass Fare Policy in the DACH Region
PT fare structures in Germany, Austria, and Switzerland (DACH region) are typically organized by fare associations (Tarifverbünde) and follow fare zones (Tarifzonen). Fare associations are not PT operators but coordinate the fares and services of multiple independent operators. Although numerous transport providers of various sizes offer one or multiple modes of PT each, travelers can use all modes of transport with one ticket within these fare associations. The objective of fare associations is to improve the service quality for users and to exploit synergies among transport providers. Fare associations use unified tickets and coordinate lines and stations to make transit easier and more efficient for travelers ( 34 ). The regional integration of prices, schedules, and services contributes to a higher PT demand in international comparison ( 35 ). Although travelers only need one ticket within the area of each association, a new ticket is required for every additional fare association the traveler enters. Multiple fare zones may exist within each transport association, and travelers must determine the cost based on the area, distance, and time of each trip ( 34 ). This can be particularly annoying because all tickets must be purchased correctly before entering the first vehicle, unlike check-in and check-out systems common outside the DACH region.
To simplify ticket purchases and distribute revenue fairly among the companies, transport providers in and around Hamburg established the first fare association, the Hamburger Verkehrsverbund, in 1965. The fully integrated regional and urban PT soon became standard within the DACH region ( 36 ). The Münchener Verkehrs- und Tarifverbund (MVV) coordinates bus, tram, regional train, suburban train, and underground operators, serving a total of 2.9 million citizens in 176 municipalities with one integrated fare structure ( 37 ). Until 2023, the area was divided into seven fare zones: a central zone, M, and decreasingly central Zones 1 through 6. Travelers were charged based on which and how many fare zones they entered on their trip; the correct price was determined from a price list, as simplified in Figure 1. This structure is exemplary of several other fare associations across the DACH region. The MVV offers travel passes for a specific period, for example, a day, week, month. They are valid for a particular part or the entire area of the MVV and cost up to €227.50 per month ( 38 ). Before the D-Ticket, these were the cheapest option for regular travelers. After purchasing the travel pass up-front, each trip with PT is conducted at zero marginal monetary cost ( 39 ). In recent years, innovative concepts for MaaS and more individual pricing, such as Homezone, have been developed ( 40 ). In this concept, the price is determined by the modes, area, and time interval that the traveler can freely choose, thus defining an individual zone of everyday mobility around their home. However, generic fare zones are still predominant in fare associations.
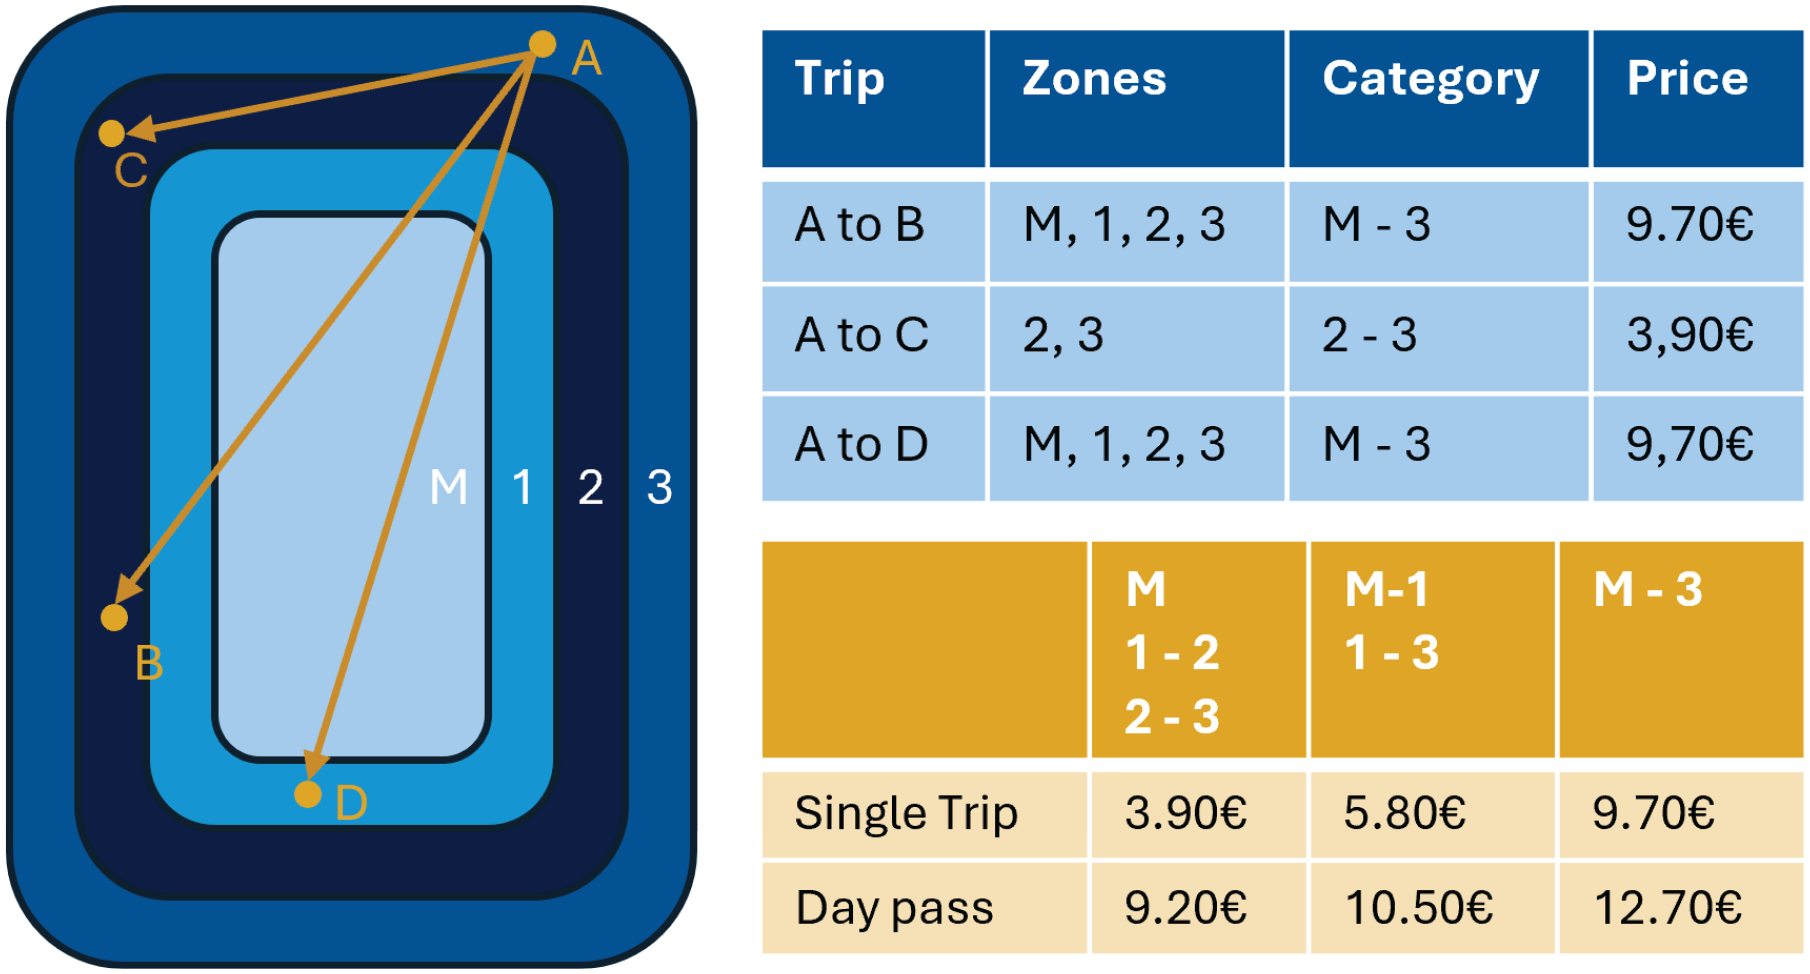
Ticket prices depend on the fare zones passed.
Recent PT Fare Innovations in Germany
Like its predecessor, the 9-Euro-Ticket ( 41 ), the D-Ticket combines two innovations: the abolishment of fare zones and a substantial price reduction. All prices refer to 2023 and were valid at the time the data were collected. A monthly ticket for the entire MVV alone would have cost €227.50 per month ( 38 ), whereas the D-Ticket provides public local and regional transport throughout Germany for €49 at its introduction, which has since risen to €58 per month (2025). The official government objectives for this intervention were financial relief and a shift toward more sustainable transport ( 9 ). Several studies analyzed the D-Ticket ( 20 , 31 , 42 – 46 ) based on different data sources ranging from online and phone surveys ( 44 , 46 ), representative online interview panels ( 20 ) and tweets ( 46 ), to tracking panels based on phone registration data ( 42 ) or smartphone-based GPS tracking ( 43 , 47 ). The 9-Euro-Ticket has been studied in relation to equity based on the number of trips and the mobility costs as a proportion of household income ( 45 ), but also from a PT company perspective ( 44 ) analyzing ticket ownership per user group, number of trips, modal shift from car to PT, and subjective preferences to (not) purchase its successor, the D-Ticket. A large study based on phone data ( 42 ) focuses on the number of trips per mode and weekday. A comprehensive study from 2022 ( 20 ) discusses attitudes, satisfaction, number and distance of trips per mode, and degree of urbanization. Moreover, the impact of the 9-Euro-Ticket and D-Ticket on travel behavior was analyzed for average daily travel distance, change in modal share, and GCT ( 48 ). Overall, the studies found increased trips and travel distance, decreased travel costs for holders of the D-Ticket, and a shift from car use to PT.
Common Indicators for Fare Policy Assessment
Low-cost, fixed-rate seasonal tickets and FFPT are two pivotal examples of PT pricing policies. They have been introduced at different levels and with varying objectives for decades ( 3 , 19 , 24 , 49 , 50 ). Today, the distinction between gratuitous PT and FFPT ( 3 ) highlights that FFPT is not generally “free” owing to nonmonetary and external costs ( 51 ). The decision-making processes behind the introduction of FFPT in Luxembourg ( 2 ) and Tallinn ( 4 ) were addressed qualitatively. Quantitative methods offer a macroperspective on the change in travel behavior; one of the first studies to perform such a data-driven analysis of the impact of FFPT ( 52 ) estimated demand response to free PT using out-of-pocket cost, access cost, access time, cars per capita in the zone of residence, and median household income in the zone of residence. Over the past three decades, technology to collect, process, and analyze data has improved. This paper distinguishes between established indicators (summarized in Table 1) and innovative indicators (summarized in Table 2). Among the innovative indicators, the most recent approaches rely on GPS tracking panels, used to analyze transport as early as 1996 ( 53 ). However, only with the smartphone, widespread availability of mobile Internet connection, and automated trip and mode detection software has this method reached its current potential ( 29 ). Passive tracking methods are still prone to errors: tracks may be incomplete, and trips or modes may be wrongly classified ( 29 ). One of the first studies to assess fare policies based on GPS tracking via a smartphone app was conducted on the effects of the KlimaTicket in Austria ( 5 ), which afforded valuable insights into the purchase and use of the ticket. The Mobilität.Leben study ( 31 ) is a further tracking panel based on semiactive travel diaries focused on one metropolitan region over 20 months.
Overview of Established Indicators for PT Fare Policy Assessment
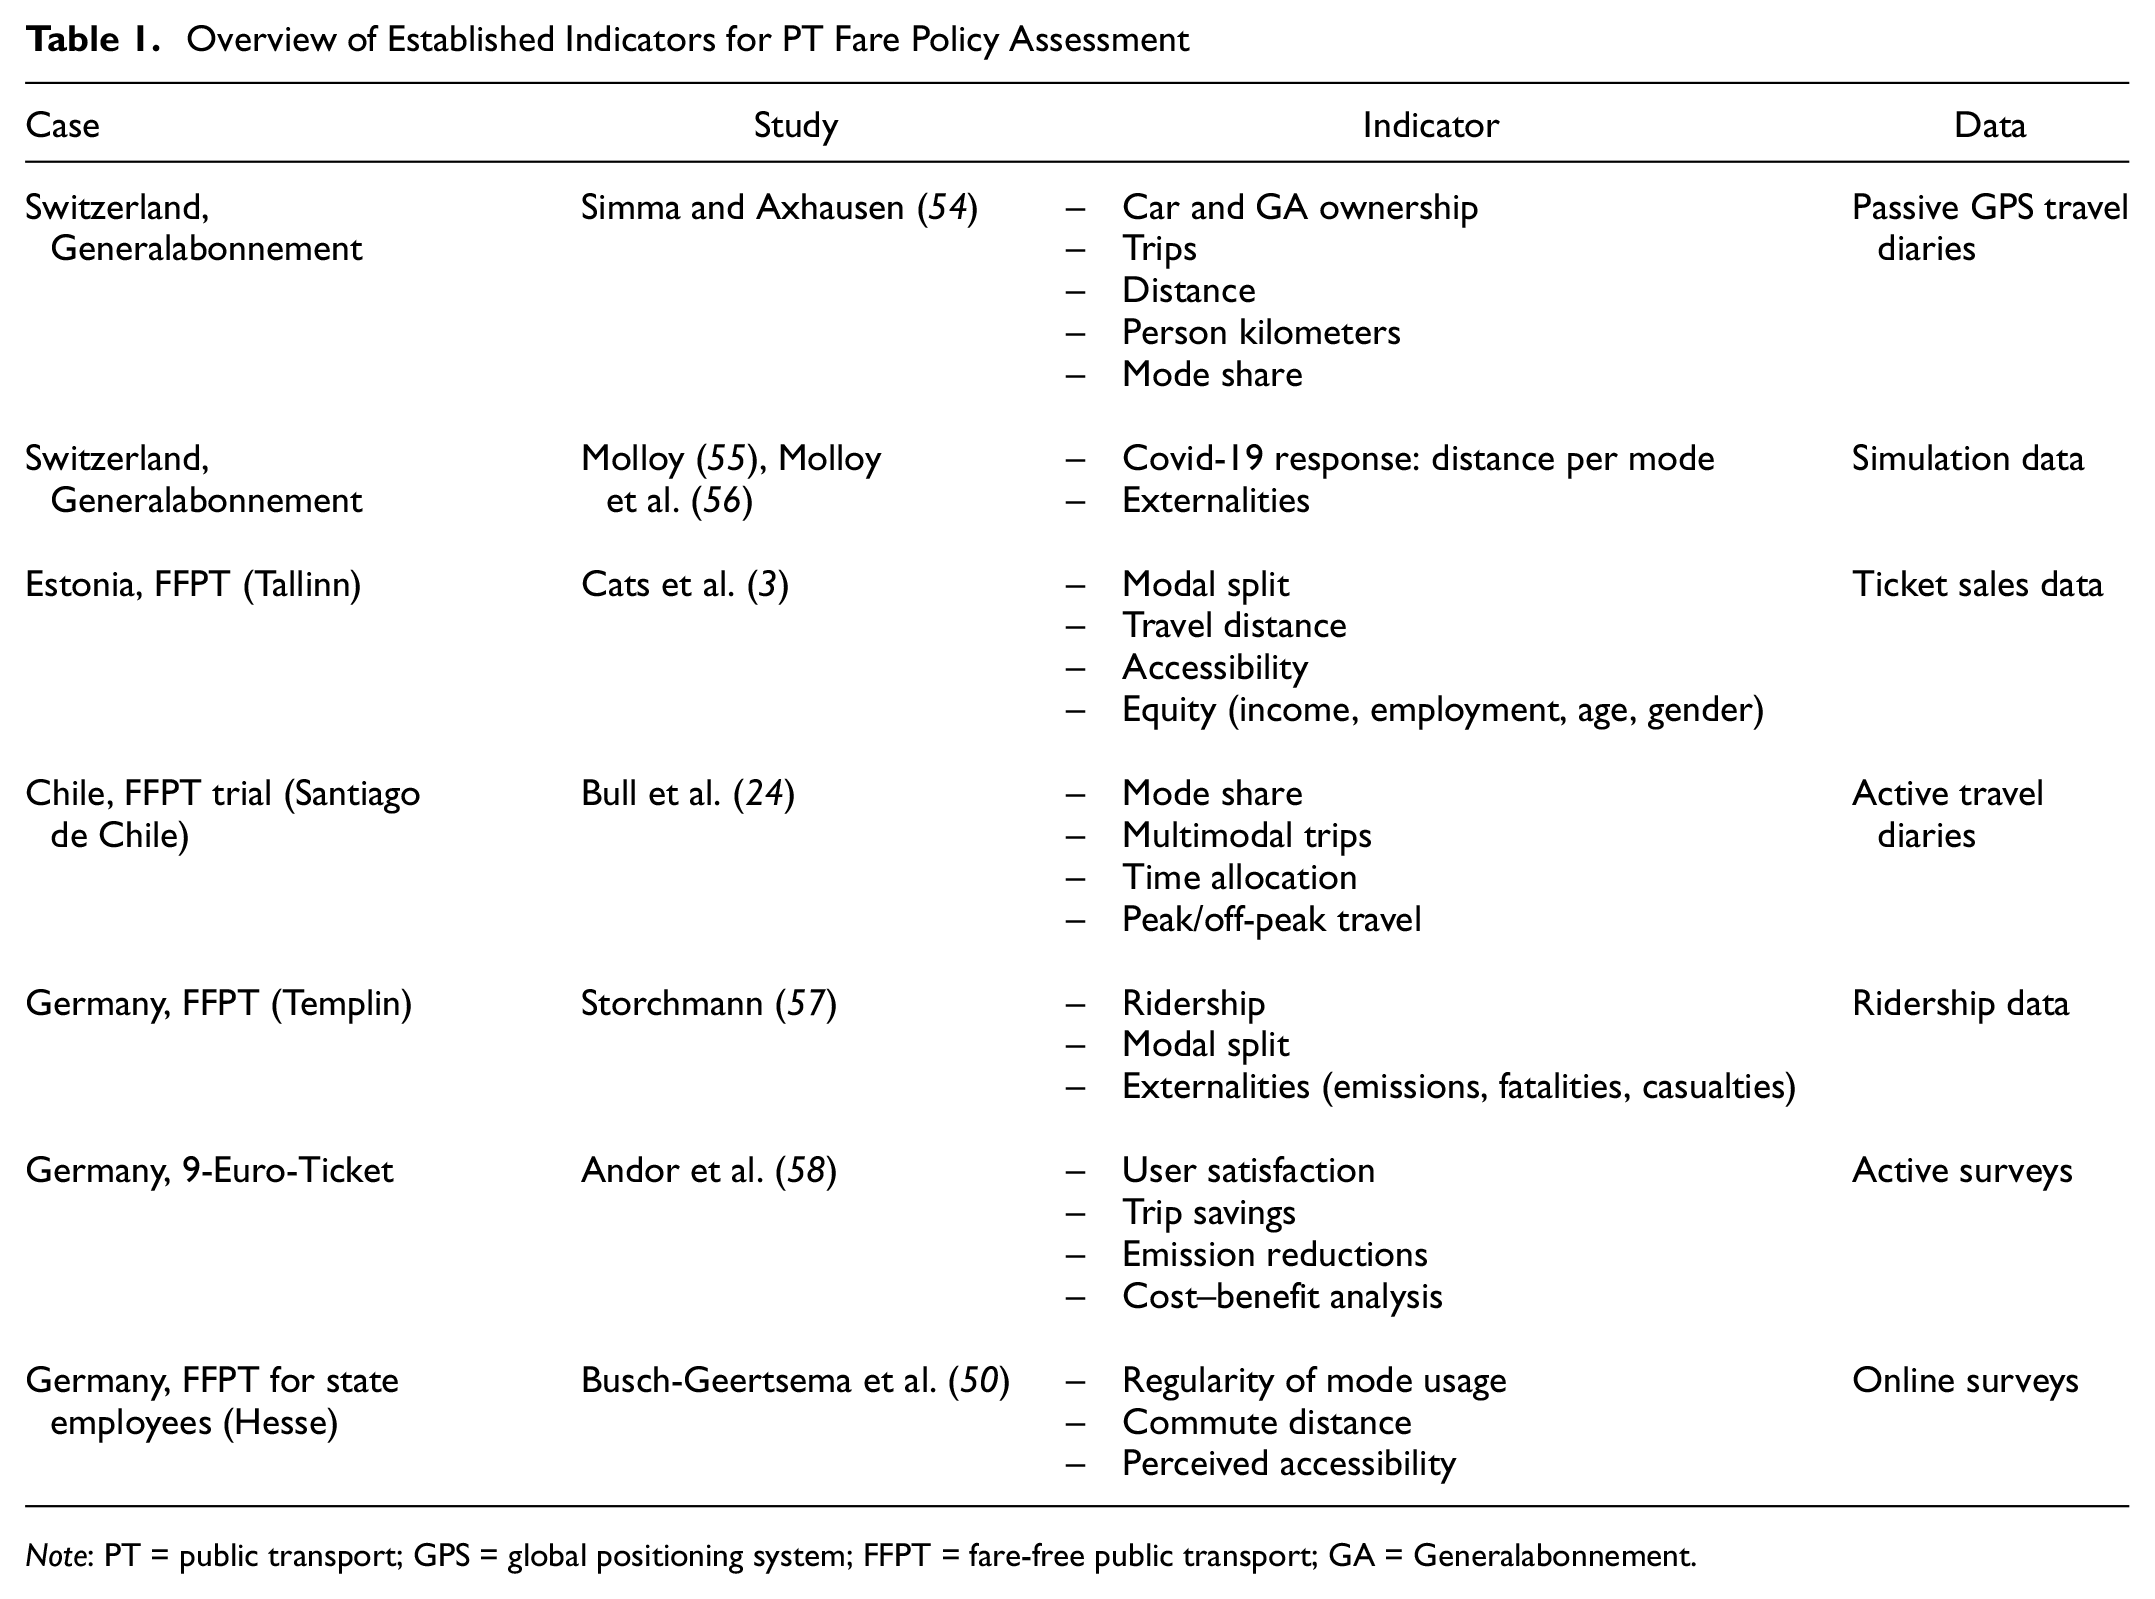
Note: PT = public transport; GPS = global positioning system; FFPT = fare-free public transport; GA = Generalabonnement.
Overview of Innovative Indicators for PT Fare Policy Assessment
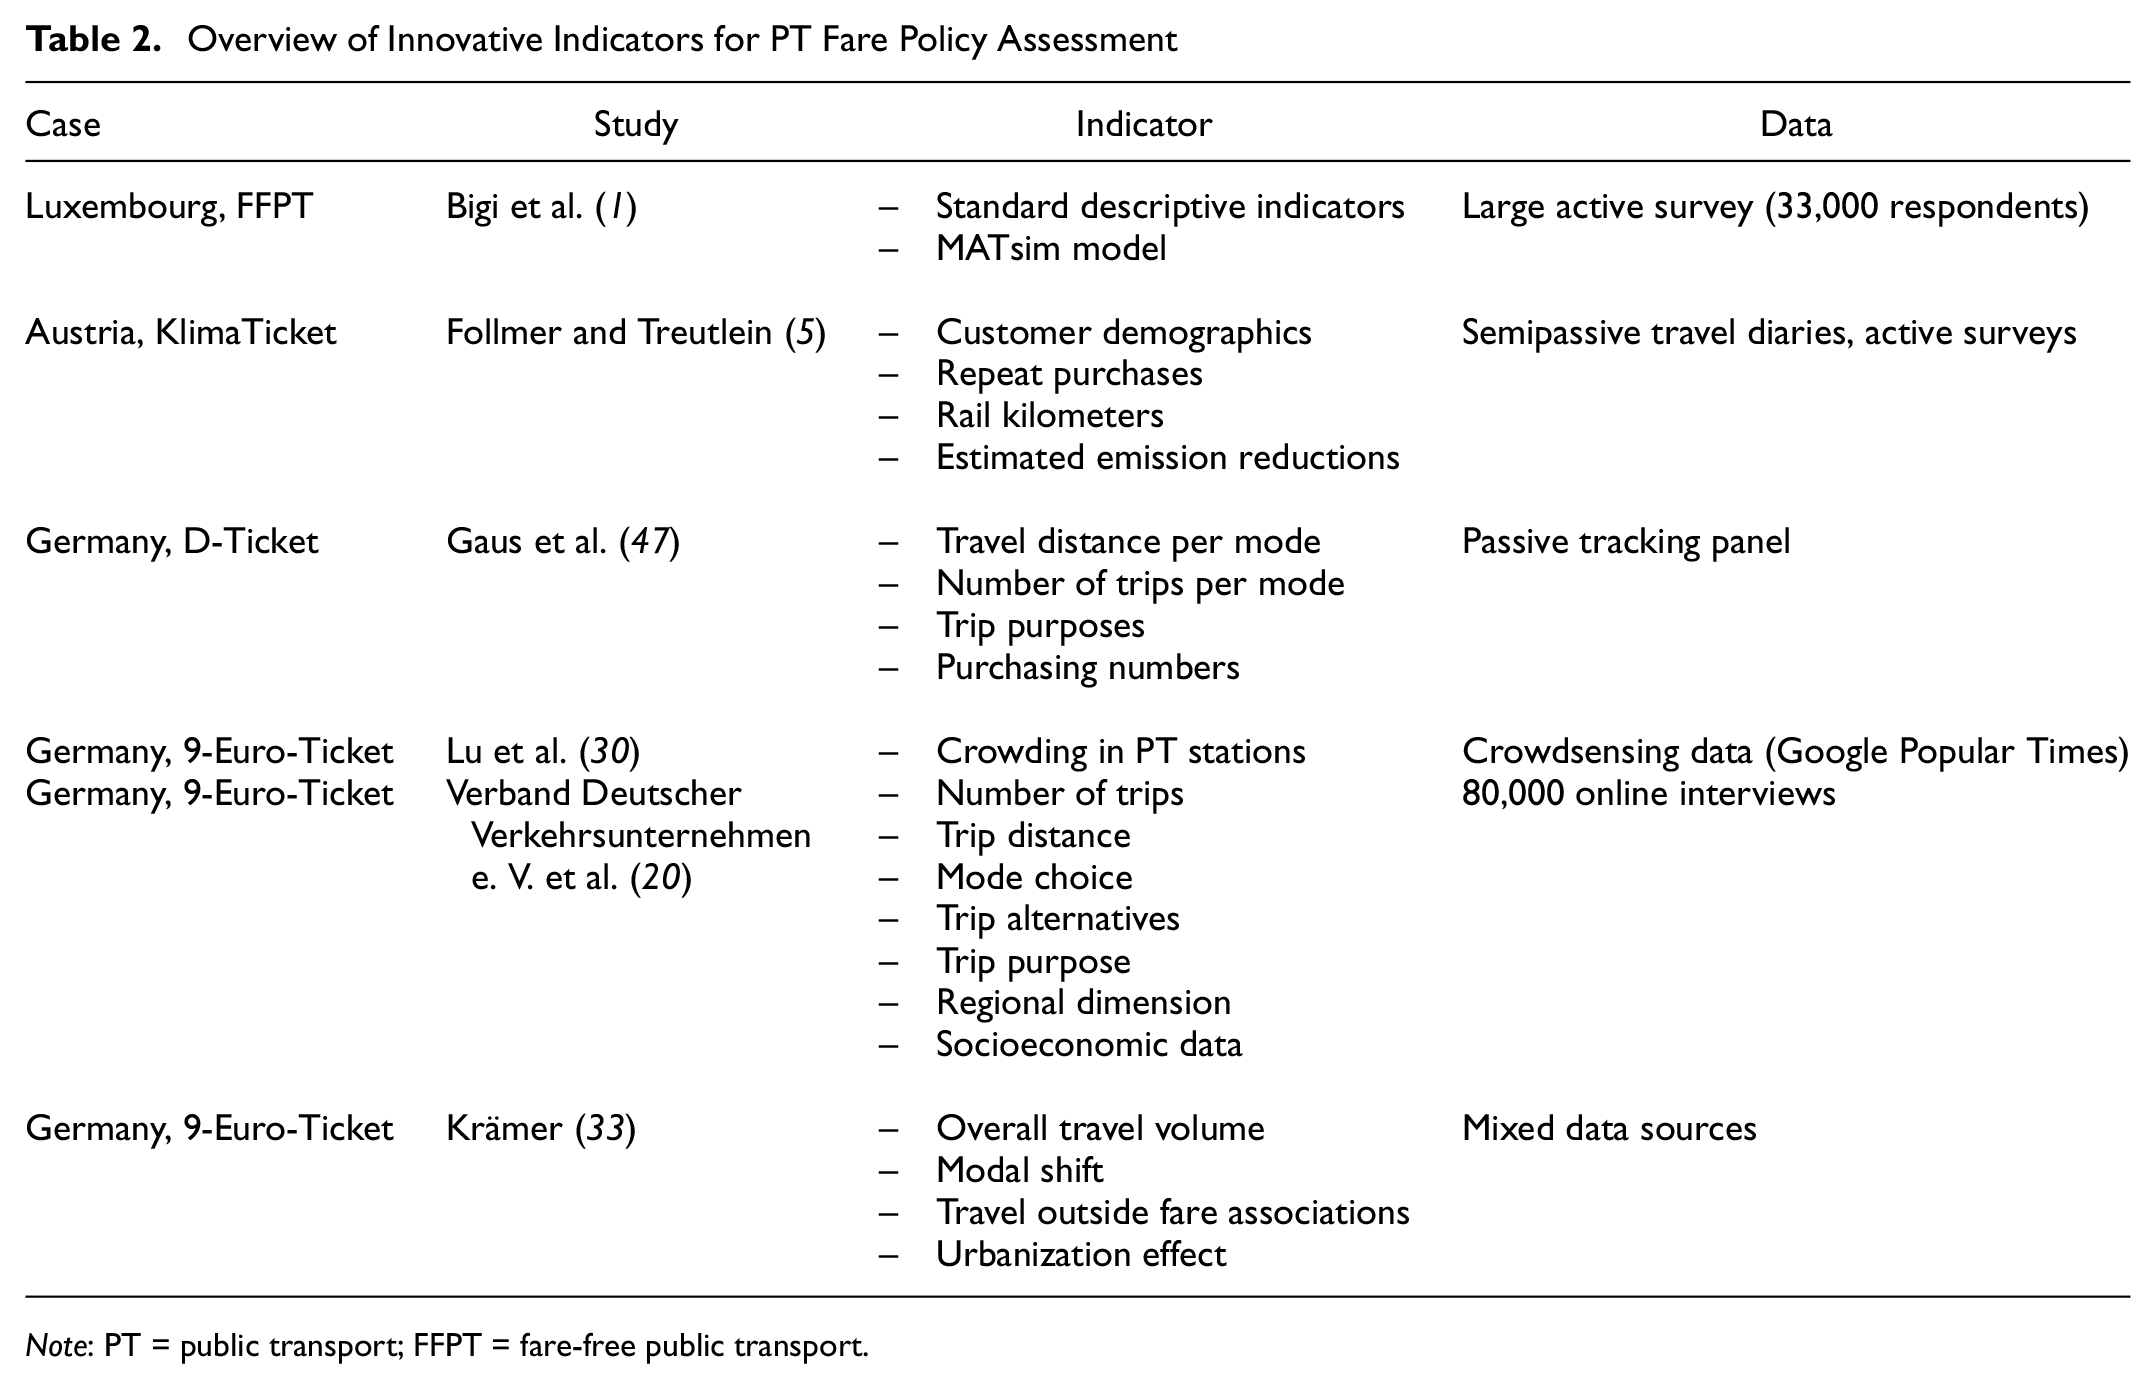
Note: PT = public transport; FFPT = fare-free public transport.
Established Indicators
Switzerland introduced the Generalabonnement (GA) several years ago, motivating several studies that assessed its impact on travel behavior. One of the earliest studies on the GA ( 54 ) is based on ownership (car or GA), number of trips, and distance traveled per mode. Person kilometers and mode share are essential indicators in other studies targeting COVID-19 response ( 59 ) or externalities ( 55 ) based on the passive GPS travel diaries in the MOBIS study ( 56 ), or revenue based on simulation ( 60 ). After Tallinn introduced FFPT in 2013 ( 3 ), one study analyzed the modal split based on the number of trips, as well as the travel distance per mode, accessibility in relation to days without travel and employment opportunities, and equity across multiple societal groups ( 3 ). A trial experiment was conducted in Santiago de Chile ( 24 ), offering free PT ridership to a sample of citizens and collecting active travel diaries. These travel diaries were then used to derive mode share, number of multimodal trips, time allocated to work, travel, and leisure, as well as the time of day for each trip in the context of peak and off-peak travel ( 24 ). Germany introduced the 9-Euro-Ticket in 2022 and its successor, the D-Ticket, in 2023, however, specific cities and regions had already introduced FFPT before this. The most prominent case is Templin, where PT was fare-free from 1997 through 2003. Since 2003, the city has heavily subsidized urban transport ( 49 ). A study from 2003 looked at ridership numbers, modal split based on trip numbers, and externalities such as emissions, fatalities, and casualties ( 57 ). The introduction of FFPT for state employees in the German state of Hesse was analyzed for its effects on the regularity of mode usage and attitudes based on commute distance and subjectively perceived accessibility ( 50 ). Data was derived from two quantitative online surveys from 2015 and 2019, respectively. In Bonn, 17,000 citizens received a climate ticket (KlimaTicket) for €365 for the year 2020 ( 61 ): measured mode usage was via a quantitative survey. More recently, the 9-Euro-Ticket and D-Ticket have inspired several scientific studies of their various effects. Based on traditional survey data, one focused on user satisfaction, average trip savings, and emission reductions before performing a cost–benefit analysis on the 9-Euro-Ticket as a measure to reduce negative climate impact ( 58 ). As stated, the established indicators for PT fare policy assessment are summarized in Table 1, however, none of these indicators offers a high resolution of individual locations in time and space. Moreover, data sources that rely on respondent self-report are prone to errors, as mistakes and manipulations by respondents can never be fully avoided ( 62 ).
Innovative Indicators
Several studies have applied established indicators to novel data sources, whereas others have used novel indicators or methods based on established data sources, as summarized in Table 2. An example of the latter is given by the analysis of FFPT’s impact on Luxembourg ( 1 ), which introduced FFPT in 2020 ( 19 ). Based on a survey of 33,000 respondents from 2017, a MATSim model was calibrated, and an analysis of the estimated impact of FFPT on car usage among different user groups was performed ( 1 ). They used established indicators like transport mode, travel time, travel distance, origin, and destination for each trip and aggregated the total travel distance and duration per person. However, estimating these from a synthetic population simulation rather than stated or revealed choice data was an innovative approach. Another example of established indicators being applied to novel data is given in the KlimaTicket report ( 5 ), based on semipassive travel diaries. Austria introduced the KlimaTicket in October 2021: purchasers can use public local, regional, and long-distance transport throughout the country. KlimaTicket report 2022 focused on analyzing customer groups, repurchase rates, average annual rail kilometers, and estimated emission reductions attributed to the KlimaTicket ( 5 ). The emission reductions were estimated based on statements by active-survey respondents about the alternatives for specific trips.
Similar approaches can be found in the context of assessments of the D-Ticket and its predecessor, the 9-Euro-Ticket. Based on a passive tracking panel, one study used travel distance per mode and number of trips per mode as leading indicators ( 47 ). They further considered trip purposes and purchasing numbers. The study found that overall travel rates increased with most new trips attributed to PT, but modal change, especially from cars, was only a marginal factor. Another study used Google Popular Times to assess the impact of the 9-Euro-Ticket on crowding in PT stations ( 30 ). This is one of the few studies that has analyzed the effects of PT fare innovations on a microlevel using phone-based data. The most extensive representative study on the 9-Euro-Ticket ( 20 ) was based on 80,000 online interviews before, during, and after the validity period of the 9-Euro-Ticket. The study analyzed various indicators, most importantly, the number of trips, trip distance, mode choice, trip alternatives, trip purpose, regional dimension of the trip, and socioeconomic data, including the location of residence and its degree of urbanization. Regional dimensions are particularly innovative in fare policy assessment. They found an increase in the overall number of trips and average trip distance, as well as a modal shift from car and active mobility to PT in the validity period. Holders of the 9-Euro-Ticket conducted more trips outside their fare association than those without the 9-Euro-Ticket, and the quantity of travel and 9-Euro-Ticket usage decreased with a decreasing degree of urbanization. Overall, the diversity of studies, data sources, and results has led, at times, to hasty and contradictory interpretations ( 33 ).
Beyond the policy interventions discussed so far, other studies have focused on aspects that had not been addressed previously in the context of FFPT or low-cost, fixed-rate travel passes. One such aspect is the equity of accessibility between locations ( 63 , 64 ), without temporal differentiation. Multiple researchers have analyzed the monetary travel cost of different pricing regimes to study the impact of fare structures on accessibility and equity ( 63 – 66 ). Another study integrated data on individual travel behavior, tracked via a smartphone app, with survey data on energy, residential choice, social networks, and important life events ( 67 ): the study enabled research on the cross-cutting effects of multiple phenomena usually addressed in solitary. An overview of GPS tracking methods and their application before 2016, dating back to 1997, can be found in research by Schönau ( 68 ). More recently, GPS tracks were used to study external travel costs ( 69 ). Overall, smartphones have become a powerful tool for transport researchers ( 29 ). Beyond fare policy, scholars in the field of time geography have started to address dynamic accessibility: the accessibility of locations or people depending on both time and space ( 70 ). However, such studies mostly rely on active travel surveys ( 70 – 72 ) or simulations ( 73 ) and could therefore benefit from modern tracking data and innovative indicators. In summary, scientific assessment of fare policy innovations often uses traditional data of a low resolution or without combined temporal and spatial information, or it fails to exploit the potential of novel GPS tracking panels in this regard.
Method and Data for Novel Indicators
The novel indicators were developed based on the identified research gaps and available information in the Mobilität.Leben data ( 31 ). GPS tracking panel data ( 5 , 31 , 69 ) represent a novel quality and detail of information on individual travel behavior. The Mobilität.Leben study ( 31 ) collected semiactive GPS-based travel diaries using a custom-made smartphone app. The app derived data on every trip, including departure and arrival times, speed, and exact route, from the recorded GPS trajectories. The app further assigned a transport mode and purpose to each trip, which the user could validate or correct. This combination of automated tracking and classification of trips with active validation by users is called a semipassive travel diary. Data were collected from June 2022 through December 2023, covering the end of the COVID-19 restrictions, the 9-Euro-Ticket, and the introduction of the D-Ticket in May 2023. (For details on study design and data processing performed before this study see [ 74 , 75 ].) For each trip, the data provided location, start and end time, trajectory, distance, duration, main mode, as well as purpose and duration of the next and previous stay. Additional variables were derived during data processing to indicate whether a trip was undertaken in Germany and within the MVV ( 75 ). The tracking data are enriched with sociodemographic data collected in multiple online questionnaires ( 31 ). The Mobilität.Leben data are a convenience sample and thus not representative, as highlighted in research by Allister et al. ( 74 ). For this study, additional filtering was performed. Trips that fulfilled one or more of the following criteria were excluded:
Duration longer than 24 h,
Trip entirely outside of Germany,
Trips with main mode being airplane or long-distance train.
Furthermore, to increase the internal validity of the monthly analysis, users who met at least one of the following criteria during 1 month were excluded for the respective month in both years:
Less than one trip in the MVV,
Less than six trips per week in at least one of the weeks during a month,
No information on purchase of the D-Ticket,
Missing information for start or end locations.
Finally, only trips between September and December in 2022 and 2023 were considered, eliminating seasonal effects. We based our analysis on 92,218 trips by 176 unique respondents.
Four Novel Indicators for Mobility Policy Assessment
This study introduces four novel indicators that are simple yet insightful for assessing the impact of fare policies on individual travel behavior in time and space based on GPS trajectories. These four indicators are (a) GCT in fare associations, (b) travel distance per weekday and fare zone, (c) activity time per fare zone, and (d) travel direction per mode and zone of residence.
Generalized Cost of Travel in Fare Associations
The D-Ticket is a fare innovation that benefits from substantial subsidy from the federal government with two goals: countering inflation by reducing consumption prices for Germany’s residents and motivating people to use more sustainable PT instead of cars. Quantifying the monetary savings allows a comparison of governmental subsidy and realized individual savings. Considering the 3 billion euros in annual subsidies and roughly 13 million users, the subsidy per user amounts to €230 annually or €19 per month. Using the Mobilität.Leben dataset provided the opportunity for novel and more precise insights. Exploiting the combined information on travel distance, duration, geographically traversed zones, ticket ownership, and value of travel time, we calculated the monthly GCT for each individual and differentiated between PT expenses, car expenses, and expenditure of time. Firstly, we expected the holders of the D-Ticket to save €19 or more on PT and car trips combined compared with before the introduction of the D-Ticket. Secondly, we hypothesized that holders of the D-Ticket would have increased their PT travel, resulting in higher expenditure under the unsubsidized pricing regime. Thirdly, we assumed that those without a D-Ticket would have lower PT spending than €49 and did not realize savings on car, PT, or GCT in 2023.
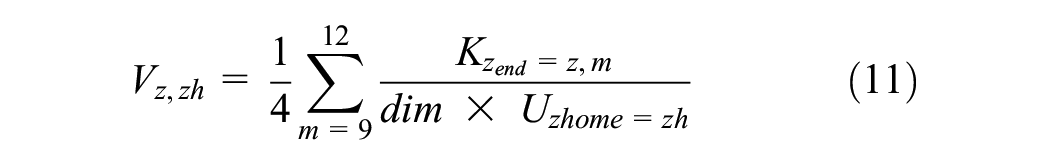
Calculating the ticket price for PT in fare associations like the MVV requires spatial data, because the price depends on the geographic area traversed. In our model, PT prices were computed by identifying all districts through which the respective trip passed. Each district is assigned a fare zone. The ticket price for PT,

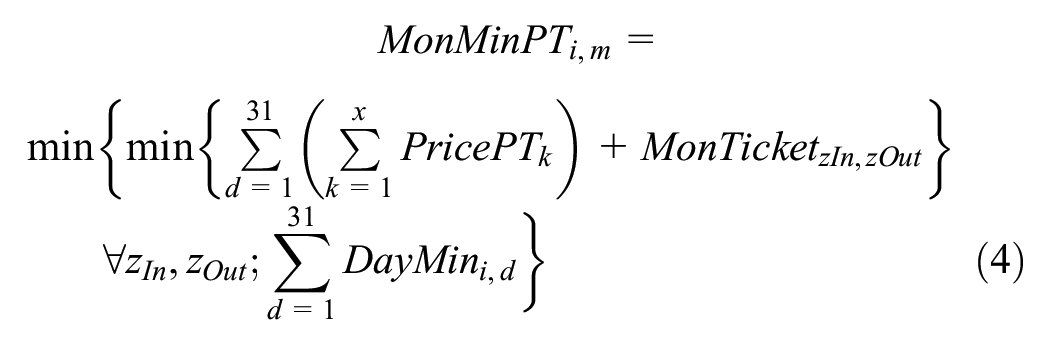
This approach enhances the precision compared with a calculation based on the start and end location, especially in fare associations where the route between start and end locations can affect the ticket price. Knowing the traversed zones for each trip, it is possible to calculate the minimum monthly monetary expenses for PT trips. First, the minimum daily price,


Second, the lowest total monetary cost per month is calculated for each user. Prices for monthly tickets depend on the zones included. For each user, the cost for each monthly ticket,
Beyond the PT price, the price for each trip for the car mode,

For the cost comparison, the relevant price is selected based on the main mode of transport, either car or PT. Trips with another main mode of transport are considered cost-free and are only considered in relation to expenditure of time.
Monetized time is calculated on the value of travel time savings (VTTS) derived from the Mobilität.Leben data before the introduction of the D-Ticket (
77
). Each trip,

The generalized cost of travel,

Travel Distance Per Weekday and Fare Zone
The D-Ticket allows PT trips at zero marginal cost. We hypothesized that holders of the D-Ticket would increase the distance traveled by PT across all zones and decrease the distance traveled by car, especially within the most central fare zones. We further assumed that the travel distance for nonowners would remain unaltered across all fare zones.


where distance per fare zone is calculated as the geographic intersection of trip trajectories with the geographic polygon of each fare zone,
The travel distance per MVV zone illustrates the spatial distribution of travel quantities. It reveals whether a fare innovation shifts travel from one area to another and is relevant for traffic planners to adapt infrastructure or policies accordingly.
Activity Time Per Fare Zone
Acknowledging that trips are made to spend time on activities at the destination, we analyzed how the D-Ticket altered the activity time and trip purposes. More specifically, we were interested in the spatial distribution of activity time spent on different purposes. Our first hypothesis was that people who own the D-Ticket spend more leisure time in the central fare zones on workdays and more leisure time in the city center and the most distant fare zones on weekends. Our reasoning was as follows: the city center is especially accessible by PT, and many people are already in the city center for work during the week. The D-Ticket enables travel across fare zones without additional cost, thus making trips to distant fare zones more attractive. However, the trip duration to these distant destinations makes travel there mostly attractive for longer activities on the weekend. Our second hypothesis was that people with the D-Ticket would spend less time at home. The reasoning was that travelers would be able to afford more out-of-home activities and more trips to the office instead of working from home because of the D-Ticket.
The activity time per zone represents the average time per person spent in each MVV zone: this includes only the time spent at a destination, not the travel to and from that location,

where

Thereby,
Travel Direction Per Mode and Zone of Residence
One of the D-Ticket’s major contributions is to eliminate fare zones for its holders. Threfore, they should consider fare zone boundaries irrelevant and travel across them more often. We assumed that most ticket holders are frequent travelers who regularly commute to work by PT and will thus already be making frequent trips to the city center before the fare innovation. We hypothesized that travelers with the D-Ticket would increase PT travel to all fare zones outside the fare zone of residence and decrease their car travel in all directions. To examine this issue, we applied the basic concept of origin–destination matrices to fare zones to examine whether the fare innovation altered directions of travel across fare zone boundaries,
For each user, we calculate the number of trips,
Results
Monthly Travel Savings Outweigh the Subsidy Per Person
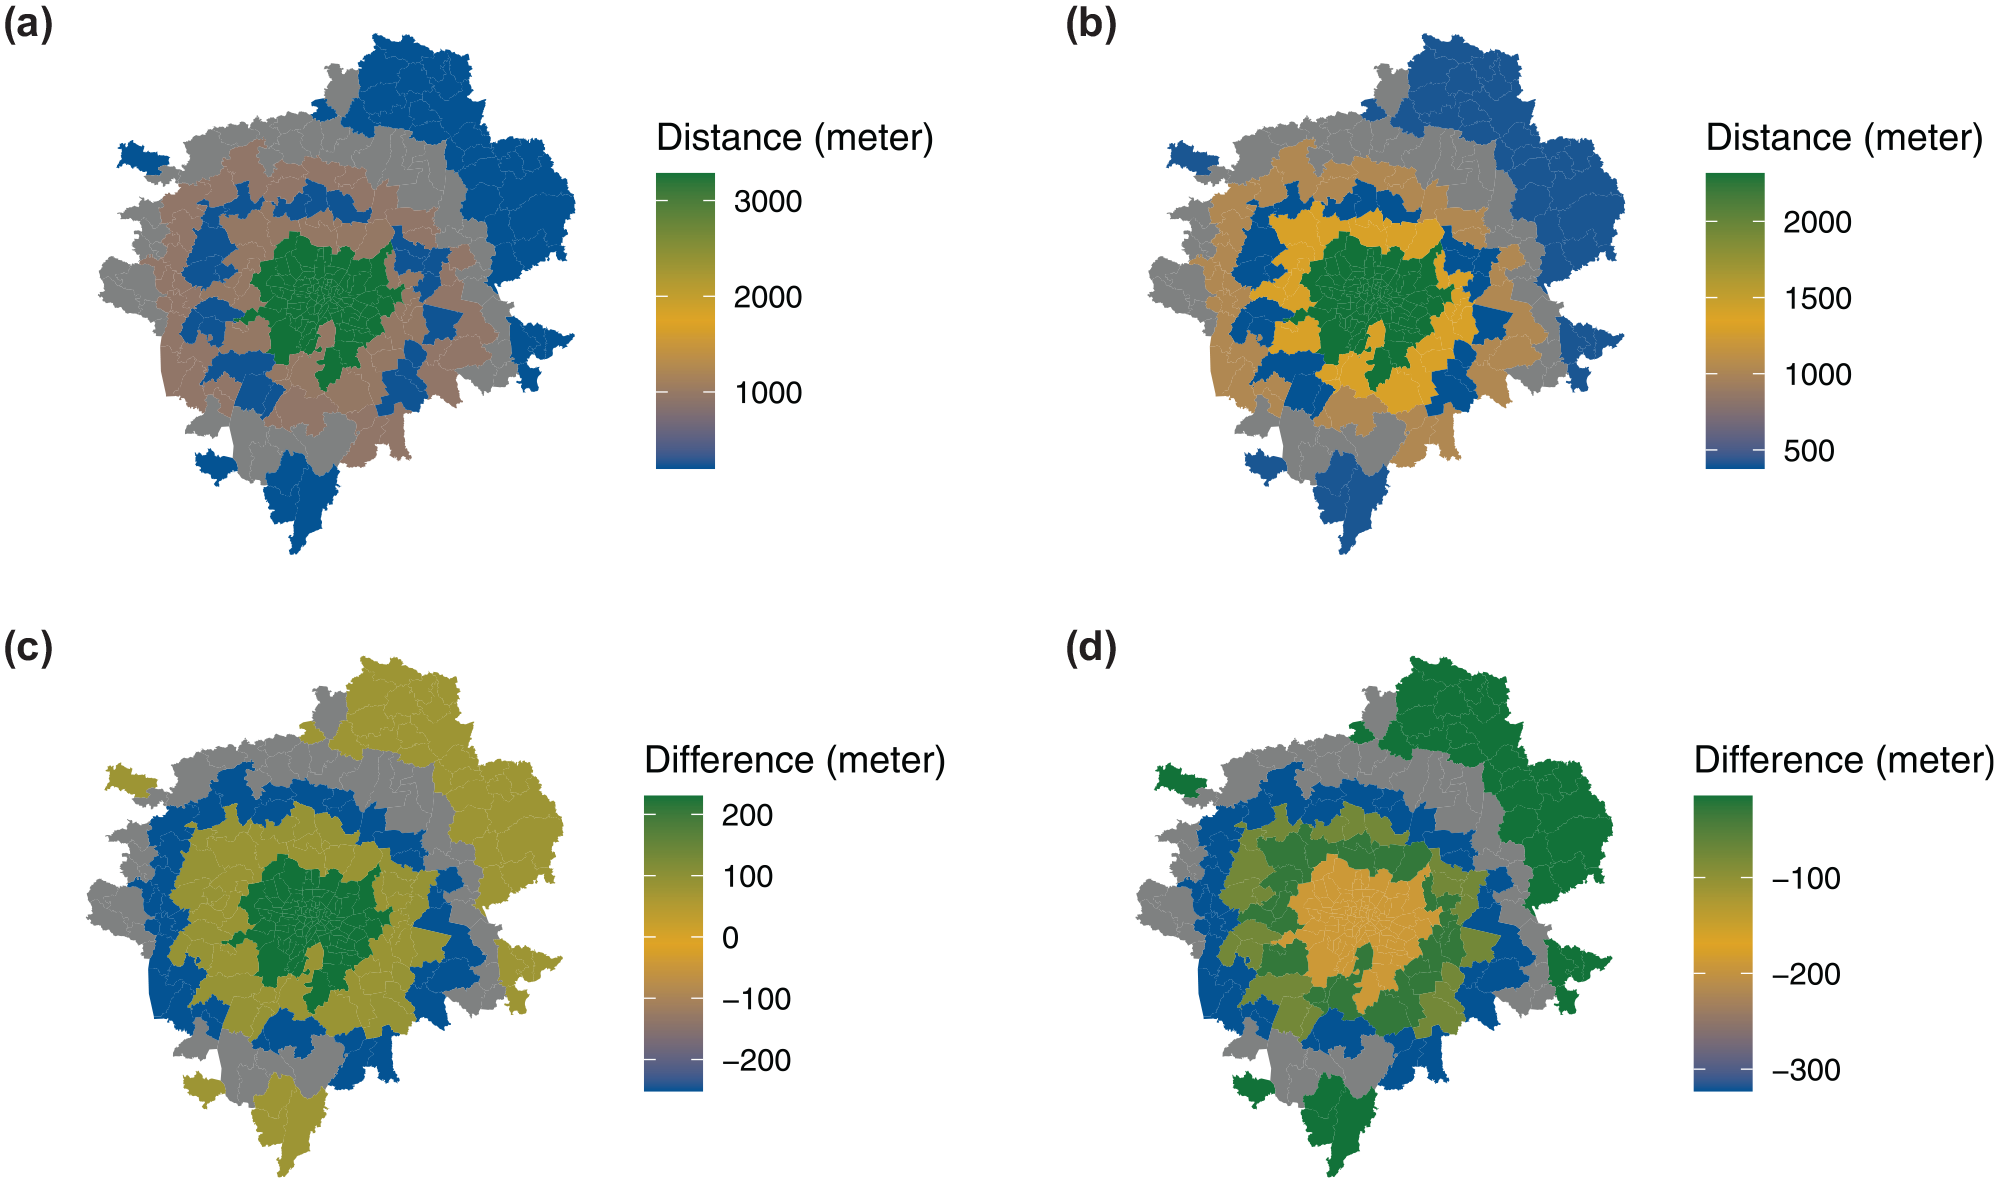
The analysis of GCT and savings of Figure 3 confirmed our hypotheses. Firstly, people with the D-Ticket, on average, had higher transport costs than those without. This held true for PT expenses, car expenses, and GCT. Secondly, GCT for nonowners increased for every month except December, and, surprisingly, PT expenses without the D-Ticket increased in every month of 2023 compared with the same month in 2022. Both groups spent more time traveling, as can be deduced from the GCT savings being consistently lower than the sum of the car and PT savings, except for December. Holders saved money on PT even when they would have spent more under the old pricing regime, as evident in October and November, indicating that they had made more or more expensive trips since the introduction of the D-Ticket. Holders had traveled less distance by car since its introduction, resulting in average monthly savings on car trips of more than €47 per person. On average, people saved roughly €58 with the D-Ticket in combined PT and car expenses, which by far outweighs the €19 subsidy per person. However, the savings differed starkly between fare zones, as depicted in Figure 2. The GCT includes time spending, whereas the monthly savings in Figure 2 only refers to monetary spending on car and PT or PT ticket prices, respectively. The highest monetary monthly savings per person were accumulated across Fare Zones 3 and 5, reaching more than €153 in Zone 3. Holders living in Zone 1 had no savings in GCT, spending €17 more on average than before the D-Ticket was introduced. People living in Zone M saved €62 per person and month on average if they had the D-Ticket. Notably, the highest savings were realized through reduced car travel costs: savings on PT averaged between €0.60 in Zone 1 and €27 in Zone 5. It is also striking that even in the group of D-Ticket holders, the minimum PT expenses would have been lower than €49 on average, indicating that some customers would have been better off without the D-Ticket. However, all costs and savings were calculated only for the MVV region, representing everyday mobility. Additional trips outside the fare association would increase the total spending and potentially the savings realized through the D-Ticket. Those without a D-Ticket consistently spent more on PT tickets, car travel, and GCT in 2023 than in 2022.
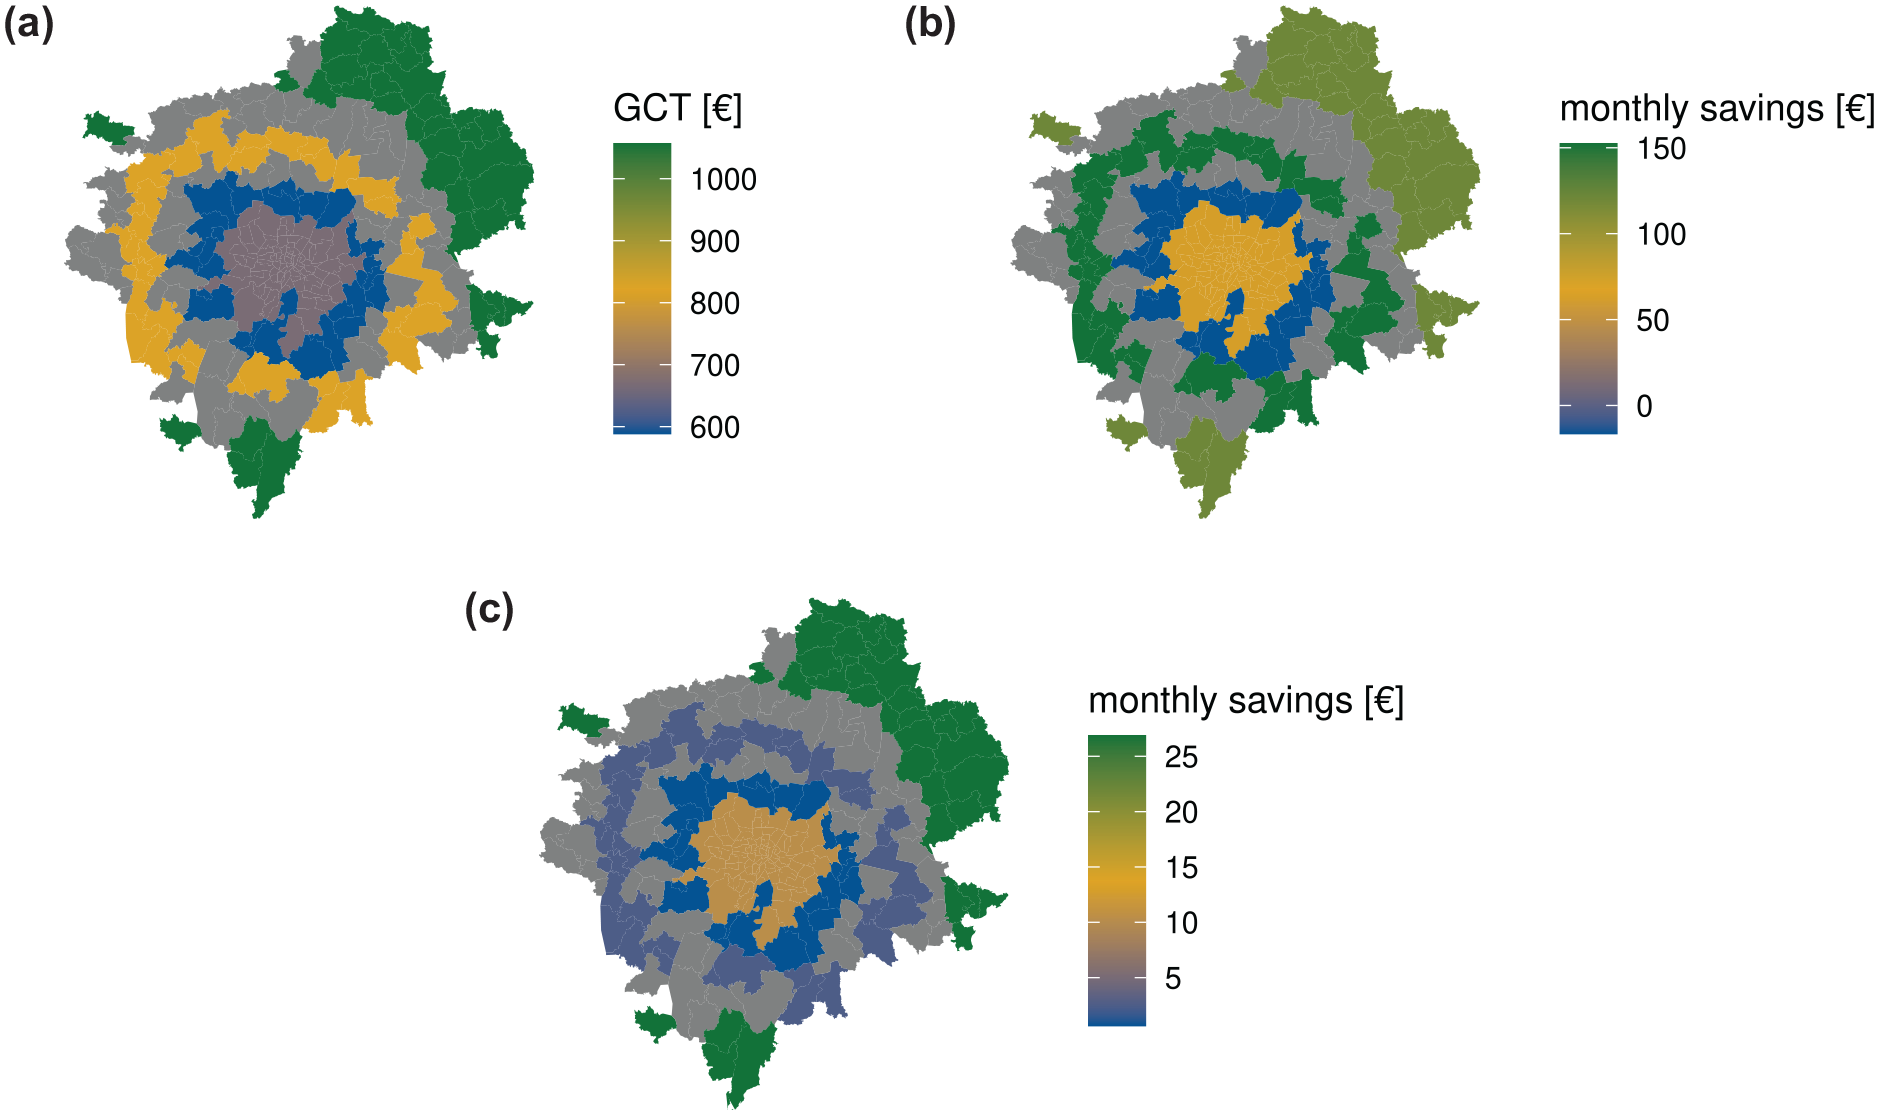
D-Ticket holders benefit from reduced generalized cost of travel (GCT), but savings differ between fare zones: (a) GCT in 2022, (b) monetary savings per month, and (c) public transport (PT) savings per month.
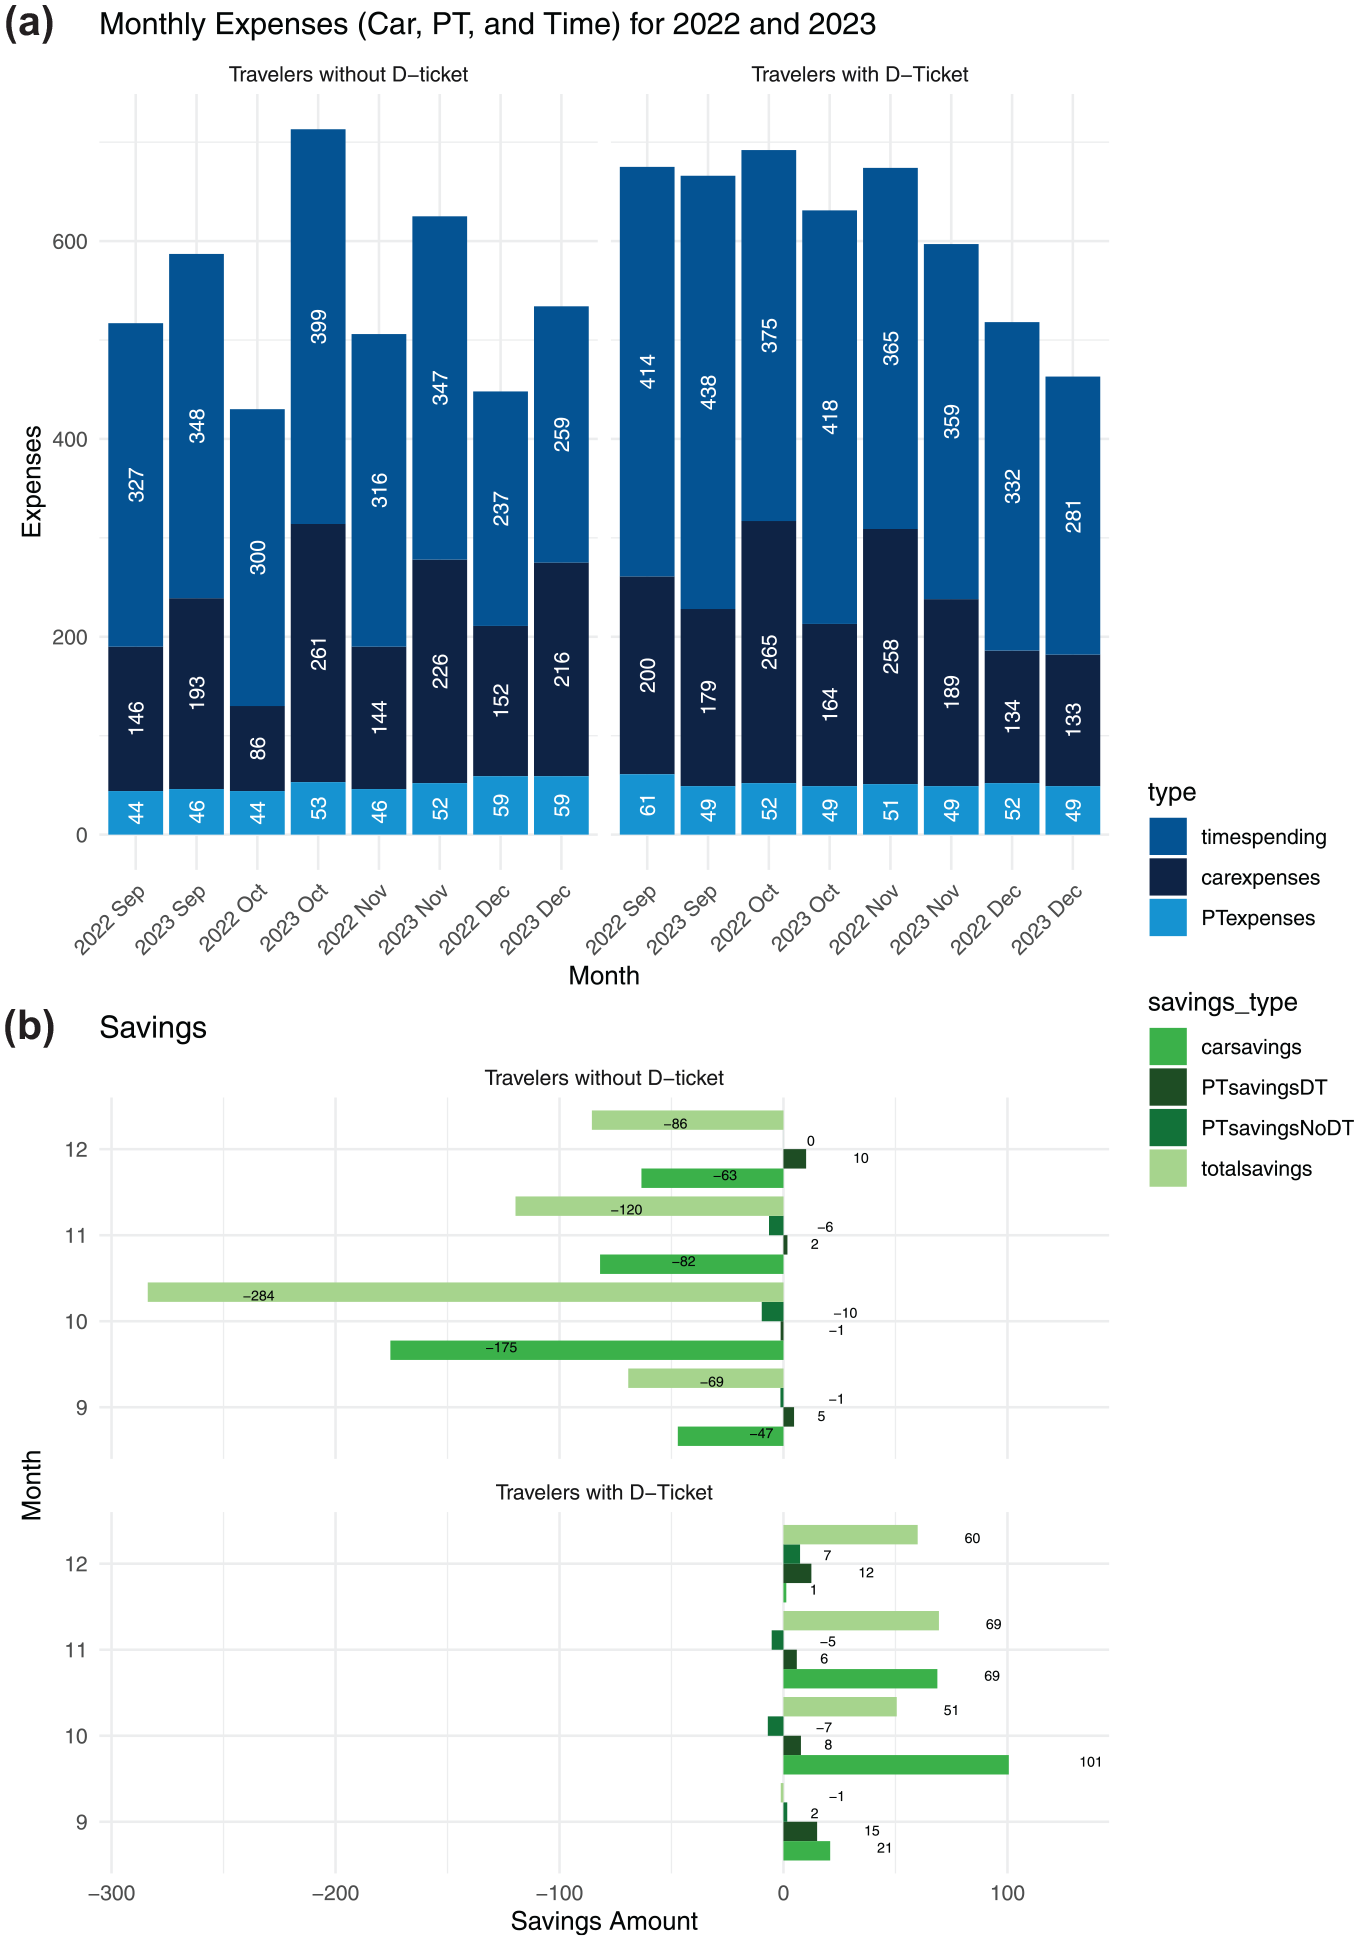
Spending and savings (euros) comparing 2023 and 2023 for public transport (PT), car, and time. Positive savings indicate lower spending in 2023 than in 2022: (a) expenditure considering €49 for all D-Ticket customers, and (b) savings considering minimum spending based on realized trips.
The data revealed an average monthly spend on mobility, excluding time values, of about €293 per person before the introduction of the D-Ticket and €234 after the introduction. This is considerably higher than previous findings from 2021 ( 78 ); this result might have been caused by high inflation in 2022, as well as the high price levels found in Munich, and a high proportion of high-income households in the data ( 43 ).
D-Ticket Ownership Causes Opposing Trends in the Distance Per Weekday and Fare Zone
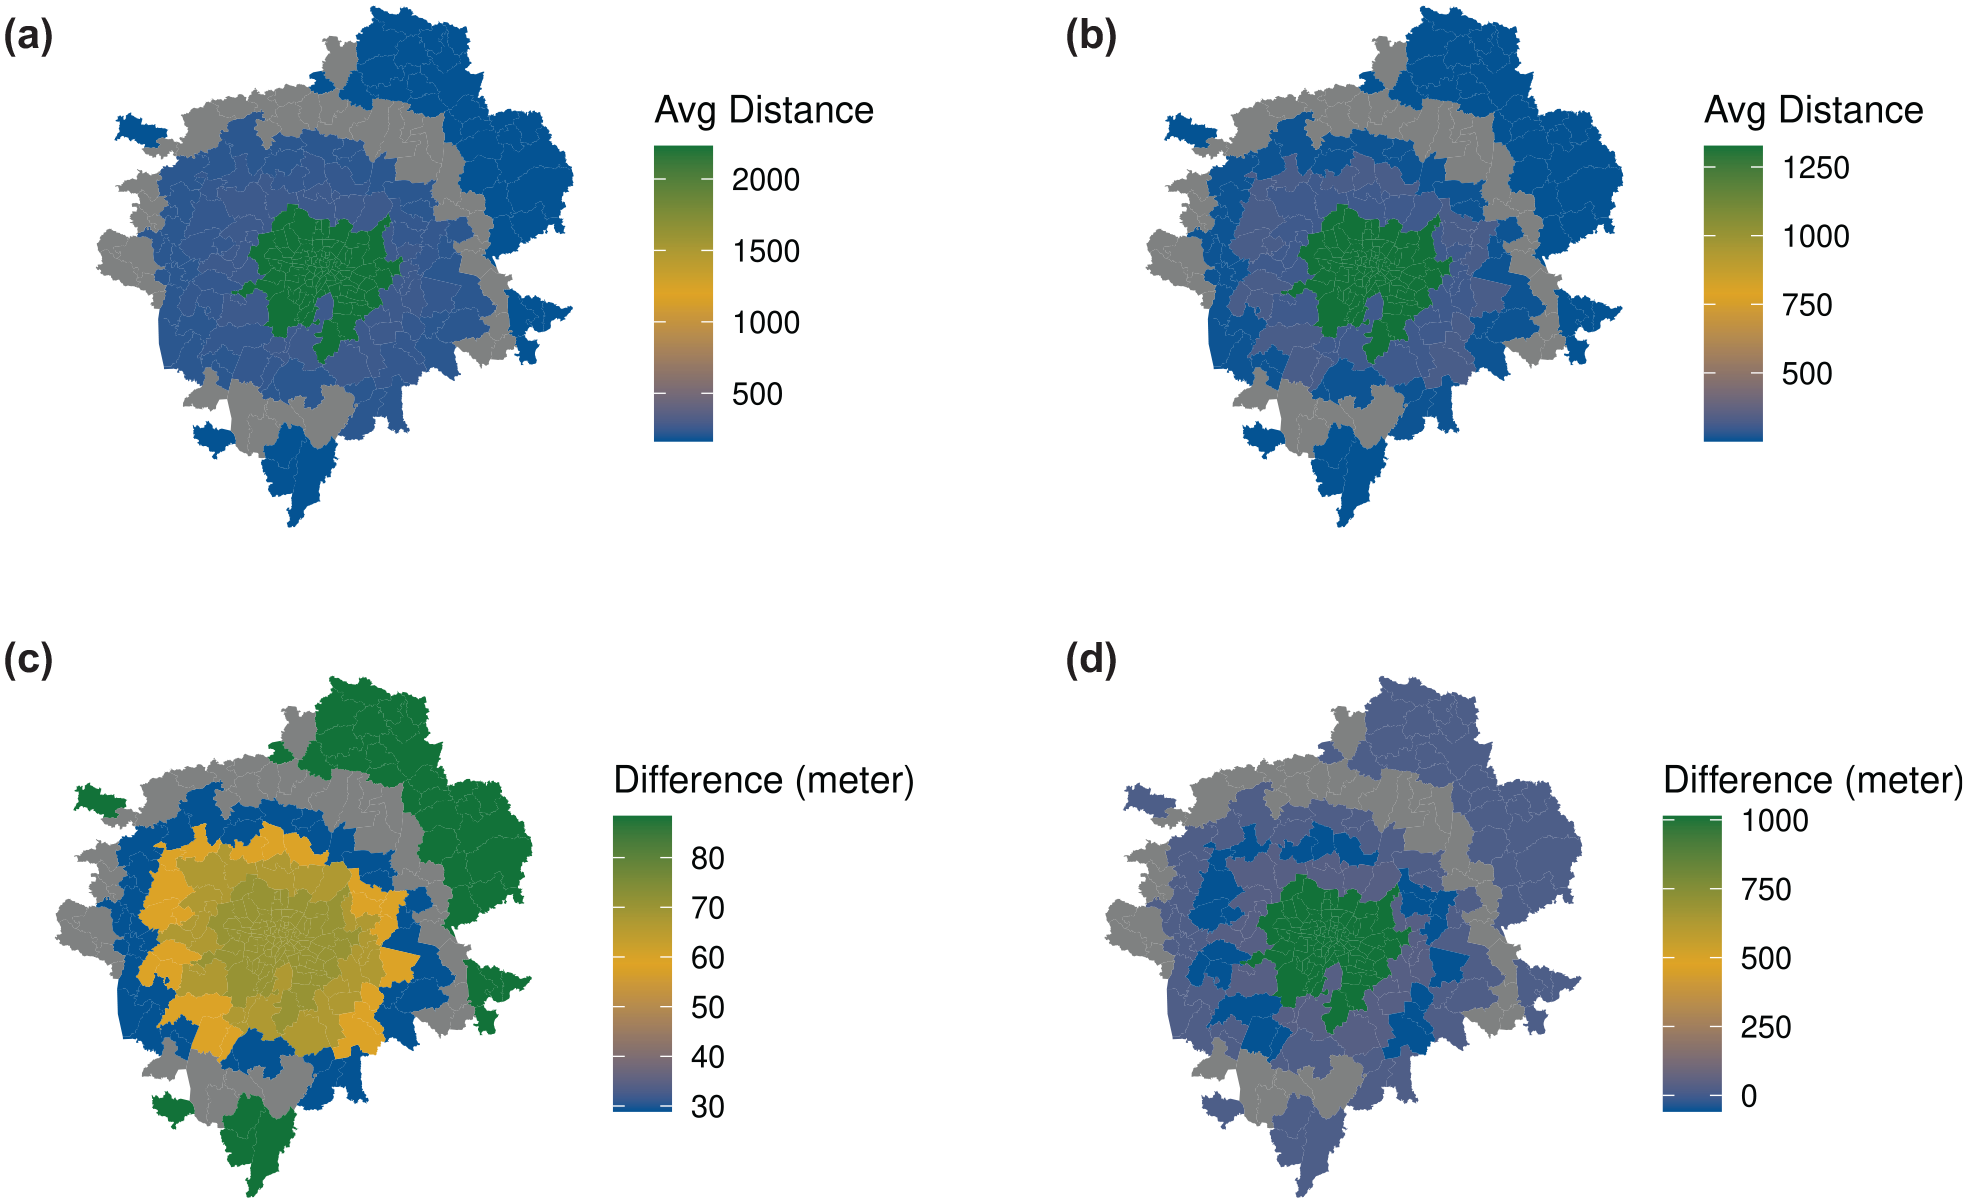
The effects of the D-Ticket on the distance traveled by car or PT were straightforward, as visualized in Figures 4 and 5. People who owned the D-Ticket traveled less by car and more by PT, with the highest increase in PT travel in the city center and the most substantial decrease in car travel in the suburbs (Zones 1, 2, and 3). The exact opposite effect can be observed for people who did not own the D-Ticket: they traveled more by car and the distance by PT remained unchanged, and car travel increased most in the city center.
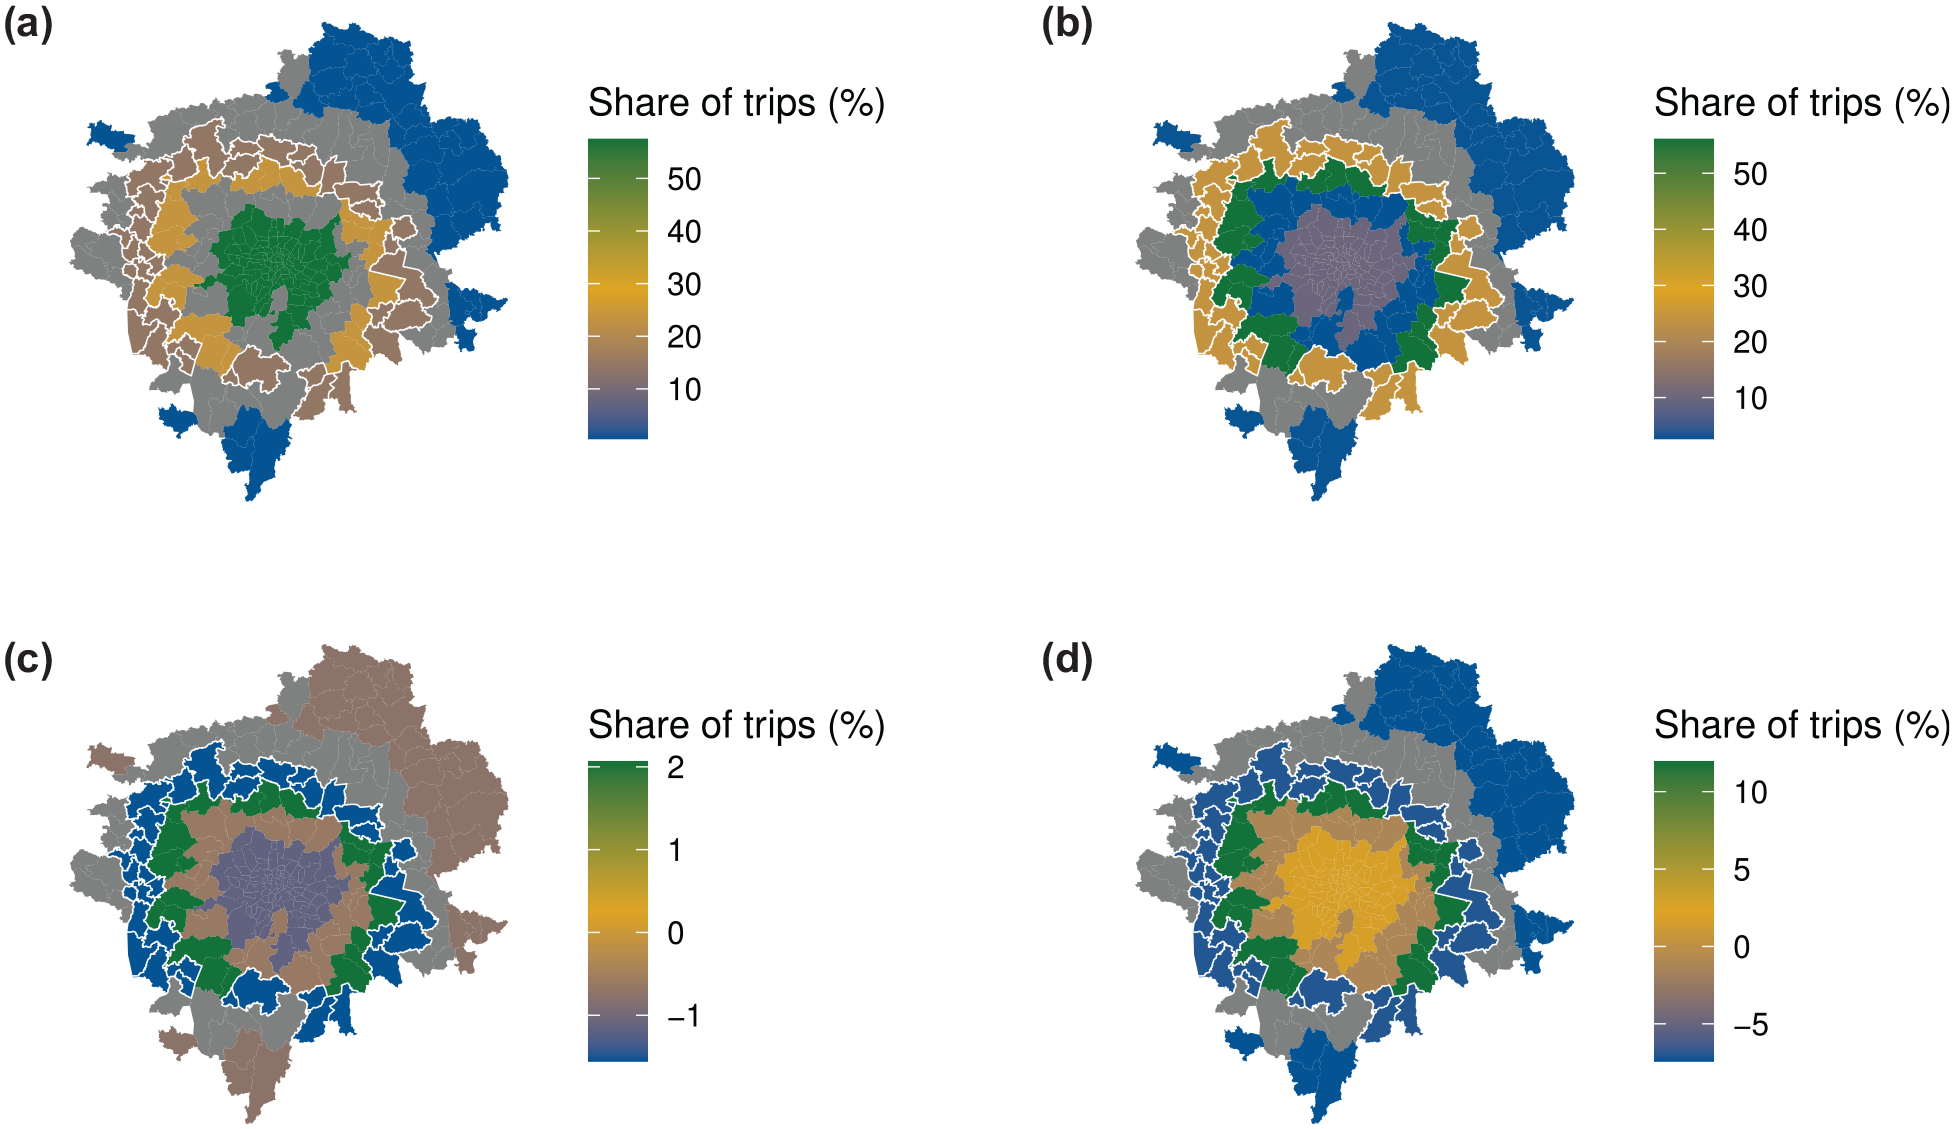
Distance per fare zone in 2022 and changes comparing 2023 to 2022. Respondents with a D-Ticket increased public transport (PT) travel in the city center and decreased car travel: (a) average PT distance 2022, (b) average car distance 2022, (c) difference in PT distance 2022 versus 2023, (d) difference in car distance 2022 versus 2023.
Distance per fare zone in 2022 and changes comparing 2023 to 2022. Respondents without a D-Ticket increased car travel and decreased public transport PT travel in the city center: (a) average PT distance (in meters) in 2022, no D-Ticket; (b) average car distance (in meters) in 2022, no D-Ticket; (c) difference in PT distance, no D-Ticket; and (d) difference in car distance, no D-Ticket.
Owning the D-Ticket Increases Accessibility in the Suburbs
The time spent on leisure activities varied between the period before and after the introduction of the D-Ticket, with a higher variance among those without a D-Ticket. Figure 6 illustrates that ticket holders increased their time in the city center by 1 to 2 min per person and day on weekends and by 4 min in Fare Zone 3 per person and day on weekends. Leisure time on workdays increased only slightly in the suburbs and remained constant in the city center. People without the D-Ticket increased time spent in Zone 5 by 4 min per person and day while slightly decreasing the time spent in the city center, especially on weekends. This partially contradicted our hypothesis that the D-Ticket would motivate ticket holders to spend more leisure time in the more distant fare zones, and indicates a need for further research into the causalities behind this observation. The D-Ticket apparently increased accessibility in the suburbs rather than the distant surroundings. However, the differences between holders and nonowners of the D-Ticket aligned with the hypothesis that the fare innovation would increase activity time in the city center on workdays, suggesting that external effects shifted activity times overall between 2022 and 2023. As Figure 7 indicates, people who owned the D-Ticket and lived in one of the intermediate zones—Fare Zones 1, 2, or 3—spent more time at home than before the introduction, rejecting our second hypothesis relating to time spent on activities. The same effect was not observed for people living in the most central or distant fare zones, nor for people who did not own the D-Ticket; those with a home in the central zone showed the highest increase in time spent at home.
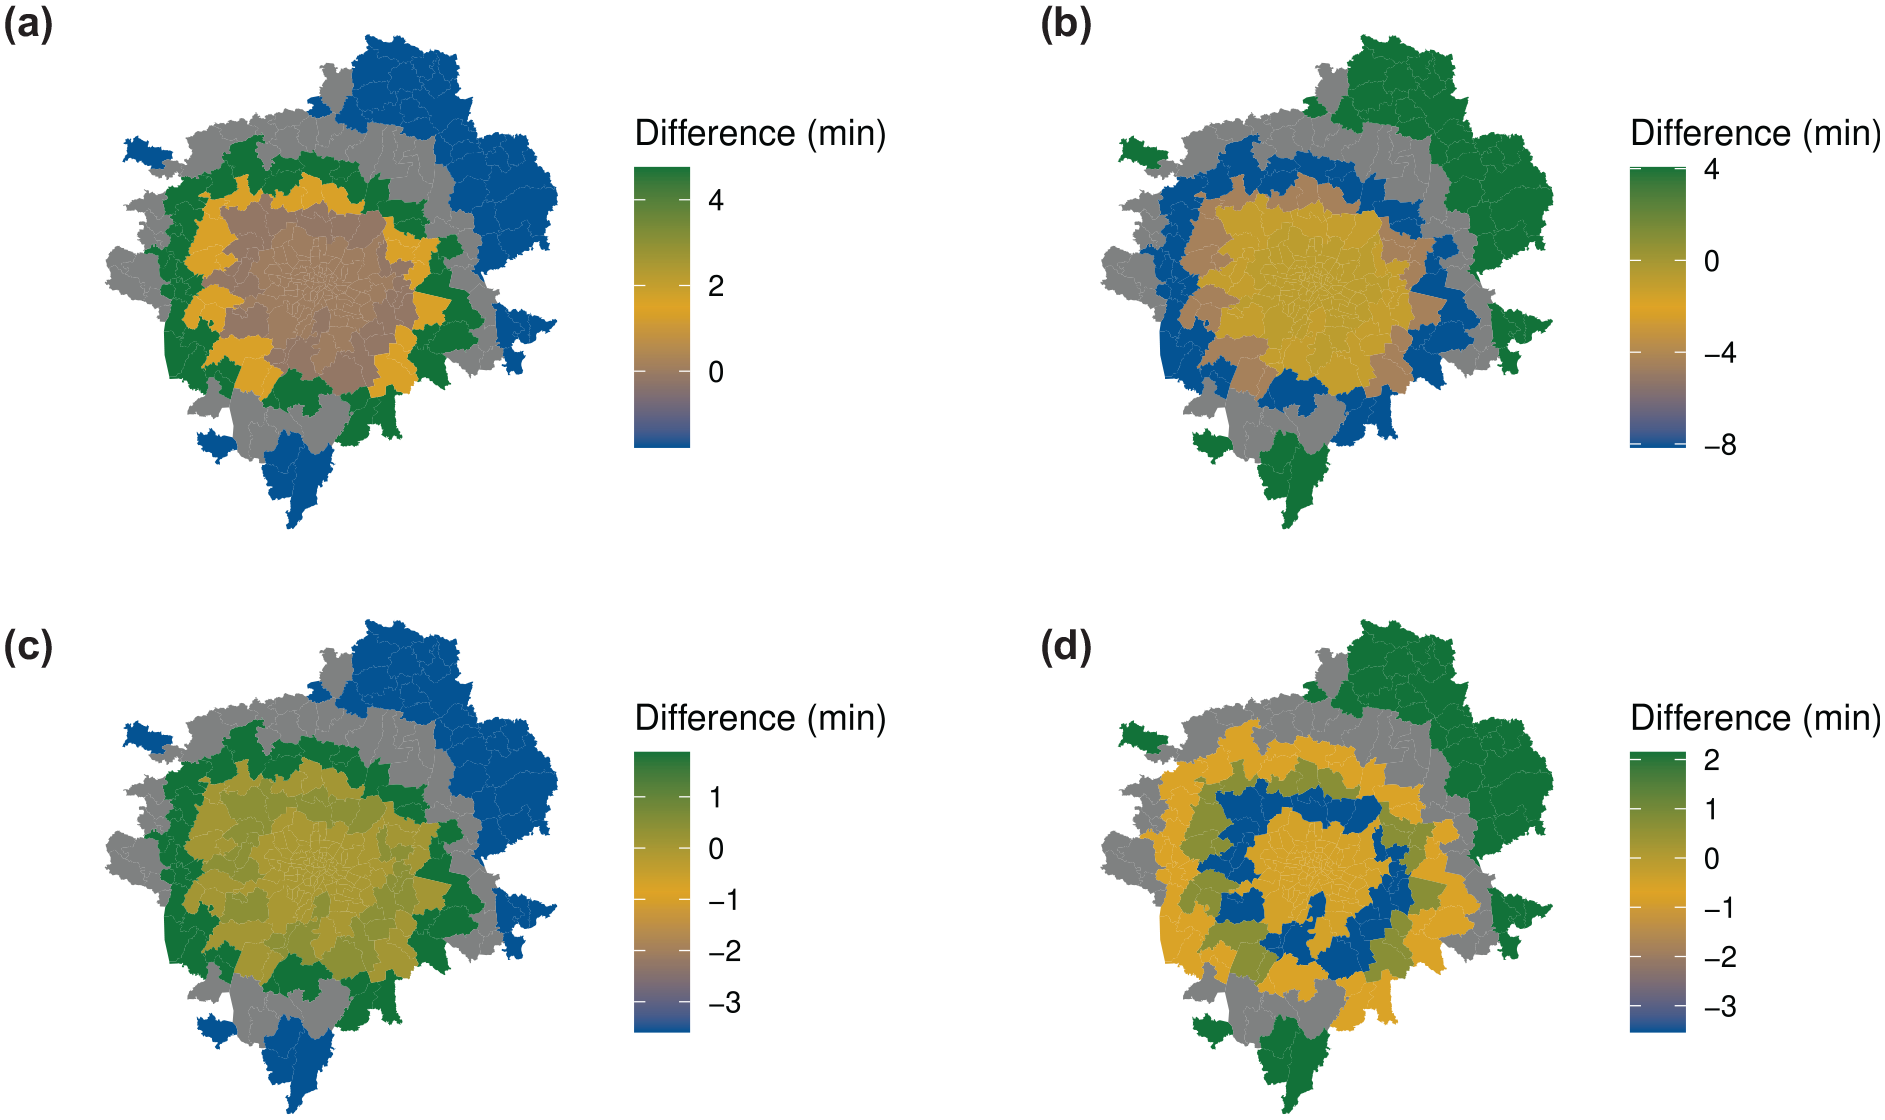
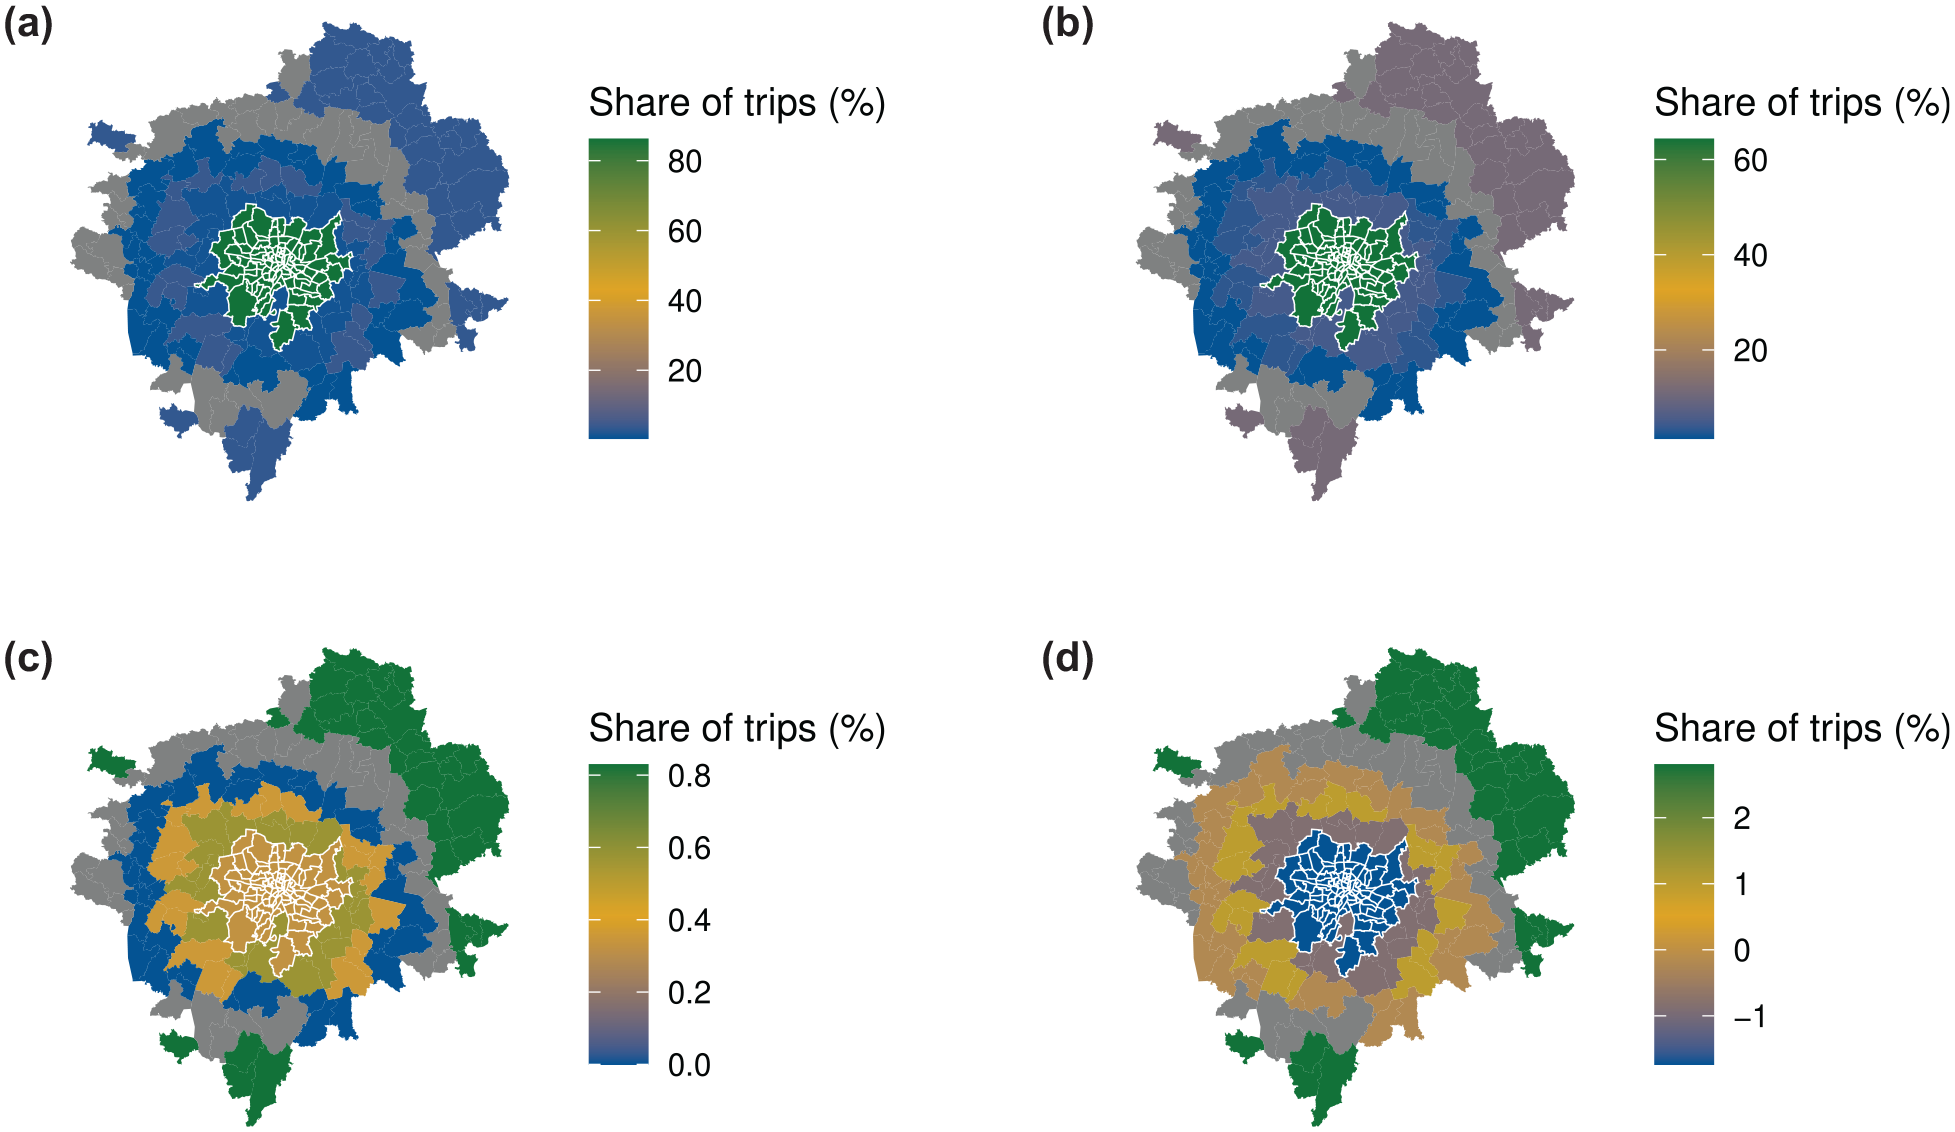
Average time spent on leisure in each zone: ticket holders spend more leisure time in the suburbs, nonowners spend more time outside the city. (a) Holders of the D-Ticket on weekends; (b) nonowners of the D-Ticket on weekends; (c) holders of the D-Ticket on workdays; and (d) nonowners of the D-Ticket on workdays.
Average time spent at home in each zone: ticket holders in the suburbs spend more time at home. (a) Holders of the D-Ticket on weekends; (b) nonowners of the D-Ticket on weekends; (c) holders of the D-Ticket on workdays; and (d) nonowners of the D-Ticket on workdays.
Two potential causes may underlie our findings on leisure time. Firstly, distant locations for leisure activities could be less accessible by PT compared with the car, even with reduced ticket expenses. Therefore, people might prefer to take the car instead of PT to reach these destinations. Secondly, those who travel to more distant leisure destinations could be better off with occasional single or day tickets than with the D-Ticket; the new ticket might predominantly appeal to regular commuters rather than occasional leisure travelers. Either way, the fare innovation seems to render the suburbs more attractive for leisure activities compared with more distant areas and the city center.
With regard to time spent at home, three possible explanations support the findings: firstly, the decreased cost of travel might render trip chaining less necessary and thus increase the number of short stays at home during the day. This would especially apply to people making short but expensive trips from the city center to the suburbs, which might explain the increase in ticket holders in the suburbs. Secondly, the savings from the D-Ticket might be outweighed by inflation and the increased cost of living, hindering people in spending time and money on leisure activities outside the home. Thirdly, the summer of 2022 marked the end of most COVID-19 restrictions in Germany; many people might have been motivated to spend more time outside the home than usual, and the results showed that activity time reverted to more time spent at home. The same reasoning could be valid for an increase in time working from home. A potentially contradictory explanation would be that people spend more time on travel with the D-Ticket and thus have less time to spend outside the home. More research is necessary to clarify the causality behind our findings.
The results suggest that the D-Ticket increased flexibility, especially for people living in the suburbs, allowing more trips to and from home instead of long trip chains. Further studies could verify this finding by analyzing the number of trips and trip chains for people living in different fare zones. Activity time quantifies the accessibility of an area for specific activities during workdays and weekends, respectively. The data could be divided by zones of residence to identify disparities; however, this would go beyond the scope of this study. The results are relevant for spatial equity and dynamic accessibility considerations. Urban and traffic planners may need to consider new activity and travel patterns for specific areas.
Travel Directions Change in an Unclear Manner
Travel directions varied across modes of transport, fare zone of residence, and before and after the introduction of the D-Ticket. Overall, for each fare zone of residence, it was evident that most PT trips ended in Zone M, followed by the residence zone. All other zones accounted for less than 5% of all PT trips. The distribution of car trips was more diverse: over 60% of trips by people living in Zones M and 2 were directed toward Zone M. People in Zones 1, 3, and 5 had a more diverse distribution, with people in Zone 5 directing more than of trips 50% to Zone 5.
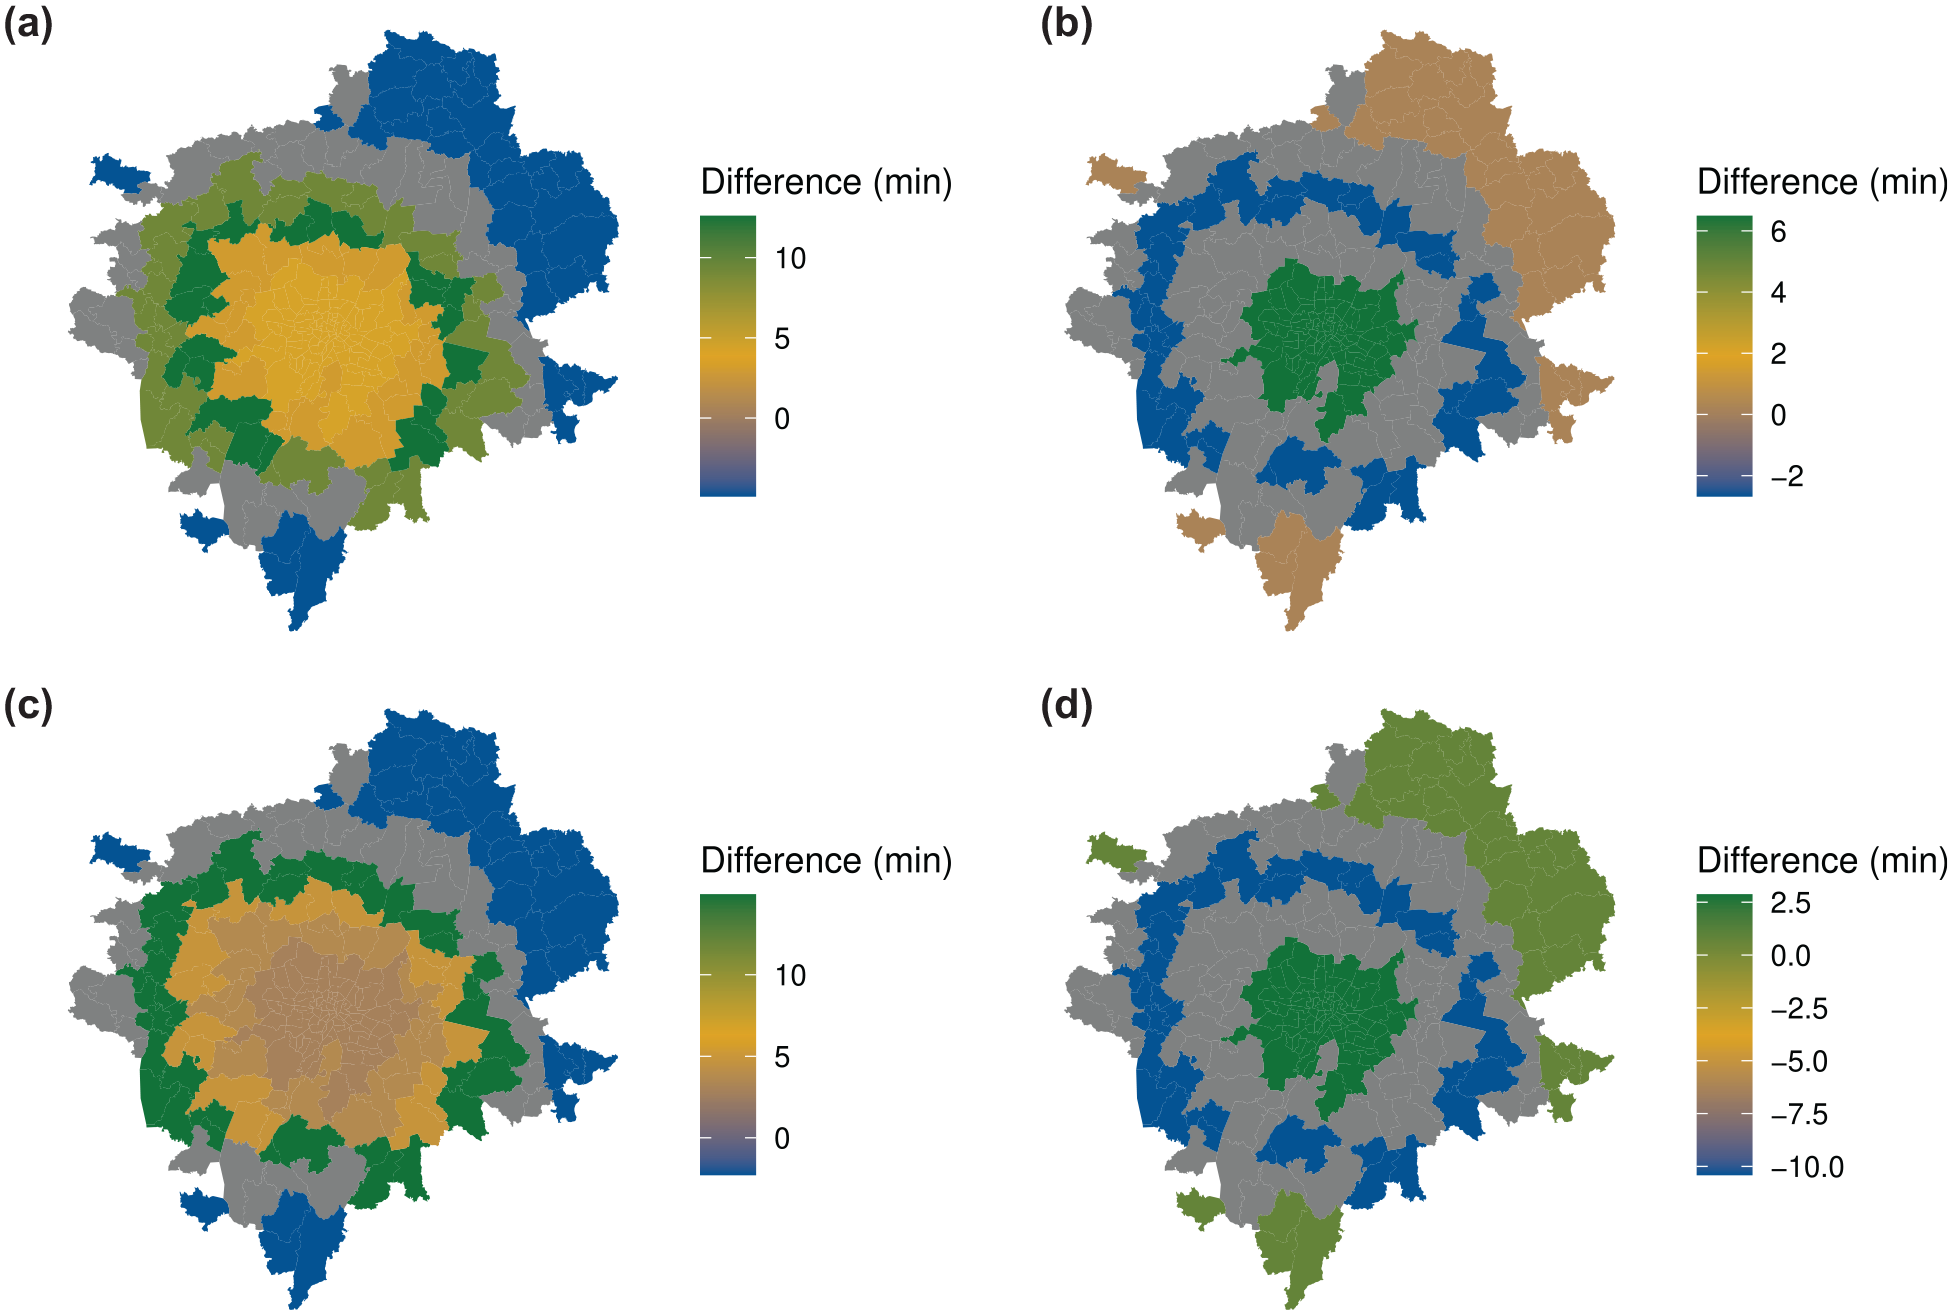
Almost no PT trips were made to fare zones further outside of the city: this remained true even after the introduction of the D-Ticket. Contrary to our hypothesis, there was no clear pattern of change in travel directions after the introduction. Whereas people in Zone M changed directions by less than 1.5% and made more trips to Zone M, people from Zone 3 made 2% fewer trips to Zone M and 4% more trips to Zone 3. The findings are represented by Figures 8 and 9.
Distribution of trip destinations for people living in Fare Zone 3 (highlighted white): (a) public transport (PT) trips in 2022, Residence Zone 3 (share of all trips by PT); (b) car trips in 2022, Residence Zone 3 (share of all trips by car); (c) PT trips in 2023, Residence Zone 3 (change in share of all trips by PT); and (d) car trips in 2023, Residence Zone 3 (change in share of all trips by car).
Distribution of trip destinations for people living in Fare Zone M (highlighted white): (a) public transport (PT) trips in 2022, Residence Zone M (share of all trips by PT); (b) car trips in 2022, Residence Zone M (share of all trips by car); (c) PT trips in 2023, Residence Zone M (change in share of all trips by PT); and (d) car trips in 2023, Residence Zone M (change in share of all trips by car).
Discussion
The D-Ticket revolutionized German PT fare policies and sparked a wave of research on its impacts and justifications; however, both the extent of its various effects and the continuation of the ticket are uncertain. Despite several studies addressing individuals’ position in time and space separately ( 1 , 5 , 47 ), combining both dimensions is considered a promising research avenue ( 30 ). We addressed this gap with four novel indicators, drawing on the detailed information on the Munich metropolitan region provided by the 20-month semipassive tracking panel, Mobilität.Leben. In the following, we discuss the positioning of the novel indicators, the limitations of our study, and areas for future research.
Positioning of the Novel Indicators
The presented methodology based on four novel indicators enriches the methodological toolbox for PT fare innovation assessment. As highlighted above, neither studies using established indicators (see Table 1) nor those applying innovative indicators (Table 2) had integrated spatial and temporal dimensions of travel. Previous studies, therefore, had not fully exploited the potential of novel data collection technologies. This study proposed closing this gap to better understand the temporal and spatial distributions of changes in travel behavior and the financial impacts of PT fare innovations.
Limitations
The authors acknowledge the study had limitations—mostly owing to the novelty of the indicators—which were not considered during data collection. Firstly, this resulted in incomplete data and an uneven spatial distribution of observations. Responses for Zone 4 were particularly sparse. Future studies should employ more representative data and engage with respondents who are more spatially distributed. Secondly, car travel expenses were estimated using average costs per kilometer, giving an under-complex estimate for actual monthly expenses. By collecting data on the car model, these estimates could be optimized. Thirdly, our calculation of PT costs did not reflect whether the user purchased the optimal ticket, rather, it estimated optimal costs based on realized trips. In future, details about the specific tickets purchased should be noted to increase the precision of the actual cost. Although the minimal cost considered in our study would not have differed, higher precision would benefit calculation of the VTTS and the monetary value attributed to the flexibility and ease of seasonal ticket use. Fourthly, not every trip in our data had a (correctly) assigned trip purpose, limiting the validity of activity time results. Although the technology to correctly detect trip purposes improved, respondents could be incentivized to correct trip purposes in the smartphone app.
Areas for Future Research
Further research could delve deeper into the spatial and temporal dimensions of travel behavior provided by the novel indicators and the associated equity considerations. An interesting next step would be an analysis of external travel costs ( 51 ) based on revealed travel data at a high spatial and temporal resolution. Another intriguing approach would be to exploit the sociodemographic dimension of the data and examine equity across gender or income. Beyond accessibility and equity, the indicators could be used to better estimate transport parameters. This paper is the first to quantify the monetary impact of a major fare innovation in a fare association based on multimonth smartphone-based tracking data. The results could be used to derive more precise estimates of travel demand and the value of travel time. We have already incorporated these indicators into the study design of ongoing and future projects. The data will also allow us to increase the precision of policy appraisal values, such as VTTS and demand elasticities ( 77 , 79 ).
Conclusions
This paper explored how the D-Ticket changed the spatial and temporal dimensions of everyday mobility by proposing four novel indicators based on GPS trajectories: (a) GCT in fare associations, (b) travel distance per weekday and fare zone, (c) activity time per fare zone, and (d) travel direction per mode and zone of residence. The analysis is based on the Mobilität.Leben panel, considering 92,218 trips by 176 unique respondents between September and December in the years 2022 and 2023.
Monetary savings from the D-Ticket by far exceeded the subsidy per person, averaging almost €72 for ticket holders compared with a cost increase of €100 among nonowners. This extreme increase was presumably caused by the very low costs experienced in October 2022 and should be verified with a more representative sample. The subsidy was thus highly cost-effective in reducing the financial burden of the previous years with high inflation ( 45 , 58 ). The savings also outweighed the loss on additional travel time, which had already been identified in previous studies ( 20 , 42 ). Expenditure and savings were spatially diverse, with people in the most distant zones realizing the highest benefit; the indicators thus allowed further differentiation of who gains how much from the fare innovation ( 58 ). Even excluding any travel beyond the borders of the fare association MVV, many people without the D-Ticket would have financially benefited from buying one, verifying previous findings ( 20 , 42 , 43 ). Some of the people who own the D-Ticket would have spent less than €49 on everyday mobility in the respective month with another ticket. However, potential travel beyond MVV territory could still render the ticket worthwhile. In the context of an announced price increase for the D-Ticket to €58 in 2025 ( 80 ), detailed insights into the individual travel costs indicate which travelers would still benefit from or lose, and by how much, for specific prices, based on previous and current travel behavior ( 64 ).
Travel distance has increased for PT and decreased for cars among holders of the D-Ticket since the ticket was introduced; travel distances with PT increased overall, especially throughout the city center, whereas car distance was predominantly reduced in the suburbs. The opposite was found for nonowners, traveling more by car and in the city center and less on PT.
Activity time at home increased for ticket holders in the suburbs with the fare innovation. Furthermore, the D-Ticket has made the city center more accessible for ticket holders' leisure pursuits at the weekend and the suburbs more accessible during workdays. More distant destinations around Munich have experienced an even more substantial increase among nonowners since D-Ticket introduction. These results add a spatial dimension to previous findings on changing activity patterns ( 24 ) and trip purposes following PT fare innovations ( 20 , 47 ). The findings enrich spatial considerations of equity and accessibility by comparing the impact of fare innovations across fare zones or areas of residence ( 63 , 64 ), as well as for times of the week, hinting at the dynamic component of accessibility ( 70 ). Addressing activity time at different locations, the primary reason for travel ( 32 ), in the assessment of fare innovation or, in fact, mobility policy interventions in general, is long overdue.
Our study found that the direction of PT trips by people who own a D-Ticket was overwhelmingly to Zone M or their residence zone. Car trips were more widely distributed and less focused on the city center. Despite abolishing fare zones for its holders, the new ticket did not systematically change travel directions. With increasing trip numbers ( 20 , 42 , 43 ) and constant trip shares, the total number of trips across fare zones also increased with the D-Ticket. However, the effects were marginal and will need further verification in future studies. Travel direction adds a new level of analysis that is especially important in European PT fare structures organized in fare associations. This indicator could be adapted for geographical travel directions. Especially for innovative fare structure approaches such as Homezone ( 40 ) or in the context of MaaS ( 26 , 27 ), empirical data on the geographic area of travel provide valuable insights.
Overall, the D-Ticket makes the suburbs more accessible by PT. Financially, the gains increase with distance from the city center and outweigh governmental subsidies per person. The ticket motivates holders to shift from car to PT, especially in the city center, increasing sustainability ( 5 , 81 ). The presented results underscore the importance of an integrated perspective on otherwise separately addressed issues of spatial and temporal dimensions of travel ( 67 ). The impact of PT fare innovations varies across fare zones, weekdays, and times of year.
In conclusion, the four novel indicators generated crucial insights into the impact of the D-Ticket on people living in areas of differing centrality, and successfully contributed to the methodology for PT fare innovation assessment; in particular, complex fare structures like fare associations can be precisely analyzed. The indicators provide relevant insights for researchers, planners, and policy makers in relation to budget constraints and the United Nations Sustainable Development Goals ( 10 ) on accessibility, sustainability, and equity.
Footnotes
Acknowledgements
The authors thank the TUM Think Tank at the Munich School of Politics and Public Policy for its support. GPT-4 assisted in debugging the R code, creating LaTeX tables, and making language edits.
Authors Contributions
The authors confirm contribution to the paper as follows: study conception and design: M. Schlett; data collection: A. Loder; analysis and interpretation of results: M. Schlett; draft manuscript preparation: M. Schlett. All authors reviewed the results and approved the final version of the manuscript.
Declaration of Conflicting Interests
The authors declared no potential conflicts of interest with respect to the research, authorship, and/or publication of this article.
Funding
The authors disclosed receipt of the following financial support for the research, authorship, and/or publication of this article: This research was supported by TUM Think Tank.